Globally Estimating the Population Characteristics of Small Geographic Areas. Tom Fitzwater
|
|
|
- Whitney Johnston
- 5 years ago
- Views:
Transcription
1 Globally Estimating the Population Characteristics of Small Geographic Areas Tom Fitzwater U.S. Census Bureau Population Division
2 What we know 2
3 Where do people live? Difficult to measure and quantify. Characteristics: Age and sex distribution, poverty, literacy, access to services, etc. Measuring at many scales: Country Region City Neighborhood Person Data users want answers at every scale. 3
4 Regional population change Projected population change: 2016 to 2050 Source: U.S. Census Bureau, International Data Base, August 2016 update. ation/international/data/idb/r egion.php?n=%20results%20 &T=6&A=aggregate&RT=0&Y =2016,2050&R=110,120,130, 140,150,160&C= 4
5 Projected population change by country Source: U.S. Census Bureau, International Data Base, August 2016 update. 5

6 Population distribution Source: U.S. Census Bureau, subnational population estimates,
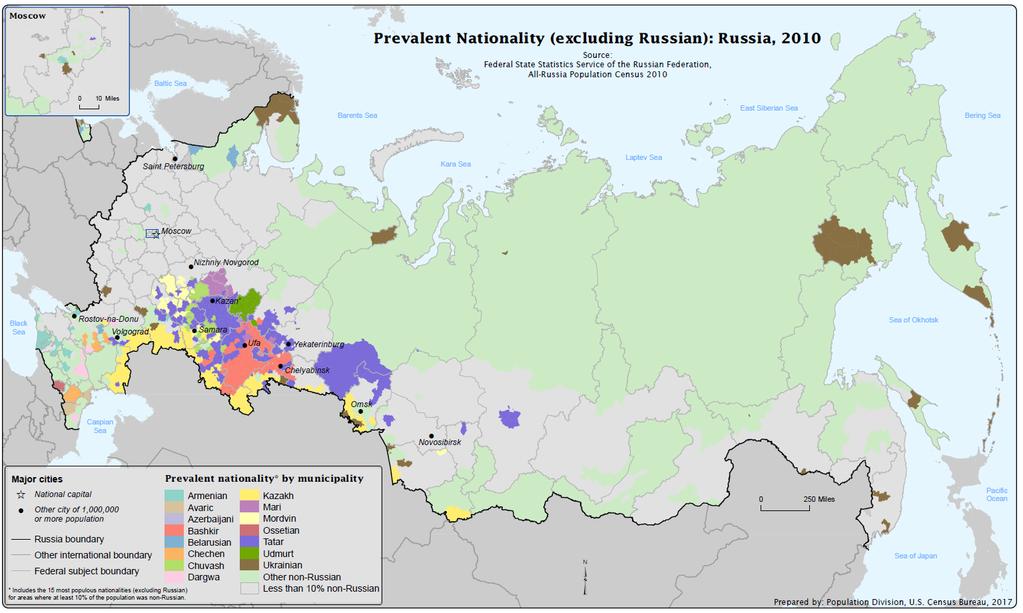
7 7
8 Our methods 8


9 International Projects Applied research and analysis: International population estimates and projections HIV/AIDS research tools Global aging issues Geospatial products: Subnational population estimates Gridded products (e.g., Demobase) 9
10 What we produce Use multiple inputs for guidance, including censuses and surveys. Estimates and projections: Evaluate and separately estimate base population, fertility, mortality, and international migration for each country. Analyze and project trends in above variables which change rates and age/sex composition over time. Additional indicators Censuses Infrequent Detailed geography Surveys More frequent Less detailed geography More characteristics Geospatial Administrative boundaries Statistical boundaries How many? Where? 10
11 Common census and survey variables No country releases individual records, except in the form of sanitized public microdata. All censuses have total population, age, and sex variables. Other variables differ among countries. Personal: ethnicity, language, health, fertility, mortality Family: marital status, household size Migration: birthplace, citizenship Education: literacy, level of education Work: employment, job categories Economic: income, poverty Housing: wall/roof materials, building age Land use: urban/rural, agriculture Access to services: water, electricity, transport, communications 11
12 How we evaluate data In our products, we account for census inaccuracies or unexpected events, such as: Systematic undercounting of women and children. Major events, such as disasters, war, disease. Unexplained or unlikely population growth. Differential coverage between censuses. Discrepancies in age reporting, such as age heaping. Problems reported in a post-census survey. These considerations are critical to ensure proper analysis of a country s population characteristics. 12
13 Studying change over time within a country Comparability: Even if an indicator is present in 2 censuses/surveys, we do not assume they are directly comparable. Methods, definitions, or wording of the question may have changed, rendering comparisons misleading. Evolving geography: Some countries redraw boundaries frequently. We match census or survey data to available geographic boundaries. 13
14 Comparing data between countries Working across borders is a significant challenge. From a geospatial perspective, boundaries from one country s government may not match boundaries from neighboring country. Census and survey variables may not be comparable from country to country due to differing definitions. Example: How do you define urban areas? 14

15 Different time series Censuses are held on different dates and at varying frequency. 15
16 Geospatial data International land boundaries Large-Scale International Boundaries (LSIB) (geonode.state.gov) Shorelines and inland water bodies World Vector Shoreline (WVS), or national sources. Internal/subnational boundaries National sources, GADM, open data repositories. Persistent challenges: Multiple interpretations for international boundaries. Representing the area of enumeration. Inland water bodies. Finding freely licensed subnational data. Matching subnational boundaries with statistical data. 16
17 New tools and methods 17
18 New tools and methods We leverage our agency s strengths: One of the largest holders of geographic information in the U.S. government. Center for excellence in production and understanding of human geography and population data. Continually innovating to conduct U.S. censuses and surveys more efficiently and effectively. We apply tools and methods built for domestic purposes to international projects. 18
19 Automated data collection & categorization Objectives: Index datasets and publications from key websites. Categorize datasets as useful or not useful. Structure datasets regardless of format (PDF, XLSX, CSV, API, HTML, etc.). Save staff time and increase data availability. Primary toolset: Apache Nutch (web scraper), Python Natural Language Toolkit (language), Python scikit-learn (machine learning classifier) 19
20 Automated data collection & categorization Build language-specific training datasets. Extract text from datasets or documents (initial focus: PDF). Identify common features based on n-grams, or sequences of n words. e.g., 2-gram = 2 word pair like demographic survey Tested Naïve Bayes & Support Vector classifiers. Promising early results: ~93% accuracy (SVM) for English-language documents, compared to human classification. Future considerations: Continuously search for new data. Tag data by subject, source, location. Automatically extract and structure data tables. Develop feedback process to improve classification. Explore geospatial data identification and extraction. Expand to other file formats and APIs. Cloud architecture to scale up/down easily. 20
21 Building extraction Identifying physical features from remotely sensed data. Use a combination of: High resolution imagery (aerial or satellite) Light detection and ranging (lidar) Vector geospatial data (e.g., road networks) Work under way to enhance U.S. housing unit location accuracy in support of census/survey operations. Census Bureau holds 150 million+ housing unit locations for U.S. Considering applying similar methods to other countries to refine estimates of population distribution. 21

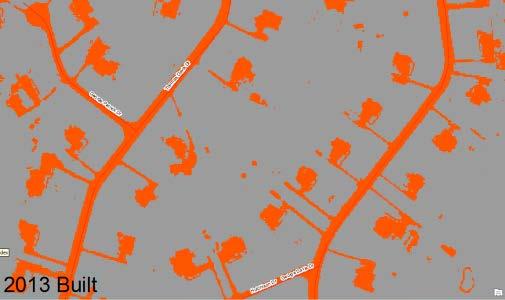
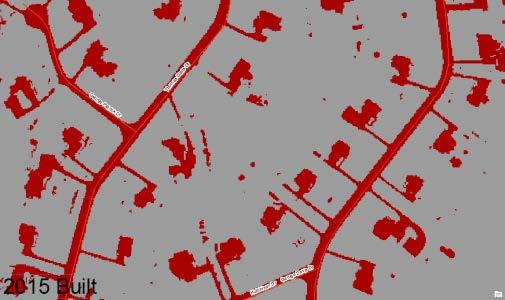
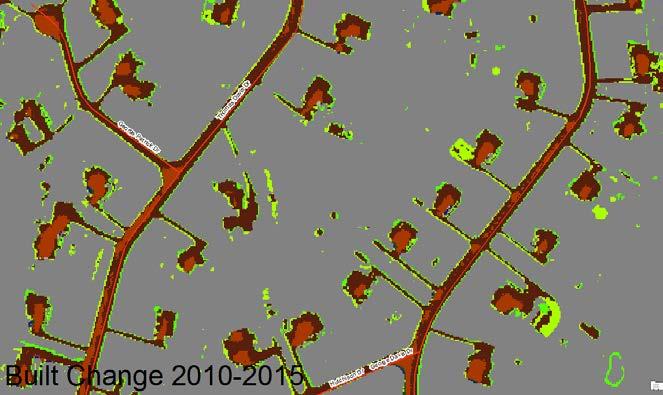
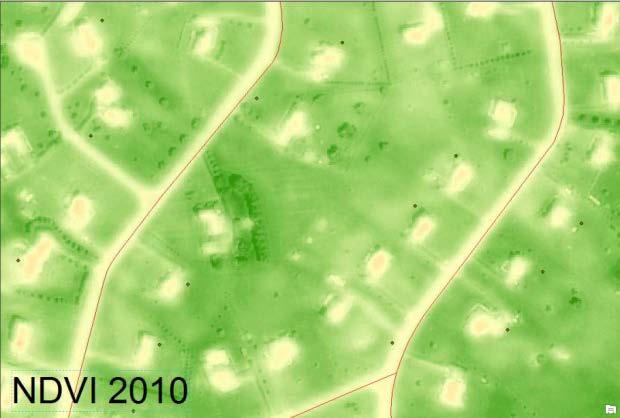
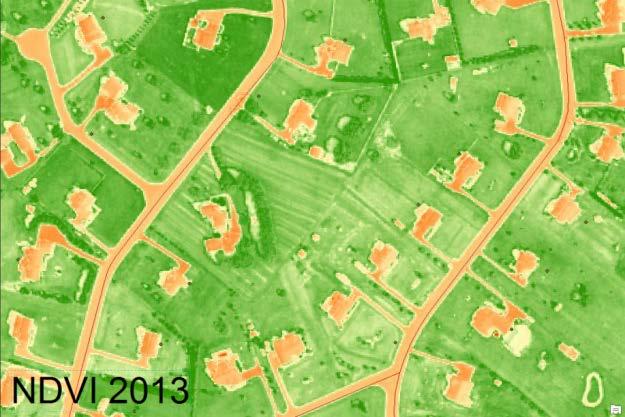
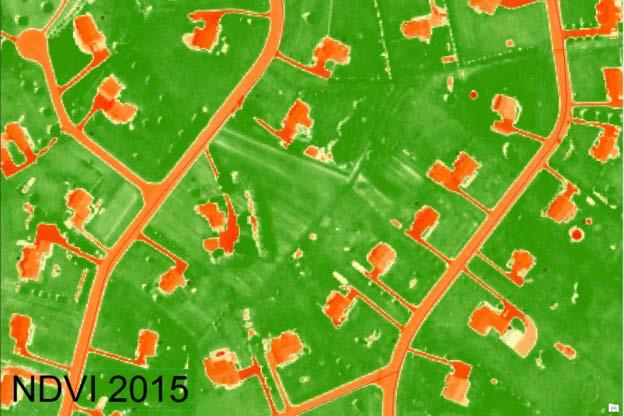
22 Constructing built-up layer Built/not-built derived from normalized difference vegetation index (NDVI). Change identified by comparing multiple time periods. Multi-date Built layer 22


23 Extracting ground from lidar Lidar point cloud. Queried for ground points. Expanded ground raster layer. Ground points converted to raster layer. 23


24 Extracting buildings Expanded ground raster (left) used as mask to remove low areas of Built/Not Built layer for latest year (right). Resultant raster layer represents primarily buildings. Building polygons generated and compared with existing point features in collection. Footprints and heights captured. 24


25 Extracting roads Start with buildings raster layer Combine with non-ground point cloud to generate Built/Not Built layer Contraction and dilation to separate roads from parking lot to get paved area layer Small road segments eliminated and intersected with existing road vectors. Misaligned road segments identified and saved. 25
26 Population/settlement surfaces Increasing number of datasets are providing estimates of population and settlements in raster/gridded format. Advantages: Custom geography (not dependent on aggregate results). Works across many scales (from neighborhoods to continents). Ideal for scientific applications. 26
27 Example datasets Demobase (U.S. Census Bureau) WorldPop (University of Southampton) Gridded Population of the World (CIESIN) High Resolution Settlement Layer (Facebook/CIESIN) LandScan (Oak Ridge National Laboratory) Global Human Settlement Layer (Joint Research Commission) Global Urban Footprint (German Aerospace Center) 27
28 28
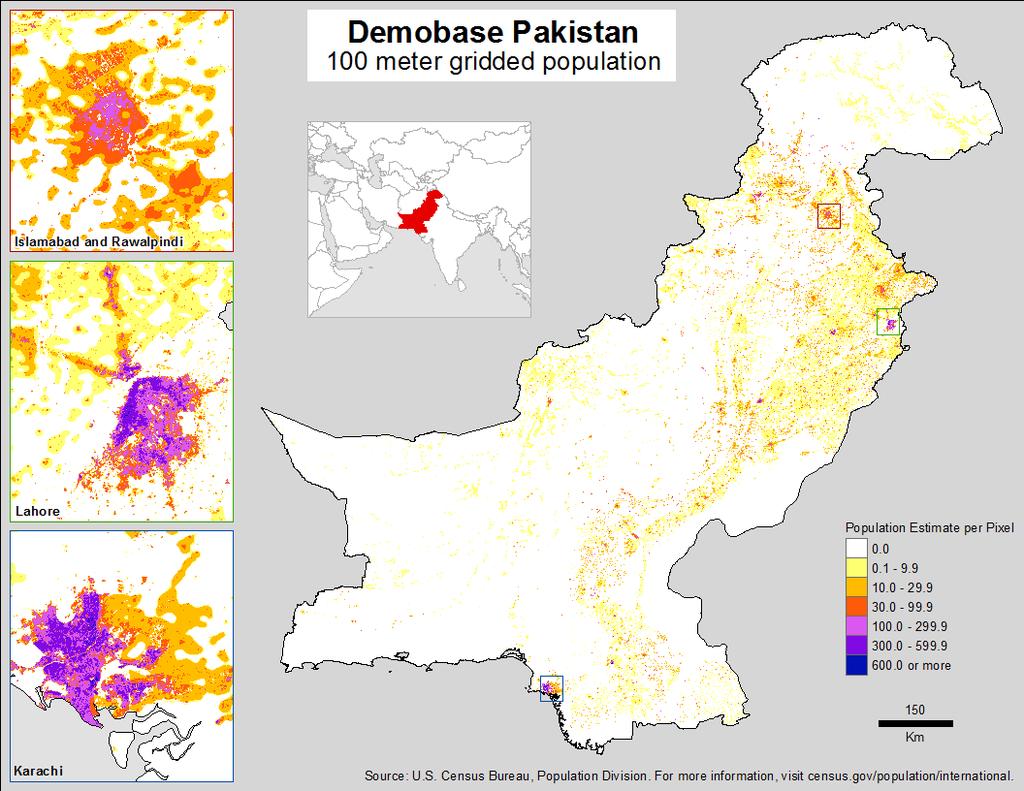
29 Example methodology: Demobase Starting point: Correlation between population distribution and built-up area. Probability layer: Combination of built-up area and other layers. Where are humans likely to live? Population assigned to pixels based on fraction of pixel that is built up. Probability layer plays an important role in rural areas. 29
. http://dx.doi.org/10.1016/j.rse.2012.")
30 Example methodology: Demobase Probability layer combines: Proximity to built-up Settlement points Land cover heterogeneity Slope and elevation Detailed methods: Azar, et al. Generation of fine-scale population layers using multi-resolution satellite imagery and geospatial data. Remote Sensing of Environment (2013). 30
31 Thank you! Tom Fitzwater U.S. Census Bureau Population Division 31
Targeted LiDAR use in Support of In-Office Address Canvassing (IOAC) March 13, 2017 MAPPS, Silver Spring MD
 March 13, 2017 MAPPS, Silver Spring MD") Targeted LiDAR use in Support of In-Office Address Canvassing (IOAC) March 13, 2017 MAPPS, Silver Spring MD Imagery, LiDAR, and Blocks In 2011, the GEO commissioned independent subject matter experts (Jensen,
Targeted LiDAR use in Support of In-Office Address Canvassing (IOAC) March 13, 2017 MAPPS, Silver Spring MD Imagery, LiDAR, and Blocks In 2011, the GEO commissioned independent subject matter experts (Jensen,
Lessons Learned from the production of Gridded Population of the World Version 4 (GPW4) Columbia University, CIESIN, USA EFGS October 2014
 Columbia University, CIESIN, USA EFGS October 2014") Lessons Learned from the production of Gridded Population of the World Version 4 (GPW4) Columbia University, CIESIN, USA EFGS October 2014 Gridded Population of the World Gridded (raster) data product
Lessons Learned from the production of Gridded Population of the World Version 4 (GPW4) Columbia University, CIESIN, USA EFGS October 2014 Gridded Population of the World Gridded (raster) data product
Gridded Population of the World Version 4 (GPWv4)
") Gridded Population of the World Version 4 (GPWv4) Greg Yetman Chris Small Erin Doxsey-Whitfield Kytt MacManus May 28, 2015 Global Urbanization Workshop http://sedac.ciesin.columbia.edu 1 Focus on applying
Gridded Population of the World Version 4 (GPWv4) Greg Yetman Chris Small Erin Doxsey-Whitfield Kytt MacManus May 28, 2015 Global Urbanization Workshop http://sedac.ciesin.columbia.edu 1 Focus on applying
Understanding China Census Data with GIS By Shuming Bao and Susan Haynie China Data Center, University of Michigan
 Understanding China Census Data with GIS By Shuming Bao and Susan Haynie China Data Center, University of Michigan The Census data for China provides comprehensive demographic and business information
Methodological issues in the development of accessibility measures to services: challenges and possible solutions in the Canadian context
 Methodological issues in the development of accessibility measures to services: challenges and possible solutions in the Canadian context Alessandro Alasia 1, Frédéric Bédard 2, and Julie Bélanger 1 (1)
GEOGRAPHIC INFORMATION SYSTEMS Session 8
 GEOGRAPHIC INFORMATION SYSTEMS Session 8 Introduction Geography underpins all activities associated with a census Census geography is essential to plan and manage fieldwork as well as to report results
What are we like? Population characteristics from UK censuses. Justin Hayes & Richard Wiseman UK Data Service Census Support
 What are we like? Population characteristics from UK censuses Justin Hayes & Richard Wiseman UK Data Service Census Support Who are we? Richard Wiseman UK Data Service / Jisc Justin Hayes UK Data Service
LandScan Global Population Database
 LandScan Global Population Database The World s Finest Population Distribution Data Uncommon information. Extraordinary places. LandScan Global Population Database East View Cartographic is now offering
Demographic Data in ArcGIS. Harry J. Moore IV
 Demographic Data in ArcGIS Harry J. Moore IV Outline What is demographic data? Esri Demographic data - Real world examples with GIS - Redistricting - Emergency Preparedness - Economic Development Next
Uganda - National Panel Survey
 Microdata Library Uganda - National Panel Survey 2013-2014 Uganda Bureau of Statistics - Government of Uganda Report generated on: June 7, 2017 Visit our data catalog at: http://microdata.worldbank.org
National assessment on member s readiness to produce indicators
 Inter-Agency and Expert Group on the Sustainable Development Goal Indicators WORKING GROUP ON GEOSPATIAL INFORMATION Fifth expert meeting 5 and 8 December 2018 8 th Meeting of IAEG-SDGs 5 8 November 2018,
Techniques for Science Teachers: Using GIS in Science Classrooms.
 Techniques for Science Teachers: Using GIS in Science Classrooms. After ESRI, 2008 GIS A Geographic Information System A collection of computer hardware, software, and geographic data used together for
An Introduction to China and US Map Library. Shuming Bao Spatial Data Center & China Data Center University of Michigan
 An Introduction to China and US Map Library Shuming Bao Spatial Data Center & China Data Center University of Michigan Current Spatial Data Services http://chinadataonline.org China Geo-Explorer http://chinageoexplorer.org
THE GLOBAL INDICATOR FRAMEWORK: NEW AND INNOVATIVE METHODS FOR DISAGGREGATIN BY GEOLOCATION
 Parallel Session: Measuring and Monitoring the SDGs: THE GLOBAL INDICATOR FRAMEWORK: NEW AND INNOVATIVE METHODS FOR DISAGGREGATIN BY GEOLOCATION from global to regional to national panorama 8 th Meeting
SUPPORTS SUSTAINABLE GROWTH
 DDSS BBUUN NDDLLEE G E O S P AT I A L G O V E R N A N C E P A C K A G E SUPPORTS SUSTAINABLE GROWTH www.digitalglobe.com BRISBANE, AUSTRALIA WORLDVIEW-3 30 CM International Civil Government Programs US
Using American Factfinder
 Using American Factfinder What is American Factfinder? American Factfinder is a search engine that provides access to the population, housing and economic data collected by the U.S. Census Bureau. It can
Technical Documentation Demostats april 2018
 Technical Documentation Demostats 2018 april 2018 what it is DemoStats is a database of estimates and projections for a comprehensive set of demographic and socioeconomic attributes about the Canadian
Foundation Geospatial Information to serve National and Global Priorities
 Foundation Geospatial Information to serve National and Global Priorities Greg Scott Inter-Regional Advisor Global Geospatial Information Management United Nations Statistics Division UN-GGIM: A global
Indicator: Proportion of the rural population who live within 2 km of an all-season road
 Goal: 9 Build resilient infrastructure, promote inclusive and sustainable industrialization and foster innovation Target: 9.1 Develop quality, reliable, sustainable and resilient infrastructure, including
Digitization in a Census
 Topics Connectivity of Geographic Data Sketch Maps Data Organization and Geodatabases Managing a Digitization Project Quality and Control Topology Metadata 1 Topics (continued) Interactive Selection Snapping
GIS = Geographic Information Systems;
 What is GIS GIS = Geographic Information Systems; What Information are we talking about? Information about anything that has a place (e.g. locations of features, address of people) on Earth s surface,
Data Aggregation with InfraWorks and ArcGIS for Visualization, Analysis, and Planning
 Data Aggregation with InfraWorks and ArcGIS for Visualization, Analysis, and Planning Stephen Brockwell President, Brockwell IT Consulting, Inc. Join the conversation #AU2017 KEYWORD Class Summary Silos
Geoscape Capturing Australia s Built Environment for emergency modelling and management. Dan Paull Chief Executive Officer PSMA Australia
 Geoscape Capturing Australia s Built Environment for emergency modelling and management Dan Paull Chief Executive Officer PSMA Australia There is no wealth like knowledge, and no poverty like ignorance.
AP HUG REVIEW WELCOME TO 2 ND SEMESTER! Annette Parkhurst, M.Ed. January, 2015
 AP HUG REVIEW WELCOME TO 2 ND SEMESTER! Annette Parkhurst, M.Ed. January, 2015 Movement Globalization Latitude & Elevation Levels of Economic Activities CONNECTIONS Human Geography Human is the geography
Welcome. C o n n e c t i n g
 Welcome C o n n e c t i n g YOU D i s c i p l i n e s Why is This Meeting......So Important Now? OUR WORLD Is Increasingly Challenged The Evidence Is Clear We Need Better Understanding and More Collaboration
Geospatial Analysis of Job-Housing Mismatch Using ArcGIS and Python
 Geospatial Analysis of Job-Housing Mismatch Using ArcGIS and Python 2016 ESRI User Conference June 29, 2016 San Diego, CA Jung Seo, Frank Wen, Simon Choi and Tom Vo, Research & Analysis Southern California
Rules of the territorial division
 Rules of the territorial division Janusz Dygaszewicz Central Statistical Office of Poland Jerusalem, 4-7 December 2016 Rules of territory division (the Polish case) The area of each unit of territorial
Disaggregation according to geographic location the need and the challenges
 International Seminar On United Nations Global Geospatial Information Management Disaggregation according to geographic location the need and the challenges 6 th 7 th November 2018 Tribe Hotel, Nairobi,
The Road to Data in Baltimore
 Creating a parcel level database from high resolution imagery By Austin Troy and Weiqi Zhou University of Vermont, Rubenstein School of Natural Resources State and local planning agencies are increasingly
Evaluating Urban Vegetation Cover Using LiDAR and High Resolution Imagery
 Evaluating Urban Vegetation Cover Using LiDAR and High Resolution Imagery Y.A. Ayad and D. C. Mendez Clarion University of Pennsylvania Abstract One of the key planning factors in urban and built up environments
Merging statistics and geospatial information
 Merging statistics and geospatial information Demography / Commuting / Spatial planning / Registers Mirosław Migacz Chief GIS Specialist Janusz Dygaszewicz Director Central Statistical Office of Poland
High resolution population grid for the entire United States
 High resolution population grid for the entire United States A. Dmowska, T. F. Stepinski Space Informatics Lab, Department of Geography, University of Cincinnati, Cincinnati, OH 45221-0131, USA Telephone:
Indicator : Average share of the built-up area of cities that is open space for public use for all, by sex, age and persons with disabilities
 Goal 11: Make cities and human settlements inclusive, safe, resilient and sustainable Target 11.7: By 2030, provide universal access to safe, inclusive and accessible, green and public spaces, in particular
Crowdsourcing approach for large scale mapping of built-up land
 Crowdsourcing approach for large scale mapping of built-up land Kavinda Gunasekara Kavinda@ait.asia Geoinformatics Center Asian Institute of Technology, Thailand. Regional expert workshop on land accounting
Compact guides GISCO. Geographic information system of the Commission
 Compact guides GISCO Geographic information system of the Commission What is GISCO? GISCO, the Geographic Information System of the COmmission, is a permanent service of Eurostat that fulfils the requirements
ENV208/ENV508 Applied GIS. Week 1: What is GIS?
 ENV208/ENV508 Applied GIS Week 1: What is GIS? 1 WHAT IS GIS? A GIS integrates hardware, software, and data for capturing, managing, analyzing, and displaying all forms of geographically referenced information.
2018 NASCIO Award Submission Category: Cross-Boundary Collaboration and Partnerships. Project Title: Tennessee Wildfires: A Coordinated GIS Response
 2018 NASCIO Award Submission Category: Cross-Boundary Collaboration and Partnerships Project Title: Tennessee Wildfires: A Coordinated GIS Response Sevier County, Tennessee State of Tennessee, Emergency
DATA DISAGGREGATION BY GEOGRAPHIC
 PROGRAM CYCLE ADS 201 Additional Help DATA DISAGGREGATION BY GEOGRAPHIC LOCATION Introduction This document provides supplemental guidance to ADS 201.3.5.7.G Indicator Disaggregation, and discusses concepts
COMPILATION OF ENVIRONMENTALLY-RELATED QUESTIONS IN CENSUSES AND SURVEY, AND SPECIALIZED ENVIRONMENTAL SURVEYS
 COMPILATION OF ENVIRONMENTALLY-RELATED QUESTIONS IN CENSUSES AND SURVEY, AND SPECIALIZED ENVIRONMENTAL SURVEYS 6. 2. Environment Environmental Protection, Resources and Management and their Use Engagement
Sharthi Laldaparsad Statistics South Africa, Policy Research & Analysis. Sub-regional workshop on integration of administrative data,
 Sub-regional workshop on integration of administrative data, big data and geospatial information for the compilation of SDG indicators and International Workshop on Global Fundamental Geospatial Data Themes
Land-Line Technical information leaflet
 Land-Line Technical information leaflet The product Land-Line is comprehensive and accurate large-scale digital mapping available for Great Britain. It comprises nearly 229 000 separate map tiles of data
GIS ADMINISTRATOR / WEB DEVELOPER EVANSVILLE-VANDERBURGH COUNTY AREA PLAN COMMISSION
 GIS ADMINISTRATOR / WEB DEVELOPER EVANSVILLE-VANDERBURGH COUNTY AREA PLAN COMMISSION SALARY RANGE INITIATION $43,277 SIX MONTHS $45,367 POSITION GRADE PAT VI The Evansville-Vanderburgh County Area Plan
Land Accounts - The Canadian Experience
 Land Accounts - The Canadian Experience Development of a Geospatial database to measure the effect of human activity on the environment Who is doing Land Accounts Statistics Canada (national) Component
CENSUS MAPPING WITH GIS IN NAMIBIA. BY Mrs. Ottilie Mwazi Central Bureau of Statistics Tel: October 2007
 CENSUS MAPPING WITH GIS IN NAMIBIA BY Mrs. Ottilie Mwazi Central Bureau of Statistics E-mail: omwazi@npc.gov.na Tel: + 264 61 283 4060 October 2007 Content of Presentation HISTORICAL BACKGROUND OF CENSUS
Disaster Management & Recovery Framework: The Surveyors Response
 Disaster Management & Recovery Framework: The Surveyors Response Greg Scott Inter-Regional Advisor Global Geospatial Information Management United Nations Statistics Division Department of Economic and
Use of Geospatial Data: Philippine Statistics Authority 1
 Use of Geospatial Data: Philippine Statistics Authority 1 1 Presentation by Lisa Grace S. Bersales at the UNSC 2016 side event on Geospatial information and earth observations: supporting official statistics
Integration for Informed Decision Making
 Geospatial and Statistics Policy Intervention: Integration for Informed Decision Making Greg Scott Global Geospatial Information Management United Nations Statistics Division Department of Economic and
Understanding and Measuring Urban Expansion
 VOLUME 1: AREAS AND DENSITIES 21 CHAPTER 3 Understanding and Measuring Urban Expansion THE CLASSIFICATION OF SATELLITE IMAGERY The maps of the urban extent of cities in the global sample were created using
NR402 GIS Applications in Natural Resources
 NR402 GIS Applications in Natural Resources Lesson 1 Introduction to GIS Eva Strand, University of Idaho Map of the Pacific Northwest from http://www.or.blm.gov/gis/ Welcome to NR402 GIS Applications in
New Land Cover & Land Use Data for the Chesapeake Bay Watershed
 New Land Cover & Land Use Data for the Chesapeake Bay Watershed Why? The Chesapeake Bay Program (CBP) partnership is in the process of improving and refining the Phase 6 suite of models used to inform
Acknowledgments xiii Preface xv. GIS Tutorial 1 Introducing GIS and health applications 1. What is GIS? 2
 Acknowledgments xiii Preface xv GIS Tutorial 1 Introducing GIS and health applications 1 What is GIS? 2 Spatial data 2 Digital map infrastructure 4 Unique capabilities of GIS 5 Installing ArcView and the
Developing Spatial Data to Support Statistical Analysis of Education
 Developing Spatial Data to Support Statistical Analysis of Education Doug Geverdt National Center for Education Statistics Education Demographic and Geographic Estimates (EDGE) Program 2016 ESRI User Conference
Population Research Center (PRC) Oregon Population Forecast Program
 Oregon Population Forecast Program") Population Research Center (PRC) Oregon Population Forecast Program 2013 Oregon League of Cities Conference Risa S. Proehl Jason R. Jurjevich, Ph.D. Population Research Center (PRC) Population Research
Population Research Center (PRC) Oregon Population Forecast Program 2013 Oregon League of Cities Conference Risa S. Proehl Jason R. Jurjevich, Ph.D. Population Research Center (PRC) Population Research
Poverty and Hazard Linkages
 Poverty and Hazard Linkages Global Risk Identification Programme Proposal Development Coordination Meeting Friday, 19 May 2006 CIESIN Earth Institute Columbia University www.ciesin.columbia.edu Data Improvements
Machine Learning to Automatically Detect Human Development from Satellite Imagery
 Technical Disclosure Commons Defensive Publications Series April 24, 2017 Machine Learning to Automatically Detect Human Development from Satellite Imagery Matthew Manolides Follow this and additional
Measuring Disaster Risk for Urban areas in Asia-Pacific
 Measuring Disaster Risk for Urban areas in Asia-Pacific Acknowledgement: Trevor Clifford, Intl Consultant 1 SDG 11 Make cities and human settlements inclusive, safe, resilient and sustainable 11.1: By
Looking at Communities: Comparing Urban and Rural Neighborhoods
 Looking at Communities: Comparing Urban and Rural Neighborhoods OVERVIEW & OBJECTIVES Our urban areas have become so dominant that frequently the children we teach have no connection with and very few
Working with Census Operations Case Study from KSA
 Working with Census Operations Case Study from KSA International Workshop on Integrating Geospatial and Statistical Information Beijing 9 12 June 2014 Abdullah M.Alhamlan Kingdom of Saudi Arabia Central
Summary and Statistical Report of the 2007 Population and Housing Census Results 1
 Summary and Statistical Report of the 2007 Population and Housing Census Results 1 2 Summary and Statistical Report of the 2007 Population and Housing Census Results This document was printed by United
How GIS can be used for improvement of literacy and CE programmes
 How GIS can be used for improvement of literacy and CE programmes Training Workshop for Myanmar Literacy Resource Center (MLRC) ( Yangon, Myanmar, 11 20 October 2000 ) Presented by U THEIN HTUT GEOCOMP
Chapter 6. Fundamentals of GIS-Based Data Analysis for Decision Support. Table 6.1. Spatial Data Transformations by Geospatial Data Types
 Chapter 6 Fundamentals of GIS-Based Data Analysis for Decision Support FROM: Points Lines Polygons Fields Table 6.1. Spatial Data Transformations by Geospatial Data Types TO: Points Lines Polygons Fields
Combining Geospatial and Statistical Data for Analysis & Dissemination
 Combining Geospatial and Statistical Data for Analysis & Dissemination (with Special Reference to Qatar Census 2010) Presentation by Mansoor Al Malki, Director of IT Department Qatar Statistics Authority
Brazil Paper for the. Second Preparatory Meeting of the Proposed United Nations Committee of Experts on Global Geographic Information Management
 Brazil Paper for the Second Preparatory Meeting of the Proposed United Nations Committee of Experts on Global Geographic Information Management on Data Integration Introduction The quick development of
What s new (or not so new) in Population and Poverty Data Initiatives
 in Population and Poverty Data Initiatives") What s new (or not so new) in Population and Poverty Data Initiatives Deborah Balk Global Spatial Data and Information User Workshop 21 September 2004 Evolution in global collection of population and poverty
What s new (or not so new) in Population and Poverty Data Initiatives Deborah Balk Global Spatial Data and Information User Workshop 21 September 2004 Evolution in global collection of population and poverty
Integrating Official Statistics and Geospatial Information NBS Experience
 Integrating Official Statistics and Geospatial Information NBS Experience Presented by Eng. Reda AL Sabbagh Director of IT Dept. Prepared by Eng. Adham Makky GIS Specialist Topics to be covered: Background
Preparing the GEOGRAPHY for the 2011 Population Census of South Africa
 Preparing the GEOGRAPHY for the 2011 Population Census of South Africa Sharthi Laldaparsad Statistics South Africa; E-mail: sharthil@statssa.gov.za Abstract: Statistics South Africa (Stats SA) s Geography
Achieving the Vision Geo-statistical integration addressing South Africa s Developmental Agenda. geospatial + statistics. The Data Revolution
 Achieving the Vision Geo-statistical integration addressing South Africa s Developmental Agenda geospatial + statistics The Data Revolution humble beginnings, present & future - South Africa UN World Data
Data Collection. Lecture Notes in Transportation Systems Engineering. Prof. Tom V. Mathew. 1 Overview 1
 Data Collection Lecture Notes in Transportation Systems Engineering Prof. Tom V. Mathew Contents 1 Overview 1 2 Survey design 2 2.1 Information needed................................. 2 2.2 Study area.....................................
Introduction to GIS I
 Introduction to GIS Introduction How to answer geographical questions such as follows: What is the population of a particular city? What are the characteristics of the soils in a particular land parcel?
User Guide. Affirmatively Furthering Fair Housing Data and Mapping Tool. U.S. Department of Housing and Urban Development
 User Guide Affirmatively Furthering Fair Housing Data and Mapping Tool U.S. Department of Housing and Urban Development December, 2015 1 Table of Contents 1. Getting Started... 5 1.1 Software Version...
The Church Demographic Specialists
 The Church Demographic Specialists Easy-to-Use Features Map-driven, Web-based Software An Integrated Suite of Information and Query Tools Providing An Insightful Window into the Communities You Serve Key
2010 Census Data Release and Current Geographic Programs. Michaellyn Garcia Geographer Seattle Regional Census Center
 2010 Census Data Release and Current Geographic Programs Michaellyn Garcia Geographer Seattle Regional Census Center 2010 Center of Population Located approximately 2.7 miles northeast of Plato, Missouri
Welcome to NR502 GIS Applications in Natural Resources. You can take this course for 1 or 2 credits. There is also an option for 3 credits.
 Welcome to NR502 GIS Applications in Natural Resources. You can take this course for 1 or 2 credits. There is also an option for 3 credits. The 1st credit consists of a series of readings, demonstration,
Rural Pennsylvania: Where Is It Anyway? A Compendium of the Definitions of Rural and Rationale for Their Use
 Rural Pennsylvania: Where Is It Anyway? A Compendium of the Definitions of Rural and Rationale for Their Use Pennsylvania Office of Rural Health 310 Nursing Sciences Building University Park, PA 16802
2011 Built-up Areas - Methodology and Guidance
 2011 Built-up Areas - Methodology and Guidance June 2013 Version: 2013 v1 Office for National Statistics 2013 Contents 1. Introduction... 3 2. Methodology... 3 2.1 Identifying built-up areas for the 2011
CONSTRUCTING THE POVERTY AND OPPORTUNITIES/PUBLIC SERVICES MAPS INFORMATION MANAGEMENT. Background: Brazil Without Extreme Poverty Plan
 INFORMATION MANAGEMENT CONSTRUCTING THE POVERTY AND OPPORTUNITIES/PUBLIC SERVICES MAPS Background: Brazil Without Extreme Poverty Plan The Brazil Without Extreme Poverty Plan (BSM), designed to overcome
GEOGRAPHY (GEOGRPHY) Geography (GEOGRPHY) 1
 Geography (GEOGRPHY) 1") Geography (GEOGRPHY) 1 GEOGRAPHY (GEOGRPHY) GEOGRPHY 1040 Planet Earth 4 Credits The features of the natural environment (lithosphere, atmosphere and hydrosphere); their character, distribution, origin
Geography (GEOGRPHY) 1 GEOGRAPHY (GEOGRPHY) GEOGRPHY 1040 Planet Earth 4 Credits The features of the natural environment (lithosphere, atmosphere and hydrosphere); their character, distribution, origin
Trimble s ecognition Product Suite
 Trimble s ecognition Product Suite Dr. Waldemar Krebs October 2010 Trimble Geospatial in the Image Processing Chain Data Acquisition Pre-processing Manual/Pixel-based Object-/contextbased Interpretation
Demographic Data. How to get it and how to use it (with caution) By Amber Keller
 By Amber Keller") Demographic Data How to get it and how to use it (with caution) By Amber Keller 101 Where does it come from? o The American Community Survey o Socio-economic characteristics of a population o Administered
Demographic Data How to get it and how to use it (with caution) By Amber Keller 101 Where does it come from? o The American Community Survey o Socio-economic characteristics of a population o Administered
ParkServe. The Trust for Public Land s. Emmalee Dolfi Gabriel Patterson-King ESRI User Conference 2017
 The Trust for Public Land s ParkServe Automating Large-Scale Data Transformation, QA/QC and Analysis Emmalee Dolfi Gabriel Patterson-King ESRI User Conference 2017 Our mission The Trust for Public Land
Introduction to GIS. Dr. M.S. Ganesh Prasad
 Introduction to GIS Dr. M.S. Ganesh Prasad Department of Civil Engineering The National Institute of Engineering, MYSORE ganeshprasad.nie@gmail.com 9449153758 Geographic Information System (GIS) Information
DATA SCIENCE SIMPLIFIED USING ARCGIS API FOR PYTHON
 DATA SCIENCE SIMPLIFIED USING ARCGIS API FOR PYTHON LEAD CONSULTANT, INFOSYS LIMITED SEZ Survey No. 41 (pt) 50 (pt), Singapore Township PO, Ghatkesar Mandal, Hyderabad, Telengana 500088 Word Limit of the
QUESTIONNAIRE THE CURRENT STATUS OF MAPPING IN THE WORLD
 QUESTIONNAIRE ON THE CURRENT STATUS OF MAPPING IN THE WORLD The questionnaire is intended to take stock of the current status of mapping in the world. The information collected will eventually be used
Typical information required from the data collection can be grouped into four categories, enumerated as below.
 Chapter 6 Data Collection 6.1 Overview The four-stage modeling, an important tool for forecasting future demand and performance of a transportation system, was developed for evaluating large-scale infrastructure
Long Island Breast Cancer Study and the GIS-H (Health)
") Long Island Breast Cancer Study and the GIS-H (Health) Edward J. Trapido, Sc.D. Associate Director Epidemiology and Genetics Research Program, DCCPS/NCI COMPREHENSIVE APPROACHES TO CANCER CONTROL September,
Long Island Breast Cancer Study and the GIS-H (Health) Edward J. Trapido, Sc.D. Associate Director Epidemiology and Genetics Research Program, DCCPS/NCI COMPREHENSIVE APPROACHES TO CANCER CONTROL September,
BROOKINGS May
 Appendix 1. Technical Methodology This study combines detailed data on transit systems, demographics, and employment to determine the accessibility of jobs via transit within and across the country s 100
Exploring the Potential of Integrated Cadastral and Building Data for Evaluation of Remote-Sensing based Multi-Temporal Built-up Land Layers
 Exploring the Potential of Integrated Cadastral and Building Data for Evaluation of Remote-Sensing based Multi-Temporal Built-up Land Layers Johannes H. Uhl, Stefan Leyk, Aneta J. Florczyk, Martino Pesaresi,
Modeling global, urban, and rural exposure to climate-related hazards
 Modeling global, urban, and rural exposure to climate-related hazards Elizabeth Christenson, Mark Elliott, Ovik Banerjee, Laura Hamrick, Jamie Bartram University of North Carolina Chapel Hill ESRI User
Spatial Statistical Information Services in KOSTAT
 Distr. GENERAL WP.30 12 April 2010 ENGLISH ONLY UNITED NATIONS ECONOMIC COMMISSION FOR EUROPE (UNECE) CONFERENCE OF EUROPEAN STATISTICIANS EUROPEAN COMMISSION STATISTICAL OFFICE OF THE EUROPEAN UNION (EUROSTAT)
Second High Level Forum on GGIM Seminar on Regional Cooperation in Geospatial Information Management Doha, Qatar, 7 February 2013
 Second High Level Forum on GGIM Seminar on Regional Cooperation in Geospatial Information Management Doha, Qatar, 7 February 2013 Overview on Geospatial Activities in Egypt BY : Eng.Nahla Seddik Mohamed
GIS Lecture 5: Spatial Data
 GIS Lecture 5: Spatial Data GIS 1 Outline Vector Data Formats Raster Data Formats Map Projections Coordinate Systems US Census geographic files US Census data files GIS Data Sources GIS 2 Vector Data Formats
GDDS2: GIS AND SMALL AREA STATISTICS. Page 1 of 6
 GDDS2: GIS AD SMALL AREA STATISTICS GDDS2: CHECKLIST Ghana GHAA: AEXURE C Background ame of country Ghana Size of population 21m % of population in urban App 60% Size of country (sq km) 238533 sqkm Geographical
Advanced Image Analysis in Disaster Response
 Advanced Image Analysis in Disaster Response Creating Geographic Knowledge Thomas Harris ITT The information contained in this document pertains to software products and services that are subject to the
STATE GEOGRAPHIC INFORMATION DATABASE
 STATE GEOGRAPHIC INFORMATION DATABASE Data Information and Knowledge Management STATE GEOGRAPHIC INFORMATION DATABASE EXECUTIVE SUMMARY Utah has developed one of the most comprehensive statewide GIS resources
Search for the Gulf of Carpentaria in the remap search bar:
 This tutorial is aimed at getting you started with making maps in Remap (). In this tutorial we are going to develop a simple classification of mangroves in northern Australia. Before getting started with
Census Geography, Geographic Standards, and Geographic Information
 Census Geography, Geographic Standards, and Geographic Information Michael Ratcliffe Geography Division US Census Bureau New Mexico State Data Center Data Users Conference November 19, 2015 Today s Presentation
Hennepin GIS. Tree Planting Priority Areas - Analysis Methodology. GIS Services April 2018 GOAL:
 Hennepin GIS GIS Services April 2018 Tree Planting Priority Areas - Analysis Methodology GOAL: To create a GIS data layer that will aid Hennepin County Environment & Energy staff in determining where to
The 2010 Census Successful Because of GIS
 The 2010 Census Successful Because of GIS Timothy F. Trainor Chief, Geography Division, U.S. Census Bureau Vice President, International Cartographic Association Establishing the Framework of the Operation
Internet GIS Sites. 2 OakMapper webgis Application
 Internet GIS Sites # Name URL Description 1 City of Sugar Land http://www.sugarlandtx.gov/index.htm It is a city in Texas with 65,000 Residents. The City of Sugar Land, Texas, provides ArcIMS-based maps
NEW YORK DEPARTMENT OF SANITATION. Spatial Analysis of Complaints
 NEW YORK DEPARTMENT OF SANITATION Spatial Analysis of Complaints Spatial Information Design Lab Columbia University Graduate School of Architecture, Planning and Preservation November 2007 Title New York