Chapter 30 Design and Analysis of
|
|
|
- Jason Harper
- 6 years ago
- Views:
Transcription
1 Chapter 30 Design and Analysis of 2 k DOEs Introduction This chapter describes design alternatives and analysis techniques for conducting a DOE. Tables M1 to M5 in Appendix E can be used to create test trials. 1
2 level DOE Design Alternatives It was illustrated how a saturated fractional factorial design could be created from a full factorial design. However, there are other alternatives between full and saturated fractional factorial design. The concern is how to match the factors to the interaction columns so that there is minimal confounding. Tables M1 to M5 manages this issue by providing the column selections for the practitioner, while Tables N1 to N3 shows the confounding with 2-factor interaction. Table 30.1 and Table M1 indicate test possibilities for 4, 8, 16, 32, and 64 2-level factor designs with resolution V+, V, IV, and III level DOE Design Alternatives Table 30.1 (M1) Number of 2-level Factor Considerations Possible for Various Full and Fractional Factorial Design Alternatives in Table M Number of Trials Experiment Resolution V+ V IV III ~ ~8 9~ ~16 17~ ~8 9~32 33~63 V+: Full 2-level factorial V: All main effects and 2-factor interactions are unconfounded with main effects or 2- factor interactions. IV: All main effects are un-confounded by 2-factor interactions. 2-factor interactions are confounded with each other. III: Main effects confounded with 2-factor interactions. 2
3 30.2 Designing a 2-level Fractional Experiment Using Tables M and N In Tables M1 to M5, the rows of the matrix define the trial configurations. The columns are used to define the 2-level states of the factors for each trial, where the level designations are + or. Step-by-step descriptions for creating an experiment design using these tables are provided in Table M1. After the number of factors, resolution, and number of trials are chosen, a design can then be determined from the tables by choosing columns from left to right using those identified by an asterisk ( ) and the numbers sequentially in the header, until the number of columns equals the number of factors in the experiment Designing a 2-level Fractional Experiment Using Tables M and N The contrast column numbers are then assigned sequential alphabetic characters from left to right. The numbers from the original matrix are noted and crossreferenced with Tables N1 to N3 if information is desired about 2-factor interactions and 2-factor interaction confounding. 3
4 30.3 Determining Statistically Significant Effects and Probability Plotting Procedure ANOVA techniques has traditionally been used to determine the significant effects in a factorial experiment. The t-test for assessing significance gives the same results as ANOVA techniques, but can be more appealing because the significance assessment is made against the magnitude of the effect. DOE techniques are often conducted with a small number of trials to save time and resources. Experimental trials are often not replicated, which leads to no knowledge about pure experimental error. One approach is to use non-significant interaction (or main effect) terms to estimate error for these significance tests Determining Statistically Significant Effects and Probability Plotting Procedure The formal significance test uses a probability plot of the contrast column. For 2-level factorial designs, a contrast column effect,, can be determined as, = n high x highi n high i=1 n low x lowi n low i=1 where x highi and x lowi are the response values from n trials for high and low factor-level conditions. 4
5 30.3 Determining Statistically Significant Effects and Probability Plotting Procedure Main effect or interaction effect is said to be statistically significant if its magnitude is large relative to other contrast column effects. When the plot position of an effect is beyond the bounds of a straight line through the non-significant contrast column effects, this effect is thought to be statistically significant. The contrast columns not found to be statistically significant can then be combined to give an estimate of experimental error for a significance test of the other factors Modeling Equation Format for a 2-level DOE If the situation is the lower (higher) is always better, the choice of the statistically significant factor level to use either in a confirmation or follow-up experiment may be obvious. In some situations, a mathematical model is needed for the purpose of estimating the response as a function of the factor-level considerations. For a 7-factor 2-level test, the modeling equation (without interaction terms) would initially take the form, y = b 0 + b 1 x 1 + b 2 x 2 + b 3 x 3 + b 4 x 4 + b 5 x 5 + b 6 x 6 + b 7 x 7 where y is the response and b 0 is the average of all trials, b 1 to b 7 are half of the calculated effects of factor x 1 to x 7, noting that x 1 to x 7 would take on values of -1 or +1. 5
6 30.4 Modeling Equation Format for a 2-level DOE This equation form assumes that factor levels have a linear relationship with the response. Center points may have been included in the basic experiment design to check this assumption. The results from 2-level experiments might lead a practitioner from considering many factors initially to considering a few factors that may need to be analyzed further using response surface techniques. Interaction terms in a model are added as the product of the factors, y = b 0 + b 1 x 1 + b 2 x 2 + b 12 x 1 x Modeling Equation Format for a 2-level DOE Interaction terms in a model are added as the product of the factors, y = b 0 + b 1 x 1 + b 2 x 2 + b 12 x 1 x 2 If an interaction term is found statistically significant, the hierarchy rule states that all main factors and lower interaction terms that are part of the statistically significant interaction should be included in the model. 6
7 The settle-out time of a stepper motor was a critical item in the design of a document printer. The product development group proposed a change to the stepping sequence algorithm that they believed would improve the settle-out characteristics of the motor. Approach 1: To manufacture several motors and monitor their settle-out time. Confidence interval on the average settle-out time. Percent of population characteristics by probability plot. Approach 2: To perform a comparison test between the old design and the new design. Paired comparison. Approach 3: To conduct a fractional factorial experiment. Brainstorming session determined the factors to be considered: Factors ( ) Level (+) Level A: Motor temperature (mot_temp) Cold Hot B: Algorithm (algor) Current design Proposed design C: Motor adjustment (mot_adj) Low tolerance High tolerance D: External adjustment (ext_adj) Low tolerance High tolerance E: Supply voltage (sup_volt) Low tolerance High tolerance Team agreed to evaluate these five 2-level factors in a resolution V design (also called half-fraction) 7
8 Approach 3: (Fractional factorial experiment) Table M1 (or Table 30.1) shows that 16 test trials are needed. Number of Trials Experiment Resolution V+ V IV III ~ ~8 9~ ~16 17~ ~8 9~32 33~63 Table M3 (or Table 30.2) shows the design matrix V+ * * * 4 V * * * * 5 IV * * * * * III * * * * * * * *
9 Table 30.3 Test Design with Trial Responses A B C D E Output mot_temp algor mot_adj ext_adj sup_volt Timing Approach 3: To conduct a fractional factorial experiment. From Table N, all contrast columns contain either a main or 2-factor interaction effect *A *B *C *D AB BC CD ABD AC BD ABC BCD ABCD ACD AD CE DE AE *E BE The factors high-lighted with * and the higher order terms are also given. 9


10 Minitab: Stat DOE Factorial Analyze Factorial Design Graph Effects Plots: Normal Minitab: Stat DOE Factorial Analyze Factorial Design Graph Pareto 10
11 Analysis with all 5 factors Factorial Fit: Timing versus mot_temp, algor, mot_adj, ext_adj, sup_volt Estimated Effects and Coefficients for Timing (coded units) Term Effect Coef SE Coef T P Constant mot_temp algor mot_adj ext_adj sup_volt S = PRESS = R-Sq = 92.36% R-Sq(pred) = 80.44% R-Sq(adj) = 88.54% Analysis of Variance for Timing (coded units) Source DF Seq SS Adj SS Adj MS F P Main Effects Residual Error Total Unusual Observations for Timing Obs StdOrder Timing Fit SE Fit Residual St Resid R R denotes an observation with a large standardized residual. 11
12 Analysis with only 2 factors Factorial Fit: Timing versus algor, mot_adj Estimated Effects and Coefficients for Timing (coded units) Term Effect Coef SE Coef T P Constant algor mot_adj S = PRESS = R-Sq = 91.09% R-Sq(pred) = 86.50% R-Sq(adj) = 89.72% Analysis with only 2 factors Analysis of Variance for Timing (coded units) Source DF Seq SS Adj SS Adj MS F P Main Effects Residual Error Lack of Fit Pure Error Total Unusual Observations for Timing Obs StdOrder Timing Fit SE Fit Residual St Resid R R denotes an observation with a large standardized residual. 12

13 Analysis with only 2 factors Estimated Coefficients for Timing using data in uncoded units Term Coef Constant algor mot_adj Minitab: Stat DOE Factorial Factorial Plot Main Effects 13

14 Minitab: Stat DOE Factorial Analyze Factorial Graph Effects Plots: Residual vs fits Minitab: Stat DOE Factorial Analyze Factorial Graph Effects Plots: Normal 14
15 Analysis with only 2 factors with Observation #6 Removed Factorial Fit: Timing versus algor, mot_adj Estimated Effects and Coefficients for Timing (coded units) Term Effect Coef SE Coef T P Constant algor mot_adj S = PRESS = R-Sq = 97.70% R-Sq(pred) = 96.38% R-Sq(adj) = 97.31% Analysis with only 2 factors with Observation #6 Removed Analysis of Variance for Timing (coded units) Source DF Seq SS Adj SS Adj MS F P Main Effects Residual Error Lack of Fit Pure Error Total Estimated Coefficients for Timing using data in uncoded units Term Coef Constant algor mot_adj

16 Minitab: Stat DOE Factorial Analyze Factorial Graph Effects Plots: Normal Minitab: Stat DOE Factorial Analyze Factorial Graph Effects Plots: Residual vs fits 16


17 Probability Plot with all 16 Observations Probability Plot with all 16 Observations by 2 Factors 17

18 algor mot_adj DOE Alternatives This section provides 3 examples of DOE alternatives for 16 trial tests. Situation X: 5-factor 16-trial experiment Situation Y: 8-factor 16-trial experiment Situation Z: 15-factor 16-trial experiment 18
19 30.6 DOE Alternatives (Situation X 5 Factors) Table M V+ * * * 4 V * * * * 5 IV * * * * * III * * * * * * * * DOE Alternatives (Situation X 5 Factors) From Table N, all contrast columns contain either a main or 2-factor interaction effect *A *B *C *D AB BC CD ABD AC BD ABC BCD ABCD ACD AD CE DE AE *E BE The factors high-lighted with * and the higher order terms are also given. 19
20 30.6 DOE Alternatives (Situation Y 8 Factors) Table M V+ * * * 4 V * * * * 5 IV * * * * * III * * * * * * * * From Table N 30.6 DOE Alternatives (Situation Y 8 Factors) *A *B *C *D AB BC CD ABD AC BD ABC BCD ABCD ACD AD DE AF EF *E BF AE *F *G CE *H BE CF DG BG EG CG DF FG GH EH AH DH FH AG CH BH All contrast columns either have one main effect or 2- factor interactions. 20
21 30.6 DOE Alternatives (Situation Z 15 Factors) Table M3 (Situation Z) V+ * * * 4 V * * * * 5 IV * * * * * III * * * * * * * * From Table N 30.6 DOE Alternatives (Situation Z 15 Factors) *A *B *C *D AB BC CD ABD AC BD ABC BCD ABCD ACD AD BE AE BF CG *E *F *G DE EF FG CE DF EG AG BH CI CF DG EH DH EI FJ *H *I AH AF BG CH FH GI HJ DJ AI BJ FI GJ HK AJ BK *J GH HI IJ DI EJ FK IK EK FL CK AK BL GK HL CL BI CJ DK JK KL LM GL JL KM GM DL EM IL JM IM *K *L AL EL FM GN MN HM IN LN HN AN CM DN KN DM AM *M BM CN DO HO NO AO JO MO IO FN GO EO JN EN BN *N *O BO LO KO FO CO 21
22 30.7 Example 30.2: A DOE Development Test A computer manufacturer determines that no trouble found (NTF) is the largest category of returns from customers. Further investigation determines that there was a heat problem in the system. The problem was design-related. The objective is to develop a strategy that identifies both the problem and risk of failure early in the product development.. The direction will be first to identify the worst-case configuration using DOE techniques, and then stress a sample of these configured machines to failure to determine the temperature guardband Example 30.2: A DOE Development Test Brainstorming session determined the factors to be considered: Factors ( 1) Level (+1) Level A: System type (sys_type) New Old B: Processor speed (proc-spd) Fast Slow C: Hard drive size (hd_size) Large Small D: Card (card) No card 1 card E: Memory module (m_mod) 2 extra 0 extra F: Test case (tst_case) Test case 1 Test case 2 G: Battery state (btry_st) Full charge Charging 22

23 30.7 Example 30.2: A DOE Development Test sys_type proc_spd hd_size card m_mod tst_case btry_st temp_proc temp_hd temp_vc Example 30.2: A DOE Development Test 23

24 30.7 Example 30.2: A DOE Development Test 30.7 Example 30.2: A DOE Development Test 24
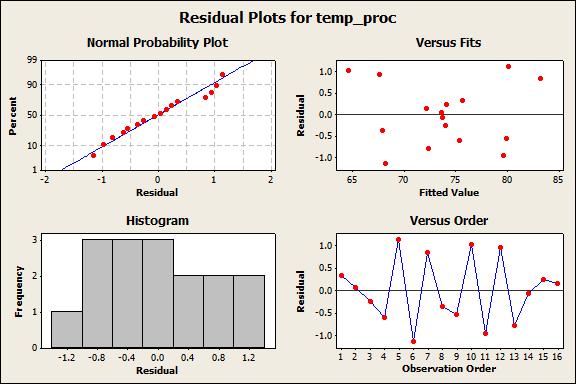
25 30.7 Example 30.2: A DOE Development Test Factorial Fit: temp_proc versus sys_type, proc_spd,... Estimated Effects and Coefficients for temp_proc (coded units) Term Effect Coef SE Coef T P Constant sys_type proc_spd hd_size card m_mod tst_case btry_st S = PRESS = R-Sq = 98.06% R-Sq(pred) = 92.26% R-Sq(adj) = 96.37% 30.7 Example 30.2: A DOE Development Test Analysis of Variance for temp_proc (coded units) Source DF Seq SS Adj SS Adj MS F P Main Effects Residual Error Total Estimated Coefficients for temp_proc using data in uncoded units Term Coef Constant sys_type proc_spd hd_size card m_mod tst_case btry_st
26 30.7 Example 30.2: A DOE Development Test Factorial Fit: temp_proc versus sys_type, proc_spd, m_mod, tst_case Estimated Effects and Coefficients for temp_proc (coded units) Term Effect Coef SE Coef T P Constant sys_type proc_spd m_mod tst_case S = PRESS = R-Sq = 97.08% R-Sq(pred) = 93.83% R-Sq(adj) = 96.02% Analysis of Variance for temp_proc (coded units) Source DF Seq SS Adj SS Adj MS F P Main Effects Residual Error Total Example 30.2: A DOE Development Test Unusual Observations for temp_proc Obs StdOrder temp_proc Fit SE Fit Residual St Resid R R denotes an observation with a large standardized residual. Estimated Coefficients for temp_proc using data in uncoded units Term Coef Constant sys_type proc_spd m_mod tst_case
27 30.7 Example 30.2: A DOE Development Test The worst-case levels and temperatures are: Constant sys_type proc_spd m_mod tst_case Factors Level Contribution Constant A: System type (sys_type) 1 (Old) B: Processor speed (proc-spd) -1 (Fast) E: Memory module (m_mod) -1 (2 extra) F: Test case (tst_case) -1 (Test case 1)
NVLAP Proficiency Test Round 14 Results. Rolf Bergman CORM 16 May 2016
 NVLAP Proficiency Test Round 14 Results Rolf Bergman CORM 16 May 2016 Outline PT 14 Structure Lamp Types Lab Participation Format for results PT 14 Analysis Average values of labs Average values of lamps
Parts Manual. EPIC II Critical Care Bed REF 2031
 EPIC II Critical Care Bed REF 2031 Parts Manual For parts or technical assistance call: USA: 1-800-327-0770 2013/05 B.0 2031-109-006 REV B www.stryker.com Table of Contents English Product Labels... 4
Redacted for Privacy
 AN ABSTRACT OF THE THESIS OF Terrence A. Smith for the degree of Master of Science in Industrial Engineering presented February 26, 1993. Title: An Experimental Investigation of Scheduling Non- Identical
Institutionen för matematik och matematisk statistik Umeå universitet November 7, Inlämningsuppgift 3. Mariam Shirdel
 Institutionen för matematik och matematisk statistik Umeå universitet November 7, 2011 Inlämningsuppgift 3 Mariam Shirdel (mash0007@student.umu.se) Kvalitetsteknik och försöksplanering, 7.5 hp 1 Uppgift
CSCI 688 Homework 6. Megan Rose Bryant Department of Mathematics William and Mary
 CSCI 688 Homework 6 Megan Rose Bryant Department of Mathematics William and Mary November 12, 2014 7.1 Consider the experiment described in Problem 6.1. Analyze this experiment assuming that each replicate
Answers Investigation 3
 Answers Investigation Applications. a., b. s = n c. The numbers seem to be increasing b a greater amount each time. The square number increases b consecutive odd integers:,, 7,, c X X=. a.,,, b., X 7 X=
a) Prepare a normal probability plot of the effects. Which effects seem active?
 Prepare a normal probability plot of the effects. Which effects seem active?") Problema 8.6: R.D. Snee ( Experimenting with a large number of variables, in experiments in Industry: Design, Analysis and Interpretation of Results, by R. D. Snee, L.B. Hare, and J. B. Trout, Editors,
Problema 8.6: R.D. Snee ( Experimenting with a large number of variables, in experiments in Industry: Design, Analysis and Interpretation of Results, by R. D. Snee, L.B. Hare, and J. B. Trout, Editors,
APPENDIX 1. Binodal Curve calculations
 APPENDIX 1 Binodal Curve calculations The weight of salt solution necessary for the mixture to cloud and the final concentrations of the phase components were calculated based on the method given by Hatti-Kaul,
Chapter 13 Experiments with Random Factors Solutions
 Solutions from Montgomery, D. C. (01) Design and Analysis of Experiments, Wiley, NY Chapter 13 Experiments with Random Factors Solutions 13.. An article by Hoof and Berman ( Statistical Analysis of Power
Suppose we needed four batches of formaldehyde, and coulddoonly4runsperbatch. Thisisthena2 4 factorial in 2 2 blocks.
 58 2. 2 factorials in 2 blocks Suppose we needed four batches of formaldehyde, and coulddoonly4runsperbatch. Thisisthena2 4 factorial in 2 2 blocks. Some more algebra: If two effects are confounded with
20g g g Analyze the residuals from this experiment and comment on the model adequacy.
 3.4. A computer ANOVA output is shown below. Fill in the blanks. You may give bounds on the P-value. One-way ANOVA Source DF SS MS F P Factor 3 36.15??? Error??? Total 19 196.04 3.11. A pharmaceutical
page 1 Total ( )
") A B C D E F Costs budget of [Claimant / Defendant] dated [ ] Estimated page 1 Work done / to be done Pre-action Disbs ( ) Time ( ) Disbs ( ) Time ( ) Total ( ) 1 Issue /statements of case 0.00 0.00 CMC
A B C D E F Costs budget of [Claimant / Defendant] dated [ ] Estimated page 1 Work done / to be done Pre-action Disbs ( ) Time ( ) Disbs ( ) Time ( ) Total ( ) 1 Issue /statements of case 0.00 0.00 CMC
Answers. Investigation 3. ACE Assignment Choices. Applications. = = 210 (Note: students
 Answers Investigation ACE Assignment Choices Problem. Core,,, Other Applications ; Connections, ; Etensions 7, ; unassigned choices from previous problems Problem. Core, Other Connections 7; Etensions
3.4. A computer ANOVA output is shown below. Fill in the blanks. You may give bounds on the P-value.
 3.4. A computer ANOVA output is shown below. Fill in the blanks. You may give bounds on the P-value. One-way ANOVA Source DF SS MS F P Factor 3 36.15??? Error??? Total 19 196.04 Completed table is: One-way
23. Fractional factorials - introduction
 173 3. Fractional factorials - introduction Consider a 5 factorial. Even without replicates, there are 5 = 3 obs ns required to estimate the effects - 5 main effects, 10 two factor interactions, 10 three
THE TRANSLATION PLANES OF ORDER 49 AND THEIR AUTOMORPHISM GROUPS
 MATHEMATICS OF COMPUTATION Volume 67, Number 223, July 1998, Pages 1207 1224 S 0025-5718(98)00961-2 THE TRANSLATION PLANES OF ORDER 49 AND THEIR AUTOMORPHISM GROUPS C. CHARNES AND U. DEMPWOLFF Abstract.
Answer Keys to Homework#10
 Answer Keys to Homework#10 Problem 1 Use either restricted or unrestricted mixed models. Problem 2 (a) First, the respective means for the 8 level combinations are listed in the following table A B C Mean
LEARNING WITH MINITAB Chapter 12 SESSION FIVE: DESIGNING AN EXPERIMENT
 LEARNING WITH MINITAB Chapter 12 SESSION FIVE: DESIGNING AN EXPERIMENT Laura M Williams, RN, CLNC, MSN MOREHEAD STATE UNIVERSITY IET603: STATISTICAL QUALITY ASSURANCE IN SCIENCE AND TECHNOLOGY DR. AHMAD
19. Blocking & confounding
 146 19. Blocking & confounding Importance of blocking to control nuisance factors - day of week, batch of raw material, etc. Complete Blocks. This is the easy case. Suppose we run a 2 2 factorial experiment,
Assignment 9 Answer Keys
 Assignment 9 Answer Keys Problem 1 (a) First, the respective means for the 8 level combinations are listed in the following table A B C Mean 26.00 + 34.67 + 39.67 + + 49.33 + 42.33 + + 37.67 + + 54.67
Solutions to Exercises
 1 c Atkinson et al 2007, Optimum Experimental Designs, with SAS Solutions to Exercises 1. and 2. Certainly, the solutions to these questions will be different for every reader. Examples of the techniques
Chapter 6 The 2 k Factorial Design Solutions
 Solutions from Montgomery, D. C. (004) Design and Analysis of Experiments, Wiley, NY Chapter 6 The k Factorial Design Solutions 6.. A router is used to cut locating notches on a printed circuit board.
Confidence Interval for the mean response
 Week 3: Prediction and Confidence Intervals at specified x. Testing lack of fit with replicates at some x's. Inference for the correlation. Introduction to regression with several explanatory variables.
J JUL - 25-JUL 2016 HOUSEHOLD FINANCES RESEARCH
 J00 JUL JUL 0 Table XF0 In terms of your finances, how often if at all, do you and your household find yourselves without enough money to buy enough food? BASE: ALL ADULTS AGED + IN GREAT BRITAIN Page
GEOMETRY HW 8. 1 x z
 GEOMETRY HW 8 CLAY SHONKWILER Consider the Heisenberg group x z 0 y which is a Lie group diffeomorphic to R 3 a: Find the left invariant vector fields X, Y, Z on R 3 whose value at the identity is the
2 k, 2 k r and 2 k-p Factorial Designs
 2 k, 2 k r and 2 k-p Factorial Designs 1 Types of Experimental Designs! Full Factorial Design: " Uses all possible combinations of all levels of all factors. n=3*2*2=12 Too costly! 2 Types of Experimental
Chapter 11: Factorial Designs
 Chapter : Factorial Designs. Two factor factorial designs ( levels factors ) This situation is similar to the randomized block design from the previous chapter. However, in addition to the effects within
Cedar Millwork Products
 1 BUILD SOME CHARACTER Edmund Allen s Cedar millwork products will set your design apart by adding the beauty, warmth, elegance of design, and functionality only natural Western Red Cedar can provide.
1. Determine the Zero-Force Members in the plane truss.
 1. Determine the Zero-orce Members in the plane truss. 1 . Determine the force in each member of the loaded truss. Use the Method of Joints. 3. Determine the force in member GM by the Method of Section.
Contents. TAMS38 - Lecture 8 2 k p fractional factorial design. Lecturer: Zhenxia Liu. Example 0 - continued 4. Example 0 - Glazing ceramic 3
 Contents TAMS38 - Lecture 8 2 k p fractional factorial design Lecturer: Zhenxia Liu Department of Mathematics - Mathematical Statistics Example 0 2 k factorial design with blocking Example 1 2 k p fractional
Multiple Regression Examples
 Multiple Regression Examples Example: Tree data. we have seen that a simple linear regression of usable volume on diameter at chest height is not suitable, but that a quadratic model y = β 0 + β 1 x +
DIFFERENTIAL GEOMETRY HW 7
 DIFFERENTIAL GEOMETRY HW 7 CLAY SHONKWILER 1 Show that within a local coordinate system x 1,..., x n ) on M with coordinate vector fields X 1 / x 1,..., X n / x n, if we pick n 3 smooth real-valued functions
Chapter 26 Multiple Regression, Logistic Regression, and Indicator Variables
 Chapter 26 Multiple Regression, Logistic Regression, and Indicator Variables 26.1 S 4 /IEE Application Examples: Multiple Regression An S 4 /IEE project was created to improve the 30,000-footlevel metric
ST3232: Design and Analysis of Experiments
 Department of Statistics & Applied Probability 2:00-4:00 pm, Monday, April 8, 2013 Lecture 21: Fractional 2 p factorial designs The general principles A full 2 p factorial experiment might not be efficient
Executive Committee and Officers ( )
") Gifted and Talented International V o l u m e 2 4, N u m b e r 2, D e c e m b e r, 2 0 0 9. G i f t e d a n d T a l e n t e d I n t e r n a t i o n a2 l 4 ( 2), D e c e m b e r, 2 0 0 9. 1 T h e W o r
Gifted and Talented International V o l u m e 2 4, N u m b e r 2, D e c e m b e r, 2 0 0 9. G i f t e d a n d T a l e n t e d I n t e r n a t i o n a2 l 4 ( 2), D e c e m b e r, 2 0 0 9. 1 T h e W o r
In this chapter trusses, frames and machines will be examines as engineering structures.
 In the previous chapter we have employed the equations of equilibrium in order to determine the support / joint reactions acting on a single rigid body or a system of connected members treated as a single
Chapter 5 Introduction to Factorial Designs Solutions
 Solutions from Montgomery, D. C. (1) Design and Analysis of Experiments, Wiley, NY Chapter 5 Introduction to Factorial Designs Solutions 5.1. The following output was obtained from a computer program that
The One-Quarter Fraction
 The One-Quarter Fraction ST 516 Need two generating relations. E.g. a 2 6 2 design, with generating relations I = ABCE and I = BCDF. Product of these is ADEF. Complete defining relation is I = ABCE = BCDF
Unreplicated 2 k Factorial Designs
 Unreplicated 2 k Factorial Designs These are 2 k factorial designs with one observation at each corner of the cube An unreplicated 2 k factorial design is also sometimes called a single replicate of the
Design of Experiments SUTD - 21/4/2015 1
 Design of Experiments SUTD - 21/4/2015 1 Outline 1. Introduction 2. 2 k Factorial Design Exercise 3. Choice of Sample Size Exercise 4. 2 k p Fractional Factorial Design Exercise 5. Follow-up experimentation
Fractional Factorial Designs
 Fractional Factorial Designs ST 516 Each replicate of a 2 k design requires 2 k runs. E.g. 64 runs for k = 6, or 1024 runs for k = 10. When this is infeasible, we use a fraction of the runs. As a result,
TWO-LEVEL FACTORIAL EXPERIMENTS: IRREGULAR FRACTIONS
 STAT 512 2-Level Factorial Experiments: Irregular Fractions 1 TWO-LEVEL FACTORIAL EXPERIMENTS: IRREGULAR FRACTIONS A major practical weakness of regular fractional factorial designs is that N must be a
Statistical Design and Analysis of Experiments Part Two
 0.1 Statistical Design and Analysis of Experiments Part Two Lecture notes Fall semester 2007 Henrik Spliid nformatics and Mathematical Modelling Technical University of Denmark List of contents, cont.
CAT. NO /irtl,417~ S- ~ I ';, A RIDER PUBLICATION BY H. A. MIDDLETON
 CAT. NO. 139-3 THIRD SUPPLEMENT I /irtl,417~ S- ~ I ';,... 0 f? BY H. A. MIDDLETON.. A RIDER PUBLICATION B36 B65 B152 B309 B319 B329 B719 D63 D77 D152 DA90 DAC32 DAF96 DC70 DC80 DCC90 DD6 DD7 DF62 DF91
Chapter 6, Solution 1. Joint B: Joint C: Joint FBDs: F = 800 lb T. F = 1700 lb C lb lb F
 \ COSMOS: Complete Online Solutions Manual Organization Sstem Chapter 6, Solution 1. Joint FBDs: Joint B: FAB 800 lb F = = 1 8 17 BC so F = 100 lb T AB F = 1700 lb C BC Joint C: FAC Cx 1700 lb = = 8 1
3. Factorial Experiments (Ch.5. Factorial Experiments)
") 3. Factorial Experiments (Ch.5. Factorial Experiments) Hae-Jin Choi School of Mechanical Engineering, Chung-Ang University DOE and Optimization 1 Introduction to Factorials Most experiments for process
3. Factorial Experiments (Ch.5. Factorial Experiments) Hae-Jin Choi School of Mechanical Engineering, Chung-Ang University DOE and Optimization 1 Introduction to Factorials Most experiments for process
Six Sigma Black Belt Study Guides
 Six Sigma Black Belt Study Guides 1 www.pmtutor.org Powered by POeT Solvers Limited. Analyze Correlation and Regression Analysis 2 www.pmtutor.org Powered by POeT Solvers Limited. Variables and relationships
Reference: Chapter 6 of Montgomery(8e) Maghsoodloo
 Maghsoodloo") Reference: Chapter 6 of Montgomery(8e) Maghsoodloo 51 DOE (or DOX) FOR BASE BALANCED FACTORIALS The notation k is used to denote a factorial experiment involving k factors (A, B, C, D,..., K) each at levels.
Reference: Chapter 6 of Montgomery(8e) Maghsoodloo 51 DOE (or DOX) FOR BASE BALANCED FACTORIALS The notation k is used to denote a factorial experiment involving k factors (A, B, C, D,..., K) each at levels.
STAT451/551 Homework#11 Due: April 22, 2014
 STAT451/551 Homework#11 Due: April 22, 2014 1. Read Chapter 8.3 8.9. 2. 8.4. SAS code is provided. 3. 8.18. 4. 8.24. 5. 8.45. 376 Chapter 8 Two-Level Fractional Factorial Designs more detail. Sequential
necessita d'interrogare il cielo
 gigi nei necessia d'inegae i cie cic pe sax span s inuie a dispiegaa fma dea uce < affeandi ves i cen dea uce isnane " sienzi dei padi sie veic dei' anima 5 J i f H 5 f AL J) i ) L '3 J J "' U J J ö'
The 2 k Factorial Design. Dr. Mohammad Abuhaiba 1
 The 2 k Factorial Design Dr. Mohammad Abuhaiba 1 HoweWork Assignment Due Tuesday 1/6/2010 6.1, 6.2, 6.17, 6.18, 6.19 Dr. Mohammad Abuhaiba 2 Design of Engineering Experiments The 2 k Factorial Design Special
School of Mathematical Sciences. Question 1. Best Subsets Regression
 School of Mathematical Sciences MTH5120 Statistical Modelling I Practical 9 and Assignment 8 Solutions Question 1 Best Subsets Regression Response is Crime I n W c e I P a n A E P U U l e Mallows g E P
Analysis of Covariance. The following example illustrates a case where the covariate is affected by the treatments.
 Analysis of Covariance In some experiments, the experimental units (subjects) are nonhomogeneous or there is variation in the experimental conditions that are not due to the treatments. For example, a
Procedure for Measuring Swing Bearing Movement on 300 A Series Hydraulic Excavators {7063}
 Page 1 of 7 Procedure for Measuring Swing Bearing Movement on 300 A Series Hydraulic Excavators {7063} Excavator: 307 (S/N: 2PM1-UP; 2WM1-UP) 311 (S/N: 9LJ1-UP; 5PK1-UP; 2KM1-UP) 312 (S/N: 6GK1-UP; 7DK1-UP;
1. Determine the Zero-Force Members in the plane truss.
 1. Determine the Zero-orce Members in the plane truss. 1 . Determine the forces in members G, CG, BC, and E for the loaded crane truss. Use the Method of Joints. 3. Determine the forces in members CG and
Contents. 2 2 factorial design 4
 Contents TAMS38 - Lecture 10 Response surface methodology Lecturer: Zhenxia Liu Department of Mathematics - Mathematical Statistics 12 December, 2017 2 2 factorial design Polynomial Regression model First
SMAM 314 Computer Assignment 5 due Nov 8,2012 Data Set 1. For each of the following data sets use Minitab to 1. Make a scatterplot.
 SMAM 314 Computer Assignment 5 due Nov 8,2012 Data Set 1. For each of the following data sets use Minitab to 1. Make a scatterplot. 2. Fit the linear regression line. Regression Analysis: y versus x y
Session 3 Fractional Factorial Designs 4
 Session 3 Fractional Factorial Designs 3 a Modification of a Bearing Example 3. Fractional Factorial Designs Two-level fractional factorial designs Confounding Blocking Two-Level Eight Run Orthogonal Array
Unit 6: Fractional Factorial Experiments at Three Levels
 Unit 6: Fractional Factorial Experiments at Three Levels Larger-the-better and smaller-the-better problems. Basic concepts for 3 k full factorial designs. Analysis of 3 k designs using orthogonal components
PERFORMANCE SPECIFICATION SHEET
 INCH-POUND MIL-PRF-49464/1C 24 June 2009 SUPERSEDING MIL-PRF-49464/1B 3 June 2004 PERFORMANCE SPECIFICATION SHEET CAPACITORS, CHIP, SINGLE LAYER, FIXED UNENCAPSULATED, CERAMIC DIELECTRIC, ESTABLISHED RELIABILITY,
W I T H M i A. L I O E T O W A R D ISTOlNrE ^ I S T D C H A. n i T Y F O R - A L L. "
 J/ H L D N D H Y F L L L N LLL KN NY H Y 2 95 HL N NG F L G NG F LNDD H H J F NH D K GN L _ L L :? H F K b H Y L DD Y N? N L L LD H LL LLL LNNG LL J K N 3 ND DL6 N Lb L F KF FH D LD3 D ND ND F ND LKKN
Spring 2019 United Soccer Peoria Game Schedule
 Please leave the following at home: Animals, drugs/alcohol, scooters/skateboards/bicycles. Please remember: 1. These are kids. 2. This is a game. 3. The coaches volunteer. 4. The referees are human. 5.
ST303C..L SERIES 515A. Features. Typical Applications. Major Ratings and Characteristics. Bulletin I25186 rev. A 05/94. case style TO-200AC (B-PUK)
") ST303C..L SERIES INVERTER GRADE THYRISTORS Hockey Puk Version Features Metal case with ceramic insulator International standard case TO-AC (B-PUK) All diffused design Center amplifying gate Guaranteed
ST303C..L SERIES INVERTER GRADE THYRISTORS Hockey Puk Version Features Metal case with ceramic insulator International standard case TO-AC (B-PUK) All diffused design Center amplifying gate Guaranteed
Dr. Shalabh Department of Mathematics and Statistics Indian Institute of Technology Kanpur
 Analysis of Variance and Design of Experiment-I MODULE IX LECTURE - 38 EXERCISES Dr. Shalabh Department of Mathematics and Statistics Indian Institute of Technology Kanpur Example (Completely randomized
USE OF COMPUTER EXPERIMENTS TO STUDY THE QUALITATIVE BEHAVIOR OF SOLUTIONS OF SECOND ORDER NEUTRAL DIFFERENTIAL EQUATIONS
 USE OF COMPUTER EXPERIMENTS TO STUDY THE QUALITATIVE BEHAVIOR OF SOLUTIONS OF SECOND ORDER NEUTRAL DIFFERENTIAL EQUATIONS Seshadev Padhi, Manish Trivedi and Soubhik Chakraborty* Department of Applied Mathematics
Design of Experiments SUTD 06/04/2016 1
 Design of Experiments SUTD 06/04/2016 1 Outline 1. Introduction 2. 2 k Factorial Design 3. Choice of Sample Size 4. 2 k p Fractional Factorial Design 5. Follow-up experimentation (folding over) with factorial
11 is the same as their sum, find the value of S.
 Answers: (998-99 HKMO Final Events) Created by: Mr. Francis Hung Last updated: July 08 Individual Events I P 4 I a 8 I a 6 I4 a I5 a IS a Q 8 b 0 b 7 b b spare b 770 R c c c c 0 c 57 S 0 d 000 d 990 d
T h e C S E T I P r o j e c t
 T h e P r o j e c t T H E P R O J E C T T A B L E O F C O N T E N T S A r t i c l e P a g e C o m p r e h e n s i v e A s s es s m e n t o f t h e U F O / E T I P h e n o m e n o n M a y 1 9 9 1 1 E T
Multiple Linear Regression
 Andrew Lonardelli December 20, 2013 Multiple Linear Regression 1 Table Of Contents Introduction: p.3 Multiple Linear Regression Model: p.3 Least Squares Estimation of the Parameters: p.4-5 The matrix approach
MATH602: APPLIED STATISTICS
 MATH602: APPLIED STATISTICS Dr. Srinivas R. Chakravarthy Department of Science and Mathematics KETTERING UNIVERSITY Flint, MI 48504-4898 Lecture 10 1 FRACTIONAL FACTORIAL DESIGNS Complete factorial designs
Stat 217 Final Exam. Name: May 1, 2002
 Stat 217 Final Exam Name: May 1, 2002 Problem 1. Three brands of batteries are under study. It is suspected that the lives (in weeks) of the three brands are different. Five batteries of each brand are
Histogram of Residuals. Residual Normal Probability Plot. Reg. Analysis Check Model Utility. (con t) Check Model Utility. Inference.
 Check Model Utility. Inference.") Steps for Regression Simple Linear Regression Make a Scatter plot Does it make sense to plot a line? Check Residual Plot (Residuals vs. X) Are there any patterns? Check Histogram of Residuals Is it Normal?
Steps for Regression Simple Linear Regression Make a Scatter plot Does it make sense to plot a line? Check Residual Plot (Residuals vs. X) Are there any patterns? Check Histogram of Residuals Is it Normal?
Simple Linear Regression. Steps for Regression. Example. Make a Scatter plot. Check Residual Plot (Residuals vs. X)
") Simple Linear Regression 1 Steps for Regression Make a Scatter plot Does it make sense to plot a line? Check Residual Plot (Residuals vs. X) Are there any patterns? Check Histogram of Residuals Is it Normal?
Simple Linear Regression 1 Steps for Regression Make a Scatter plot Does it make sense to plot a line? Check Residual Plot (Residuals vs. X) Are there any patterns? Check Histogram of Residuals Is it Normal?
Orthogonal contrasts for a 2x2 factorial design Example p130
 Week 9: Orthogonal comparisons for a 2x2 factorial design. The general two-factor factorial arrangement. Interaction and additivity. ANOVA summary table, tests, CIs. Planned/post-hoc comparisons for the
INSTITIÚID TEICNEOLAÍOCHTA CHEATHARLACH INSTITUTE OF TECHNOLOGY CARLOW MATRICES
 1 CHAPTER 4 MATRICES 1 INSTITIÚID TEICNEOLAÍOCHTA CHEATHARLACH INSTITUTE OF TECHNOLOGY CARLOW MATRICES 1 Matrices Matrices are of fundamental importance in 2-dimensional and 3-dimensional graphics programming
Aalto University A!School of Engineering. Robust Design II. Prof. Kevin Otto Department of Mechanical Engineering
 Robust Design II Prof. Kevin Otto Department of Mechanical Engineering Kevin.Otto@aalto.fi 1 Overview Fractional Factorial Designs Experimental Variability Assessment Taguchi s Method Robustness Improvement
TWO-LEVEL FACTORIAL EXPERIMENTS: BLOCKING. Upper-case letters are associated with factors, or regressors of factorial effects, e.g.
 STAT 512 2-Level Factorial Experiments: Blocking 1 TWO-LEVEL FACTORIAL EXPERIMENTS: BLOCKING Some Traditional Notation: Upper-case letters are associated with factors, or regressors of factorial effects,
FRACTIONAL FACTORIAL
 FRACTIONAL FACTORIAL NURNABI MEHERUL ALAM M.Sc. (Agricultural Statistics), Roll No. 443 I.A.S.R.I, Library Avenue, New Delhi- Chairperson: Dr. P.K. Batra Abstract: Fractional replication can be defined
INVERSION IN THE PLANE BERKELEY MATH CIRCLE
 INVERSION IN THE PLANE BERKELEY MATH CIRCLE ZVEZDELINA STANKOVA MILLS COLLEGE/UC BERKELEY SEPTEMBER 26TH 2004 Contents 1. Definition of Inversion in the Plane 1 Properties of Inversion 2 Problems 2 2.
Experimental design (DOE) - Design
 - Design") Experimental design (DOE) - Design Menu: QCExpert Experimental Design Design Full Factorial Fract Factorial This module designs a two-level multifactorial orthogonal plan 2 n k and perform its analysis.
Experimental design (DOE) - Design Menu: QCExpert Experimental Design Design Full Factorial Fract Factorial This module designs a two-level multifactorial orthogonal plan 2 n k and perform its analysis.
Quintic Quasitopological Gravity
 Quintic Quasitopological Gravity Luis Guajardo 1 in collaboration with Adolfo Cisterna 2 Mokthar Hassaïne 1 Julio Oliva 3 1 Universidad de Talca 2 Universidad Central de Chile 3 Universidad de Concepción
Chapter 6 The 2 k Factorial Design Solutions
 Solutions from Montgomery, D. C. () Design and Analysis of Experiments, Wiley, NY Chapter 6 The k Factorial Design Solutions 6.. An engineer is interested in the effects of cutting speed (A), tool geometry
SECURITIES AND EXCHANGE COMMISSION FORM 10-D. Filing Date: Period of Report: SEC Accession No
 SECURITIES AND EXCHANGE COMMISSION FORM 10-D Periodic distribution reports by Asset-Backed issuers pursuant to Rule 13a-17 or 15d-17 Filing Date: 2007-12-06 Period of Report: 2007-11-26 SEC Accession No.
South Pacific Form Seven Certificate PHYSICS. QUESTION and ANSWER BOOKLET Time allowed: Two and a half hours
 South Pacific Form Seven Certificate INSTRUCTIONS PHYSICS 2015 QUESTION and ANSWER BOOKLET Time allowed: Two and a half hours Write your Student Personal Identification Number (SPIN) in the space provided
Visit: ImperialStudy.com For More Study Materials Class IX Chapter 12 Heron s Formula Maths
 Exercise 1.1 1. Find the area of a triangle whose sides are respectively 150 cm, 10 cm and 00 cm. The triangle whose sides are a = 150 cm b = 10 cm c = 00 cm The area of a triangle = s(s a)(s b)(s c) Here
Contents. TAMS38 - Lecture 6 Factorial design, Latin Square Design. Lecturer: Zhenxia Liu. Factorial design 3. Complete three factor design 4
 Contents Factorial design TAMS38 - Lecture 6 Factorial design, Latin Square Design Lecturer: Zhenxia Liu Department of Mathematics - Mathematical Statistics 28 November, 2017 Complete three factor design
Math 3 Review Sheet Ch. 3 November 4, 2011
 Math 3 Review Sheet Ch. 3 November 4, 2011 Review Sheet: Not all the problems need to be completed. However, you should look over all of them as they could be similar to test problems. Easy: 1, 3, 9, 10,
Geometry Problem Solving Drill 08: Congruent Triangles
 Geometry Problem Solving Drill 08: Congruent Triangles Question No. 1 of 10 Question 1. The following triangles are congruent. What is the value of x? Question #01 (A) 13.33 (B) 10 (C) 31 (D) 18 You set
TMA4267 Linear Statistical Models V2017 (L19)
") TMA4267 Linear Statistical Models V2017 (L19) Part 4: Design of Experiments Blocking Fractional factorial designs Mette Langaas Department of Mathematical Sciences, NTNU To be lectured: March 28, 2017
TMA4267 Linear Statistical Models V2017 (L19) Part 4: Design of Experiments Blocking Fractional factorial designs Mette Langaas Department of Mathematical Sciences, NTNU To be lectured: March 28, 2017
Fractional Replications
 Chapter 11 Fractional Replications Consider the set up of complete factorial experiment, say k. If there are four factors, then the total number of plots needed to conduct the experiment is 4 = 1. When
$%! & (, -3 / 0 4, 5 6/ 6 +7, 6 8 9/ 5 :/ 5 A BDC EF G H I EJ KL N G H I. ] ^ _ ` _ ^ a b=c o e f p a q i h f i a j k e i l _ ^ m=c n ^
![$%! & (, -3 / 0 4, 5 6/ 6 +7, 6 8 9/ 5 :/ 5 A BDC EF G H I EJ KL N G H I. ] ^ _ ` _ ^ a b=c o e f p a q i h f i a j k e i l _ ^ m=c n ^](/thumbs/92/108125918.jpg "$%! & (, -3 / 0 4, 5 6/ 6 +7, 6 8 9/ 5 :/ 5 A BDC EF G H I EJ KL N G H I. ] ^ _ ` _ ^ a b=c o e f p a q i h f i a j k e i l _ ^ m=c n ^") ! #" $%! & ' ( ) ) (, -. / ( 0 1#2 ' ( ) ) (, -3 / 0 4, 5 6/ 6 7, 6 8 9/ 5 :/ 5 ;=? @ A BDC EF G H I EJ KL M @C N G H I OPQ ;=R F L EI E G H A S T U S V@C N G H IDW G Q G XYU Z A [ H R C \ G ] ^ _ `
! #" $%! & ' ( ) ) (, -. / ( 0 1#2 ' ( ) ) (, -3 / 0 4, 5 6/ 6 7, 6 8 9/ 5 :/ 5 ;=? @ A BDC EF G H I EJ KL M @C N G H I OPQ ;=R F L EI E G H A S T U S V@C N G H IDW G Q G XYU Z A [ H R C \ G ] ^ _ `
Parts List, Wiring Diagrams
 Parts List, Wiring Diagrams PAE180-300 SERIES PACKAGE AIR CONDITIONER UNITS TABLE OF CONTENTS PARTS LIST----------- 2-11 PARTS DRAWING----- 12-34 WIRING DIAGRAMS--- 35-48 Printed in U.S.A. 7/28/08 KEY
Basic Business Statistics, 10/e
 Chapter 4 4- Basic Business Statistics th Edition Chapter 4 Introduction to Multiple Regression Basic Business Statistics, e 9 Prentice-Hall, Inc. Chap 4- Learning Objectives In this chapter, you learn:
Steps for Regression. Simple Linear Regression. Data. Example. Residuals vs. X. Scatterplot. Make a Scatter plot Does it make sense to plot a line?
 Steps for Regression Simple Linear Regression Make a Scatter plot Does it make sense to plot a line? Check Residual Plot (Residuals vs. X) Are there any patterns? Check Histogram of Residuals Is it Normal?
Demand Estimation Using Chinese Household Expenditures 1
 Demand Estimation Using Chinese Household Expenditures 1 Shown on the following pages are demand estimates based on surveys of Chinese household expenditures. The data cover the period 1991 through 1995
STRAIGHT LINES EXERCISE - 3
 STRAIGHT LINES EXERCISE - 3 Q. D C (3,4) E A(, ) Mid point of A, C is B 3 E, Point D rotation of point C(3, 4) by angle 90 o about E. 3 o 3 3 i4 cis90 i 5i 3 i i 5 i 5 D, point E mid point of B & D. So
6. Fractional Factorial Designs (Ch.8. Two-Level Fractional Factorial Designs)
") 6. Fractional Factorial Designs (Ch.8. Two-Level Fractional Factorial Designs) Hae-Jin Choi School of Mechanical Engineering, Chung-Ang University 1 Introduction to The 2 k-p Fractional Factorial Design
6. Fractional Factorial Designs (Ch.8. Two-Level Fractional Factorial Designs) Hae-Jin Choi School of Mechanical Engineering, Chung-Ang University 1 Introduction to The 2 k-p Fractional Factorial Design
Characteristic Numbers of Matrix Lie Algebras
 Commun. Theor. Phys. (Beijing China) 49 (8) pp. 845 85 c Chinese Physical Society Vol. 49 No. 4 April 15 8 Characteristic Numbers of Matrix Lie Algebras ZHANG Yu-Feng 1 and FAN En-Gui 1 Mathematical School
2.4.3 Estimatingσ Coefficient of Determination 2.4. ASSESSING THE MODEL 23
 2.4. ASSESSING THE MODEL 23 2.4.3 Estimatingσ 2 Note that the sums of squares are functions of the conditional random variables Y i = (Y X = x i ). Hence, the sums of squares are random variables as well.
Lecture 12: 2 k p Fractional Factorial Design
 Lecture 12: 2 k p Fractional Factorial Design Montgomery: Chapter 8 Page 1 Fundamental Principles Regarding Factorial Effects Suppose there are k factors (A,B,...,J,K) in an experiment. All possible factorial