Chapter 11: Factorial Designs
|
|
|
- Stephen Wright
- 6 years ago
- Views:
Transcription
 This situation is similar to the randomized block design from the")
 and within the blocks (B), we now also consider")
; r = # of groups (factor B);")
1 Chapter : Factorial Designs. Two factor factorial designs ( levels factors ) This situation is similar to the randomized block design from the previous chapter. However, in addition to the effects within the groups (A) and within the blocks (B), we now also consider so-called interaction effects between the two parameters A & B. Schematically speaking we have: with n = # data points; c = # of groups (factor A); r = # of groups (factor B); and n` = # of repeat experiments. We now calculate the various sum of squares: sum of squares total; SST = r c i= j= k= i= j= k= ( Xi jk X ) with X = r c r c X i jk sum of squares factor A; SSA = c r i= j= k= ( Xi X ) with Xi = c c X i j k
 with X = i ij ij i= j= k= k= X i jk The mean sum of squares is derived by dividing the values by the corresponding degree of freedom.")

2 i= k= ( X j X ) with X j = r sum of squares factor B; SSB = r sum of squares interaction AB; c j= SSAB = r r c ( Xi j X i X j + X ) i= j= X i j k Random error sum of squares error; SSE = r c ( X jk X ) with X = i ij ij i= j= k= k= X i jk The mean sum of squares is derived by dividing the values by the corresponding degree of freedom. The present case is called the "Two-Factor ANOVA with Replications" You may realize that the present calculations are very similar to the randomized block situation in the previous chapter. However, please realize that it is necessary for this type of analysis to have repeat measurements. Otherwise MSE will become infinite and no F-ratios can be calculated.


3 The textbook by Montgomery had another way of simplifying the actual calculation of the sum of squares. You may want to decide for yourself if one formula is easier than the other.


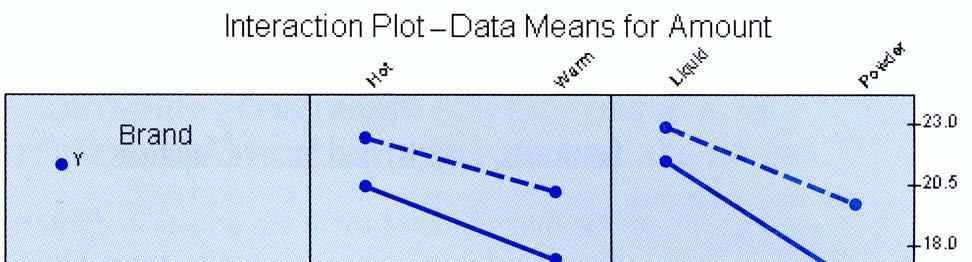
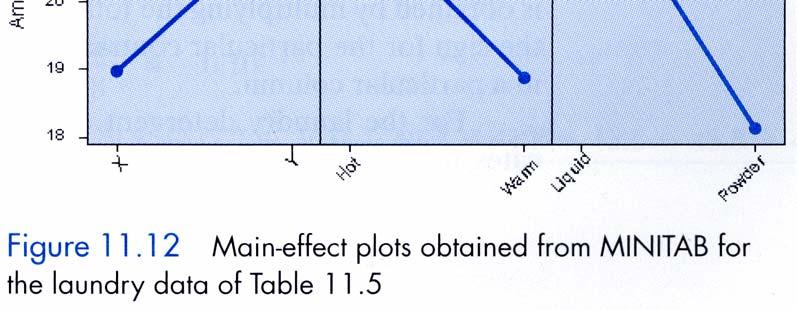
4 Use Laundry excel file as an example. (manipulate the data to show weak and strong AB-interactions)


.!! remember to use the correct degree of freedoms!")
5 The AB-interaction effects are sometimes difficult to see in a table format. Thus, graphical representations might be more appropriate. Plot the averages for the various repeat groups. Parallel lines indicate a lack of interaction, whereas a strongly different slope or even crossing lines are indications of strong interactions. Similar to the previous chapter we can run the Tukey-Kramer or the Fischer- LSD test to evaluate individual differences between multiple levels within one factor (more than levels).!! remember to use the correct degree of freedoms!! Depending on how the levels of one or both factors have been selected, we have to use different processes for our F-ratio analysis! (see following table) (Excel assumes fixed-levels)
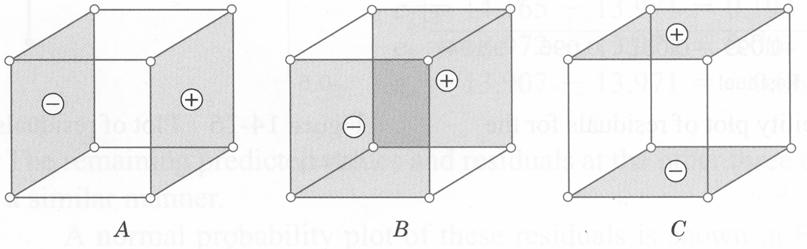
6 Residual Analysis: We test the experimental data against the assumed model (fit-equation). In case the model describes the situation correctly and there are no 'outlier', the residuals should follow a straight line in a normal probability plot. We will use the data from "Laundry" as an example. st, we have to define our model (fit-equation) The ANOVA analysis indicated that the AB-interaction effect is relative minor. Thus, we will first consider a simple linear effect of A, detergent brand, and B, temperature. Warm Hot predicted values residuals Warm Hot X 4 8 X A + X B X X X 6 9 Average: X X X X 9 X X 7 0 X.7.9 Y 7 Y Y 9 0 Y Y Y Y 7 Y Y 3 Y Average Residuals Rank # P-% Z-value The normal probability plot shows a reasonable linear relation. Thus, our model assumption seems to fit and no obvious outliers are present.

7 . Factorial designs with 3 or more factors The most basic set-up of these factorial designs uses each factor at only two levels (low and high). And for a complete factorial test set-up all possible combinations between these factors at the two levels have to be analyzed. It is also necessary to perform at least one repeat test for each experiment in order to evaluate all possible interactions. A test without repeat measurements is possible when certain interactions are assumed to be negligible. General outline for a 3 -factorial experiment:
8 Detergent-example: Each factor has "high" and "low" values, e.g. Brand X is 'low" and Brand Y is 'high" and Warm is 'low' whereas Hot is 'high'. The corner notations now indicate which factors are at a high or low level, e.g. corner 'bc' represents the high values Hot and Liquid for the nd (b) and 3 rd (c) factor, whereas Brand X st (a) factor is at the low level.
9

10 So, how do we calculate the mean square values?? We could use the same approach as shown earlier. For example: sum of sum of sum of sum of squares total; squares factor A; SST = squares interaction AB; squares SSABC = Random error sum of ABC; a b c i= j= k= l= SSA = b c a i= SSAB = c i= j= k= l= ( Xi jkl X ) with X = a b c a b c j= k= l= ( Xi X ) with Xi = b c b c a b ( X i j Xi X j + X ) i= j= a b c ( Xi jk Xi X j X k + Xi j X i k X j k + 5 X ) i= j= k= squares error; SSE = a b c ( X jkl X ) with X = i ijk ijk i= j= k= l= Apparently these equations become quite cumbersome and your calculations are prone to error. However, there is a slightly easier way to calculate these sum of squares. This is described as "Contrasts". The following table might come in handy. l= X X i jkl X i jkl i j k l
11 In order to calculate the Contrast- or Effect-A we calculate the summation over all experimental data according to the '+' and '-' signs shown in the previous table. Thus, data from the experiment labeled as () are counted negative, whereas data from the experiment a are used with a positive value, etc.. This summation results in the so-called 'Contrast' for A. Dividing the contrast by # of factors - results in the so-called 'Effect'. The sum of squares is now: SS = # ( Contrast ) of factors For our Laundry example the following examples may demonstrate this process. Effect A = bc 3-3- = 3- [8.4 The Sum of Squares is now : [ Contrast] = [ a + ab + ac + abc () b c ] ] = SSA = ( 8.8) 3 = = =.35
12 The 3-parameter interaction ABC is calculated as follows: Effect ABC = = [ a + b + c + abc () ab ac bc] = 3- = 3- [8.4 The Sum of Squares is now : ] = SSABC = The Sum of Square Total is given as: SS total a b = c i= j= k= l= X ijkl ( 0.4) 3 abc = 0.0 ( X ) = and the Sum of Squares Error is the difference between all individual sum of squares and the SS total. The following table summarizes the results: = 0.05 Interaction effect df SS MS F P Brand Temperature Type Brand x Temperature Brand x Type Temperature x Type Brand x Temperature x Type Error Total It is obvious that all single effects and the Brand x Type interaction effect are significant.
13

14 The larger the number of factors is, which are considered for the analysis, then more experiments have to be preformed. As a result of that quite often repeat experiments are not performed or a fractional factorial design is being used. First we evaluate the "no-repeat" process. The following is a 5 factorial design:
15 The factorial analysis gives the following results: (see excel file, "cake-analysis" for further details) Interactions Sum of Squares df MS F P-value A B C D E AB AC AD AE BC BD BE CD CE DE ABC ABD ABE ACD ACE ADE BCD BCE BDE CDE ABCD ABCE ABDE ACDE BCDE ABCDE Error Total
.")


16 In graphical form the results may be presented as follows:.3 Fractional factorial designs The number of necessary experiments increases substantially for increasing number of variables (factors). To reduce this number of experiments, we 'assume' certain types of interaction to be negligible and use subsets of the complete factorial design. We distinguish between different types of fractional designs: Resolution III designs; where main effects are confounded with two-way interactions (e.g. A confounded with BC) Resolution IV designs; where main effects are not confounded with two-way interactions (e.g. CD is confounded with BC) Resolution V designs; where main effects and two-way interactions are not confounded with each other, but higher order interactions are confounded (e.g. ACD confounded with BCEF)
17 Example of a 4 factorial design: A B C D AB AC AD BC BD CD ABC ABD ACD BCD ABCD () a b c d ab ac ad bc bd cd abc abd acd bcd abcd For example, we decide to run only the experiments, where Effect ACD has a positive sign in the previous table. We can then see that the effects A & CD as well as C & AD or D & AC are confounded (They have the same sign sequence and we are unable to distinguish /analyze them individually) Vice versa, if we had picked the positive experiments for column AC, then B & ABC, D & ACD, as well as BC & ABCD are confounded. We should also realize that the effect AC can no longer be analyzed at all. If we decide to use only the positive experiments in the ABCD column, we would then have the two-parameter interactions AB & CD, AC & BD, AD & BC confounded.
18 In other cases you may use the same concept to reduce experimental variations due to time or instrument limitations. For example, if you cat run all experiment on the same day. You know that results from the same date are very consistent, but repeat tests on different dates show larger variations. You then perform groups (or blocks) of tests according to the same principle as used before and you realize that for example, that a possible significance of the ABCD interaction is caused by your set-up. In graphical form the block confounding is shown in the following graph: The open and the closed circle experiments show the two blocks. It is further possible to split the total number of experiments into ¼ blocks. However, one has to be aware that more and more information is being lost in that process. E.g. Block # Block # Block #3 Block #4 () a d ad ab b abd bd bc c bcd cd ac abc acd abcd For additional and more detailed information on factorial designs (e.g. factors at more than levels) see: O.L. Davis, The Design and Analysis of Industrial Experiments, Oliver and Boyd, London (967)
2 k, 2 k r and 2 k-p Factorial Designs
 2 k, 2 k r and 2 k-p Factorial Designs 1 Types of Experimental Designs! Full Factorial Design: " Uses all possible combinations of all levels of all factors. n=3*2*2=12 Too costly! 2 Types of Experimental
ST3232: Design and Analysis of Experiments
 Department of Statistics & Applied Probability 2:00-4:00 pm, Monday, April 8, 2013 Lecture 21: Fractional 2 p factorial designs The general principles A full 2 p factorial experiment might not be efficient
The One-Quarter Fraction
 The One-Quarter Fraction ST 516 Need two generating relations. E.g. a 2 6 2 design, with generating relations I = ABCE and I = BCDF. Product of these is ADEF. Complete defining relation is I = ABCE = BCDF
CS 5014: Research Methods in Computer Science
 Computer Science Clifford A. Shaffer Department of Computer Science Virginia Tech Blacksburg, Virginia Fall 2010 Copyright c 2010 by Clifford A. Shaffer Computer Science Fall 2010 1 / 254 Experimental
Fractional Factorial Designs
 k-p Fractional Factorial Designs Fractional Factorial Designs If we have 7 factors, a 7 factorial design will require 8 experiments How much information can we obtain from fewer experiments, e.g. 7-4 =
Suppose we needed four batches of formaldehyde, and coulddoonly4runsperbatch. Thisisthena2 4 factorial in 2 2 blocks.
 58 2. 2 factorials in 2 blocks Suppose we needed four batches of formaldehyde, and coulddoonly4runsperbatch. Thisisthena2 4 factorial in 2 2 blocks. Some more algebra: If two effects are confounded with
Experimental design (DOE) - Design
 - Design") Experimental design (DOE) - Design Menu: QCExpert Experimental Design Design Full Factorial Fract Factorial This module designs a two-level multifactorial orthogonal plan 2 n k and perform its analysis.
Experimental design (DOE) - Design Menu: QCExpert Experimental Design Design Full Factorial Fract Factorial This module designs a two-level multifactorial orthogonal plan 2 n k and perform its analysis.
19. Blocking & confounding
 146 19. Blocking & confounding Importance of blocking to control nuisance factors - day of week, batch of raw material, etc. Complete Blocks. This is the easy case. Suppose we run a 2 2 factorial experiment,
CS 5014: Research Methods in Computer Science. Experimental Design. Potential Pitfalls. One-Factor (Again) Clifford A. Shaffer.
 Clifford A. Shaffer.") Department of Computer Science Virginia Tech Blacksburg, Virginia Copyright c 2015 by Clifford A. Shaffer Computer Science Title page Computer Science Clifford A. Shaffer Fall 2015 Clifford A. Shaffer
Department of Computer Science Virginia Tech Blacksburg, Virginia Copyright c 2015 by Clifford A. Shaffer Computer Science Title page Computer Science Clifford A. Shaffer Fall 2015 Clifford A. Shaffer
Reference: Chapter 6 of Montgomery(8e) Maghsoodloo
 Maghsoodloo") Reference: Chapter 6 of Montgomery(8e) Maghsoodloo 51 DOE (or DOX) FOR BASE BALANCED FACTORIALS The notation k is used to denote a factorial experiment involving k factors (A, B, C, D,..., K) each at levels.
Reference: Chapter 6 of Montgomery(8e) Maghsoodloo 51 DOE (or DOX) FOR BASE BALANCED FACTORIALS The notation k is used to denote a factorial experiment involving k factors (A, B, C, D,..., K) each at levels.
TWO-LEVEL FACTORIAL EXPERIMENTS: REGULAR FRACTIONAL FACTORIALS
 STAT 512 2-Level Factorial Experiments: Regular Fractions 1 TWO-LEVEL FACTORIAL EXPERIMENTS: REGULAR FRACTIONAL FACTORIALS Bottom Line: A regular fractional factorial design consists of the treatments
Answer Keys to Homework#10
 Answer Keys to Homework#10 Problem 1 Use either restricted or unrestricted mixed models. Problem 2 (a) First, the respective means for the 8 level combinations are listed in the following table A B C Mean
Assignment 9 Answer Keys
 Assignment 9 Answer Keys Problem 1 (a) First, the respective means for the 8 level combinations are listed in the following table A B C Mean 26.00 + 34.67 + 39.67 + + 49.33 + 42.33 + + 37.67 + + 54.67
Session 3 Fractional Factorial Designs 4
 Session 3 Fractional Factorial Designs 3 a Modification of a Bearing Example 3. Fractional Factorial Designs Two-level fractional factorial designs Confounding Blocking Two-Level Eight Run Orthogonal Array
Fractional Factorial Designs
 Fractional Factorial Designs ST 516 Each replicate of a 2 k design requires 2 k runs. E.g. 64 runs for k = 6, or 1024 runs for k = 10. When this is infeasible, we use a fraction of the runs. As a result,
3.4. A computer ANOVA output is shown below. Fill in the blanks. You may give bounds on the P-value.
 3.4. A computer ANOVA output is shown below. Fill in the blanks. You may give bounds on the P-value. One-way ANOVA Source DF SS MS F P Factor 3 36.15??? Error??? Total 19 196.04 Completed table is: One-way
STAT451/551 Homework#11 Due: April 22, 2014
 STAT451/551 Homework#11 Due: April 22, 2014 1. Read Chapter 8.3 8.9. 2. 8.4. SAS code is provided. 3. 8.18. 4. 8.24. 5. 8.45. 376 Chapter 8 Two-Level Fractional Factorial Designs more detail. Sequential
2.830J / 6.780J / ESD.63J Control of Manufacturing Processes (SMA 6303) Spring 2008
 Spring 2008") MIT OpenCourseWare http://ocw.mit.edu 2.830J / 6.780J / ESD.63J Control of Processes (SMA 6303) Spring 2008 For information about citing these materials or our Terms of Use, visit: http://ocw.mit.edu/terms.
MIT OpenCourseWare http://ocw.mit.edu 2.830J / 6.780J / ESD.63J Control of Processes (SMA 6303) Spring 2008 For information about citing these materials or our Terms of Use, visit: http://ocw.mit.edu/terms.
20g g g Analyze the residuals from this experiment and comment on the model adequacy.
 3.4. A computer ANOVA output is shown below. Fill in the blanks. You may give bounds on the P-value. One-way ANOVA Source DF SS MS F P Factor 3 36.15??? Error??? Total 19 196.04 3.11. A pharmaceutical
Fractional Replications
 Chapter 11 Fractional Replications Consider the set up of complete factorial experiment, say k. If there are four factors, then the total number of plots needed to conduct the experiment is 4 = 1. When
ESTIMATION METHODS FOR MISSING DATA IN UN-REPLICATED 2 FACTORIAL AND 2 FRACTIONAL FACTORIAL DESIGNS
 Journal of Statistics: Advances in Theory and Applications Volume 5, Number 2, 2011, Pages 131-147 ESTIMATION METHODS FOR MISSING DATA IN k k p UN-REPLICATED 2 FACTORIAL AND 2 FRACTIONAL FACTORIAL DESIGNS
Contents. TAMS38 - Lecture 8 2 k p fractional factorial design. Lecturer: Zhenxia Liu. Example 0 - continued 4. Example 0 - Glazing ceramic 3
 Contents TAMS38 - Lecture 8 2 k p fractional factorial design Lecturer: Zhenxia Liu Department of Mathematics - Mathematical Statistics Example 0 2 k factorial design with blocking Example 1 2 k p fractional
Unit 6: Fractional Factorial Experiments at Three Levels
 Unit 6: Fractional Factorial Experiments at Three Levels Larger-the-better and smaller-the-better problems. Basic concepts for 3 k full factorial designs. Analysis of 3 k designs using orthogonal components
Statistics For Economics & Business
 Statistics For Economics & Business Analysis of Variance In this chapter, you learn: Learning Objectives The basic concepts of experimental design How to use one-way analysis of variance to test for differences
The 2 k Factorial Design. Dr. Mohammad Abuhaiba 1
 The 2 k Factorial Design Dr. Mohammad Abuhaiba 1 HoweWork Assignment Due Tuesday 1/6/2010 6.1, 6.2, 6.17, 6.18, 6.19 Dr. Mohammad Abuhaiba 2 Design of Engineering Experiments The 2 k Factorial Design Special
23. Fractional factorials - introduction
 173 3. Fractional factorials - introduction Consider a 5 factorial. Even without replicates, there are 5 = 3 obs ns required to estimate the effects - 5 main effects, 10 two factor interactions, 10 three
Strategy of Experimentation III
 LECTURE 3 Strategy of Experimentation III Comments: Homework 1. Design Resolution A design is of resolution R if no p factor effect is confounded with any other effect containing less than R p factors.
Construction of Mixed-Level Orthogonal Arrays for Testing in Digital Marketing
 Construction of Mixed-Level Orthogonal Arrays for Testing in Digital Marketing Vladimir Brayman Webtrends October 19, 2012 Advantages of Conducting Designed Experiments in Digital Marketing Availability
APPENDIX 1. Binodal Curve calculations
 APPENDIX 1 Binodal Curve calculations The weight of salt solution necessary for the mixture to cloud and the final concentrations of the phase components were calculated based on the method given by Hatti-Kaul,
Design and Analysis of
 Design and Analysis of Multi-Factored Experiments Module Engineering 7928-2 Two-level Factorial Designs L. M. Lye DOE Course 1 The 2 k Factorial Design Special case of the general factorial design; k factors,
CSCI 688 Homework 6. Megan Rose Bryant Department of Mathematics William and Mary
 CSCI 688 Homework 6 Megan Rose Bryant Department of Mathematics William and Mary November 12, 2014 7.1 Consider the experiment described in Problem 6.1. Analyze this experiment assuming that each replicate
Reference: Chapter 8 of Montgomery (8e)
") Reference: Chapter 8 of Montgomery (8e) 69 Maghsoodloo Fractional Factorials (or Replicates) For Base 2 Designs As the number of factors in a 2 k factorial experiment increases, the number of runs (or
Reference: Chapter 8 of Montgomery (8e) 69 Maghsoodloo Fractional Factorials (or Replicates) For Base 2 Designs As the number of factors in a 2 k factorial experiment increases, the number of runs (or
Chapter 13 Experiments with Random Factors Solutions
 Solutions from Montgomery, D. C. (01) Design and Analysis of Experiments, Wiley, NY Chapter 13 Experiments with Random Factors Solutions 13.. An article by Hoof and Berman ( Statistical Analysis of Power
Confounding and fractional replication in 2 n factorial systems
 Chapter 20 Confounding and fractional replication in 2 n factorial systems Confounding is a method of designing a factorial experiment that allows incomplete blocks, i.e., blocks of smaller size than the
If we have many sets of populations, we may compare the means of populations in each set with one experiment.
 Statistical Methods in Business Lecture 3. Factorial Design: If we have many sets of populations we may compare the means of populations in each set with one experiment. Assume we have two factors with
MATH 251 MATH 251: Multivariate Calculus MATH 251 FALL 2005 EXAM-I FALL 2005 EXAM-I EXAMINATION COVER PAGE Professor Moseley
 MATH 251 MATH 251: Multivariate Calculus MATH 251 FALL 2005 EXAM-I FALL 2005 EXAM-I EXAMINATION COVER PAGE Professor Moseley PRINT NAME ( ) Last Name, First Name MI (What you wish to be called) ID # EXAM
Stat 217 Final Exam. Name: May 1, 2002
 Stat 217 Final Exam Name: May 1, 2002 Problem 1. Three brands of batteries are under study. It is suspected that the lives (in weeks) of the three brands are different. Five batteries of each brand are
Math Treibergs. Peanut Oil Data: 2 5 Factorial design with 1/2 Replication. Name: Example April 22, Data File Used in this Analysis:
 Math 3080 1. Treibergs Peanut Oil Data: 2 5 Factorial design with 1/2 Replication. Name: Example April 22, 2010 Data File Used in this Analysis: # Math 3080-1 Peanut Oil Data April 22, 2010 # Treibergs
TWO-LEVEL FACTORIAL EXPERIMENTS: BLOCKING. Upper-case letters are associated with factors, or regressors of factorial effects, e.g.
 STAT 512 2-Level Factorial Experiments: Blocking 1 TWO-LEVEL FACTORIAL EXPERIMENTS: BLOCKING Some Traditional Notation: Upper-case letters are associated with factors, or regressors of factorial effects,
Unreplicated 2 k Factorial Designs
 Unreplicated 2 k Factorial Designs These are 2 k factorial designs with one observation at each corner of the cube An unreplicated 2 k factorial design is also sometimes called a single replicate of the
a) Prepare a normal probability plot of the effects. Which effects seem active?
 Prepare a normal probability plot of the effects. Which effects seem active?") Problema 8.6: R.D. Snee ( Experimenting with a large number of variables, in experiments in Industry: Design, Analysis and Interpretation of Results, by R. D. Snee, L.B. Hare, and J. B. Trout, Editors,
Problema 8.6: R.D. Snee ( Experimenting with a large number of variables, in experiments in Industry: Design, Analysis and Interpretation of Results, by R. D. Snee, L.B. Hare, and J. B. Trout, Editors,
Lec 5: Factorial Experiment
 November 21, 2011 Example Study of the battery life vs the factors temperatures and types of material. A: Types of material, 3 levels. B: Temperatures, 3 levels. Example Study of the battery life vs the
USE OF COMPUTER EXPERIMENTS TO STUDY THE QUALITATIVE BEHAVIOR OF SOLUTIONS OF SECOND ORDER NEUTRAL DIFFERENTIAL EQUATIONS
 USE OF COMPUTER EXPERIMENTS TO STUDY THE QUALITATIVE BEHAVIOR OF SOLUTIONS OF SECOND ORDER NEUTRAL DIFFERENTIAL EQUATIONS Seshadev Padhi, Manish Trivedi and Soubhik Chakraborty* Department of Applied Mathematics
Strategy of Experimentation II
 LECTURE 2 Strategy of Experimentation II Comments Computer Code. Last week s homework Interaction plots Helicopter project +1 1 1 +1 [4I 2A 2B 2AB] = [µ 1) µ A µ B µ AB ] +1 +1 1 1 +1 1 +1 1 +1 +1 +1 +1
MATH 251 MATH 251: Multivariate Calculus MATH 251 FALL 2006 EXAM-II FALL 2006 EXAM-II EXAMINATION COVER PAGE Professor Moseley
 MATH 251 MATH 251: Multivariate Calculus MATH 251 FALL 2006 EXAM-II FALL 2006 EXAM-II EXAMINATION COVER PAGE Professor Moseley PRINT NAME ( ) Last Name, First Name MI (What you wish to be called) ID #
Unit 9: Confounding and Fractional Factorial Designs
 Unit 9: Confounding and Fractional Factorial Designs STA 643: Advanced Experimental Design Derek S. Young 1 Learning Objectives Understand what it means for a treatment to be confounded with blocks Know
Institutionen för matematik och matematisk statistik Umeå universitet November 7, Inlämningsuppgift 3. Mariam Shirdel
 Institutionen för matematik och matematisk statistik Umeå universitet November 7, 2011 Inlämningsuppgift 3 Mariam Shirdel (mash0007@student.umu.se) Kvalitetsteknik och försöksplanering, 7.5 hp 1 Uppgift
FRACTIONAL FACTORIAL
 FRACTIONAL FACTORIAL NURNABI MEHERUL ALAM M.Sc. (Agricultural Statistics), Roll No. 443 I.A.S.R.I, Library Avenue, New Delhi- Chairperson: Dr. P.K. Batra Abstract: Fractional replication can be defined
Design and Analysis of Multi-Factored Experiments
 Design and Analysis of Multi-Factored Experiments Fractional Factorial Designs L. M. Lye DOE Course 1 Design of Engineering Experiments The 2 k-p Fractional Factorial Design Motivation for fractional factorials
Increasing precision by partitioning the error sum of squares: Blocking: SSE (CRD) à SSB + SSE (RCBD) Contrasts: SST à (t 1) orthogonal contrasts
 à SSB + SSE (RCBD) Contrasts: SST à (t 1) orthogonal contrasts") Lecture 13 Topic 9: Factorial treatment structures (Part II) Increasing precision by partitioning the error sum of squares: s MST F = = MSE 2 among = s 2 within SST df trt SSE df e Blocking: SSE (CRD)
Lecture 13 Topic 9: Factorial treatment structures (Part II) Increasing precision by partitioning the error sum of squares: s MST F = = MSE 2 among = s 2 within SST df trt SSE df e Blocking: SSE (CRD)
Confounding and Fractional Replication in Factorial Design
 ISSN -580 (Paper) ISSN 5-05 (Online) Vol.6, No.3, 016 onfounding and Fractional Replication in Factorial esign Layla. hmed epartment of Mathematics, ollege of Education, University of Garmian, Kurdistan
ANOVA: Analysis of Variation
 ANOVA: Analysis of Variation The basic ANOVA situation Two variables: 1 Categorical, 1 Quantitative Main Question: Do the (means of) the quantitative variables depend on which group (given by categorical
CS 484 Data Mining. Association Rule Mining 2
 CS 484 Data Mining Association Rule Mining 2 Review: Reducing Number of Candidates Apriori principle: If an itemset is frequent, then all of its subsets must also be frequent Apriori principle holds due
Lecture 12: 2 k p Fractional Factorial Design
 Lecture 12: 2 k p Fractional Factorial Design Montgomery: Chapter 8 Page 1 Fundamental Principles Regarding Factorial Effects Suppose there are k factors (A,B,...,J,K) in an experiment. All possible factorial
3. Factorial Experiments (Ch.5. Factorial Experiments)
") 3. Factorial Experiments (Ch.5. Factorial Experiments) Hae-Jin Choi School of Mechanical Engineering, Chung-Ang University DOE and Optimization 1 Introduction to Factorials Most experiments for process
3. Factorial Experiments (Ch.5. Factorial Experiments) Hae-Jin Choi School of Mechanical Engineering, Chung-Ang University DOE and Optimization 1 Introduction to Factorials Most experiments for process
Analysis of Variance and Design of Experiments-I
 Analysis of Variance and Design of Experiments-I MODULE VIII LECTURE - 35 ANALYSIS OF VARIANCE IN RANDOM-EFFECTS MODEL AND MIXED-EFFECTS MODEL Dr. Shalabh Department of Mathematics and Statistics Indian
Chapter 6 The 2 k Factorial Design Solutions
 Solutions from Montgomery, D. C. (004) Design and Analysis of Experiments, Wiley, NY Chapter 6 The k Factorial Design Solutions 6.. A router is used to cut locating notches on a printed circuit board.
COM111 Introduction to Computer Engineering (Fall ) NOTES 6 -- page 1 of 12
 NOTES 6 -- page 1 of 12") COM111 Introduction to Computer Engineering (Fall 2006-2007) NOTES 6 -- page 1 of 12 Karnaugh Maps In this lecture, we will discuss Karnaugh maps (K-maps) more formally than last time and discuss a more
COM111 Introduction to Computer Engineering (Fall 2006-2007) NOTES 6 -- page 1 of 12 Karnaugh Maps In this lecture, we will discuss Karnaugh maps (K-maps) more formally than last time and discuss a more
Unit 27 One-Way Analysis of Variance
 Unit 27 One-Way Analysis of Variance Objectives: To perform the hypothesis test in a one-way analysis of variance for comparing more than two population means Recall that a two sample t test is applied
CS 147: Computer Systems Performance Analysis
 CS 147: Computer Systems Performance Analysis CS 147: Computer Systems Performance Analysis 1 / 34 Overview Overview Overview Adding Replications Adding Replications 2 / 34 Two-Factor Design Without Replications
Design and Analysis of Multi-Factored Experiments
 Design and Analysis of Multi-Factored Experiments Two-level Factorial Designs L. M. Lye DOE Course 1 The 2 k Factorial Design Special case of the general factorial design; k factors, all at two levels
Factorial designs. Experiments
 Chapter 5: Factorial designs Petter Mostad mostad@chalmers.se Experiments Actively making changes and observing the result, to find causal relationships. Many types of experimental plans Measuring response
Higher Order Factorial Designs. Estimated Effects: Section 4.3. Main Effects: Definition 5 on page 166.
 Higher Order Factorial Designs Estimated Effects: Section 4.3 Main Effects: Definition 5 on page 166. Without A effects, we would fit values with the overall mean. The main effects are how much we need
MATH 251 MATH 251: Multivariate Calculus MATH 251 FALL 2005 EXAM-3 FALL 2005 EXAM-III EXAMINATION COVER PAGE Professor Moseley
 MATH 251 MATH 251: Multivariate Calculus MATH 251 FALL 2005 EXAM-3 FALL 2005 EXAM-III EXAMINATION COVER PAGE Professor Moseley PRINT NAME ( ) Last Name, First Name MI (What you wish to be called) ID #
On the Compounds of Hat Matrix for Six-Factor Central Composite Design with Fractional Replicates of the Factorial Portion
 American Journal of Computational and Applied Mathematics 017, 7(4): 95-114 DOI: 10.593/j.ajcam.0170704.0 On the Compounds of Hat Matrix for Six-Factor Central Composite Design with Fractional Replicates
FRACTIONAL REPLICATION
 FRACTIONAL REPLICATION M.L.Agarwal Department of Statistics, University of Delhi, Delhi -. In a factorial experiment, when the number of treatment combinations is very large, it will be beyond the resources
A Statistical Approach to the Study of Qualitative Behavior of Solutions of Second Order Neutral Differential Equations
 Australian Journal of Basic and Applied Sciences, (4): 84-833, 007 ISSN 99-878 A Statistical Approach to the Study of Qualitative Behavior of Solutions of Second Order Neutral Differential Equations Seshadev
Fractional Factorials
 Fractional Factorials Bruce A Craig Department of Statistics Purdue University STAT 514 Topic 26 1 Fractional Factorials Number of runs required for full factorial grows quickly A 2 7 design requires 128
Reference: CHAPTER 7 of Montgomery(8e)
") Reference: CHAPTER 7 of Montgomery(8e) 60 Maghsoodloo BLOCK CONFOUNDING IN 2 k FACTORIALS (k factors each at 2 levels) It is often impossible to run all the 2 k observations in a 2 k factorial design (or
Reference: CHAPTER 7 of Montgomery(8e) 60 Maghsoodloo BLOCK CONFOUNDING IN 2 k FACTORIALS (k factors each at 2 levels) It is often impossible to run all the 2 k observations in a 2 k factorial design (or
Factorial and Unbalanced Analysis of Variance
 Factorial and Unbalanced Analysis of Variance Nathaniel E. Helwig Assistant Professor of Psychology and Statistics University of Minnesota (Twin Cities) Updated 04-Jan-2017 Nathaniel E. Helwig (U of Minnesota)
MATH602: APPLIED STATISTICS
 MATH602: APPLIED STATISTICS Dr. Srinivas R. Chakravarthy Department of Science and Mathematics KETTERING UNIVERSITY Flint, MI 48504-4898 Lecture 10 1 FRACTIONAL FACTORIAL DESIGNS Complete factorial designs
Statistics GIDP Ph.D. Qualifying Exam Methodology May 26 9:00am-1:00pm
 Statistics GIDP Ph.D. Qualifying Exam Methodology May 26 9:00am-1:00pm Instructions: Put your ID (not name) on each sheet. Complete exactly 5 of 6 problems; turn in only those sheets you wish to have graded.
R version ( ) Copyright (C) 2009 The R Foundation for Statistical Computing ISBN
 Copyright (C) 2009 The R Foundation for Statistical Computing ISBN") Math 3080 1. Treibergs Bread Wrapper Data: 2 4 Incomplete Block Design. Name: Example April 26, 2010 Data File Used in this Analysis: # Math 3080-1 Bread Wrapper Data April 23, 2010 # Treibergs # # From
Math 3080 1. Treibergs Bread Wrapper Data: 2 4 Incomplete Block Design. Name: Example April 26, 2010 Data File Used in this Analysis: # Math 3080-1 Bread Wrapper Data April 23, 2010 # Treibergs # # From
Two-Way Analysis of Variance - no interaction
 1 Two-Way Analysis of Variance - no interaction Example: Tests were conducted to assess the effects of two factors, engine type, and propellant type, on propellant burn rate in fired missiles. Three engine
CHAPTER 12 DESIGN OF EXPERIMENTS
 1 Sections CHAPTER 12 DESIGN OF EXPERIMENTS Introduction Designs Based on Level of Process Knowledge Some Flawed Experimental Designs One-Factor Designs Two-Factor Factorial Designs Factorial Designs Involving
PLS205 Lab 6 February 13, Laboratory Topic 9
 PLS205 Lab 6 February 13, 2014 Laboratory Topic 9 A word about factorials Specifying interactions among factorial effects in SAS The relationship between factors and treatment Interpreting results of an
Probability Distribution
 Probability Distribution 1. In scenario 2, the particle size distribution from the mill is: Counts 81
Chap The McGraw-Hill Companies, Inc. All rights reserved.
 11 pter11 Chap Analysis of Variance Overview of ANOVA Multiple Comparisons Tests for Homogeneity of Variances Two-Factor ANOVA Without Replication General Linear Model Experimental Design: An Overview
Statistics GIDP Ph.D. Qualifying Exam Methodology May 26 9:00am-1:00pm
 Statistics GIDP Ph.D. Qualifying Exam Methodology May 26 9:00am-1:00pm Instructions: Put your ID (not name) on each sheet. Complete exactly 5 of 6 problems; turn in only those sheets you wish to have graded.
Statistical Design and Analysis of Experiments Part Two
 0.1 Statistical Design and Analysis of Experiments Part Two Lecture notes Fall semester 2007 Henrik Spliid nformatics and Mathematical Modelling Technical University of Denmark List of contents, cont.
Lecture 10: 2 k Factorial Design Montgomery: Chapter 6
 Lecture 10: 2 k Factorial Design Montgomery: Chapter 6 Page 1 2 k Factorial Design Involving k factors Each factor has two levels (often labeled + and ) Factor screening experiment (preliminary study)
UNIT 5 KARNAUGH MAPS Spring 2011
 UNIT 5 KRNUGH MPS Spring 2 Karnaugh Maps 2 Contents Minimum forms of switching functions Two- and three-variable Four-variable Determination of minimum expressions using essential prime implicants Five-variable
Dr. Shalabh Department of Mathematics and Statistics Indian Institute of Technology Kanpur
 Analysis of Variance and Design of Experiment-I MODULE IX LECTURE - 38 EXERCISES Dr. Shalabh Department of Mathematics and Statistics Indian Institute of Technology Kanpur Example (Completely randomized
MATH 251 MATH 251: Multivariate Calculus MATH 251 FALL 2005 EXAM-IV FALL 2005 EXAM-IV EXAMINATION COVER PAGE Professor Moseley
 MATH 5 MATH 5: Multivariate Calculus MATH 5 FALL 5 EXAM-IV FALL 5 EXAM-IV EXAMINATION COVER PAGE Professor Moseley PRINT NAME ( ) Last Name, First Name MI (What you wish to be called) ID # EXAM DATE Thursday,
Multiple Comparisons. The Interaction Effects of more than two factors in an analysis of variance experiment. Submitted by: Anna Pashley
 Multiple Comparisons The Interaction Effects of more than two factors in an analysis of variance experiment. Submitted by: Anna Pashley One way Analysis of Variance (ANOVA) Testing the hypothesis that
MATH 251 MATH 251: Multivariate Calculus MATH 251 FALL 2005 FINAL EXAM FALL 2005 FINAL EXAM EXAMINATION COVER PAGE Professor Moseley
 MATH 5 MATH 5: Multivariate Calculus MATH 5 FALL 5 FINAL EXAM FALL 5 FINAL EXAM EXAMINATION COVER PAGE Professor Moseley PRINT NAME ( ) Last Name, First Name MI (What you wish to be called) ID # EXAM DATE
Construction of row column factorial designs
 J. R. Statist. Soc. B (2019) Construction of row column factorial designs J. D. Godolphin University of Surrey, Guildford, UK [Received February 2018. Final revision October 2018] Summary. The arrangement
Lecture 11: Blocking and Confounding in 2 k design
 Lecture 11: Blocking and Confounding in 2 k design Montgomery: Chapter 7 Page 1 There are n blocks Randomized Complete Block 2 k Design Within each block, all treatments (level combinations) are conducted.
Soo King Lim Figure 1: Figure 2: Figure 3: Figure 4: Figure 5: Figure 6: Figure 7: Figure 8: Figure 9: Figure 10: Figure 11: Figure 12: Figure 13:
 1.0 ial Experiment Design by Block... 3 1.1 ial Experiment in Incomplete Block... 3 1. ial Experiment with Two Blocks... 3 1.3 ial Experiment with Four Blocks... 5 Example 1... 6.0 Fractional ial Experiment....1
CHAPTER 4 Analysis of Variance. One-way ANOVA Two-way ANOVA i) Two way ANOVA without replication ii) Two way ANOVA with replication
 Two way ANOVA without replication ii) Two way ANOVA with replication") CHAPTER 4 Analysis of Variance One-way ANOVA Two-way ANOVA i) Two way ANOVA without replication ii) Two way ANOVA with replication 1 Introduction In this chapter, expand the idea of hypothesis tests. We
CHAPTER 4 Analysis of Variance One-way ANOVA Two-way ANOVA i) Two way ANOVA without replication ii) Two way ANOVA with replication 1 Introduction In this chapter, expand the idea of hypothesis tests. We
A Study on Factorial Designs with Blocks Influence and Inspection Plan for Radiated Emission Testing of Information Technology Equipment
 A Study on Factorial Designs with Blocks Influence and Inspection Plan for Radiated Emission Testing of Information Technology Equipment By Kam-Fai Wong Department of Applied Mathematics National Sun Yat-sen
Solutions to Exercises
 1 c Atkinson et al 2007, Optimum Experimental Designs, with SAS Solutions to Exercises 1. and 2. Certainly, the solutions to these questions will be different for every reader. Examples of the techniques
Karnaugh Maps Objectives
 Karnaugh Maps Objectives For Karnaugh Maps of up to 5 variables Plot a function from algebraic, minterm or maxterm form Obtain minimum Sum of Products and Product of Sums Understand the relationship between
Two-Factor Full Factorial Design with Replications
 Two-Factor Full Factorial Design with Replications Dr. John Mellor-Crummey Department of Computer Science Rice University johnmc@cs.rice.edu COMP 58 Lecture 17 March 005 Goals for Today Understand Two-factor
Written Exam (2 hours)
") M. Müller Applied Analysis of Variance and Experimental Design Summer 2015 Written Exam (2 hours) General remarks: Open book exam. Switch off your mobile phone! Do not stay too long on a part where you
M. Müller Applied Analysis of Variance and Experimental Design Summer 2015 Written Exam (2 hours) General remarks: Open book exam. Switch off your mobile phone! Do not stay too long on a part where you
Chapter 30 Design and Analysis of
 Chapter 30 Design and Analysis of 2 k DOEs Introduction This chapter describes design alternatives and analysis techniques for conducting a DOE. Tables M1 to M5 in Appendix E can be used to create test
Optimize Your Process-Optimization Efforts
 1 Optimize Your Process-Optimization Efforts Highly efficient, statistically based methods can identify the vital few factors that affect process efficiency and product quality. Mark J. Anderson and Patrick
Exercise 1. min_sup = 0.3. Items support Type a 0.5 C b 0.7 C c 0.5 C d 0.9 C e 0.6 F
 Exercise 1 min_sup = 0.3 Items support Type a 0.5 C b 0.7 C c 0.5 C d 0.9 C e 0.6 F Items support Type ab 0.3 M ac 0.2 I ad 0.4 F ae 0.4 F bc 0.3 M bd 0.6 C be 0.4 F cd 0.4 C ce 0.2 I de 0.6 C Items support
Design & Analysis of Experiments 7E 2009 Montgomery
 Chapter 5 1 Introduction to Factorial Design Study the effects of 2 or more factors All possible combinations of factor levels are investigated For example, if there are a levels of factor A and b levels
Design and Analysis of Experiments
 Design and Analysis of Experiments Part VII: Fractional Factorial Designs Prof. Dr. Anselmo E de Oliveira anselmo.quimica.ufg.br anselmo.disciplinas@gmail.com 2 k : increasing k the number of runs required