Confidence Interval for the mean response
|
|
|
- Terence Small
- 6 years ago
- Views:
Transcription
1 Week 3: Prediction and Confidence Intervals at specified x. Testing lack of fit with replicates at some x's. Inference for the correlation. Introduction to regression with several explanatory variables. (ch10) [pp34-60] - ANOVA table and the F-test Confidence Interval for the mean response A level C CI for the mean response µ y when x takes value x* is where SE ˆ µ ˆ µ y * ± t SE ˆ µ * 1 ( x x) = s + n ( x x) and t * is the value for the t( n ) density curve with area C between -t* and t *. i 1
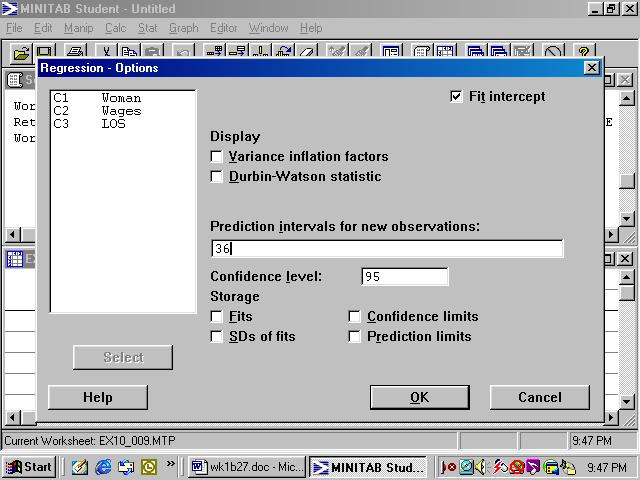
2 Regression Analysis: Wages versus LOS The regression equation is Wages = LOS Predictor Coef SE Coef T P Constant LOS S = R-Sq = 9.% R-Sq(adj) = 7.6% Analysis of Variance Source DF SS MS F P Regression Residual Error Total Unusual Observations Obs LOS Wages Fit SE Fit Residual St Resid R X R X X R denotes an observation with a large standardized residual. X denotes an observation whose X value gives it large influence. Predicted Values for New Observations New Obs Fit SE Fit 95% CI 95% PI (43.11, 50.57) (.58, 71.11) Values of Predictors for New Observations New Obs LOS

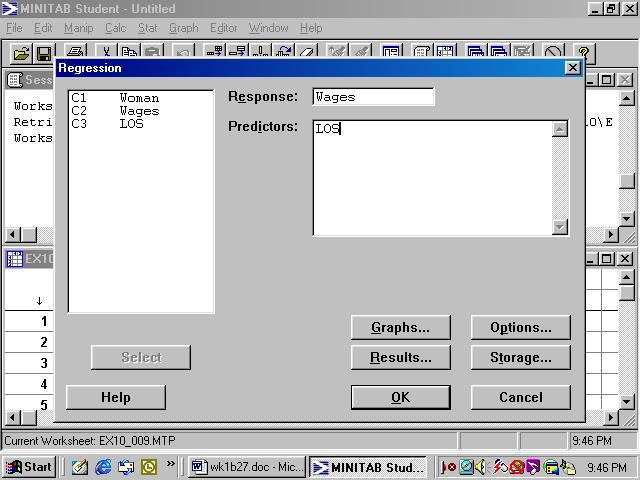
3 Minitab commands for prediction 3
4 4
5 Prediction Interval for a new observation A level C PI for a new observation with * x = x is where where yˆ * ± t SE y ˆ * 1 ( x x) = s 1+ + n ( x x) SE y ˆ and i t * is the value for the t( n ) density curve with area C between -t* and t *. Note SE ˆ ˆ µ = SE + MSE y 5
6 Example: Give a 95% PI for the wage of an employee with 3 years experience. (i.e LOS=36) Example: Give a 90% PI for the wage of an employee with 3 years experience. (i.e LOS=36) 6
7 Lack of Fit Test when there are replicated x- settings Ex Let x = amount calcium in diet, y = change in blood pressure over specified time period for each of 11 experimental subjects. Row x y y x
8 Regression Analysis The regression equation is y = x Predictor Coef StDev T P Constant x S = R-Sq = 87.9% R-Sq(adj) = 86.5% Analysis of Variance Source DF SS MS F P Regression Residual Error Total Do you think you should try amending your model? (quadratic model? Transformation?) Testing for the lack of fit of a linear model Step 1 Calculate Pure Error SS =6.5 and d.f pure error = 4 Step Calculate Lack of fit SS = SSE P. E SS = =3.55 and d.f. LOF = d.f Error d.f P.E. = 9 4 = 5 8
9 Step 3 Calculate MSLOF = SSLOF/d.f LOF =3.55/5 = and MSPE = SSPE./d.f P.E. = 6.5/4 = 1.65 Step 4 Calculate the test statistic F = MS LOF/MS P.E = 0.705/1.65 = 0.43 Step 5 Compare this value with the critical value from F(5,4). Regression Analysis: y versus x The regression equation is y = x Predictor Coef SE Coef T P Constant x S = R-Sq = 87.9% R-Sq(adj) = 86.5% Analysis of Variance Source DF SS MS F P Regression Residual Error Lack of Fit Pure Error Total rows with no replicates 9
10 Multiple regression The statistical model for multiple linear regression is y = β + β 0 1 x + β i i,1 x + β i, p x + ε i, p i for i = 1,,,n. The errors ε are independent and normally i distributed with mean 0 and std dev σ. -Interpretation of the regression coefficients -tests and CI s for β s -ANOVA table -ANOVA F-test -R-square = SSR = 1 SSE and SST SST R-sq(adj)= MSE ( n 1) 1 = 1 ( 1 R) MST n ( k+ 1) R-sq(adj) R-sq -estimate of σ = MSE 10
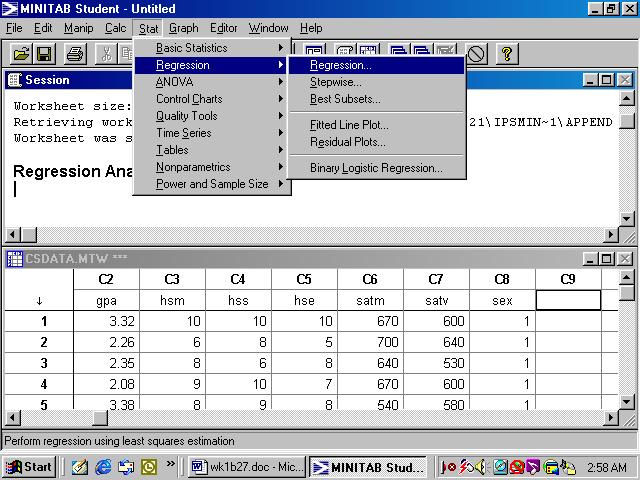
11 Example (CS data in data appendix in IPS CD) Regression Analysis The regression equation is gpa = satm satv hsm hss hse Predictor Coef StDev T P Constant satm satv hsm hss hse S = R-Sq = 1.1% R-Sq(adj) = 19.3% Analysis of Variance Source DF SS MS F P Regression Residual Error Total

12 Minitab commands for multiple regression 1
13 13
14 -Prediction Residual Analysis - We will use residuals for examining the following six types of departures from the model. - The regression is nonlinear - The error terms do not have constant variance - The error terms are not independent - The model fits but some outliers - The error terms are not normally distributed - One or more important variables have been omitted from the model Residual plots Residuals vs X or fitted values Residuals vs time (when the data are obtained in a time sequence) or other variables Residuals vs normal scores Stemplots, boxplots of residuals Plots of absolute values of the residuals (or squared residuals) against X or against Fitted values are also helpful in diagnosing nonconstancy of error variance. 14
15 Example. Residual analysis for the above example Residuals Versus the Fitted Values (response is gpa) 3 Standardized Residual Fitted Value Normal Probability Plot of the Residuals (response is gpa) 3 Normal Score Standardized Residual Histogram of the Residuals (response is gpa) Frequency Standardized Residual 15
Inference for the Regression Coefficient
 Inference for the Regression Coefficient Recall, b 0 and b 1 are the estimates of the slope β 1 and intercept β 0 of population regression line. We can shows that b 0 and b 1 are the unbiased estimates
Multiple Regression. Inference for Multiple Regression and A Case Study. IPS Chapters 11.1 and W.H. Freeman and Company
 Multiple Regression Inference for Multiple Regression and A Case Study IPS Chapters 11.1 and 11.2 2009 W.H. Freeman and Company Objectives (IPS Chapters 11.1 and 11.2) Multiple regression Data for multiple
Multiple Regression Examples
 Multiple Regression Examples Example: Tree data. we have seen that a simple linear regression of usable volume on diameter at chest height is not suitable, but that a quadratic model y = β 0 + β 1 x +
Model Building Chap 5 p251
 Model Building Chap 5 p251 Models with one qualitative variable, 5.7 p277 Example 4 Colours : Blue, Green, Lemon Yellow and white Row Blue Green Lemon Insects trapped 1 0 0 1 45 2 0 0 1 59 3 0 0 1 48 4
STA 108 Applied Linear Models: Regression Analysis Spring Solution for Homework #6
 STA 8 Applied Linear Models: Regression Analysis Spring 011 Solution for Homework #6 6. a) = 11 1 31 41 51 1 3 4 5 11 1 31 41 51 β = β1 β β 3 b) = 1 1 1 1 1 11 1 31 41 51 1 3 4 5 β = β 0 β1 β 6.15 a) Stem-and-leaf
Models with qualitative explanatory variables p216
 Models with qualitative explanatory variables p216 Example gen = 1 for female Row gpa hsm gen 1 3.32 10 0 2 2.26 6 0 3 2.35 8 0 4 2.08 9 0 5 3.38 8 0 6 3.29 10 0 7 3.21 8 0 8 2.00 3 0 9 3.18 9 0 10 2.34
Lecture 11 Multiple Linear Regression
 Lecture 11 Multiple Linear Regression STAT 512 Spring 2011 Background Reading KNNL: 6.1-6.5 11-1 Topic Overview Review: Multiple Linear Regression (MLR) Computer Science Case Study 11-2 Multiple Regression
Basic Business Statistics, 10/e
 Chapter 4 4- Basic Business Statistics th Edition Chapter 4 Introduction to Multiple Regression Basic Business Statistics, e 9 Prentice-Hall, Inc. Chap 4- Learning Objectives In this chapter, you learn:
Chapter 6 Multiple Regression
 STAT 525 FALL 2018 Chapter 6 Multiple Regression Professor Min Zhang The Data and Model Still have single response variable Y Now have multiple explanatory variables Examples: Blood Pressure vs Age, Weight,
1-Way ANOVA MATH 143. Spring Department of Mathematics and Statistics Calvin College
 1-Way ANOVA MATH 143 Department of Mathematics and Statistics Calvin College Spring 2010 The basic ANOVA situation Two variables: 1 Categorical, 1 Quantitative Main Question: Do the (means of) the quantitative
ANOVA: Analysis of Variation
 ANOVA: Analysis of Variation The basic ANOVA situation Two variables: 1 Categorical, 1 Quantitative Main Question: Do the (means of) the quantitative variables depend on which group (given by categorical
28. SIMPLE LINEAR REGRESSION III
 28. SIMPLE LINEAR REGRESSION III Fitted Values and Residuals To each observed x i, there corresponds a y-value on the fitted line, y = βˆ + βˆ x. The are called fitted values. ŷ i They are the values of
Inference for Regression Inference about the Regression Model and Using the Regression Line
 Inference for Regression Inference about the Regression Model and Using the Regression Line PBS Chapter 10.1 and 10.2 2009 W.H. Freeman and Company Objectives (PBS Chapter 10.1 and 10.2) Inference about
Lecture 13 Extra Sums of Squares
 Lecture 13 Extra Sums of Squares STAT 512 Spring 2011 Background Reading KNNL: 7.1-7.4 13-1 Topic Overview Extra Sums of Squares (Defined) Using and Interpreting R 2 and Partial-R 2 Getting ESS and Partial-R
INFERENCE FOR REGRESSION
 CHAPTER 3 INFERENCE FOR REGRESSION OVERVIEW In Chapter 5 of the textbook, we first encountered regression. The assumptions that describe the regression model we use in this chapter are the following. We
Analysis of Bivariate Data
 Analysis of Bivariate Data Data Two Quantitative variables GPA and GAES Interest rates and indices Tax and fund allocation Population size and prison population Bivariate data (x,y) Case corr® 2 Independent
Basic Business Statistics 6 th Edition
 Basic Business Statistics 6 th Edition Chapter 12 Simple Linear Regression Learning Objectives In this chapter, you learn: How to use regression analysis to predict the value of a dependent variable based
Ch 13 & 14 - Regression Analysis
 Ch 3 & 4 - Regression Analysis Simple Regression Model I. Multiple Choice:. A simple regression is a regression model that contains a. only one independent variable b. only one dependent variable c. more
Orthogonal contrasts for a 2x2 factorial design Example p130
 Week 9: Orthogonal comparisons for a 2x2 factorial design. The general two-factor factorial arrangement. Interaction and additivity. ANOVA summary table, tests, CIs. Planned/post-hoc comparisons for the
23. Inference for regression
 23. Inference for regression The Practice of Statistics in the Life Sciences Third Edition 2014 W. H. Freeman and Company Objectives (PSLS Chapter 23) Inference for regression The regression model Confidence
Multiple Linear Regression
 Multiple Linear Regression Simple linear regression tries to fit a simple line between two variables Y and X. If X is linearly related to Y this explains some of the variability in Y. In most cases, there
Steps for Regression. Simple Linear Regression. Data. Example. Residuals vs. X. Scatterplot. Make a Scatter plot Does it make sense to plot a line?
 Steps for Regression Simple Linear Regression Make a Scatter plot Does it make sense to plot a line? Check Residual Plot (Residuals vs. X) Are there any patterns? Check Histogram of Residuals Is it Normal?
Statistiek II. John Nerbonne. March 17, Dept of Information Science incl. important reworkings by Harmut Fitz
 Dept of Information Science j.nerbonne@rug.nl incl. important reworkings by Harmut Fitz March 17, 2015 Review: regression compares result on two distinct tests, e.g., geographic and phonetic distance of
SMAM 319 Exam 1 Name. 1.Pick the best choice for the multiple choice questions below (10 points 2 each)
") SMAM 319 Exam 1 Name 1.Pick the best choice for the multiple choice questions below (10 points 2 each) A b In Metropolis there are some houses for sale. Superman and Lois Lane are interested in the average
SMAM 319 Exam 1 Name 1.Pick the best choice for the multiple choice questions below (10 points 2 each) A b In Metropolis there are some houses for sale. Superman and Lois Lane are interested in the average
Histogram of Residuals. Residual Normal Probability Plot. Reg. Analysis Check Model Utility. (con t) Check Model Utility. Inference.
 Check Model Utility. Inference.") Steps for Regression Simple Linear Regression Make a Scatter plot Does it make sense to plot a line? Check Residual Plot (Residuals vs. X) Are there any patterns? Check Histogram of Residuals Is it Normal?
Steps for Regression Simple Linear Regression Make a Scatter plot Does it make sense to plot a line? Check Residual Plot (Residuals vs. X) Are there any patterns? Check Histogram of Residuals Is it Normal?
Simple Linear Regression. Steps for Regression. Example. Make a Scatter plot. Check Residual Plot (Residuals vs. X)
") Simple Linear Regression 1 Steps for Regression Make a Scatter plot Does it make sense to plot a line? Check Residual Plot (Residuals vs. X) Are there any patterns? Check Histogram of Residuals Is it Normal?
Simple Linear Regression 1 Steps for Regression Make a Scatter plot Does it make sense to plot a line? Check Residual Plot (Residuals vs. X) Are there any patterns? Check Histogram of Residuals Is it Normal?
Lecture 18: Simple Linear Regression
 Lecture 18: Simple Linear Regression BIOS 553 Department of Biostatistics University of Michigan Fall 2004 The Correlation Coefficient: r The correlation coefficient (r) is a number that measures the strength
Inference for Regression Simple Linear Regression
 Inference for Regression Simple Linear Regression IPS Chapter 10.1 2009 W.H. Freeman and Company Objectives (IPS Chapter 10.1) Simple linear regression p Statistical model for linear regression p Estimating
The simple linear regression model discussed in Chapter 13 was written as
 1519T_c14 03/27/2006 07:28 AM Page 614 Chapter Jose Luis Pelaez Inc/Blend Images/Getty Images, Inc./Getty Images, Inc. 14 Multiple Regression 14.1 Multiple Regression Analysis 14.2 Assumptions of the Multiple
Lecture 10 Multiple Linear Regression
 Lecture 10 Multiple Linear Regression STAT 512 Spring 2011 Background Reading KNNL: 6.1-6.5 10-1 Topic Overview Multiple Linear Regression Model 10-2 Data for Multiple Regression Y i is the response variable
Multiple Regression Methods
 Chapter 1: Multiple Regression Methods Hildebrand, Ott and Gray Basic Statistical Ideas for Managers Second Edition 1 Learning Objectives for Ch. 1 The Multiple Linear Regression Model How to interpret
SMAM 314 Practice Final Examination Winter 2003
 SMAM 314 Practice Final Examination Winter 2003 You may use your textbook, one page of notes and a calculator. Please hand in the notes with your exam. 1. Mark the following statements True T or False
LINEAR REGRESSION ANALYSIS. MODULE XVI Lecture Exercises
 LINEAR REGRESSION ANALYSIS MODULE XVI Lecture - 44 Exercises Dr. Shalabh Department of Mathematics and Statistics Indian Institute of Technology Kanpur Exercise 1 The following data has been obtained on
Regression Analysis. Regression: Methodology for studying the relationship among two or more variables
 Regression Analysis Regression: Methodology for studying the relationship among two or more variables Two major aims: Determine an appropriate model for the relationship between the variables Predict the
STAT 360-Linear Models
 STAT 360-Linear Models Instructor: Yogendra P. Chaubey Sample Test Questions Fall 004 Note: The following questions are from previous tests and exams. The final exam will be for three hours and will contain
Inferences for linear regression (sections 12.1, 12.2)
") Inferences for linear regression (sections 12.1, 12.2) Regression case history: do bigger national parks help prevent extinction? ex. area of natural reserves and extinction: 6 national parks in Tanzania
Inferences for linear regression (sections 12.1, 12.2) Regression case history: do bigger national parks help prevent extinction? ex. area of natural reserves and extinction: 6 national parks in Tanzania
SMAM 314 Computer Assignment 5 due Nov 8,2012 Data Set 1. For each of the following data sets use Minitab to 1. Make a scatterplot.
 SMAM 314 Computer Assignment 5 due Nov 8,2012 Data Set 1. For each of the following data sets use Minitab to 1. Make a scatterplot. 2. Fit the linear regression line. Regression Analysis: y versus x y
Introduction to Regression
 Introduction to Regression Using Mult Lin Regression Derived variables Many alternative models Which model to choose? Model Criticism Modelling Objective Model Details Data and Residuals Assumptions 1
Chapter 14. Multiple Regression Models. Multiple Regression Models. Multiple Regression Models
 Chapter 14 Multiple Regression Models 1 Multiple Regression Models A general additive multiple regression model, which relates a dependent variable y to k predictor variables,,, is given by the model equation
[4+3+3] Q 1. (a) Describe the normal regression model through origin. Show that the least square estimator of the regression parameter is given by
![[4+3+3] Q 1. (a) Describe the normal regression model through origin. Show that the least square estimator of the regression parameter is given by](/thumbs/75/71895393.jpg "[4+3+3] Q 1. (a) Describe the normal regression model through origin. Show that the least square estimator of the regression parameter is given by") Concordia University Department of Mathematics and Statistics Course Number Section Statistics 360/1 40 Examination Date Time Pages Final June 2004 3 hours 7 Instructors Course Examiner Marks Y.P. Chaubey
Concordia University Department of Mathematics and Statistics Course Number Section Statistics 360/1 40 Examination Date Time Pages Final June 2004 3 hours 7 Instructors Course Examiner Marks Y.P. Chaubey
sociology 362 regression
 sociology 36 regression Regression is a means of modeling how the conditional distribution of a response variable (say, Y) varies for different values of one or more independent explanatory variables (say,
SMAM 314 Exam 42 Name
 SMAM 314 Exam 42 Name Mark the following statements True (T) or False (F) (10 points) 1. F A. The line that best fits points whose X and Y values are negatively correlated should have a positive slope.
Correlation & Simple Regression
 Chapter 11 Correlation & Simple Regression The previous chapter dealt with inference for two categorical variables. In this chapter, we would like to examine the relationship between two quantitative variables.
School of Mathematical Sciences. Question 1
 School of Mathematical Sciences MTH5120 Statistical Modelling I Practical 8 and Assignment 7 Solutions Question 1 Figure 1: The residual plots do not contradict the model assumptions of normality, constant
The Multiple Regression Model
 Multiple Regression The Multiple Regression Model Idea: Examine the linear relationship between 1 dependent (Y) & or more independent variables (X i ) Multiple Regression Model with k Independent Variables:
Concordia University (5+5)Q 1.
Q 1.") (5+5)Q 1. Concordia University Department of Mathematics and Statistics Course Number Section Statistics 360/1 40 Examination Date Time Pages Mid Term Test May 26, 2004 Two Hours 3 Instructor Course Examiner
(5+5)Q 1. Concordia University Department of Mathematics and Statistics Course Number Section Statistics 360/1 40 Examination Date Time Pages Mid Term Test May 26, 2004 Two Hours 3 Instructor Course Examiner
Inference for Regression Inference about the Regression Model and Using the Regression Line, with Details. Section 10.1, 2, 3
 Inference for Regression Inference about the Regression Model and Using the Regression Line, with Details Section 10.1, 2, 3 Basic components of regression setup Target of inference: linear dependency
Ch Inference for Linear Regression
 Ch. 12-1 Inference for Linear Regression ACT = 6.71 + 5.17(GPA) For every increase of 1 in GPA, we predict the ACT score to increase by 5.17. population regression line β (true slope) μ y = α + βx mean
ECO220Y Simple Regression: Testing the Slope
 ECO220Y Simple Regression: Testing the Slope Readings: Chapter 18 (Sections 18.3-18.5) Winter 2012 Lecture 19 (Winter 2012) Simple Regression Lecture 19 1 / 32 Simple Regression Model y i = β 0 + β 1 x
Start with review, some new definitions, and pictures on the white board. Assumptions in the Normal Linear Regression Model
 Start with review, some new definitions, and pictures on the white board. Assumptions in the Normal Linear Regression Model A1: There is a linear relationship between X and Y. A2: The error terms (and
PART I. (a) Describe all the assumptions for a normal error regression model with one predictor variable,
 Describe all the assumptions for a normal error regression model with one predictor variable,") Concordia University Department of Mathematics and Statistics Course Number Section Statistics 360/2 01 Examination Date Time Pages Final December 2002 3 hours 6 Instructors Course Examiner Marks Y.P.
Concordia University Department of Mathematics and Statistics Course Number Section Statistics 360/2 01 Examination Date Time Pages Final December 2002 3 hours 6 Instructors Course Examiner Marks Y.P.
Estimating σ 2. We can do simple prediction of Y and estimation of the mean of Y at any value of X.
 Estimating σ 2 We can do simple prediction of Y and estimation of the mean of Y at any value of X. To perform inferences about our regression line, we must estimate σ 2, the variance of the error term.
sociology 362 regression
 sociology 36 regression Regression is a means of studying how the conditional distribution of a response variable (say, Y) varies for different values of one or more independent explanatory variables (say,
1 Introduction to Minitab
 1 Introduction to Minitab Minitab is a statistical analysis software package. The software is freely available to all students and is downloadable through the Technology Tab at my.calpoly.edu. When you
assumes a linear relationship between mean of Y and the X s with additive normal errors the errors are assumed to be a sample from N(0, σ 2 )
") Multiple Linear Regression is used to relate a continuous response (or dependent) variable Y to several explanatory (or independent) (or predictor) variables X 1, X 2,, X k assumes a linear relationship
Multiple Linear Regression is used to relate a continuous response (or dependent) variable Y to several explanatory (or independent) (or predictor) variables X 1, X 2,, X k assumes a linear relationship
Stat 529 (Winter 2011) A simple linear regression (SLR) case study. Mammals brain weights and body weights
 A simple linear regression (SLR) case study. Mammals brain weights and body weights") Stat 529 (Winter 2011) A simple linear regression (SLR) case study Reading: Sections 8.1 8.4, 8.6, 8.7 Mammals brain weights and body weights Questions of interest Scatterplots of the data Log transforming
Stat 529 (Winter 2011) A simple linear regression (SLR) case study Reading: Sections 8.1 8.4, 8.6, 8.7 Mammals brain weights and body weights Questions of interest Scatterplots of the data Log transforming
TMA4255 Applied Statistics V2016 (5)
") TMA4255 Applied Statistics V2016 (5) Part 2: Regression Simple linear regression [11.1-11.4] Sum of squares [11.5] Anna Marie Holand To be lectured: January 26, 2016 wiki.math.ntnu.no/tma4255/2016v/start
TMA4255 Applied Statistics V2016 (5) Part 2: Regression Simple linear regression [11.1-11.4] Sum of squares [11.5] Anna Marie Holand To be lectured: January 26, 2016 wiki.math.ntnu.no/tma4255/2016v/start
This document contains 3 sets of practice problems.
 P RACTICE PROBLEMS This document contains 3 sets of practice problems. Correlation: 3 problems Regression: 4 problems ANOVA: 8 problems You should print a copy of these practice problems and bring them
Chapter 15 Multiple Regression
 Multiple Regression Learning Objectives 1. Understand how multiple regression analysis can be used to develop relationships involving one dependent variable and several independent variables. 2. Be able
General Linear Model (Chapter 4)
") General Linear Model (Chapter 4) Outcome variable is considered continuous Simple linear regression Scatterplots OLS is BLUE under basic assumptions MSE estimates residual variance testing regression coefficients
General Linear Model (Chapter 4) Outcome variable is considered continuous Simple linear regression Scatterplots OLS is BLUE under basic assumptions MSE estimates residual variance testing regression coefficients
Residual Analysis for two-way ANOVA The twoway model with K replicates, including interaction,
 Residual Analysis for two-way ANOVA The twoway model with K replicates, including interaction, is Y ijk = µ ij + ɛ ijk = µ + α i + β j + γ ij + ɛ ijk with i = 1,..., I, j = 1,..., J, k = 1,..., K. In carrying
SMAM 319 Exam1 Name. a B.The equation of a line is 3x + y =6. The slope is a. -3 b.3 c.6 d.1/3 e.-1/3
 SMAM 319 Exam1 Name 1. Pick the best choice. (10 points-2 each) _c A. A data set consisting of fifteen observations has the five number summary 4 11 12 13 15.5. For this data set it is definitely true
EX1. One way ANOVA: miles versus Plug. a) What are the hypotheses to be tested? b) What are df 1 and df 2? Verify by hand. , y 3
 What are the hypotheses to be tested? b) What are df 1 and df 2? Verify by hand. , y 3") EX. Chapter 8 Examples In an experiment to investigate the performance of four different brands of spark plugs intended for the use on a motorcycle, plugs of each brand were tested and the number of miles
EX. Chapter 8 Examples In an experiment to investigate the performance of four different brands of spark plugs intended for the use on a motorcycle, plugs of each brand were tested and the number of miles
Lecture 1 Linear Regression with One Predictor Variable.p2
 Lecture Linear Regression with One Predictor Variablep - Basics - Meaning of regression parameters p - β - the slope of the regression line -it indicates the change in mean of the probability distn of
Statistics for Managers using Microsoft Excel 6 th Edition
 Statistics for Managers using Microsoft Excel 6 th Edition Chapter 13 Simple Linear Regression 13-1 Learning Objectives In this chapter, you learn: How to use regression analysis to predict the value of
Simple Linear Regression: A Model for the Mean. Chap 7
 Simple Linear Regression: A Model for the Mean Chap 7 An Intermediate Model (if the groups are defined by values of a numeric variable) Separate Means Model Means fall on a straight line function of the
UNIVERSITY OF TORONTO SCARBOROUGH Department of Computer and Mathematical Sciences Midterm Test, October 2013
 UNIVERSITY OF TORONTO SCARBOROUGH Department of Computer and Mathematical Sciences Midterm Test, October 2013 STAC67H3 Regression Analysis Duration: One hour and fifty minutes Last Name: First Name: Student
Lecture 11: Simple Linear Regression
 Lecture 11: Simple Linear Regression Readings: Sections 3.1-3.3, 11.1-11.3 Apr 17, 2009 In linear regression, we examine the association between two quantitative variables. Number of beers that you drink
1 Use of indicator random variables. (Chapter 8)
") 1 Use of indicator random variables. (Chapter 8) let I(A) = 1 if the event A occurs, and I(A) = 0 otherwise. I(A) is referred to as the indicator of the event A. The notation I A is often used. 1 2 Fitting
1 Use of indicator random variables. (Chapter 8) let I(A) = 1 if the event A occurs, and I(A) = 0 otherwise. I(A) is referred to as the indicator of the event A. The notation I A is often used. 1 2 Fitting
(1) The explanatory or predictor variables may be qualitative. (We ll focus on examples where this is the case.)
 The explanatory or predictor variables may be qualitative. (We ll focus on examples where this is the case.)") Introduction to Analysis of Variance Analysis of variance models are similar to regression models, in that we re interested in learning about the relationship between a dependent variable (a response)
Introduction to Analysis of Variance Analysis of variance models are similar to regression models, in that we re interested in learning about the relationship between a dependent variable (a response)
Chapter 14 Multiple Regression Analysis
 Chapter 14 Multiple Regression Analysis 1. a. Multiple regression equation b. the Y-intercept c. $374,748 found by Y ˆ = 64,1 +.394(796,) + 9.6(694) 11,6(6.) (LO 1) 2. a. Multiple regression equation b.
Q Lecture Introduction to Regression
 Q3 2009 1 Before/After Transformation 2 Construction Role of T-ratios Formally, even under Null Hyp: H : 0, ˆ, being computed from k t k SE ˆ ˆ y values themselves containing random error, will sometimes
Inferences for Regression
 Inferences for Regression An Example: Body Fat and Waist Size Looking at the relationship between % body fat and waist size (in inches). Here is a scatterplot of our data set: Remembering Regression In
School of Mathematical Sciences. Question 1. Best Subsets Regression
 School of Mathematical Sciences MTH5120 Statistical Modelling I Practical 9 and Assignment 8 Solutions Question 1 Best Subsets Regression Response is Crime I n W c e I P a n A E P U U l e Mallows g E P
Mathematics for Economics MA course
 Mathematics for Economics MA course Simple Linear Regression Dr. Seetha Bandara Simple Regression Simple linear regression is a statistical method that allows us to summarize and study relationships between
Institutionen för matematik och matematisk statistik Umeå universitet November 7, Inlämningsuppgift 3. Mariam Shirdel
 Institutionen för matematik och matematisk statistik Umeå universitet November 7, 2011 Inlämningsuppgift 3 Mariam Shirdel (mash0007@student.umu.se) Kvalitetsteknik och försöksplanering, 7.5 hp 1 Uppgift
Formal Statement of Simple Linear Regression Model
 Formal Statement of Simple Linear Regression Model Y i = β 0 + β 1 X i + ɛ i Y i value of the response variable in the i th trial β 0 and β 1 are parameters X i is a known constant, the value of the predictor
Multiple Regression an Introduction. Stat 511 Chap 9
 Multiple Regression an Introduction Stat 511 Chap 9 1 case studies meadowfoam flowers brain size of mammals 2 case study 1: meadowfoam flowering designed experiment carried out in a growth chamber general
Chapter 14 Student Lecture Notes Department of Quantitative Methods & Information Systems. Business Statistics. Chapter 14 Multiple Regression
 Chapter 14 Student Lecture Notes 14-1 Department of Quantitative Methods & Information Systems Business Statistics Chapter 14 Multiple Regression QMIS 0 Dr. Mohammad Zainal Chapter Goals After completing
Simple Linear Regression Using Ordinary Least Squares
 Simple Linear Regression Using Ordinary Least Squares Purpose: To approximate a linear relationship with a line. Reason: We want to be able to predict Y using X. Definition: The Least Squares Regression
Acknowledgements. Outline. Marie Diener-West. ICTR Leadership / Team INTRODUCTION TO CLINICAL RESEARCH. Introduction to Linear Regression
 INTRODUCTION TO CLINICAL RESEARCH Introduction to Linear Regression Karen Bandeen-Roche, Ph.D. July 17, 2012 Acknowledgements Marie Diener-West Rick Thompson ICTR Leadership / Team JHU Intro to Clinical
Chapter 4. Regression Models. Learning Objectives
 Chapter 4 Regression Models To accompany Quantitative Analysis for Management, Eleventh Edition, by Render, Stair, and Hanna Power Point slides created by Brian Peterson Learning Objectives After completing
Lecture 9: Linear Regression
 Lecture 9: Linear Regression Goals Develop basic concepts of linear regression from a probabilistic framework Estimating parameters and hypothesis testing with linear models Linear regression in R Regression
Topic 14: Inference in Multiple Regression
 Topic 14: Inference in Multiple Regression Outline Review multiple linear regression Inference of regression coefficients Application to book example Inference of mean Application to book example Inference
Is economic freedom related to economic growth?
 Is economic freedom related to economic growth? It is an article of faith among supporters of capitalism: economic freedom leads to economic growth. The publication Economic Freedom of the World: 2003
Multiple Regression: Chapter 13. July 24, 2015
 Multiple Regression: Chapter 13 July 24, 2015 Multiple Regression (MR) Response Variable: Y - only one response variable (quantitative) Several Predictor Variables: X 1, X 2, X 3,..., X p (p = # predictors)
Data Set 8: Laysan Finch Beak Widths
 Data Set 8: Finch Beak Widths Statistical Setting This handout describes an analysis of covariance (ANCOVA) involving one categorical independent variable (with only two levels) and one quantitative covariate.
Chapter 14 Student Lecture Notes 14-1
 Chapter 14 Student Lecture Notes 14-1 Business Statistics: A Decision-Making Approach 6 th Edition Chapter 14 Multiple Regression Analysis and Model Building Chap 14-1 Chapter Goals After completing this
Stat 501, F. Chiaromonte. Lecture #8
 Stat 501, F. Chiaromonte Lecture #8 Data set: BEARS.MTW In the minitab example data sets (for description, get into the help option and search for "Data Set Description"). Wild bears were anesthetized,
Correlation and Regression
 Correlation and Regression Dr. Bob Gee Dean Scott Bonney Professor William G. Journigan American Meridian University 1 Learning Objectives Upon successful completion of this module, the student should
SIMPLE REGRESSION ANALYSIS. Business Statistics
 SIMPLE REGRESSION ANALYSIS Business Statistics CONTENTS Ordinary least squares (recap for some) Statistical formulation of the regression model Assessing the regression model Testing the regression coefficients
Introduction to Regression
 Introduction to Regression Using Mult Lin Regression Derived variables Many alternative models Which model to choose? Model Criticism Modelling Objective Model Details Data and Residuals Assumptions 1
Analysis of Covariance. The following example illustrates a case where the covariate is affected by the treatments.
 Analysis of Covariance In some experiments, the experimental units (subjects) are nonhomogeneous or there is variation in the experimental conditions that are not due to the treatments. For example, a
Chapter 12: Multiple Regression
 Chapter 12: Multiple Regression 12.1 a. A scatterplot of the data is given here: Plot of Drug Potency versus Dose Level Potency 0 5 10 15 20 25 30 0 5 10 15 20 25 30 35 Dose Level b. ŷ = 8.667 + 0.575x
Describing distributions with numbers
 Describing distributions with numbers A large number or numerical methods are available for describing quantitative data sets. Most of these methods measure one of two data characteristics: The central
Ch 2: Simple Linear Regression
 Ch 2: Simple Linear Regression 1. Simple Linear Regression Model A simple regression model with a single regressor x is y = β 0 + β 1 x + ɛ, where we assume that the error ɛ is independent random component
2.4.3 Estimatingσ Coefficient of Determination 2.4. ASSESSING THE MODEL 23
 2.4. ASSESSING THE MODEL 23 2.4.3 Estimatingσ 2 Note that the sums of squares are functions of the conditional random variables Y i = (Y X = x i ). Hence, the sums of squares are random variables as well.
One-Way Analysis of Variance (ANOVA)
") 1 One-Way Analysis of Variance (ANOVA) One-Way Analysis of Variance (ANOVA) is a method for comparing the means of a populations. This kind of problem arises in two different settings 1. When a independent
1 One-Way Analysis of Variance (ANOVA) One-Way Analysis of Variance (ANOVA) is a method for comparing the means of a populations. This kind of problem arises in two different settings 1. When a independent
Econ 3790: Business and Economics Statistics. Instructor: Yogesh Uppal
 Econ 3790: Business and Economics Statistics Instructor: Yogesh Uppal yuppal@ysu.edu Sampling Distribution of b 1 Expected value of b 1 : Variance of b 1 : E(b 1 ) = 1 Var(b 1 ) = σ 2 /SS x Estimate of
10 Model Checking and Regression Diagnostics
 10 Model Checking and Regression Diagnostics The simple linear regression model is usually written as i = β 0 + β 1 i + ɛ i where the ɛ i s are independent normal random variables with mean 0 and variance