Leveraging Sentinel-1 time-series data for mapping agricultural land cover and land use in the tropics
|
|
|
- John Rodgers
- 5 years ago
- Views:
Transcription

1 Leveraging Sentinel-1 time-series data for mapping agricultural land cover and land use in the tropics Caitlin Descartes Labs
2 Overview What is Descartes Labs? Who am I? A (brief) overview of SAR data Case study: rice in Mekong River Delta
3 Overview What is Descartes Labs? Who am I? A (brief) overview of SAR data Case study: rice in Mekong River Delta


4 Who we are Who are we? o New Mexico-based startup spun out of Los Alamos National Lab in December 2014 o Machine learning, computer vision, satellite imagery o Team of 30+ physicists, philosophers, mathematicians, software engineers, and geographers o Acquire, process, and store imagery (NASA, ESA, Planet) o Building a living atlas of the world: persistent, real-time, multi-modal o First application: global, real-time forecasts of commodity agriculture


5 Who we are MODIS daily 250m/pixel Landsat weekly 30m/pixel Planet RapidEye monthly 5m/pixel Sentinel-2 weekly 10m/pixel Sentinel-1 weekly 20m/pixel
6 Who we are MODIS daily 250m/pixel Landsat weekly 30m/pixel Planet RapidEye monthly 5m/pixel Sentinel-2 weekly 10m/pixel Sentinel-1 weekly 20m/pixel
7 Overview What is Descartes Labs? Who am I? A (brief) overview of SAR data Case study: rice in Mekong River Delta

8 Who am I? Who am I? o PhD in Geography from University of Wisconsin at Madison in 2016 o Used Landsat to study land cover and land use changes in southern Vietnam & CERES-Rice to investigate possible impacts of climate change to rice o Spent every February/March in the Mekong River Delta during graduate school collecting ground-truth data and conducting farmer interviews o Joined the engineering team at Descartes Labs in November of 2015 o Big fan of SAR data!
9 Overview What is Descartes Labs? Who am I? A (brief) overview of SAR data Case study: rice in Mekong River Delta

10 SAR overview What is synthetic aperture radar (SAR) image: Sentinel 1 composite from maps.descarteslabs.com
 o 20-meter spatial resolution o VV, VH, HH, HV capabilities that vary by region and temporal")
11 SAR overview Sentinel 1 satellite o Launched by European Space Agency in 2014 o C band ( cm) o 20-meter spatial resolution o VV, VH, HH, HV capabilities that vary by region and temporal cycle o Free!


12 SAR overview Mosaic of Landsat 8 imagery over Borneo: December 2016 Mosaic of Sentinel 1A imagery over Borneo: December 2016
13 Overview What is Descartes Labs? Who am I? A (brief) overview of SAR data Case study: rice in Mekong River Delta


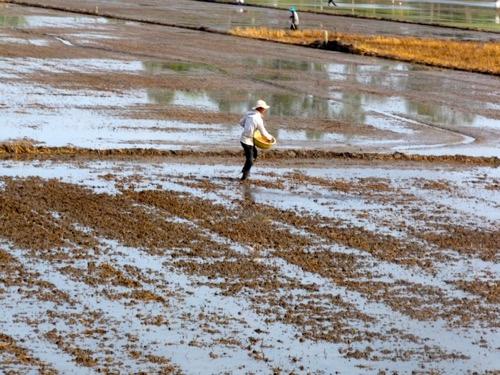
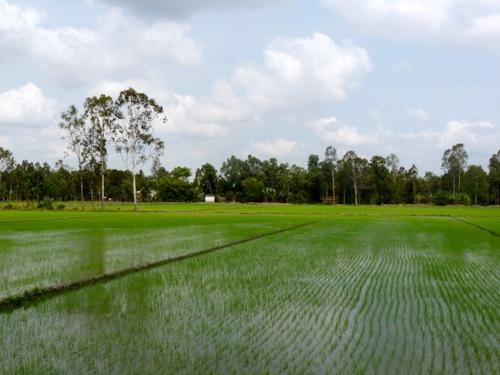
14 Case study: Vietnamese Mekong River Delta image: Landsat 8 composite at maps.descarteslabs.com
15 Vietnam is one of world s largest exporters of rice

16 Vietnam is one of world s largest exporters of rice and nearly all of it is grown in the densely populated Mekong River Delta.
 Declining yields are correlated with rising nighttime temperatures (Peng et al. 2004) Volatile!")
17 Why should we care about rice? o o o o Over 20% of the global calorie supply (Dawe et al. 2010) Staple grain for over 900 million people who live on less than $1.25 per day (Dawe et al. 2010) Declining yields are correlated with rising nighttime temperatures (Peng et al. 2004) Volatile! 80% of trade is controlled by 5 countries

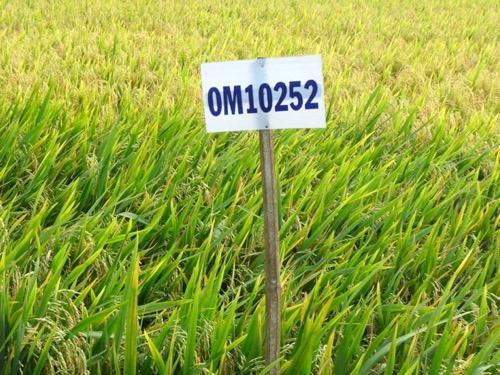
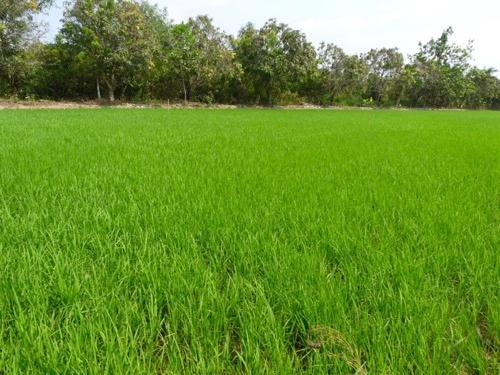
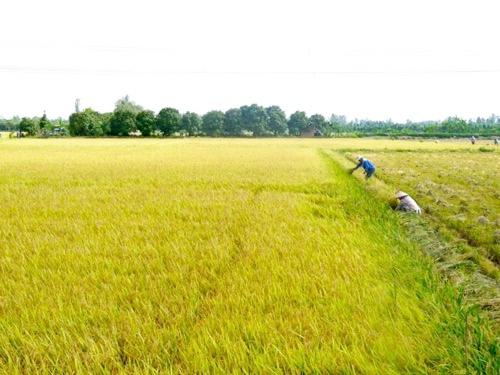
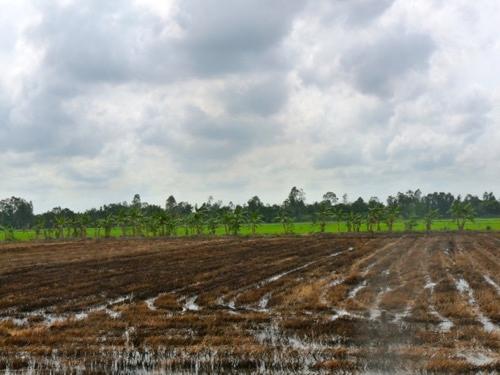
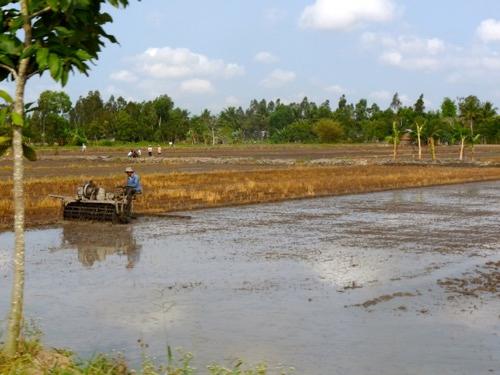
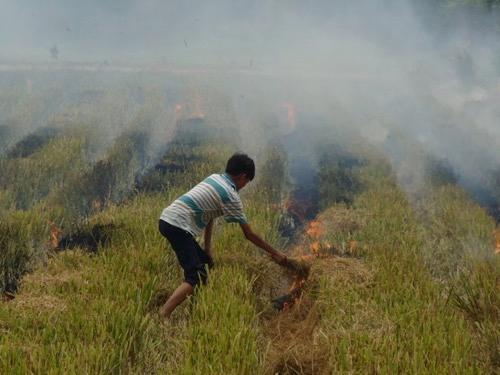
18 Rice phenology
19 Proof of concept: image thresholding Minimum VV backscatter: 2015 growing season threshold the lowest 20% of values since rice paddies are flooded prior to planting
20 Proof of concept: image thresholding Minimum VV backscatter: 2015 growing season Mean VV backscatter: 2015 growing season threshold the lowest 20% of values since rice paddies are flooded prior to planting threshold the highest 45% of values since as rice grows the backscatter will increase


21 Proof of concept: image thresholding Minimum VV backscatter: 2015 growing season Mean VV backscatter: 2015 growing season Estimated extent of rice paddy for Can Tho Province threshold the lowest 20% of values since rice paddies are flooded prior to planting threshold the highest 45% of values since as rice grows the backscatter will increase 93.3% overall accuracy when compared to 150 random points
22 Next steps: classification with machine-learning
23 Generate temporal statistics for the 2015 growing season for VV and VH backscatter

24 Generate temporal statistics for the 2015 growing season for VV and VH backscatter
25 Create and label a random sample of points o o Label with high resolution Google Earth imagery 129 non-rice points & 133 rice points

26 Create and label a random sample of points o o Label with high resolution Google Earth imagery 129 non-rice points & 133 rice points Split into testing & training data o 70% to training; 30% for testing
27 Extract feature data from image statistics for each point to build and train a random forest classifier o o o Tune the parameters Apply to test data Apply to full image set

28 Extract feature data from image statistics for each point to build and train a random forest classifier o o o Tune the parameters Apply to test data Apply to full image set Classification Rice Not rice Total Producer s accuracy Rice % Not rice % Truth Total User s accuracy 98.5% 99.2% 98.9%
29 Classifying the number of rice harvests per growing season

30 Season winter - spring summer - autumn autumn - winter Planting date mid-october mid-march mid-july
31 Ideal signature (over a single year) Single-cropped rice Double-cropped rice Triple-cropped rice
32 Ideal signature (over a single year) Single-cropped rice Actual Landsat EVI signature (over a three year period) Double-cropped rice Triple-cropped rice


33 2015 winter-spring rice paddy extent 2015 summer-autumn rice paddy extent 2015 autumn-winter rice paddy extent 414,000+ hectares 453,600+ hectares 188,000+ hectares

34 Future work 1. Validate annual number of harvests estimates 2. Incorporate Sentinel-1B data to move toward real-time monitoring of rice management 3. Field-level analysis Use the Descartes Labs edge detection algorithm, which uses dense time stacks of SAR data to identify boundaries, to classify land cover/use at the field scale

35 Thanks! Come join us in New Mexico. We re hiring! or join our developer newsletter!
GEO Joint Experiment for Crop Assessment and Monitoring (JECAM): 2014 Site Progress Report
: 2014 Site Progress Report") GEO Joint Experiment for Crop Assessment and Monitoring (JECAM): JECAM Test Site Name: China - Guangdong 2014 Site Progress Report Team Leader and Members: Prof Wu Bingfang (Leader), Jiratiwan Kruasilp,
GEO Joint Experiment for Crop Assessment and Monitoring (JECAM): JECAM Test Site Name: China - Guangdong 2014 Site Progress Report Team Leader and Members: Prof Wu Bingfang (Leader), Jiratiwan Kruasilp,
FLOOD ANALYSIS USING SATELLITE DATA AND GEOMORPHOLOGICAL SURVEY MAP SHOWING CLASSIFICATION OF FLOOD-INUNDATED AREAS
 FLOOD ANALYSIS USING SATELLITE DATA AND GEOMORPHOLOGICAL SURVEY MAP SHOWING CLASSIFICATION OF FLOOD-INUNDATED AREAS Yasuharu YAMADA* *Japan International Research Center for Agricultural Sciences (JIRCAS),
Effective Utilization of Synthetic Aperture Radar (SAR) Imagery in Rapid Damage Assessment
 Imagery in Rapid Damage Assessment") Effective Utilization of Synthetic Aperture Radar (SAR) Imagery in Rapid Damage Assessment Case Study Pakistan Floods SUPARCO M. Maisam Raza, Ahmad H. Rabbani SEQUENCE Flood Monitoring using Satellite
Effective Utilization of Synthetic Aperture Radar (SAR) Imagery in Rapid Damage Assessment Case Study Pakistan Floods SUPARCO M. Maisam Raza, Ahmad H. Rabbani SEQUENCE Flood Monitoring using Satellite
Module 2 Educator s Guide Investigation 2
 Module 2 Educator s Guide Investigation 2 How does remote sensing help us to observe human activities on Earth? Investigation Overview Landscapes that are influenced by human activities are found nearly
Monitoring of grass cutting with Sentinel-1 time series
 Monitoring of grass cutting with Sentinel-1 time series pilot results and vision for operational service based on big data tools and cloud computing Kaupo Voormansik 21st MARS Conference November 25, 2015
Remote Sensing and EO activities at the University of Turku
 Remote Sensing and EO activities at the University of Turku Niina Käyhkö Associate Professor Department of Geography and Geology GEO meeting/syke May 23rd, 2018 Geospatial competence at the University
Use of SAR data for Rice Assessment
 Use of SAR data for Rice Assessment N e e t u, S h i b e n d u S R a y a n d T e a m M a h a l a n o b i s N a t i o n a l C r o p F o r e c a s t C e n t r e, D e p a r t m e n t o f A g r i c u l t u
Opportunities for advanced Remote Sensing; an outsider s perspective
 Opportunities for advanced Remote Sensing; an outsider s perspective Ramon Hanssen Delft University of Technology 1 Starting questions Can we do more with the data we are already acquire? What s in stock
Imaging the whole Earth every day. Josh Alban VP, Business Development
 Imaging the whole Earth every day Josh Alban VP, Business Development josh@planet.com Planet Labs helps you detect and act on change by imaging the whole Earth everyday. Challenges Limited Coverage Low
We greatly appreciate the thoughtful comments from the reviewers. According to the reviewer s comments, we revised the original manuscript.
 Response to the reviews of TC-2018-108 The potential of sea ice leads as a predictor for seasonal Arctic sea ice extent prediction by Yuanyuan Zhang, Xiao Cheng, Jiping Liu, and Fengming Hui We greatly
The use of satellite images to forecast agricultural production
 The use of satellite images to forecast agricultural production Artur Łączyński Central Statistical Office, Agriculture Department Niepodległości 208 Warsaw, Poland E-mail a.laczynski@stat.gov.pl DOI:
West meets East: Monitoring and modeling urbanization in China Land Cover-Land Use Change Program Science Team Meeting April 3, 2012
 West meets East: Monitoring and modeling urbanization in China Land Cover-Land Use Change Program Science Team Meeting April 3, 2012 Annemarie Schneider Center for Sustainability and the Global Environment,
Module 2, Investigation 1: Briefing Where do we choose to live and why?
 Module 2, Investigation 1: Briefing Background Why do you live where you live? Where do people choose to live? Why do they choose those places? People have lived on Earth for thousands of years. Throughout
AGOG 485/585 /APLN 533 Spring Lecture 5: MODIS land cover product (MCD12Q1). Additional sources of MODIS data
. Additional sources of MODIS data") AGOG 485/585 /APLN 533 Spring 2019 Lecture 5: MODIS land cover product (MCD12Q1). Additional sources of MODIS data Outline Current status of land cover products Overview of the MCD12Q1 algorithm Mapping
AGOG 485/585 /APLN 533 Spring 2019 Lecture 5: MODIS land cover product (MCD12Q1). Additional sources of MODIS data Outline Current status of land cover products Overview of the MCD12Q1 algorithm Mapping
Sandra Lohberger, Werner Wiedemann, Florian Siegert
 FIRE_CCI Special Case Study on Fires in Indonesia and El Niño: Object-based burned area detection and related fire emission estimations based on Sentinel-1 data D4 Burned area 216 Prepared for European
Agricultural land-use from space. David Pairman and Heather North
 Agricultural land-use from space David Pairman and Heather North Talk Outline Motivation Challenges Different approach Paddock boundaries Classifications Examples Accuracy Issues Data sources Future possibilities
Dual-Frequency Ku- Band Radar Mission Concept for Snow Mass
 Dual-Frequency Ku- Band Radar Mission Concept for Snow Mass Chris Derksen Environment and Climate Change Canada Study Team: Climate Research Division/Meteorological Research Division, ECCC Canadian Space
SWOS (The Satellite-based Wetland Observation Service) Satellite images for peatland monitoring and management Kathrin Weise, Jena-Optronik GmbH
 Satellite images for peatland monitoring and management Kathrin Weise, Jena-Optronik GmbH") This project has received funding from the European Union s Horizon 2020 research and innovation programme under grant agreement No 642088 SWOS (The Satellite-based Wetland Observation Service) Satellite
This project has received funding from the European Union s Horizon 2020 research and innovation programme under grant agreement No 642088 SWOS (The Satellite-based Wetland Observation Service) Satellite
DROUGHT RISK EVALUATION USING REMOTE SENSING AND GIS : A CASE STUDY IN LOP BURI PROVINCE
 DROUGHT RISK EVALUATION USING REMOTE SENSING AND GIS : A CASE STUDY IN LOP BURI PROVINCE K. Prathumchai, Kiyoshi Honda, Kaew Nualchawee Asian Centre for Research on Remote Sensing STAR Program, Asian Institute
Investigation of the Effect of Transportation Network on Urban Growth by Using Satellite Images and Geographic Information Systems
 Presented at the FIG Congress 2018, May 6-11, 2018 in Istanbul, Turkey Investigation of the Effect of Transportation Network on Urban Growth by Using Satellite Images and Geographic Information Systems
Monthly Overview. Rainfall
 Monthly Overview Rainfall during August occurred mainly over the Western and Eastern Cape provinces, and KwaZulu- Natal. Rain in these provinces were regularly accompanied by cold fronts as they made landfall
Overview on Land Cover and Land Use Monitoring in Russia
 Russian Academy of Sciences Space Research Institute Overview on Land Cover and Land Use Monitoring in Russia Sergey Bartalev Joint NASA LCLUC Science Team Meeting and GOFC-GOLD/NERIN, NEESPI Workshop
CGMS-45-WMO-WP-05 Monitoring Extreme Weather and Climate from Space. World Meteorological Organization (WMO) Space Programme
 Space Programme") CGMS-45-WMO-WP-05 Monitoring Extreme Weather and Climate from Space World Meteorological Organization (WMO) Space Programme Introduction UNOSAT Report Satellite Detected Waters over Xieng Ngneun District,
CGMS-45-WMO-WP-05 Monitoring Extreme Weather and Climate from Space World Meteorological Organization (WMO) Space Programme Introduction UNOSAT Report Satellite Detected Waters over Xieng Ngneun District,
Remote sensing of forest and land cover at the AUA GIS & Remote Sensing Lab
 AUA GIS AND REMOTE SENSING LAB An initiative of the AUA Acopian Center for the Environment and the AUA College of Science and Engineering http://ace.aua.am/gis-and-remote-sensing Remote sensing of forest
DROUGHT ASSESSMENT USING SATELLITE DERIVED METEOROLOGICAL PARAMETERS AND NDVI IN POTOHAR REGION
 DROUGHT ASSESSMENT USING SATELLITE DERIVED METEOROLOGICAL PARAMETERS AND NDVI IN POTOHAR REGION Researcher: Saad-ul-Haque Supervisor: Dr. Badar Ghauri Department of RS & GISc Institute of Space Technology
GIS and Remote Sensing
 Spring School Land use and the vulnerability of socio-ecosystems to climate change: remote sensing and modelling techniques GIS and Remote Sensing Katerina Tzavella Project Researcher PhD candidate Technology
Defining microclimates on Long Island using interannual surface temperature records from satellite imagery
 Defining microclimates on Long Island using interannual surface temperature records from satellite imagery Deanne Rogers*, Katherine Schwarting, and Gilbert Hanson Dept. of Geosciences, Stony Brook University,
Land abandonment and recultivation in Central and Eastern Europe
 Land abandonment and recultivation in Central and Eastern Europe Patrick Hostert Patrick Griffiths, Stephan Estel, Camilo Alcantara, Tobias Kuemmerle, Dirk Pflugmacher, Alexander Prishchepov, Volker Radeloff
PAKISTAN STUDIES 2059/02 The Environment of Pakistan
 PAKISTAN STUDIES 2059/02 The Environment of Pakistan The City School PAF Chapter Prep + Senior 1 Section Name: Section: Date: Time: 1 hour 30 minute Candidates answer on the Question Paper. READ THESE
Crop and pasture monitoring in Eritrea
 JRC SCIENTIFIC AND POLICY REPORTS Crop and pasture monitoring in Eritrea Kremti rainy season started with substantial delay Ana Pérez-Hoyos, Francois Kayitakire, Hervé Kerdiles, Felix Rembold, Olivier
Agricultural Science Climatology Semester 2, Anne Green / Richard Thompson
 Agricultural Science Climatology Semester 2, 2006 Anne Green / Richard Thompson http://www.physics.usyd.edu.au/ag/agschome.htm Course Coordinator: Mike Wheatland Course Goals Evaluate & interpret information,
USE OF SATELLITE IMAGES FOR AGRICULTURAL STATISTICS
 USE OF SATELLITE IMAGES FOR AGRICULTURAL STATISTICS National Administrative Department of Statistics DANE Colombia Geostatistical Department September 2014 Colombian land and maritime borders COLOMBIAN
Droughts are normal recurring climatic phenomena that vary in space, time, and intensity. They may affect people and agriculture at local scales for
 I. INTRODUCTION 1.1. Background Droughts are normal recurring climatic phenomena that vary in space, time, and intensity. They may affect people and agriculture at local scales for short periods or cover
Evaluating the Discrete Element Method as a Tool for Predicting the Seasonal Evolution of the MIZ
 DISTRIBUTION STATEMENT A. Approved for public release; distribution is unlimited. Evaluating the Discrete Element Method as a Tool for Predicting the Seasonal Evolution of the MIZ Arnold J. Song Cold Regions
Land Cover Project ESA Climate Change Initiative. Processing chain for land cover maps dedicated to climate modellers.
 Land Cover Project ESA Climate Change Initiative Processing chain for land cover maps dedicated to climate modellers land_cover_cci S. Bontemps 1, P. Defourny 1, V. Kalogirou 2, F.M. Seifert 2 and O. Arino
Why Hydrological Services are Important to Business
 Why Hydrological Services are Important to Business Dr. David Green Program Manager, Disasters Earth Science Division David.s.green@nasa.gov May 8, 2018 2 Communities and Areas of Intensive Risk Socio-Economic
Urban Mapping. Sebastian van der Linden, Akpona Okujeni, Franz Schug 11/09/2018
 Urban Mapping Sebastian van der Linden, Akpona Okujeni, Franz Schug 11/09/2018 Introduction to urban remote sensing Introduction The urban millennium Source: United Nations, 2014 Urban areas mark extremes
Witchampton CofE First School Geography Curriculum Map
 2016-2017 Autumn People and : 30-50 Show interest in the lives of people who are familiar to them. Shows interest in different occupations. Remembers and talks significant events in their own experience.
Radar mapping of snow melt over mountain glaciers in High Mountain Asia Mentor: Tarendra Lakhankar Collaborators: Nir Krakauer, Kyle MacDonald and
 Radar mapping of snow melt over mountain glaciers in High Mountain Asia Mentor: Tarendra Lakhankar Collaborators: Nir Krakauer, Kyle MacDonald and Nick Steiner How are Glaciers Formed? Glaciers are formed
URBAN MAPPING AND CHANGE DETECTION
 URBAN MAPPING AND CHANGE DETECTION Sebastian van der Linden with contributions from Akpona Okujeni Humboldt-Unveristät zu Berlin, Germany Introduction Introduction The urban millennium Source: United Nations,
SNOW COVER MONITORING IN ALPINE REGIONS WITH COSMO-SKYMED IMAGES BY USING A MULTITEMPORAL APPROACH AND DEPOLARIZATION RATIO
 SNOW COVER MONITORING IN ALPINE REGIONS WITH COSMO-SKYMED IMAGES BY USING A MULTITEMPORAL APPROACH AND DEPOLARIZATION RATIO B. Ventura 1, T. Schellenberger 1, C. Notarnicola 1, M. Zebisch 1, T. Nagler
Land cover/land use mapping and cha Mongolian plateau using remote sens. Title. Author(s) Bagan, Hasi; Yamagata, Yoshiki. Citation Japan.
 Bagan, Hasi; Yamagata, Yoshiki. Citation Japan.") Title Land cover/land use mapping and cha Mongolian plateau using remote sens Author(s) Bagan, Hasi; Yamagata, Yoshiki International Symposium on "The Imp Citation Region Specific Systems". 6 Nove Japan.
Title Land cover/land use mapping and cha Mongolian plateau using remote sens Author(s) Bagan, Hasi; Yamagata, Yoshiki International Symposium on "The Imp Citation Region Specific Systems". 6 Nove Japan.
November 2018 Weather Summary West Central Research and Outreach Center Morris, MN
 November 2018 Weather Summary Lower than normal temperatures occurred for the second month. The mean temperature for November was 22.7 F, which is 7.2 F below the average of 29.9 F (1886-2017). This November
EXTRACTION OF FLOODED AREAS DUE THE 2015 KANTO-TOHOKU HEAVY RAINFALL IN JAPAN USING PALSAR-2 IMAGES
 EXTRACTION OF FLOODED AREAS DUE THE 2015 KANTO-TOHOKU HEAVY RAINFALL IN JAPAN USING PALSAR-2 IMAGES F. Yamazaki a, *, W. Liu a a Chiba University, Graduate School of Engineering, Chiba 263-8522, Japan
A Statistical Framework for Analysing Big Data Global Conference on Big Data for Official Statistics October, 2015 by S Tam, Chief
 A Statistical Framework for Analysing Big Data Global Conference on Big Data for Official Statistics 20-22 October, 2015 by S Tam, Chief Methodologist Australian Bureau of Statistics 1 Big Data (BD) Issues
Patrick Leinenkugel. German Aerospace Center (DLR) Vortrag > Autor > Dokumentname > Datum
 Vortrag > Autor > Dokumentname > Datum") Characterisation of land surface phenology and land cover for the Mekong Basin on the basis of multitemporal and multispectral satellite data from the MODIS Sensor Patrick Leinenkugel German Aerospace
Characterisation of land surface phenology and land cover for the Mekong Basin on the basis of multitemporal and multispectral satellite data from the MODIS Sensor Patrick Leinenkugel German Aerospace
The Palfai Drought Index (PaDI) Expansion of applicability of Hungarian PAI for South East Europe (SEE) region Summary
 Expansion of applicability of Hungarian PAI for South East Europe (SEE) region Summary") The Palfai Drought Index () Expansion of applicability of Hungarian PAI for South East Europe (SEE) region Summary In Hungary the Palfai drought index (PAI) worked out for users in agriculture and in water
The Palfai Drought Index () Expansion of applicability of Hungarian PAI for South East Europe (SEE) region Summary In Hungary the Palfai drought index (PAI) worked out for users in agriculture and in water
NASA Flood Monitoring and Mapping Tools
 National Aeronautics and Space Administration ARSET Applied Remote Sensing Training http://arset.gsfc.nasa.gov @NASAARSET NASA Flood Monitoring and Mapping Tools www.nasa.gov Outline Overview of Flood
Advanced Image Analysis in Disaster Response
 Advanced Image Analysis in Disaster Response Creating Geographic Knowledge Thomas Harris ITT The information contained in this document pertains to software products and services that are subject to the
Abstract. TECHNOFAME- A Journal of Multidisciplinary Advance Research. Vol.2 No. 2, (2013) Received: Feb.2013; Accepted Oct.
 Received: Feb.2013; Accepted Oct.") Vol.2 No. 2, 83-87 (2013) Received: Feb.2013; Accepted Oct. 2013 Landuse Pattern Analysis Using Remote Sensing: A Case Study of Morar Block, of Gwalior District, M.P. Subhash Thakur 1 Akhilesh Singh 2
Vol.2 No. 2, 83-87 (2013) Received: Feb.2013; Accepted Oct. 2013 Landuse Pattern Analysis Using Remote Sensing: A Case Study of Morar Block, of Gwalior District, M.P. Subhash Thakur 1 Akhilesh Singh 2
Development of a Regional Land Cover Monitoring System In the Lower Mekong Region a Joint Effort Between SERVIR-Mekong and Partners -
 Mekong Development of a Regional Land Cover Monitoring System In the Lower Mekong Region a Joint Effort Between SERVIR-Mekong and Partners - Aekkapol Aekakkararungroj SERVIR-Mekong Asian Disaster Preparedness
THE STUDY OF NUMBERS AND INTENSITY OF TROPICAL CYCLONE MOVING TOWARD THE UPPER PART OF THAILAND
 THE STUDY OF NUMBERS AND INTENSITY OF TROPICAL CYCLONE MOVING TOWARD THE UPPER PART OF THAILAND Aphantree Yuttaphan 1, Sombat Chuenchooklin 2 and Somchai Baimoung 3 ABSTRACT The upper part of Thailand
South & South East Asian Region:
 Issued: 15 th December 2017 Valid Period: January June 2018 South & South East Asian Region: Indonesia Tobacco Regions 1 A] Current conditions: 1] El Niño-Southern Oscillation (ENSO) ENSO Alert System
Probability models for weekly rainfall at Thrissur
 Journal of Tropical Agriculture 53 (1) : 56-6, 015 56 Probability models for weekly rainfall at Thrissur C. Laly John * and B. Ajithkumar *Department of Agricultural Statistics, College of Horticulture,
Land cover research, applications and development needs in Slovakia
 Land cover research, applications and development needs in Slovakia Andrej Halabuk Institute of Landscape Ecology Slovak Academy of Sciences (ILE SAS) Štefánikova 3, 814 99 Bratislava, Slovakia Institute
Use of Geospatial Data: Philippine Statistics Authority 1
 Use of Geospatial Data: Philippine Statistics Authority 1 1 Presentation by Lisa Grace S. Bersales at the UNSC 2016 side event on Geospatial information and earth observations: supporting official statistics
Dawood Public School Secondary Section Class VII
 Dawood Public School Secondary Section Class VII Introduction: Geography is the study of the Earth and its lands, features, inhabitants, and phenomena relating to the sciences of aforementioned. This subject
K&C Phase 4 Status report. Use of short-period ALOS-2 observations for vegetation characterization and classification
 K&C Phase 4 Status report Use of short-period ALOS-2 observations for vegetation characterization and classification Paul Siqueira, Tracy Whelen University of Massachusetts, Amherst Yang Lei NASA JPL Science
CAN THO URBAN DEVELOPMENT AND RESILIENCE PROJECT
 CAN THO URBAN DEVELOPMENT AND RESILIENCE PROJECT 1 Phnom Penh Can Tho City HCM City EAST SEA 2 1 3 Highest Water Level WATER LEVEL RAISE IN CAN THO DURING LAST 40 YEARS 4 2 Land subsidence a threat that
SAR Coordination for Snow Products
 Polar SAR Coordination Working Meeting 5 SAR Coordination for Snow Products David Small 1, Thomas Nagler 2, David Jäger 1, Christoph Rohner 1, Adrian Schubert 1 1: University of Zurich, Switzerland 2:
Mapping forests in monsoon Asia with ALOS PALSAR 50-m mosaic images and MODIS
 1 Supplementary Information 2 3 Mapping forests in monsoon Asia with ALOS PALSAR 50-m mosaic images and MODIS imagery in 2010 4 5 6 7 8 9 10 11 Yuanwei Qin, Xiangming Xiao, Jinwei Dong, Geli Zhang, Partha
Current and Upcoming NASA Hurricane Measurement Missions National Hurricane Conference
 NASA Science Mission Directorate Earth Science Division Applied Sciences Program Current and Upcoming NASA Hurricane Measurement Missions National Hurricane Conference April 18, 2017 Formulation Implementation
Louis-François Guerre, Planet Action Coordinator Copenhagen, December Spot Image 2007
 Louis-François Guerre, Planet Action Coordinator Copenhagen, December 2009 1 Spot Image 2007 Spot Image, Earth Observation and geo-information services Satellite operator, imagery distributor SPOT4 SPOT5
GLOBWETLAND AFRICA TOOLBOX
 The GlobWetland Africa Toolbox is an open source and free-of-charge software toolbox for inventorying, mapping, monitoring and assessing wetlands. The toolbox comes with end-to-end processing workflows
Module 2, Investigation 2: Briefing How does remote sensing help us observe human activities?
 Module 2, Investigation 2: Briefing Background What physical evidence of our presence do we create on Earth s surface? How is this evidence detected from space? Observing Earth from space helps us to understand
EXTRACTION OF REMOTE SENSING INFORMATION OF BANANA UNDER SUPPORT OF 3S TECHNOLOGY IN GUANGXI PROVINCE
 EXTRACTION OF REMOTE SENSING INFORMATION OF BANANA UNDER SUPPORT OF 3S TECHNOLOGY IN GUANGXI PROVINCE Xin Yang 1,2,*, Han Sun 1, 2, Zongkun Tan 1, 2, Meihua Ding 1, 2 1 Remote Sensing Application and Test
Modeling the Change of Mangrove Forests in Irrawaddy Delta, South Myanmar
 International Journal of Sciences: Basic and Applied Research (IJSBAR) ISSN 2307-4531 (Print & Online) http://gssrr.org/index.php?journal=journalofbasicandapplied ---------------------------------------------------------------------------------------------------------------------------
Geospatial Information and Services for Disasters (GIS4D)
") Geospatial Information and Services for Disasters (GIS4D) 31 July 2017 Tae Hyung KIM ICT and Disaster Risk Reduction Division (IDD) UNESCAP 1 About ESCAP Who is ESCAP? United Nations Economic and Social
Geospatial Information and Services for Disasters (GIS4D) 31 July 2017 Tae Hyung KIM ICT and Disaster Risk Reduction Division (IDD) UNESCAP 1 About ESCAP Who is ESCAP? United Nations Economic and Social
MAPPING LAND USE/ LAND COVER OF WEST GODAVARI DISTRICT USING NDVI TECHNIQUES AND GIS Anusha. B 1, Sridhar. P 2
 MAPPING LAND USE/ LAND COVER OF WEST GODAVARI DISTRICT USING NDVI TECHNIQUES AND GIS Anusha. B 1, Sridhar. P 2 1 M. Tech. Student, Department of Geoinformatics, SVECW, Bhimavaram, A.P, India 2 Assistant
REMOTELY SENSED INFORMATION FOR CROP MONITORING AND FOOD SECURITY
 LEARNING OBJECTIVES Lesson 4 Methods and Analysis 2: Rainfall and NDVI Seasonal Graphs At the end of the lesson, you will be able to: understand seasonal graphs for rainfall and NDVI; describe the concept
Summary and Conclusions
 241 Chapter 10 Summary and Conclusions Kerala is situated in the southern tip of India between 8 15 N and 12 50 N latitude and 74 50 E and 77 30 E longitude. It is popularly known as Gods own country.
Rice Monitoring using Simulated Compact SAR. Kun Li, Yun Shao Institute of Remote Sensing and Digital Earth
 Rice Monitoring using Simulated Compact SAR Kun Li, Yun Shao Institute of Remote Sensing and Digital Earth Outlines Introduction Test site and data Results Rice type discrimination Rice phenology retrieval
ABSTRAK. Pemetaan Kerentanaan Banjir Dengan Metode Kualitatif Pada Area Pemukiman: Studi kasus di Thach Ha Distrik, Propinsi Ha Tinh, Vietnam
 ABSTRAK Pemetaan Kerentanaan Banjir Dengan Metode Kualitatif Pada Area Pemukiman: Studi kasus di Thach Ha Distrik, Propinsi Ha Tinh, Vietnam Pemetaan daerah rentan banjir sangat terbatas karena dalam pemetaan
Nguyen Hoang Khanh Linh, Le Ngoc Phuong Quy, Truong Do Minh Phuong and Nguyen Trac Ba An
 Journal of Agricultural Science and Technology A and B & Hue University Journal of Science 7 (2017) 48-59 doi: 10.17265/2161-6256/2017.10.007S D DAVID PUBLISHING Application of Remote Sensing and GIS Technology
Workshop on Drought and Extreme Temperatures: Preparedness and Management for Sustainable Agriculture, Forestry and Fishery
 Workshop on Drought and Extreme Temperatures: Preparedness and Management for Sustainable Agriculture, Forestry and Fishery 16-17 Feb.2009, Beijing, China Modeling Apple Tree Bud burst time and frost risk
Impact on Agriculture
 Weather Variability and the Impact on Agriculture InfoAg 2017 Copyright 2017, awhere. All Rights Reserved The Problem: The Earth s Atmosphere is a Heat Engine In transition 1 C warming of atmosphere Triples
Time and resolution : COSMO-SkyMed VHR data in support to precision farming applications
 17 th GEOCAP Conference Geomatics in Support of the CAP Tallinn, 24 November 2011 Time and resolution : COSMO-SkyMed VHR data in support to precision farming applications e-geos Headquarter Contrada Terlecchie
Spanish national plan for land observation: new collaborative production system in Europe
 ADVANCE UNEDITED VERSION UNITED NATIONS E/CONF.103/5/Add.1 Economic and Social Affairs 9 July 2013 Tenth United Nations Regional Cartographic Conference for the Americas New York, 19-23, August 2013 Item
Feasibility study: Use of Sigma 0 and radar images to extract and classify roads in Central Africa. Progress Reports
 : Use of Sigma 0 and radar images to extract and classify roads in Central Africa Progress Reports Study supported by the Canadian Space Agency : Use of Sigma 0 and radar images to extract and classify
Comparison between Multitemporal and Polarimetric SAR Data for Land Cover Classification
 Downloaded from orbit.dtu.dk on: Sep 19, 2018 Comparison between Multitemporal and Polarimetric SAR Data for Land Cover Classification Skriver, Henning Published in: Geoscience and Remote Sensing Symposium,
Presentation of the different land cover mapping activities in the French Guiana
 Presentation of the different land cover mapping activities in the French Guiana LCCS Land Cover Classification System 9 to 13 March 2015 Paramaribo - Suriname INTRODUCTION French Guiana : 8 046 427 ha
Regionalized and application-specific compositing - a review of requirements, opportunities and challenges
 Regionalized and application-specific compositing - a review of requirements, opportunities and challenges Patrick Griffiths & Patrick Hostert Geography Department, Humboldt University Berlin Joanne White
ANALYSIS AND VALIDATION OF A METHODOLOGY TO EVALUATE LAND COVER CHANGE IN THE MEDITERRANEAN BASIN USING MULTITEMPORAL MODIS DATA
 PRESENT ENVIRONMENT AND SUSTAINABLE DEVELOPMENT, NR. 4, 2010 ANALYSIS AND VALIDATION OF A METHODOLOGY TO EVALUATE LAND COVER CHANGE IN THE MEDITERRANEAN BASIN USING MULTITEMPORAL MODIS DATA Mara Pilloni
The indicator can be used for awareness raising, evaluation of occurred droughts, forecasting future drought risks and management purposes.
 INDICATOR FACT SHEET SSPI: Standardized SnowPack Index Indicator definition The availability of water in rivers, lakes and ground is mainly related to precipitation. However, in the cold climate when precipitation
Current and near-future SAR (and LIDAR) systems
 systems") Current and near-future SAR (and LIDAR) systems Ake Rosenqvist solo Earth Observation, Japan Mexico City, Mexico June 7-9, 2016 1 Current and near-future SARs & LIDARs ALOS-2/PALSAR-2 global mosaics SAOCOM-1A/1B
Current and near-future SAR (and LIDAR) systems Ake Rosenqvist solo Earth Observation, Japan Mexico City, Mexico June 7-9, 2016 1 Current and near-future SARs & LIDARs ALOS-2/PALSAR-2 global mosaics SAOCOM-1A/1B
Space-based Weather and Climate Extremes Monitoring (SWCEM) Toshiyuki Kurino WMO Space Programme IPET-SUP-3, 2-4 May 2017
 Toshiyuki Kurino WMO Space Programme IPET-SUP-3, 2-4 May 2017") Space-based Weather and Climate Extremes Monitoring (SWCEM) Toshiyuki Kurino WMO Space Programme IPET-SUP-3, 2-4 May 2017 based on outcome from Workshop on Operational SWCEM 15-17 February 2017, Geneva
Space-based Weather and Climate Extremes Monitoring (SWCEM) Toshiyuki Kurino WMO Space Programme IPET-SUP-3, 2-4 May 2017 based on outcome from Workshop on Operational SWCEM 15-17 February 2017, Geneva
1. Introduction. S.S. Patil 1, Sachidananda 1, U.B. Angadi 2, and D.K. Prabhuraj 3
 Cloud Publications International Journal of Advanced Remote Sensing and GIS 2014, Volume 3, Issue 1, pp. 525-531, Article ID Tech-249 ISSN 2320-0243 Research Article Open Access Machine Learning Technique
RESEARCH METHODOLOGY
 III. RESEARCH METHODOLOGY 3.1 Time and Location This research has been conducted in period March until October 2010. Location of research is over Sumatra terrain. Figure 3.1 show the area of interest of
Daniel Hogan 19. CSIR, Pretoria, South Africa Natural Resources & Environment Earth Observations
 Daniel Hogan 19 CSIR, Pretoria, South Africa Natural Resources & Environment Earth Observations My (initial) Work Initially, my project was an extension of the work from last year. I was to download and
Introduction to SMAP. ARSET Applied Remote Sensing Training. Jul. 20,
 National Aeronautics and Space Administration ARSET Applied Remote Sensing Training http://arset.gsfc.nasa.gov @NASAARSET Introduction to SMAP Jul. 20, 2016 www.nasa.gov Outline 1. Mission objectives 2.
REVIEW MAPWORK EXAM QUESTIONS 31 JULY 2014
 REVIEW MAPWORK EXAM QUESTIONS 31 JULY 2014 Lesson Description In this lesson we: Focus on key concepts and exam questions relating to GIS. Question 1 Test Yourself The most important component of a GIS
Climate Change and Vegetation Phenology
 Climate Change and Vegetation Phenology Climate Change In the Northeastern US mean annual temperature increased 0.7 C over 30 years (0.26 C per decade) Expected another 2-6 C over next century (Ollinger,
A BRIEF INTRODUCTION TO COPERNICUS AND CAMS
 A BRIEF INTRODUCTION TO COPERNICUS AND CAMS Juan Garcés de Marcilla Director of Copernicus Services European Centre for Medium-Range Weather Forecasts Copernicus EU Copernicus EU Copernicus EU www.copernicus.eu
GEOGRAPHY (GE) Courses of Instruction
 Courses of Instruction") GEOGRAPHY (GE) GE 102. (3) World Regional Geography. The geographic method of inquiry is used to examine, describe, explain, and analyze the human and physical environments of the major regions of the
GEOGRAPHY (GE) GE 102. (3) World Regional Geography. The geographic method of inquiry is used to examine, describe, explain, and analyze the human and physical environments of the major regions of the
Urban Growth in South China and Impacts on Local Precipitation, Fifth Urban Research Symposium 2009
 Urban Growth in South China and Impacts on Local Precipitation Karen C. Seto Associate Professor Yale University School of Forestry and Environmental Studies karen.seto@yale.edu Robert K. Kaufmann Professor
CLIMATE CHANGE AND REGIONAL HYDROLOGY ACROSS THE NORTHEAST US: Evidence of Changes, Model Projections, and Remote Sensing Approaches
 CLIMATE CHANGE AND REGIONAL HYDROLOGY ACROSS THE NORTHEAST US: Evidence of Changes, Model Projections, and Remote Sensing Approaches Michael A. Rawlins Dept of Geosciences University of Massachusetts OUTLINE
Model Implementation Details for the Final Project in EEOS 465/
 Model Implementation Details for the Final Project in EEOS 465/627 2009 Last week, we introduced a conceptual model of estimating DOC loadings from landscape to coastal waters as a model template for the
Incorporation of SMOS Soil Moisture Data on Gridded Flash Flood Guidance for Arkansas Red River Basin
 Incorporation of SMOS Soil Moisture Data on Gridded Flash Flood Guidance for Arkansas Red River Basin Department of Civil and Environmental Engineering, The City College of New York, NOAA CREST Dugwon
1.6 TRENDS AND VARIABILITY OF SNOWFALL AND SNOW COVER ACROSS NORTH AMERICA AND EURASIA. PART 2: WHAT THE DATA SAY
 1.6 TRENDS AND VARIABILITY OF SNOWFALL AND SNOW COVER ACROSS NORTH AMERICA AND EURASIA. PART 2: WHAT THE DATA SAY David A. Robinson* Rutgers University, Department of Geography, Piscataway, New Jersey
Data Fusion and Multi-Resolution Data
 Data Fusion and Multi-Resolution Data Nature.com www.museevirtuel-virtualmuseum.ca www.srs.fs.usda.gov Meredith Gartner 3/7/14 Data fusion and multi-resolution data Dark and Bram MAUP and raster data Hilker