Data Fusion and Multi-Resolution Data
|
|
|
- Colin Palmer
- 6 years ago
- Views:
Transcription
1 Data Fusion and Multi-Resolution Data Nature.com Meredith Gartner 3/7/14
2 Data fusion and multi-resolution data Dark and Bram MAUP and raster data Hilker et al data fusion to improve spatial and temporal resolution Neigh et al multi-resolution data used to investigate vegetation dynamics Discussion mixed throughout Potential effects of MAUP on raster data Relate back to previous topics How do issues relate to your research topic?

3 Dark and Bram 2007 MAUP in physical geography Physical geography for broad-scale analyses, often use data aggregated from small areas or collected at predefined scales Remotely-sensed imagery aggregated MAUP largely ignored Example: Marceau et al best classification accuracy for each class achieved with different resolutions Inconsistencies in accuracies among classes changing the scale changes the patterns of reality, which has obvious implications for understanding. Marceau et al. 1994


4 Dark and Bram 2007 MAUP in physical geography Meddens et al RSE Effects of spatial aggregation of individual trees


5 Dark and Bram 2007 MAUP in physical geography Meddens et al RSE 30 cm 2.4 m

6 Dark and Bram 2007 MAUP in physical geography Meddens et al RSE 30 cm 2.4 m
7 Dark and Bram 2007 MAUP in physical geography Connection between classification inconsistencies and MAUP Impact of resolution on modeling What is the appropriate resolution in a complex landscape for a pixelbased classification? How do you identify the ideal resolution? E.g. Meddens approach? Are single resolution classifications appropriate in complex landscapes or do they require a multi-scale approach?

8 Dark and Bram 2007 MAUP in physical geography Hydrologic modeling Variation of flow accumulation is dependent on resolution of DEM
 Has your research used a specific approach to address MAUP in remotely sensed imagery?")
9 Dark and Bram 2007 MAUP in physical geography Potential solutions: 1. Ignore and hope for best (Openshaw 1984) 2. Identify basic entities (Fotheringham 1989) e.g. individual tree recognition 3. Object-specific approach (Hay et al. 2001) Has your research used a specific approach to address MAUP in remotely sensed imagery?

 Sensor trade-offs between spatial and temporal resolution Landsat 30m,")
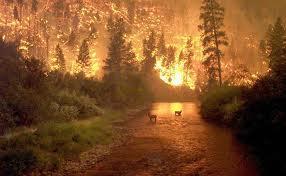
10 Hilker et al A new data fusion model for high spatial- and temporal-resolution mapping of forest disturbance based on Landsat and MODIS Detailed information of disturbances in important (e.g. carbon budgets, fire models) Sensor trade-offs between spatial and temporal resolution Landsat 30m, 185 km swath, 16 day revisit (more if cloudy) MODIS 500 m, 2,330 km swath, 1-2 day revisit Landsat 8 MODIS

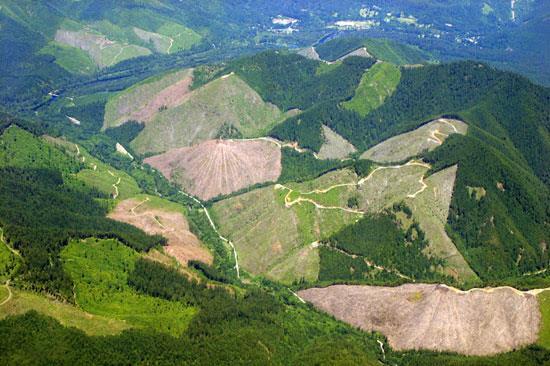
11 Hilker et al A new data fusion model for high spatial- and temporal-resolution mapping of forest disturbance based on Landsat and MODIS Research goal: explore use of data fusion to monitor short-term land cover change/disturbance Combine high spatial resolution Landsat with high temporal resolution MODIS STAARCH data fusion model identify disturbance dates using MODIS Study area - Alberta, Canada 185 km 2
12 Hilker et al Methods - STAARCH Change Mask development Landsat scenes beg and end Tasseled Cap indices (brightness greenness and wetness) Normalized using mean of vegetation class to reduce seasonal variation DI Landsat = B r (G r +W r ) Disturbed pixel if: DI reaches threshold (2) Neighbor must be disturbed Brightness, wetness and NDVI don t exceed thresholds Cloud and snow mask
13 Hilker et al Methods - STAARCH Compute MODIS-derived Tasseled Cap data spaces DI MODIS Used mean of all vegetation classes to normalize (mixed pixels) Calculates the DoD based on a moving average of the DI for 3 subsequent MODIS composites Compare the mean to threshold
14 Hilker et al Methods - STAARCH Output 30m All pixels within mask are dated with an interval corresponding to DoD/interval
15 Hilker et al Methods algorithm testing LandsatTM images , 2005 MODIS composites eight-day, resampled to 30 m STAARCH model Validation delineated stand-replacing disturbances vector Derived from Landsat TM and ETM+ Year of origin and type of disturbance Assumption transfer of methods to smaller time steps

16 Hilker et al Results

17 Hilker et al Results Change mask


18 Hilker et al Results DI MODIS

19 Hilker et al Results - Validation Mean area correctly classified: % % % Incorrectly classified smaller time steps? False positives seasonal changes IDed some disturbances not included in validations data Mean area of correctly classified disturbances was 169,265 m 2 or 0.69 MODIS pixels (std dev 1.04 MODIS pixels) Mean area of missed disturbances 47,408 m 2 or 0.19 MODIS pixels (std dev 0.17) ~50 Landsat pixels

20 wildfire Most disturbances occurred during summer months
21 Hilker et al Notes 1. Validation data Missed disturbances yet indicated 100% accuracy Validation of Landsat mask and MODIS with Landsat-derived disturbances (what disturbances are missing from both?) 2. Not tested on gradual or low-severity disturbances E.g. patchy insect outbreaks, low- or variable-severity fires 3. Signal sensitivity what is the degree of change that is reflected in the method? Mean area of missed disturbances 47,408 m 2 or 0.19 MODIS pixels (std dev 0.17) What area or severity is required to be reflected in Landsat or MODIS imagery
22 Hilker et al Notes Did they accomplish their goal - use data fusion to monitor short-term change/disturbance? Temporal resolution - argue this process will work at finer than annual time steps. Concerns about their assumption about fine-temporal application of model? Seasonality Gradual disturbances Mainly tested in forested ecosystem. Applications in other systems?
23 Neigh et al North American vegetation dynamics observed with multi-resolution satellite data Explore primary production patterns at a continental scale for North America and investigate patterns and mechanisms at regional/local scale NDVI anomalies (pos trends) strong relationship with net primary productivity AVHRR NDVI product 8km resolution starting in 1981 (bimonthly) NDVI = Channel2 Channel1 Channel2 Channel1
24 Neigh et al Methods Identify AVHRR NDVI anomalies 1) Contiguous region greater than 2000 km 2 with a May-Sept NDVI trend > 0.1 2) High-resolution imagery and validation data available Landsat acquired for anomaly locations Thematic maps of land cover and change Base map (2000) red, NIR and MIR ISODATA classification - ~50 classes then aggregated into 9 IGBP land cover types
25 Neigh et al Methods Identify AVHRR NDVI anomalies 1) Contiguous region greater than 2000 km2 with a May-Sept NDVI trend > 0.1 2) High-resolution imagery and validation data available Landsat acquired for anomaly locations Thematic maps of land cover and change over several time periods ( , , ) Base map (2000) red, NIR and MIR ISODATA classification - ~50 classes then aggregated into 9 IGBP land cover types Tasseled Cap transformation to multi-date images (1975, 1990, 2000) ISODATA unsupervised clustering into change/no change clusters Compare with 2000 basemap
 Validation data")
26 Neigh et al Methods - Validation Nested hierarchical partitions to stratify sampling distribution Study areas 8-18 mill ha (6 study regions, 3 temporal periods) Validation data Aerial photos (0.5-2 m) Ikonos (1-4 m) In situ field plot surveys with aerial flight GPS Validation of land cover classifications for each sensor (MSS, TM, ETM+)

")

27 Neigh et al Methods Ancillary Data: Fire, logging (annual by ha) Agriculture (county, crop type, production method) Temperature, precipitation (daily meteorological station data used to calculate growing season and drought)

28 Neigh et al Results 6 areas identified Mackenzie River Delta Southern Saskatchewan Oklahoma Panhandle Northern Saskatchewan Southern Quebec Newfoundland Newfoundland


29 Neigh et al Results Mackenzie River Delta NDVI increase from Aerial photos available for entire AVHRR record Alpine tundra, lichen woodland Temperature - permafrost - vegetation patterns
 Short veg grassland declines ~950 km 2 (-1% ) Barren lands increased due to fire ~710 km 2 They")
30 Neigh et al Results Mackenzie Land cover change minor Map accuracy % using air photo and Ikonos data Dwarf trees and shrubs increased by 720 km 2 (< 1%) Short veg grassland declines ~950 km 2 (-1% ) Barren lands increased due to fire ~710 km 2 They interpret as expansion but say they do not have confidence in ability to identify subtle veg growth (shrub expansion?)
31 Neigh et al Results Mackenzie River Delta Temperature and precipitation Increase growing season length Increase monthly temperature Increased mean NDVI

32 Neigh et al Results Oklahoma Panhandle Agriculture and pasture land Precipitation is limiting to vegetation growth Temporal variation in crop types
33 Neigh et al Results Oklahoma Panhandle Land cover Map accuracy % (air photos and Ikonos) Increase in agricultural (+23%) Decline in short veg grassland

34 Neigh et al Results Oklahoma Panhandle Increase in corn yields Increase in NDVI and center-pivot irrigation Increase in NDVI and center-pivot irrigation
35 Neigh et al Results Oklahoma Panhandle Abiotic variability no impact on vegetation in the region Droughts common agricultural areas not impacted (irrigation) Verify lack of abiotic changes on increased NDVI, examined the NASS USDA crop records Counties in NDVI anomaly area had increase corn production Counties without increase in NDVI did not have increased corn production Conversion from wheat to corn and center pivot irrigation NDVI increase in AVHRR imagery Visible in Landsat
36 Neigh et al Notes 1. Broad-scale vegetation patterns understood through multi-resolution datasets (scale of mechanism) 1. Local scale drivers of coarse scale trends 2. NDVI anomalies influences by interacting factors 2. Identified meaningful relationships between NDVI and variables 3. Only identified positive NDVI trends (droughts, insect outbreaks) 4. Validation of land cover maps imagery had most validation pts and digital aerial photography 3. Some rare land covers not/under represented in error matrices
37 Neigh et al Questions 1. Were their interpretations valid? 2. Did the multi-scale approach address MAUP concerns? 1. AVHRR>Landsat>Aerial photos>ancillary data 3. Opportunities to perform a multi-scale analysis with your research projects?

38 Denver Post
Lecture Topics. 1. Vegetation Indices 2. Global NDVI data sets 3. Analysis of temporal NDVI trends
 Lecture Topics 1. Vegetation Indices 2. Global NDVI data sets 3. Analysis of temporal NDVI trends Why use NDVI? Normalize external effects of sun angle, viewing angle, and atmospheric effects Normalize
APPENDIX. Normalized Difference Vegetation Index (NDVI) from MODIS data
 from MODIS data") APPENDIX Land-use/land-cover composition of Apulia region Overall, more than 82% of Apulia contains agro-ecosystems (Figure ). The northern and somewhat the central part of the region include arable lands
APPENDIX Land-use/land-cover composition of Apulia region Overall, more than 82% of Apulia contains agro-ecosystems (Figure ). The northern and somewhat the central part of the region include arable lands
Greening of Arctic: Knowledge and Uncertainties
 Greening of Arctic: Knowledge and Uncertainties Jiong Jia, Hesong Wang Chinese Academy of Science jiong@tea.ac.cn Howie Epstein Skip Walker Moscow, January 28, 2008 Global Warming and Its Impact IMPACTS
Spatial Process VS. Non-spatial Process. Landscape Process
 Spatial Process VS. Non-spatial Process A process is non-spatial if it is NOT a function of spatial pattern = A process is spatial if it is a function of spatial pattern Landscape Process If there is no
NR402 GIS Applications in Natural Resources. Lesson 9: Scale and Accuracy
 NR402 GIS Applications in Natural Resources Lesson 9: Scale and Accuracy 1 Map scale Map scale specifies the amount of reduction between the real world and the map The map scale specifies how much the
IMPROVING REMOTE SENSING-DERIVED LAND USE/LAND COVER CLASSIFICATION WITH THE AID OF SPATIAL INFORMATION
 IMPROVING REMOTE SENSING-DERIVED LAND USE/LAND COVER CLASSIFICATION WITH THE AID OF SPATIAL INFORMATION Yingchun Zhou1, Sunil Narumalani1, Dennis E. Jelinski2 Department of Geography, University of Nebraska,
Detecting Landscape Changes in High Latitude Environments Using Landsat Trend Analysis: 2. Classification
 1 Detecting Landscape Changes in High Latitude Environments Using Landsat Trend Analysis: 2. Classification Ian Olthof and Robert H. Fraser Canada Centre for Mapping and Earth Observation Natural Resources
ISO Land Cover for Agricultural Regions of Canada, Circa 2000 Data Product Specification. Revision: A
 ISO 19131 Land Cover for Agricultural Regions of Canada, Circa 2000 Data Product Specification Revision: A Data specification: Land Cover for Agricultural Regions, circa 2000 Table of Contents 1. OVERVIEW...
Estimation of Wavelet Based Spatially Enhanced Evapotranspiration Using Energy Balance Approach
 Estimation of Wavelet Based Spatially Enhanced Evapotranspiration Using Energy Balance Approach Dr.Gowri 1 Dr.Thirumalaivasan 2 1 Associate Professor, Jerusalem College of Engineering, Department of Civil
Project title. Evaluation of MIR data from SPOT4/VEGETATION for the monitoring of climatic phenomena impact on vegetation
 Project title 1 Evaluation of MIR data from SPOT4/VEGETATION for the monitoring of climatic phenomena impact on vegetation Principal investigator: M-Christine IMBERTI Co-investigator: Frédéric BIARD Stockholm
Monitoring daily evapotranspiration in the Alps exploiting Sentinel-2 and meteorological data
 Monitoring daily evapotranspiration in the Alps exploiting Sentinel-2 and meteorological data M. Castelli, S. Asam, A. Jacob, M. Zebisch, and C. Notarnicola Institute for Earth Observation, Eurac Research,
GLOBAL/CONTINENTAL LAND COVER MAPPING AND MONITORING
 GLOBAL/CONTINENTAL LAND COVER MAPPING AND MONITORING Ryutaro Tateishi, Cheng Gang Wen, and Jong-Geol Park Center for Environmental Remote Sensing (CEReS), Chiba University 1-33 Yayoi-cho Inage-ku Chiba
Land cover/land use mapping and cha Mongolian plateau using remote sens. Title. Author(s) Bagan, Hasi; Yamagata, Yoshiki. Citation Japan.
 Bagan, Hasi; Yamagata, Yoshiki. Citation Japan.") Title Land cover/land use mapping and cha Mongolian plateau using remote sens Author(s) Bagan, Hasi; Yamagata, Yoshiki International Symposium on "The Imp Citation Region Specific Systems". 6 Nove Japan.
Title Land cover/land use mapping and cha Mongolian plateau using remote sens Author(s) Bagan, Hasi; Yamagata, Yoshiki International Symposium on "The Imp Citation Region Specific Systems". 6 Nove Japan.
Use of Thematic Mapper Satellite Imagery, Hemispherical Canopy Photography, and Digital Stream Lines to Predict Stream Shading
 Use of Thematic Mapper Satellite Imagery, Hemispherical Canopy Photography, and Digital Stream Lines to Predict Stream Shading David Nagel GIS Analyst Charlie Luce Research Hydrologist Bárbara Gutiérrez
Influence of Micro-Climate Parameters on Natural Vegetation A Study on Orkhon and Selenge Basins, Mongolia, Using Landsat-TM and NOAA-AVHRR Data
 Cloud Publications International Journal of Advanced Remote Sensing and GIS 2013, Volume 2, Issue 1, pp. 160-172, Article ID Tech-102 ISSN 2320-0243 Research Article Open Access Influence of Micro-Climate
Environmental Impact Assessment Land Use and Land Cover CISMHE 7.1 INTRODUCTION
 7 LAND USE AND LAND COVER 7.1 INTRODUCTION The knowledge of land use and land cover is important for many planning and management activities as it is considered an essential element for modeling and understanding
Drought Estimation Maps by Means of Multidate Landsat Fused Images
 Remote Sensing for Science, Education, Rainer Reuter (Editor) and Natural and Cultural Heritage EARSeL, 2010 Drought Estimation Maps by Means of Multidate Landsat Fused Images Diego RENZA, Estíbaliz MARTINEZ,
A Method to Improve the Accuracy of Remote Sensing Data Classification by Exploiting the Multi-Scale Properties in the Scene
 Proceedings of the 8th International Symposium on Spatial Accuracy Assessment in Natural Resources and Environmental Sciences Shanghai, P. R. China, June 25-27, 2008, pp. 183-188 A Method to Improve the
MAPPING LAND USE/ LAND COVER OF WEST GODAVARI DISTRICT USING NDVI TECHNIQUES AND GIS Anusha. B 1, Sridhar. P 2
 MAPPING LAND USE/ LAND COVER OF WEST GODAVARI DISTRICT USING NDVI TECHNIQUES AND GIS Anusha. B 1, Sridhar. P 2 1 M. Tech. Student, Department of Geoinformatics, SVECW, Bhimavaram, A.P, India 2 Assistant
AGOG 485/585 /APLN 533 Spring Lecture 5: MODIS land cover product (MCD12Q1). Additional sources of MODIS data
. Additional sources of MODIS data") AGOG 485/585 /APLN 533 Spring 2019 Lecture 5: MODIS land cover product (MCD12Q1). Additional sources of MODIS data Outline Current status of land cover products Overview of the MCD12Q1 algorithm Mapping
AGOG 485/585 /APLN 533 Spring 2019 Lecture 5: MODIS land cover product (MCD12Q1). Additional sources of MODIS data Outline Current status of land cover products Overview of the MCD12Q1 algorithm Mapping
This is trial version
 Journal of Rangeland Science, 2012, Vol. 2, No. 2 J. Barkhordari and T. Vardanian/ 459 Contents available at ISC and SID Journal homepage: www.rangeland.ir Full Paper Article: Using Post-Classification
METRIC tm. Mapping Evapotranspiration at high Resolution with Internalized Calibration. Shifa Dinesh
 METRIC tm Mapping Evapotranspiration at high Resolution with Internalized Calibration Shifa Dinesh Outline Introduction Background of METRIC tm Surface Energy Balance Image Processing Estimation of Energy
REMOTE SENSING ACTIVITIES. Caiti Steele
 REMOTE SENSING ACTIVITIES Caiti Steele REMOTE SENSING ACTIVITIES Remote sensing of biomass: Field Validation of Biomass Retrieved from Landsat for Rangeland Assessment and Monitoring (Browning et al.,
An Internet-based Agricultural Land Use Trends Visualization System (AgLuT)
") An Internet-based Agricultural Land Use Trends Visualization System (AgLuT) Prepared for Missouri Department of Natural Resources Missouri Department of Conservation 07-01-2000-12-31-2001 Submitted by
An Internet-based Agricultural Land Use Trends Visualization System (AgLuT) Prepared for Missouri Department of Natural Resources Missouri Department of Conservation 07-01-2000-12-31-2001 Submitted by
UNCERTAINTY AND ERRORS IN GIS
 Christos G. Karydas,, Dr. xkarydas@agro.auth.gr http://users.auth.gr/xkarydas Lab of Remote Sensing and GIS Director: Prof. N. Silleos School of Agriculture Aristotle University of Thessaloniki, GR 1 UNCERTAINTY
Mongolian Academy of Sciences
 Mongolian Academy of Sciences Figure 5. Change of subsurface profile temperature at some observation well in Jakarta. Figure 6. Change of air temperature in Jakarta in the period of 100 years (KLH, BMG,
Our climate system is based on the location of hot and cold air mass regions and the atmospheric circulation created by trade winds and westerlies.
 CLIMATE REGIONS Have you ever wondered why one area of the world is a desert, another a grassland, and another a rainforest? Or have you wondered why are there different types of forests and deserts with
Capabilities and Limitations of Land Cover and Satellite Data for Biomass Estimation in African Ecosystems Valerio Avitabile
 Capabilities and Limitations of Land Cover and Satellite Data for Biomass Estimation in African Ecosystems Valerio Avitabile Kaniyo Pabidi - Budongo Forest Reserve November 13th, 2008 Outline of the presentation
7.1 INTRODUCTION 7.2 OBJECTIVE
 7 LAND USE AND LAND COVER 7.1 INTRODUCTION The knowledge of land use and land cover is important for many planning and management activities as it is considered as an essential element for modeling and
USING HYPERSPECTRAL IMAGERY
 USING HYPERSPECTRAL IMAGERY AND LIDAR DATA TO DETECT PLANT INVASIONS 2016 ESRI CANADA SCHOLARSHIP APPLICATION CURTIS CHANCE M.SC. CANDIDATE FACULTY OF FORESTRY UNIVERSITY OF BRITISH COLUMBIA CURTIS.CHANCE@ALUMNI.UBC.CA
Object-Oriented Oriented Method to Classify the Land Use and Land Cover in San Antonio using ecognition Object-Oriented Oriented Image Analysis
 Object-Oriented Oriented Method to Classify the Land Use and Land Cover in San Antonio using ecognition Object-Oriented Oriented Image Analysis Jayar S. Griffith ES6973 Remote Sensing Image Processing
K&C Phase 4 Status report. Use of short-period ALOS-2 observations for vegetation characterization and classification
 K&C Phase 4 Status report Use of short-period ALOS-2 observations for vegetation characterization and classification Paul Siqueira, Tracy Whelen University of Massachusetts, Amherst Yang Lei NASA JPL Science
Land Cover Project ESA Climate Change Initiative. Processing chain for land cover maps dedicated to climate modellers.
 Land Cover Project ESA Climate Change Initiative Processing chain for land cover maps dedicated to climate modellers land_cover_cci S. Bontemps 1, P. Defourny 1, V. Kalogirou 2, F.M. Seifert 2 and O. Arino
Extent. Level 1 and 2. October 2017
 Extent Level 1 and 2 October 2017 Overview: Extent account 1. Learning objectives 2. Review of Level 0 (5m) 3. Level 1 (Compilers): Concepts (15m) Group exercise and discussion (15m) 4. Level 2 (Data Providers)
LAND COVER CATEGORY DEFINITION BY IMAGE INVARIANTS FOR AUTOMATED CLASSIFICATION
 LAND COVER CATEGORY DEFINITION BY IMAGE INVARIANTS FOR AUTOMATED CLASSIFICATION Nguyen Dinh Duong Environmental Remote Sensing Laboratory Institute of Geography Hoang Quoc Viet Rd., Cau Giay, Hanoi, Vietnam
John R. Mecikalski #1, Martha C. Anderson*, Ryan D. Torn #, John M. Norman*, George R. Diak #
 P4.22 THE ATMOSPHERE-LAND EXCHANGE INVERSE (ALEXI) MODEL: REGIONAL- SCALE FLUX VALIDATIONS, CLIMATOLOGIES AND AVAILABLE SOIL WATER DERIVED FROM REMOTE SENSING INPUTS John R. Mecikalski #1, Martha C. Anderson*,
Overview on Land Cover and Land Use Monitoring in Russia
 Russian Academy of Sciences Space Research Institute Overview on Land Cover and Land Use Monitoring in Russia Sergey Bartalev Joint NASA LCLUC Science Team Meeting and GOFC-GOLD/NERIN, NEESPI Workshop
DEVELOPMENT OF DIGITAL CARTOGRAPHIC DATABASE FOR MANAGING THE ENVIRONMENT AND NATURAL RESOURCES IN THE REPUBLIC OF SERBIA
 DEVELOPMENT OF DIGITAL CARTOGRAPHIC BASE FOR MANAGING THE ENVIRONMENT AND NATURAL RESOURCES IN THE REPUBLIC OF SERBIA Dragutin Protic, Ivan Nestorov Institute for Geodesy, Faculty of Civil Engineering,
CadasterENV Sweden Time series in support of a multi-purpose land cover mapping system at national scale
 CadasterENV Sweden Time series in support of a multi-purpose land cover mapping system at national scale Mats Rosengren, Camilla Jönsson ; Metria AB Marc Paganini ; ESA ESRIN Background CadasterENV Sweden
Evaluating Urban Vegetation Cover Using LiDAR and High Resolution Imagery
 Evaluating Urban Vegetation Cover Using LiDAR and High Resolution Imagery Y.A. Ayad and D. C. Mendez Clarion University of Pennsylvania Abstract One of the key planning factors in urban and built up environments
Preparation of LULC map from GE images for GIS based Urban Hydrological Modeling
 International Conference on Modeling Tools for Sustainable Water Resources Management Department of Civil Engineering, Indian Institute of Technology Hyderabad: 28-29 December 2014 Abstract Preparation
Sensitivity of FIA Volume Estimates to Changes in Stratum Weights and Number of Strata. Data. Methods. James A. Westfall and Michael Hoppus 1
 Sensitivity of FIA Volume Estimates to Changes in Stratum Weights and Number of Strata James A. Westfall and Michael Hoppus 1 Abstract. In the Northeast region, the USDA Forest Service Forest Inventory
Lesson 4b Remote Sensing and geospatial analysis to integrate observations over larger scales
 Lesson 4b Remote Sensing and geospatial analysis to integrate observations over larger scales We have discussed static sensors, human-based (participatory) sensing, and mobile sensing Remote sensing: Satellite
Remote Sensing of Snow GEOG 454 / 654
 Remote Sensing of Snow GEOG 454 / 654 What crysopheric questions can RS help to answer? 2 o Where is snow lying? (Snow-covered area or extent) o How much is there? o How rapidly is it melting? (Area, depth,
Condensing Massive Satellite Datasets For Rapid Interactive Analysis
 Condensing Massive Satellite Datasets For Rapid Interactive Analysis Glenn Grant University of Colorado, Boulder With: David Gallaher 1,2, Qin Lv 1, G. Campbell 2, Cathy Fowler 2, Qi Liu 1, Chao Chen 1,
Yanbo Huang and Guy Fipps, P.E. 2. August 25, 2006
 Landsat Satellite Multi-Spectral Image Classification of Land Cover Change for GIS-Based Urbanization Analysis in Irrigation Districts: Evaluation in Low Rio Grande Valley 1 by Yanbo Huang and Guy Fipps,
Estimating proportional change in forest cover as a continuous variable from multi-year MODIS data
 4176 Estimating proportional change in forest cover as a continuous variable from multi-year MODIS data Daniel J. Hayes a,*, Warren B. Cohen b, Steven A. Sader c, Daniel E. Irwin d a Department of Forest
Remote Sensing Based Inversion of Gap Fraction for Determination of Leaf Area Index. Alemu Gonsamo 1 and Petri Pellikka 1
 Remote Sensing Based Inversion of Gap Fraction for Determination of Leaf Area Index Alemu Gonsamo and Petri Pellikka Department of Geography, University of Helsinki, P.O. Box, FIN- Helsinki, Finland; +-()--;
Pan-Arctic, Regional and Local Land Cover Products
 Pan-Arctic, Regional and Local Land Cover Products Marcel Urban (1), Stefan Pöcking (1), Sören Hese (1) & Christiane Schmullius (1) (1) Friedrich-Schiller University Jena, Department of Earth Observation,
Sources of Imagery and GIS Data Layers (Last updated October 2005)
") Sources of Imagery and GIS Data Layers (Last updated October 2005) The question of where to find data is one often asked by beginners in precision agriculture and other geospatial projects. The following
Sources of Imagery and GIS Data Layers (Last updated October 2005) The question of where to find data is one often asked by beginners in precision agriculture and other geospatial projects. The following
MODIS Snow Cover Mapping Decision Tree Technique: Snow and Cloud Discrimination
 67 th EASTERN SNOW CONFERENCE Jiminy Peak Mountain Resort, Hancock, MA, USA 2010 MODIS Snow Cover Mapping Decision Tree Technique: Snow and Cloud Discrimination GEORGE RIGGS 1, AND DOROTHY K. HALL 2 ABSTRACT
An Internet-based Agricultural Land Use Trends Visualization System (AgLuT)
") An Internet-based Agricultural Land Use Trends Visualization System (AgLuT) Second half yearly report 01-01-2001-06-30-2001 Prepared for Missouri Department of Natural Resources Missouri Department of
An Internet-based Agricultural Land Use Trends Visualization System (AgLuT) Second half yearly report 01-01-2001-06-30-2001 Prepared for Missouri Department of Natural Resources Missouri Department of
LANDSAF SNOW COVER MAPPING USING MSG/SEVIRI DATA
 LANDSAF SNOW COVER MAPPING USING MSG/SEVIRI DATA Niilo Siljamo and Otto Hyvärinen Finnish Meteorological Institute, Erik Palménin aukio 1, P.O.Box 503, FI-00101 Helsinki, Finland Abstract Land Surface
AN INTEGRATED METHOD FOR FOREST CANOPY COVER MAPPING USING LANDSAT ETM+ IMAGERY INTRODUCTION
 AN INTEGRATED METHOD FOR FOREST CANOPY COVER MAPPING USING LANDSAT ETM+ IMAGERY Zhongwu Wang, Remote Sensing Analyst Andrew Brenner, General Manager Sanborn Map Company 455 E. Eisenhower Parkway, Suite
SPATIAL AND TEMPORAL PATTERN OF FOREST/PLANTATION FIRES IN RIAU, SUMATRA FROM 1998 TO 2000
 SPATIAL AND TEMPORAL PATTERN OF FOREST/PLANTATION FIRES IN RIAU, SUMATRA FROM 1998 TO 2000 SHEN Chaomin, LIEW Soo Chin, KWOH Leong Keong Centre for Remote Imaging, Sensing and Processing (CRISP) Faculty
Progress Report Year 2, NAG5-6003: The Dynamics of a Semi-Arid Region in Response to Climate and Water-Use Policy
 Progress Report Year 2, NAG5-6003: The Dynamics of a Semi-Arid Region in Response to Climate and Water-Use Policy Principal Investigator: Dr. John F. Mustard Department of Geological Sciences Brown University
REMOTELY SENSED INFORMATION FOR CROP MONITORING AND FOOD SECURITY
 LEARNING OBJECTIVES Lesson 4 Methods and Analysis 2: Rainfall and NDVI Seasonal Graphs At the end of the lesson, you will be able to: understand seasonal graphs for rainfall and NDVI; describe the concept
KNOWLEDGE-BASED CLASSIFICATION OF LAND COVER FOR THE QUALITY ASSESSEMENT OF GIS DATABASE. Israel -
 KNOWLEDGE-BASED CLASSIFICATION OF LAND COVER FOR THE QUALITY ASSESSEMENT OF GIS DATABASE Ammatzia Peled a,*, Michael Gilichinsky b a University of Haifa, Department of Geography and Environmental Studies,
Land cover classification methods
 Land cover classification methods This document provides an overview of land cover classification using remotely sensed data. We will describe different options for conducting land cover classification
System of Environmental-Economic Accounting. Advancing the SEEA Experimental Ecosystem Accounting. Extent Account (Levels 1 and 2)
") Advancing the SEEA Experimental Ecosystem Accounting Extent Account (Levels 1 and 2) Overview: The Extent Account 1. Learning objectives 2. Review of Level 0 (5m) What is it? Why do we need it? What does
Advancing the SEEA Experimental Ecosystem Accounting Extent Account (Levels 1 and 2) Overview: The Extent Account 1. Learning objectives 2. Review of Level 0 (5m) What is it? Why do we need it? What does
Comparison of MSG-SEVIRI and SPOT-VEGETATION data for vegetation monitoring over Africa
 Comparison of MSG-SEVIRI and SPOT-VEGETATION data for vegetation monitoring over Africa Bernard LACAZE CNRS UMR 8586 PRODIG Pôle Image et Campus Spatial, Université Paris Diderot Paris 7 Objectives Comparison
Vegetation Change Detection of Central part of Nepal using Landsat TM
 Vegetation Change Detection of Central part of Nepal using Landsat TM Kalpana G. Bastakoti Department of Geography, University of Calgary, kalpanagb@gmail.com Abstract This paper presents a study of detecting
Seasonal and interannual relations between precipitation, soil moisture and vegetation in the North American monsoon region
 Seasonal and interannual relations between precipitation, soil moisture and vegetation in the North American monsoon region Luis A. Mendez-Barroso 1, Enrique R. Vivoni 1, Christopher J. Watts 2 and Julio
LAND USE MAPPING AND MONITORING IN THE NETHERLANDS (LGN5)
") LAND USE MAPPING AND MONITORING IN THE NETHERLANDS (LGN5) Hazeu, Gerard W. Wageningen University and Research Centre - Alterra, Centre for Geo-Information, The Netherlands; gerard.hazeu@wur.nl ABSTRACT
LAND USE MAPPING AND MONITORING IN THE NETHERLANDS (LGN5) Hazeu, Gerard W. Wageningen University and Research Centre - Alterra, Centre for Geo-Information, The Netherlands; gerard.hazeu@wur.nl ABSTRACT
VISUALIZATION URBAN SPATIAL GROWTH OF DESERT CITIES FROM SATELLITE IMAGERY: A PRELIMINARY STUDY
 CO-439 VISUALIZATION URBAN SPATIAL GROWTH OF DESERT CITIES FROM SATELLITE IMAGERY: A PRELIMINARY STUDY YANG X. Florida State University, TALLAHASSEE, FLORIDA, UNITED STATES ABSTRACT Desert cities, particularly
ANALYSIS AND VALIDATION OF A METHODOLOGY TO EVALUATE LAND COVER CHANGE IN THE MEDITERRANEAN BASIN USING MULTITEMPORAL MODIS DATA
 PRESENT ENVIRONMENT AND SUSTAINABLE DEVELOPMENT, NR. 4, 2010 ANALYSIS AND VALIDATION OF A METHODOLOGY TO EVALUATE LAND COVER CHANGE IN THE MEDITERRANEAN BASIN USING MULTITEMPORAL MODIS DATA Mara Pilloni
Many of remote sensing techniques are generic in nature and may be applied to a variety of vegetated landscapes, including
 Remote Sensing of Vegetation Many of remote sensing techniques are generic in nature and may be applied to a variety of vegetated landscapes, including 1. Agriculture 2. Forest 3. Rangeland 4. Wetland,
Assessing the potential of VEGETATION sensor data for mapping snow and ice cover: a Normalized DiVerence Snow and Ice Index
 int. j. remote sensing, 2001, vol. 22, no. 13, 2479 2487 Assessing the potential of VEGETATION sensor data for mapping snow and ice cover: a Normalized DiVerence Snow and Ice Index XIANGMING XIAO Complex
Patrick Leinenkugel. German Aerospace Center (DLR) Vortrag > Autor > Dokumentname > Datum
 Vortrag > Autor > Dokumentname > Datum") Characterisation of land surface phenology and land cover for the Mekong Basin on the basis of multitemporal and multispectral satellite data from the MODIS Sensor Patrick Leinenkugel German Aerospace
Characterisation of land surface phenology and land cover for the Mekong Basin on the basis of multitemporal and multispectral satellite data from the MODIS Sensor Patrick Leinenkugel German Aerospace
Quick Response Report #126 Hurricane Floyd Flood Mapping Integrating Landsat 7 TM Satellite Imagery and DEM Data
 Quick Response Report #126 Hurricane Floyd Flood Mapping Integrating Landsat 7 TM Satellite Imagery and DEM Data Jeffrey D. Colby Yong Wang Karen Mulcahy Department of Geography East Carolina University
Spatial Drought Assessment Using Remote Sensing and GIS techniques in Northwest region of Liaoning, China
 Spatial Drought Assessment Using Remote Sensing and GIS techniques in Northwest region of Liaoning, China FUJUN SUN, MENG-LUNG LIN, CHENG-HWANG PERNG, QIUBING WANG, YI-CHIANG SHIU & CHIUNG-HSU LIU Department
UK Contribution to the European CORINE Land Cover
 Centre for Landscape andwww.le.ac.uk/clcr Climate Research CENTRE FOR Landscape and Climate Research UK Contribution to the European CORINE Land Cover Dr Beth Cole Corine Coordination of Information on
Comparison between Land Surface Temperature Retrieval Using Classification Based Emissivity and NDVI Based Emissivity
 Comparison between Land Surface Temperature Retrieval Using Classification Based Emissivity and NDVI Based Emissivity Isabel C. Perez Hoyos NOAA Crest, City College of New York, CUNY, 160 Convent Avenue,
Applications of GIS and Remote Sensing for Analysis of Urban Heat Island
 Chuanxin Zhu Professor Peter V. August Professor Yeqiao Wang NRS 509 December 15, 2016 Applications of GIS and Remote Sensing for Analysis of Urban Heat Island Since the last century, the global mean surface
EFFECT OF ANCILLARY DATA ON THE PERFORMANCE OF LAND COVER CLASSIFICATION USING A NEURAL NETWORK MODEL. Duong Dang KHOI.
 EFFECT OF ANCILLARY DATA ON THE PERFORMANCE OF LAND COVER CLASSIFICATION USING A NEURAL NETWORK MODEL Duong Dang KHOI 1 10 Feb, 2011 Presentation contents 1. Introduction 2. Methods 3. Results 4. Discussion
Urban Growth Analysis: Calculating Metrics to Quantify Urban Sprawl
 Urban Growth Analysis: Calculating Metrics to Quantify Urban Sprawl Jason Parent jason.parent@uconn.edu Academic Assistant GIS Analyst Daniel Civco Professor of Geomatics Center for Land Use Education
A Small Migrating Herd. Mapping Wildlife Distribution 1. Mapping Wildlife Distribution 2. Conservation & Reserve Management
 A Basic Introduction to Wildlife Mapping & Modeling ~~~~~~~~~~ Rev. Ronald J. Wasowski, C.S.C. Associate Professor of Environmental Science University of Portland Portland, Oregon 8 December 2015 Introduction
Methods review for the Global Land Cover 2000 initiative Presentation made by Frédéric Achard on November 30 th 2000
 Methods review for the Global Land Cover 2000 initiative Presentation made by Frédéric Achard on November 30 th 2000 1. Contents Objectives Specifications of the GLC-2000 exercise Strategy for the analysis
Landuse and Landcover change analysis in Selaiyur village, Tambaram taluk, Chennai
 Landuse and Landcover change analysis in Selaiyur village, Tambaram taluk, Chennai K. Ilayaraja Department of Civil Engineering BIST, Bharath University Selaiyur, Chennai 73 ABSTRACT The synoptic picture
Looking at the big picture to plan land treatments
 Looking at the big picture to plan land treatments Eva Strand Department of Rangeland Ecology and Management University of Idaho evas@uidaho.edu, http://www.cnr.uidaho.edu/range Why land treatment planning?
Arctic Tundra land cover and biomass change on the Central Yamal peninsula, Russia
 Arctic Tundra land cover and biomass change on the Central Yamal peninsula, Russia ArcticBiomass Workshop, 20-23 Ocrobertember 2015, Svalbard Kumpula, T.*, Verdonen, M*., Macias-Fauria, M***, Skarin A.****
The Wide Dynamic Range Vegetation Index and its Potential Utility for Gap Analysis
 Summary StatMod provides an easy-to-use and inexpensive tool for spatially applying the classification rules generated from the CT algorithm in S-PLUS. While the focus of this article was to use StatMod
A Facility for Producing Consistent Remotely Sensed Biophysical Data Products of Australia
 TERRESTRIAL ECOSYSTEM RESEARCH NETWORK - AusCover - A Facility for Producing Consistent Remotely Sensed Biophysical Data Products of Australia June, 2011 Mervyn Lynch Professor of Remote Sensing Curtin
SNOW COVER MAPPING USING METOP/AVHRR AND MSG/SEVIRI
 SNOW COVER MAPPING USING METOP/AVHRR AND MSG/SEVIRI Niilo Siljamo, Markku Suomalainen, Otto Hyvärinen Finnish Meteorological Institute, P.O.Box 503, FI-00101 Helsinki, Finland Abstract Weather and meteorological
Digital Change Detection Using Remotely Sensed Data for Monitoring Green Space Destruction in Tabriz
 Int. J. Environ. Res. 1 (1): 35-41, Winter 2007 ISSN:1735-6865 Graduate Faculty of Environment University of Tehran Digital Change Detection Using Remotely Sensed Data for Monitoring Green Space Destruction
C O P E R N I C U S F O R G I P R O F E S S I O N A L S
 C O P E R N I C U S F O R G I P R O F E S S I O N A L S Downstream Applications MALTA 2017-06-26 Pascal Lory, EUROGI EU EU EU www.copernicus.eu S c o p e Identifying urban housing density: Stella Ofori-Ampofo,
Digital Elevation Models (DEM) / DTM
 / DTM") Digital Elevation Models (DEM) / DTM Uses in remote sensing: queries and analysis, 3D visualisation, layers in classification Fogo Island, Cape Verde Republic ASTER DEM / image Banks Peninsula, Christchurch,
Digital Elevation Models (DEM) / DTM Uses in remote sensing: queries and analysis, 3D visualisation, layers in classification Fogo Island, Cape Verde Republic ASTER DEM / image Banks Peninsula, Christchurch,
BGD. Biogeosciences Discussions
 Biogeosciences Discuss., www.biogeosciences-discuss.net/8/c1604/2011/ Author(s) 2011. This work is distributed under the Creative Commons Attribute 3.0 License. Biogeosciences Discussions comment on Analysis
The characteristics of water resources in XinJiang Uyghur Autonomous Region, China, using GIS and remote sensing
 The characteristics of water resources in XinJiang Uyghur Autonomous Region, China, using GIS and remote sensing Dilnur Aji 1), Akihiko Kondoh 2) 1) Graduate School of Science and Technology,Chiba University
How does the physical environment influence communities and ecosystems? Hoodoos in Cappadocia, Turkey
 Biomes of the World How does the physical environment influence communities and ecosystems? Hoodoos in Cappadocia, Turkey ecosystems are shaped by: abiotic factors climate/weather space Rainfall Soil air
Soil Moisture Prediction and Assimilation
 Soil Moisture Prediction and Assimilation Analysis and Prediction in Agricultural Landscapes Saskatoon, June 19-20, 2007 STEPHANE BELAIR Meteorological Research Division Prediction and Assimilation Atmospheric
Validation of NOAA Interactive Snow Maps in the North American region with National Climatic Data Center Ground-based Data
 City University of New York (CUNY) CUNY Academic Works Master's Theses City College of New York 2011 Validation of NOAA Interactive Snow Maps in the North American region with National Climatic Data Center
Deriving Uncertainty of Area Estimates from Satellite Imagery using Fuzzy Land-cover Classification
 International Journal of Information and Computation Technology. ISSN 0974-2239 Volume 3, Number 10 (2013), pp. 1059-1066 International Research Publications House http://www. irphouse.com /ijict.htm Deriving
Temporal and spatial approaches for land cover classification.
 Temporal and spatial approaches for land cover classification. Ryabukhin Sergey sergeyryabukhin@gmail.com Abstract. This paper describes solution for Time Series Land Cover Classification Challenge (TiSeLaC).
The use of satellite images to forecast agricultural production
 The use of satellite images to forecast agricultural production Artur Łączyński Central Statistical Office, Agriculture Department Niepodległości 208 Warsaw, Poland E-mail a.laczynski@stat.gov.pl DOI:
GEOG Lecture 8. Orbits, scale and trade-offs
 Environmental Remote Sensing GEOG 2021 Lecture 8 Orbits, scale and trade-offs Orbits revisit Orbits geostationary (36 000 km altitude) polar orbiting (200-1000 km altitude) Orbits revisit Orbits geostationary
SATELLITE REMOTE SENSING
 SATELLITE REMOTE SENSING of NATURAL RESOURCES David L. Verbyla LEWIS PUBLISHERS Boca Raton New York London Tokyo Contents CHAPTER 1. SATELLITE IMAGES 1 Raster Image Data 2 Remote Sensing Detectors 2 Analog
Assessing Drought in Agricultural Area of central U.S. with the MODIS sensor
 Assessing Drought in Agricultural Area of central U.S. with the MODIS sensor Di Wu George Mason University Oct 17 th, 2012 Introduction: Drought is one of the major natural hazards which has devastating
Reduction of Cloud Obscuration in the MODIS Snow Data Product
 59th EASTERN SNOW CONFERENCE Stowe, Vermont USA 2002 Reduction of Cloud Obscuration in the MODIS Snow Data Product GEORGE RIGGS 1 AND DOROTHY K. HALL 2 ABSTRACT A challenging problem in snow mapping is
Monitoring Vegetation Growth of Spectrally Landsat Satellite Imagery ETM+ 7 & TM 5 for Western Region of Iraq by Using Remote Sensing Techniques.
 Monitoring Vegetation Growth of Spectrally Landsat Satellite Imagery ETM+ 7 & TM 5 for Western Region of Iraq by Using Remote Sensing Techniques. Fouad K. Mashee, Ahmed A. Zaeen & Gheidaa S. Hadi Remote