The Beleaguered Figure 15
|
|
|
- Pamela Boone
- 5 years ago
- Views:
Transcription

1 The Beleaguered Figure 15 TFMA 2015 Fall Technical Summit After the Floods: Texas Rising Craig Loftin, PE, CFM US Weather Bureau Technical Paper No. 40, Figure 15 Village Creek Watershed 1
 100-Year")
 2")
2 100-Year 30-Minute Rainfall (Inches) 100-Year 1-Hour Rainfall (Inches) 100-Year 2-Hour Rainfall (Inches) 2
 100-Year 12-Hour Rainfall")
3 100-Year 3-Hour Rainfall (Inches) 100-Year 6-Hour Rainfall (Inches) 100-Year 12-Hour Rainfall (Inches) 3
 100-Year")
 4")
4 100-Year 24-Hour Rainfall (Inches) 100-Year 30-Minute Rainfall (Inches) 100-Year 1-Hour Rainfall (Inches) 4
 100-Year 6-Hour Rainfall (Inches)")
5 100-Year 2-Hour Rainfall (Inches) 100-Year 3-Hour Rainfall (Inches) 100-Year 6-Hour Rainfall (Inches) 5
")

6 100-Year 12-Hour Rainfall (Inches) 100-Year 24-Hour Rainfall (Inches) Dallas TP-40 Data 6
7 Dallas TP-40 Data USGS Water Resources Investigations Report USGS Water Resources Investigations Report
8 USGS Water Resources Investigations Report Location Parameter 15-Minute Duration Location Parameter 30-Minute Duration 8
9 Location Parameter 60-Minute Duration Location Parameter 1-Hour Duration Location Parameter 2-Hour Duration 9
10 Location Parameter 3-Hour Duration Location Parameter 6-Hour Duration Location Parameter 12-Hour Duration 10
11 Location Parameter 24-Hour Duration Location Parameter 1-Day Duration Scale Parameter 15-Minute Duration 11
12 Scale Parameter 30-Minute Duration Scale Parameter 60-Minute Duration Scale Parameter 1-Hour Duration 12
13 Scale Parameter 2-Hour Duration Scale Parameter 3-Hour Duration Scale Parameter 6-Hour Duration 13
14 Scale Parameter 12-Hour Duration Scale Parameter 24-Hour Duration Scale Parameter 1-Day Duration 14
15 Shape Parameter 15-Minute Duration Shape Parameter 30-Minute Duration Shape Parameter 60-Minute Duration 15
16 Shape Parameter 1-Hour Duration Shape Parameter 2-Hour Duration Shape Parameter 3-Hour Duration 16
17 Shape Parameter 6-Hour Duration Shape Parameter 12-Hour Duration Shape Parameter 24-Hour Duration 17

18 USGS Scientific Investigations Report USGS Scientific Investigations Report USGS Scientific Investigations Report
19 USGS Scientific Investigations Report Depth of Precipitation, 100-Year Storm 15-Minute Duration Depth of Precipitation, 100-Year Storm 30-Minute Duration 19
20 Depth of Precipitation, 100-Year Storm 1-Hour Duration Depth of Precipitation, 100-Year Storm 2-Hour Duration Depth of Precipitation, 100-Year Storm 3-Hour Duration 20
21 Depth of Precipitation, 100-Year Storm 6-Hour Duration Depth of Precipitation, 100-Year Storm 12-Hour Duration Depth of Precipitation, 100-Year Storm 12-Hour Duration 21
22 Depth of Precipitation, 100-Year Storm 1-Day Duration Depth of Precipitation, 100-Year Storm 2-Day Duration Depth of Precipitation, 100-Year Storm 3-Day Duration 22
23 Depth of Precipitation, 100-Year Storm 5-Day Duration Depth of Precipitation, 100-Year Storm 3-Day Duration NOAA Technical Memorandum NWS HYDRO-35 23
 100-Year 60-Minute")

24 2-Year 60-Minute Precipitation (inches) 100-Year 60-Minute Precipitation (inches) 2-Year 5-Minute Precipitation (inches) 24
 100-Year 15-Minute Precipitation")
25 100-Year 5-Minute Precipitation (inches) 2-Year 15-Minute Precipitation (inches) 100-Year 15-Minute Precipitation (inches) 25

26 HYDRO-35 Data at Dallas HYDRO-35 Data at Dallas Spliced and Adjusted Results at Dallas 26


27 Spliced and Adjusted Results at Dallas Expanded Results at Dallas Expanded Results at Dallas 27
28 Mass Curve Redistributed Mass Curve Distributed Storm (5-minute time step) 28
 Distributed Storm (1-hour time step)")
29 Distributed Storm (15-minute time step) Distributed Storm (30-minute time step) Distributed Storm (1-hour time step) 29
")
")
30 Distributed Storm (2-hour time step) Distributed Storm (3-hour time step) Distributed Storm (6-hour time step) 30
")


31 Distributed Storm (12-hour time step) Distributed Storm (24-hour time step) NUDALLAS/SWFHYD Precipitation Inputs 31

32 HEC-1 Precipitation Inputs HEC-HMS Precipitation Inputs HEC-HMS Precipitation Inputs 32
33 HEC-1 and HEC-HMS Point to Areal Depth Conversion HEC-1 and HEC-HMS Area Reduction Factor (ARF) Improved fit by adding an area multiplier per duration 33
34 Weather Bureau Technical Paper No. 40 Weather Bureau Technical Paper No. 29, Part 1 The Ohio Valley WB TP-29, Part 1 The Ohio Valley Sources of Rainfall Data 34


35 WB TP-29, Part 1 The Ohio Valley ARF Curves and Map of Dense Networks WB TP-29, Part 1 The Ohio Valley Example Computation of ARF WB TP-29, Part 1 The Ohio Valley Network Area, Subdivision, and Limitations 35


36 WB TP-29, Part 1 The Ohio Valley Duration a major Parameter but Depth not a Parameter WB TP-29, Part 1 The Ohio Valley Need for Judgment and Basis of ARF Curves Weather Bureau Technical Paper No. 29, Part 2 Southeastern US 36
37 WB TP-29, Part 2 Southeastern US Sources of Rainfall Data WB TP-29, Part 2 Southeastern US Map of Nationwide Dense Networks WB TP-29, Part 2 Southeastern US Nationwide Dense Network Statistics 37

38 WB TP-29, Part 2 Southeastern US ARF Curves WB TP-29, Part 2 Southeastern US Example Computation of ARF WB TP-29, Part 2 Southeastern US Discussion of various Area-Depth Relationships 38

39 US Weather Bureau Technical Paper No. 40, Figure 15 NOAA Technical Report NWS 24 NOAA Technical Report NWS 24 2-Year Depth-Area Ratios at Chicago 39


40 NOAA Technical Report NWS Year Depth-Area Ratios at Chicago NOAA Technical Report NWS 24 Extended 2-Year Depth-Area Ratios at Chicago NOAA Technical Report NWS 24 Commentary on Nature of Classical ARFs 40

41 USGS Water Resources Investigations Report USGS Water Resources Investigations Report USGS Water Resources Investigations Report

42 USGS Water Resources Investigations Report Frequency Considerations USGS Water Resources Investigations Report Empirical Depth-Distance Relations for Austin, Dallas, Houston USGS Water Resources Investigations Report ARFs for 1-Day Design Storms at Austin, Dallas, Houston 42


43 USGS Water Resources Investigations Report Observation re. applicability relative to watershed TOC. Journal of Hydrology Article: Precipitation areal-reduction factor estimation using an annual-maxima centered approach TX Transportation Inst. at A&M Report : Calculation of Areal Reduction Factors Using NEXRAD Precipitation Estimates 43


44 TX Transportation Inst. at A&M Report : Calculation of Areal Reduction Factors Using NEXRAD Precipitation Estimates TTI at A&M Report ARF-Area Plot for Region 4, Storm Duration of 24 Hours TTI at A&M Report ARF-Area Plots for Region 4, Storm Duration of 24 Hours 44
 100% HEC-1/HEC-HMS Equation 90% 80% 70% 60% Proposed Extension Curve 50% 1981 Area-Depth 40% 30% 20% 10% 0% 0 1000 2000 3000 4000 5000 6000")
45 % of Total Depth 10/4/2015 TTI at A&M Report Comparison with Former Studies TTI at A&M Report Comparison or ARF-Area curves to those from other studies USACE SWF Upper Trinity River Basin research Figure 15 Extension (All Storms - 24 Hour) 100% HEC-1/HEC-HMS Equation 90% 80% 70% 60% Proposed Extension Curve 50% 1981 Area-Depth 40% 30% 20% 10% 0% Area in Sq. Mi. 45
46 % of Total Depth % of Total Depth % of Total Depth 10/4/2015 USACE SWF Upper Trinity River Basin research 100% Figure 15 Extension (All Storms - 24 Hour) HEC-1/HEC-HMS Equation 90% Proposed Extension Curve 80% 70% 1981 Area-Depth Curve 60% 50% 40% 30% 20% 10% 0% Area in Sq. Mi. USACE SWF Upper Trinity River Basin research 1.00 Figure 15 Extension (All Storms - 6 Hour) 0.90 HEC-1/HEC-HMS Equation Oct Proposed Extension Curve 1981 Area-Depth Curve HEC-1 Proposed Extension Curve Area in Sq. Mi. USACE SWF Upper Trinity River Basin research 1.00 Figure 15 Extension (All Storms - 6 Hour) HEC-1/HEC-HMS Equation Proposed Extension Curve Area-Depth Curve 10-Oct HEC Proposed Extension Curve Area in Sq. Mi. 46
47 % of Total Depth % of Total Depth 10/4/2015 USACE SWF Upper Trinity River Basin research 1.00 Figure 15 Extension (All Storms - 1 Hour) HEC-1/HEC-HMS Equation HEC-1/ HEC-HMS Equation 10-Oct Area-Depth Curve Area in Sq. Mi. USACE SWF Upper Trinity River Basin research 1.00 Figure 15 Extension (All Storms - 1 Hour) HEC-1/HEC-HMS Equation Area-Depth Curve HEC-1/ HEC-HMS Equation 10-Oct Area in Sq. Mi. USACE SWF Upper Trinity River Basin research 47
48 USACE SWF Upper Trinity River Basin research US Weather Bureau Technical Paper No. 40, Figure 15 The Changing Paradigm for Configuring Hypothetical Storms - more robust use of recorded storm events as proxies - attempts to define specific frequencies for those events - potential use of bracketed durations - attempts to establish appropriate/consistent ARFs - attempts to optimize elliptical storm position 48


49 USACE SWF Upper Trinity River Basin research USACE SWF Upper Trinity River Basin research In this presenter s view, with regards to the NFIP Consistency has greater net value than does perceived accuracy. We should strive to let our truly meaningful technical experiences gained over time be our primary guide. 49
50 Questions and Discussion 50
The Beleaguered Figure 15 TFMA 2015 Fall Technical Summit After the Floods: Texas Rising
 The Beleaguered Figure 15 TFMA 2015 Fall Technical Summit After the Floods: Texas Rising Craig Loftin, PE, CFM US Weather Bureau Technical Paper No. 40, Figure 15 Village Creek Watershed 100-Year 30-Minute
Extreme Precipitation, NOAA Atlas 14, Other InFRM Initiatives What Can You Do?
 Extreme Precipitation, NOAA Atlas 14, Other InFRM Initiatives What Can You Do? Date: 19 September2018 Audience: TX Civil Engineering Conference, San Marcos, TX Jerry L. Cotter P.E., Chief Water Resources
TXHYETO.XLS: A Tool To Facilitate Use of Texas- Specific Hyetographs for Design Storm Modeling. Caroline M. Neale Texas Tech University
 TXHYETO.XLS: A Tool To Facilitate Use of Texas- Specific Hyetographs for Design Storm Modeling Caroline M. Neale Texas Tech University Acknowledgements Funding and direction provided by the Texas Department
New NOAA Precipitation-Frequency Atlas for Wisconsin
 New NOAA Precipitation-Frequency Atlas for Wisconsin #215966 Presentation to the Milwaukee Metropolitan Sewerage District Technical Advisory Team January 16, 2014 Michael G. Hahn, P.E., P.H. SEWRPC Chief
Areal Reduction Factors for the Colorado Front Range and Analysis of the September 2013 Colorado Storm
 Areal Reduction Factors for the Colorado Front Range and Analysis of the September 2013 Colorado Storm Doug Hultstrand, Bill Kappel, Geoff Muhlestein Applied Weather Associates, LLC - Monument, Colorado
Design Storms for Hydrologic Analysis
 Design Storms for Hydrologic Analysis Course Description This course is designed to fulfill two hours of continuing education credit for Professional Engineers. Its objective is to provide students with
Areal Reduction Factors for the Colorado Front Range and Analysis of the September 2013 Colorado Storm
 Areal Reduction Factors for the Colorado Front Range and Analysis of the September 2013 Colorado Storm Doug Hultstrand, Bill Kappel, Geoff Muhlestein Applied Weather Associates, LLC - Monument, Colorado
RAINFALL FREQUENCY ANALYSIS FOR NEW BRAUNFELS, TX (or Seems like we ve been having lots of 100-yr storms)
") RAINFALL FREQUENCY ANALYSIS FOR NEW BRAUNFELS, TX (or Seems like we ve been having lots of 100-yr storms) Presented By: SAUL NUCCITELLI, PE, CFM (LAN) BLAKE KRONKOSKY, EIT (LAN) JIM KLEIN, PE (CITY OF
RAINFALL FREQUENCY ANALYSIS FOR NEW BRAUNFELS, TX (or Seems like we ve been having lots of 100-yr storms) Presented By: SAUL NUCCITELLI, PE, CFM (LAN) BLAKE KRONKOSKY, EIT (LAN) JIM KLEIN, PE (CITY OF
Las Colonias Subdivision September 2010 Flood Study
 Las Colonias Subdivision September 2010 Flood Study Curtis Beitel, P.E., CFM Scott Muchard, P.E. Project Engineer William Badini, CFM Senior Meteorologist Location Map Background Los Colonias Subdivision
Depth-Duration Frequency (DDF) and Depth-Area- Reduction Factors (DARF)
 and Depth-Area- Reduction Factors (DARF)") Spatial Analysis of Storms Using GIS Brian Hoblit, Steve Zelinka, Cris Castello, and David Curtis Abstract Point data from rain gages have been historically used to develop depth-area relationships, design
Spatial Analysis of Storms Using GIS Brian Hoblit, Steve Zelinka, Cris Castello, and David Curtis Abstract Point data from rain gages have been historically used to develop depth-area relationships, design
San Antonio River Authority. San Antonio River Authority Floodworks implementation in the San Antonio River Basin. Nefi Garza, PE, CFM
 San Antonio River Authority Floodworks implementation in the San Antonio River Basin Nefi Garza, PE, CFM San Antonio River Authority Michael Crenshaw, PE, CFM Anthony J. Henry Wallingford Software, Inc
Model Calibration and Forecast Error for NFIE-Hydro
 Corey Van Dyk C E 397 Flood Forecasting 5/8/15 Model Calibration and Forecast Error for NFIE-Hydro Introduction The forecasting component of the National Flood Interoperability Experiment (NFIE), like
Leon Creek Watershed October 17-18, 1998 Rainfall Analysis Examination of USGS Gauge Helotes Creek at Helotes, Texas
 Leon Creek Watershed October 17-18, 1998 Rainfall Analysis Examination of USGS Gauge 8181400 Helotes Creek at Helotes, Texas Terrance Jackson MSCE Candidate University of Texas San Antonio Abstract The
Detailed Storm Rainfall Analysis for Hurricane Ivan Flooding in Georgia Using the Storm Precipitation Analysis System (SPAS) and NEXRAD Weather Radar
 and NEXRAD Weather Radar") Detailed Storm Rainfall Analysis for Hurricane Ivan Flooding in Georgia Using the Storm Precipitation Analysis System (SPAS) and NEXRAD Weather Radar Ed Tomlinson, PhD and Bill Kappel Applied Weather Associates
Detailed Storm Rainfall Analysis for Hurricane Ivan Flooding in Georgia Using the Storm Precipitation Analysis System (SPAS) and NEXRAD Weather Radar Ed Tomlinson, PhD and Bill Kappel Applied Weather Associates
Hydrologic Evaluation of the Blanchard River
 Hydrologic Evaluation of the Blanchard River Hancock County Flood Risk Reduction Program Prepared for: Maumee Watershed Conservancy District 1464 Pinehurst Dr. Defiance, Ohio 43512 Prepared by: Stantec
NRC Workshop - Probabilistic Flood Hazard Assessment Jan 2013
 Regional Precipitation-Frequency Analysis And Extreme Storms Including PMP Current State of Understanding/Practice Mel Schaefer Ph.D. P.E. MGS Engineering Consultants, Inc. Olympia, WA NRC Workshop - Probabilistic
Real-Time Flood Forecasting Modeling in Nashville, TN utilizing HEC-RTS
 Real-Time Flood Forecasting Modeling in Nashville, TN utilizing HEC-RTS Brantley Thames, P.E. Hydraulic Engineer, Water Resources Section Nashville District, USACE August 24, 2017 US Army Corps of Engineers
LITERATURE REVIEW. History. In 1888, the U.S. Signal Service installed the first automatic rain gage used to
 LITERATURE REVIEW History In 1888, the U.S. Signal Service installed the first automatic rain gage used to record intensive precipitation for short periods (Yarnell, 1935). Using the records from this
NRC Workshop Probabilistic Flood Hazard Assessment (PFHA) Jan 29-31, Mel Schaefer Ph.D. P.E. MGS Engineering Consultants, Inc.
 Jan 29-31, Mel Schaefer Ph.D. P.E. MGS Engineering Consultants, Inc.") Stochastic Event Flood Model (SEFM) Stochastic Modeling of Extreme Floods A Hydrological Tool for Analysis of Extreme Floods Mel Schaefer Ph.D. P.E. MGS Engineering Consultants, Inc. Olympia, WA NRC Workshop
Stochastic Event Flood Model (SEFM) Stochastic Modeling of Extreme Floods A Hydrological Tool for Analysis of Extreme Floods Mel Schaefer Ph.D. P.E. MGS Engineering Consultants, Inc. Olympia, WA NRC Workshop
Area-Depth Studies for Thunderstorm Rainfall in Illinois
 Circular No. 39 1952 STATE OF ILLINOIS Area-Depth Studies for Thunderstorm Rainfall in Illinois by F. A. HUFF AND G. E. STOUT Issued by Department of Registration and Education C. HOBART ENGLE, Director
Another 100-Year Storm. October 26, 2016 Mark Dennis, PE, CFM
 Another 100-Year Storm October 26, 2016 Mark Dennis, PE, CFM Agenda Are severe rainfall events becoming more frequent? Is there confusion about the 100-year storm that makes it seem like they happen all
David R. Vallee Hydrologist-in-Charge NOAA/NWS Northeast River Forecast Center
 David R. Vallee Hydrologist-in-Charge NOAA/NWS Northeast River Forecast Center Record flooding along the Shawsheen River during the 2006 Mother s Day Floods Calibrate and implement a variety of hydrologic
Monte Carlo Simulations for Probabilistic Flood Hazard Assessment
 Monte Carlo Simulations for Probabilistic Flood Hazard Assessment Jemie Dababneh, Ph.D., P.E., 1 and Mark Schwartz, P.E. 1 1 RIZZO Associates, Monroeville, Pennsylvania Presentation to PSA 2017 International
HEC-HMS Lab 4 Using Frequency Storms in HEC-HMS
 HEC-HMS Lab 4 Using Frequency Storms in HEC-HMS Created by Venkatesh Merwade (vmerwade@purdue.edu) Learning outcomes The objective of this lab is to learn how HEC-HMS is used to determine design flow by
TRWD Upper Trinity River Flood Operations Decision Support System
 TRWD Upper Trinity River Flood Operations Decision Support System TFMA 2012 Fall Conference Rockwall, Texas September 20, 2012 Presented by: Andrew Ickert, PE, CFM & Craig Ottman, PE, CFM (Halff Associates,
Basins-Level Heavy Rainfall and Flood Analyses
 Basins-Level Heavy Rainfall and Flood Analyses Peng Gao, Greg Carbone, and Junyu Lu Department of Geography, University of South Carolina (gaop@mailbox.sc.edu, carbone@mailbox.sc.edu, jlu@email.sc.edu)
Pompton Lakes Dam Downstream Effects of the Floodgate Facility. Joseph Ruggeri Brian Cahill Michael Mak Andy Bonner
 Pompton Lakes Dam Downstream Effects of the Joseph Ruggeri Brian Cahill Michael Mak Andy Bonner ASFPM 2013: Overview Page 2 Overview Page 3 Overview Page 4 Overview Page 5 Overview - Historical Pompton
Flood Event Analysis to Estimate the Avoided Damages Due to Flood Improvement Projects & Voluntary Buyout Program
 Flood Event Analysis to Estimate the Avoided Damages Due to Flood Improvement Projects & Voluntary Buyout Program Ataul Hannan, P.E., CFM Planning Division Director Harris County Flood Control District
NWS Mission 5/25/2017. Innovations in Flood Forecasting at the National Weather Service West Gulf River Forecast Center
 Innovations in Flood Forecasting at the National Weather Service West Gulf River Forecast Center Kris Lander, PE, CFM Gregory Waller NWS West Gulf River Forecast Center NWS Mission To provide weather,
Empirical, Dimensionless, CumulativeRainfall Hyetographs Developed From Storm Data for Selected Small Watersheds in Texas
 In cooperation with the Texas Department of Transportation Empirical, Dimensionless, CumulativeRainfall Hyetographs Developed From 1959 86 Storm Data for Selected Small Watersheds in Texas Scientific Investigations
6/9/2014. Software Overview. System Overview
 Future Rainfall 6/9/2014 Curtis Beitel, PE, CFM, Anthony Henry and Wayne Tschirhart, PE, CFM, PMP TFMA Spring 2014 Conference Software Overview 2 Processes Hydrometric DB Event Manager Automatic Low =
Intensity-Duration-Frequency (IDF) Curves Example
 Curves Example") Intensity-Duration-Frequency (IDF) Curves Example Intensity-Duration-Frequency (IDF) curves describe the relationship between rainfall intensity, rainfall duration, and return period (or its inverse, probability
Intensity-Duration-Frequency (IDF) Curves Example Intensity-Duration-Frequency (IDF) curves describe the relationship between rainfall intensity, rainfall duration, and return period (or its inverse, probability
Stochastic Modeling of Extreme Floods on the American River at Folsom Dam
 US Army Corps of Engineers Hydrologic Engineering Center Stochastic Modeling of Extreme Floods on the American River at Folsom Dam Appendix E - Description of Stochastic Storm Resampling Approach and Selection
Real-Time Meteorological Gridded Data: What s New With HEC-RAS
 Real-Time Meteorological Gridded Data: What s New With HEC-RAS Acquisition and Application of Gridded Meteorological Data in Support of the USACE s Real-Time Water Management Mission Fauwaz Hanbali, Tom
INFLOW DESIGN FLOOD CONTROL SYSTEM PLAN 40 C.F.R. PART PLANT YATES ASH POND 2 (AP-2) GEORGIA POWER COMPANY
 GEORGIA POWER COMPANY") INFLOW DESIGN FLOOD CONTROL SYSTEM PLAN 40 C.F.R. PART 257.82 PLANT YATES ASH POND 2 (AP-2) GEORGIA POWER COMPANY EPA s Disposal of Coal Combustion Residuals from Electric Utilities Final Rule (40 C.F.R.
INFLOW DESIGN FLOOD CONTROL SYSTEM PLAN 40 C.F.R. PART 257.82 PLANT YATES ASH POND 2 (AP-2) GEORGIA POWER COMPANY EPA s Disposal of Coal Combustion Residuals from Electric Utilities Final Rule (40 C.F.R.
Study 16.5 Probable Maximum Flood (PMF)
") Initial Study Report Meeting Study 16.5 Probable Maximum Flood (PMF) October 22, 2014 Prepared by 10/22/2014 1 Study 16.5 Objectives Develop a site-specific PMP to be used for the derivation of the PMF
Initial Study Report Meeting Study 16.5 Probable Maximum Flood (PMF) October 22, 2014 Prepared by 10/22/2014 1 Study 16.5 Objectives Develop a site-specific PMP to be used for the derivation of the PMF
Memorandum. Background
 Memorandum To: Kevin Stewart, P.E., Information Systems & Flood Warning Program Manager From: Mark Mitisek, H.I.T. Reviewed by: Kelly Close, P.E. Date: 02/11/2013 Project: Boulder Creek Hydromodel Subject:
Kije Sipi. Kije Sipi Ltd. Weather Radar Derived Rainfall Areal Reduction Factors
 Ltd Weather Radar Derived Rainfall Areal Reduction Factors J. P. Jolly 1, D. I. Jobin 1, S. Lodewyk 2 1. Ltd, Ottawa ON, Canada 2. City of Edmonton, Edmonton AB Canada ABSTRACT Rainfall Areal Reduction
HEC & GIS Modeling of the Brushy Creek HEC & GIS Watershed Modeling of the
 HEC & GIS Modeling of the Brushy Creek HEC & GIS Watershed Modeling of the By Cassandra Fagan 5, December 2014 http://ubcwatershedstudy.ursokr.com/images/ Contents Introduction... 3 Figure 1: 24-hour rainfall
Folsom Dam Water Control Manual Update Joint Federal Project, Folsom Dam
 Folsom Dam Water Control Manual Update Joint Federal Project, Folsom Dam Public Workshop May 28, 2015 Library Galleria 828 I Street, Sacramento, CA US Army Corps of Engineers BUILDING STRONG WELCOME &
Results of Intensity-Duration- Frequency Analysis for Precipitation and Runoff under Changing Climate
 Results of Intensity-Duration- Frequency Analysis for Precipitation and Runoff under Changing Climate Supporting Casco Bay Region Climate Change Adaptation RRAP Eugene Yan, Alissa Jared, Julia Pierce,
Generation of synthetic design storms for the Upper Thames River basin
 Generation of synthetic design storms for the Upper Thames River basin CFCAS project: Assessment of Water Resources Risk and Vulnerability to Changing Climatic Conditions Project Report V. November 2004
USGS ATLAS. BACKGROUND
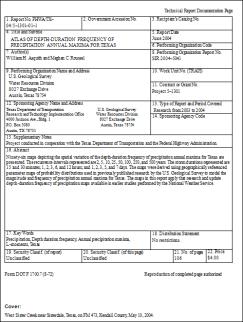
 USGS ATLAS. BACKGROUND 1998. Asquith. DEPTH-DURATION FREQUENCY OF PRECIPITATION FOR TEXAS. USGS Water-Resources Investigations Report 98 4044. Defines the depth-duration frequency (DDF) of rainfall annual
Extreme Rain all Frequency Analysis for Louisiana
 78 TRANSPORTATION RESEARCH RECORD 1420 Extreme Rain all Frequency Analysis for Louisiana BABAK NAGHAVI AND FANG XIN Yu A comparative study of five popular frequency distributions and three parameter estimation
CONVERTING A NEXRAD MAP TO A FLOODPLAIN MAP. Oscar Robayo, Tim Whiteaker, and David Maidment*
 CONVERTING A NEXRAD MAP TO A FLOODPLAIN MAP Oscar Robayo, Tim Whiteaker, and David Maidment* ABSTRACT: Using ArcGIS 9.0 ArcObjects and the new ModelBuilder environment, a methodology for converting a NEXRAD
Near Real-Time Runoff Estimation Using Spatially Distributed Radar Rainfall Data. Jennifer Hadley 22 April 2003
 Near Real-Time Runoff Estimation Using Spatially Distributed Radar Rainfall Data Jennifer Hadley 22 April 2003 Introduction Water availability has become a major issue in Texas in the last several years,
Rainfall and Design Storms
 Methods in Stormwater Management Using HydroCAD Rainfall and Design Storms H03 Rainfall and Design Storms.pdf 1 Topics Covered 1. Rainfall characteristics 2. Rainfall sources 3. Design Storms 4. Example:
The Stochastic Event Flood Model Applied to Minidoka Dam on the Snake River, Idaho
 The Stochastic Event Flood Model Applied to Minidoka Dam on the Snake River, Idaho K. L. Bullard 1, M. G. Schaeffer 2, B. A. Barker 3, D. Sutley 4, and V. Leverson 5 1 Bureau of Reclamation, Flood Hydrology
A Comparative Study of the National Water Model Forecast to Observed Streamflow Data
 A Comparative Study of the National Water Model Forecast to Observed Streamflow Data CE394K GIS in Water Resources Term Project Report Fall 2018 Leah Huling Introduction As global temperatures increase,
TEMPORAL DISTIRUBTION OF PMP RAINFALL AS A FUNCTION OF AREA SIZE. Introduction
 TEMPORAL DISTIRUBTION OF PMP RAINFALL AS A FUNCTION OF AREA SIZE Bill D. Kappel, Applied Weather Associates, LLC Edward M. Tomlinson, Ph.D., Applied Weather Associates, LLC Tye W. Parzybok, Metstat, Inc.
Talk Overview. Concepts. Climatology. Monitoring. Applications
 Atmospheric Rivers Talk Overview Concepts Climatology Monitoring Applications Satellite View Where is the storm? Where is the impact? Atmospheric Rivers Plume or fire hose of tropical moisture Heavy precipitation
9. PROBABLE MAXIMUM PRECIPITATION AND PROBABLE MAXIMUM FLOOD
 9. PROBABLE MAXIMUM PRECIPITATION AND PROBABLE MAXIMUM FLOOD 9.1. Introduction Due to the size of Watana Dam and the economic importance of the Project to the Railbelt, the Probable Maximum Flood (PMF)
Technical Memorandum No
 Pajaro River Watershed Study in association with Technical Memorandum No. 1.2.10 Task: Evaluation of Four Watershed Conditions - Sediment To: PRWFPA Staff Working Group Prepared by: Gregory Morris and
CW3E Atmospheric River Outlook
 CW3E Atmospheric River Outlook For California DWR s AR Program Multiple ARs Forecast to impact the USWC in the coming Week - A shift into an active flow pattern may result in the landfall of successive
Tri-Agency Fusion Team Brief Interagency Coordination Meeting Improving Joint Operations. USACE/USGS/NWS Silver Spring, MD. Friday, 11 June 2010
 Tri-Agency Fusion Team Brief Interagency Coordination Meeting Improving Joint Operations USACE/USGS/NWS Silver Spring, MD Friday, 11 June 2010 USACE suggested team as a 2008 Midwest Flood after-action
SAMPLE. SITE SPECIFIC WEATHER ANALYSIS Wind Report. Robinson, Smith & Walsh. John Smith. July 1, 2017 REFERENCE: 1 Maple Street, Houston, TX 77034
 SAMPLE SITE SPECIFIC WEATHER ANALYSIS Wind Report PREPARED FOR: Robinson, Smith & Walsh John Smith July 1, 2017 REFERENCE: JACK HIGGINS / 4151559-01 1 Maple Street, Houston, TX 77034 CompuWeather Sample
Lecture 6: Precipitation Averages and Interception
 Lecture 6: Precipitation Averages and Interception Key Questions 1. How much and when does Whatcom County receive rain? 2. Where online can you find rainfall data for the state? 3. How is rainfall averaged
Storm rainfall. Lecture content. 1 Analysis of storm rainfall 2 Predictive model of storm rainfall for a given
 Storm rainfall Lecture content 1 Analysis of storm rainfall 2 Predictive model of storm rainfall for a given max rainfall depth 1 rainfall duration and return period à Depth-Duration-Frequency curves 2
Groundwater dynamics and surface water-groundwater interaction in a prograding delta island, Louisiana, USA
 Supplementary Information Groundwater dynamics and surface water-groundwater interaction in a prograding delta island, Louisiana, USA Michael T. O Connor 1* and Kevan B. Moffett 1,2 1 Department of Geological
Technical Memorandum No RAINFALL
 Pajaro River Watershed Study in association with Technical Memorandum No. 1.2.2 RAINFALL Task: Collection and Analysis of Rainfall Data To: PRWFPA Staff Working Group Prepared by: J. Schaaf Reviewed by:
NATIONAL WATER RESOURCES OUTLOOK
 NATIONAL WATER RESOURCES OUTLOOK American Meteorological Society Annual Meeting 24 th Hydrology Conference 9.2 James Noel Service Coordination Hydrologist National Weather Service-Ohio River Forecast Center
Chapter 5 CALIBRATION AND VERIFICATION
 Chapter 5 CALIBRATION AND VERIFICATION This chapter contains the calibration procedure and data used for the LSC existing conditions model. The goal of the calibration effort was to develop a hydraulic
Typical Hydrologic Period Report (Final)
") (DELCORA) (Final) November 2015 (Updated April 2016) CSO Long-Term Control Plant Update REVISION CONTROL REV. NO. DATE ISSUED PREPARED BY DESCRIPTION OF CHANGES 1 4/26/16 Greeley and Hansen Pg. 1-3,
(DELCORA) (Final) November 2015 (Updated April 2016) CSO Long-Term Control Plant Update REVISION CONTROL REV. NO. DATE ISSUED PREPARED BY DESCRIPTION OF CHANGES 1 4/26/16 Greeley and Hansen Pg. 1-3,
Probable Maximum Precipitation Study
 Probable Maximum Precipitation Study Virginia Floodplain Management Association Workshop Thursday, October 29, 2015 Robert T. Bennett, PE, RA, CFM DCR Dam Safety & Floodplain Management Definition (4VAC50-20-50.H)
Technical Memorandum. City of Salem, Stormwater Management Design Standards. Project No:
 Technical Memorandum 6500 SW Macadam Avenue, Suite 200 Portland, Oregon, 97239 Tel: 503-244-7005 Fax: 503-244-9095 Prepared for: Project Title: City of Salem, Oregon City of Salem, Stormwater Management
SEPTEMBER 2013 REVIEW
 Monthly Long Range Weather Commentary Issued: October 21, 2013 Steven A. Root, CCM, President/CEO sroot@weatherbank.com SEPTEMBER 2013 REVIEW Climate Highlights The Month in Review The average temperature
Final Report. COMET Partner's Project. University of Texas at San Antonio
 Final Report COMET Partner's Project University: Name of University Researcher Preparing Report: University of Texas at San Antonio Dr. Hongjie Xie National Weather Service Office: Name of National Weather
SAMPLE. SITE SPECIFIC WEATHER ANALYSIS Wind Report. Robinson, Smith & Walsh. John Smith REFERENCE:
 SAMPLE SITE SPECIFIC WEATHER ANALYSIS Wind Report PREPARED FOR: Robinson, Smith & Walsh John Smith REFERENCE: JACK HIGGINS / 4151559-01 CompuWeather Sample Report Please note that this report contains
An Alternative Temporal Rainfall Distribution for Hydrologic Analysis and Design
 An Alternative Temporal Rainfall Distribution for Hydrologic Analysis and Design Joseph P. Wilson, PE, PH Wilson Hydro, LLC PhD Candidate Missouri University of Science Technology Rolla, Missouri Sorry
Assessing Arid Area Extreme Precipitation Using Doppler Radar and Rain Gages
 Southwest Extreme Precipitation Symposium, San Diego March 29, 2018 Assessing Arid Area Extreme Precipitation Using Doppler Radar and Rain Gages Investigators Theodore V. Hromadka, II, Ph.D., Ph.D., Ph.D.,
Recent Updates to NOAA/NWS Precipitation Frequency Estimates
 Recent Updates to NOAA/NWS Precipitation Frequency Estimates Geoffrey M. Bonnin Director, Hydrometeorological Design Studies Center Chief, Hydrologic Data Systems Branch Office of Hydrologic Development
Chapter 10 - Sacramento Method Examples
 Chapter 10 Sacramento Method Examples Introduction Overview This chapter presents two example problems to demonstrate the use of the Sacramento method. These example problems use the SACPRE and HEC-1 computer
Needs to Update Probable Maximum Precipitation for Determining Hydrologic Loading on Dams
 Needs to Update Probable Maximum Precipitation for Determining Hydrologic Loading on Dams USSD 2017 Annual Conference Anaheim, CA Chandra S. Pathak, PhD, PE, F.ASCE Engineering and Construction Branch
A GIS-based Approach to Watershed Analysis in Texas Author: Allison Guettner
 Texas A&M University Zachry Department of Civil Engineering CVEN 658 Civil Engineering Applications of GIS Instructor: Dr. Francisco Olivera A GIS-based Approach to Watershed Analysis in Texas Author:
Designing a Dam for Blockhouse Ranch. Haley Born
 Designing a Dam for Blockhouse Ranch Haley Born CE 394K GIS in Water Resources Term Paper Fall 2011 Table of Contents Introduction... 1 Data Sources... 2 Precipitation Data... 2 Elevation Data... 3 Geographic
Great Lakes Update. Great Lakes Winter and Spring Summary January June Vol. 187 Great Lakes Update August 2012
 Great Lakes Update Great Lakes Winter and Spring Summary January June 2012 The US Army Corps of Engineers (USACE) Detroit District monitors hydraulic and hydrologic conditions of the Great Lakes. This
Speakers: NWS Buffalo Dan Kelly and Sarah Jamison, NERFC Jeane Wallace. NWS Flood Services for the Black River Basin
 Speakers: NWS Buffalo Dan Kelly and Sarah Jamison, NERFC Jeane Wallace NWS Flood Services for the Black River Basin National Weather Service Who We Are The National Oceanic and Atmospheric Administration
1. TEMPORAL CHANGES IN HEAVY RAINFALL FREQUENCIES IN ILLINOIS
 to users of heavy rainstorm climatology in the design and operation of water control structures. A summary and conclusions pertaining to various phases of the present study are included in Section 8. Point
Rapid Flood Mapping Using Inundation Libraries
 Rapid Flood Mapping Using Inundation Libraries Jude Kastens, Kevin Dobbs, James Halgren, Katherine Balster 2017 ASFPM Conference May 3, 2017 5 mi Kansas River Valley between Manhattan and Topeka Email:
Evaluation and Incorporation of USACE HEC-RAS Model of Chicago Waterway System into the Development of the North Branch DWP
 M E M O R A N D U M Evaluation and Incorporation of USACE HEC-RAS Model of Chicago Waterway System into the Development of the North Branch DWP TO: FROM: Joseph Spradling, PE, HDR Steven Vassos, PE, FluidClarity
Changes to Extreme Precipitation Events: What the Historical Record Shows and What It Means for Engineers
 Changes to Extreme Precipitation Events: What the Historical Record Shows and What It Means for Engineers Geoffrey M Bonnin National Oceanic and Atmospheric Administration National Weather Service Office
Dam Safety: Revisiting PMPs
 Dam Safety: Revisiting PMPs Many dam safety officials use probable maximum precipitation (PMP) for dam safety evaluations and design requirements. But the series of federal publications that provides PMP
Surface Hydrology Research Group Università degli Studi di Cagliari
 Surface Hydrology Research Group Università degli Studi di Cagliari Evaluation of Input Uncertainty in Nested Flood Forecasts: Coupling a Multifractal Precipitation Downscaling Model and a Fully-Distributed
FORECAST-BASED OPERATIONS AT FOLSOM DAM AND LAKE
 FORECAST-BASED OPERATIONS AT FOLSOM DAM AND LAKE 255 237 237 237 217 217 217 200 200 200 0 163 131 Bridging the Gap163Conference 255 0 132 255 0 163 122 The Dana on Mission Bay San Diego, CA January 28,
Robert Shedd Northeast River Forecast Center National Weather Service Taunton, Massachusetts, USA
 Robert Shedd Northeast River Forecast Center National Weather Service Taunton, Massachusetts, USA Outline River Forecast Centers FEWS Implementation Status Forcing Data Ensemble Forecasting The Northeast
MEMORANDUM. Situation. David Ford Consulting Engineers, Inc J Street, Suite 200 Sacramento, CA Ph Fx
 David Ford Consulting Engineers, Inc. 2015 J Street, Suite 200 Sacramento, CA 95811 Ph. 916.447.8779 Fx. 916.447.8780 MEMORANDUM To: Brad Moore, PE, USACE From: Nathan Pingel, PE (Lic # CA 63242), and
Rucker Pond. Background
 Rucker Pond Background The Rucker Basin consists of two subbasins (East and West) that drain to a single area known as Rucker Pond. Both subbasins have the same hydraulic parameters, but have different
National Flood Interoperability Experiment
 National Flood Interoperability Experiment David R. Maidment, University of Texas at Austin Catchment-based Hydrological Data Assimilation (CAHMDA) VI Conference 8 September 2014 Located on Tuscaloosa
USING GIS TO MODEL AND ANALYZE HISTORICAL FLOODING OF THE GUADALUPE RIVER NEAR NEW BRAUNFELS, TEXAS
 USING GIS TO MODEL AND ANALYZE HISTORICAL FLOODING OF THE GUADALUPE RIVER NEAR NEW BRAUNFELS, TEXAS ASHLEY EVANS While the state of Texas is well-known for flooding, the Guadalupe River Basin is one of
CW3E Atmospheric River Update Outlook Strong AR forecast to impact California this weekend - A strong AR with IVT as high as 1000 kg m -1 s -1 is
 CW3E Atmospheric River Update Outlook Strong AR forecast to impact California this weekend - A strong AR with IVT as high as 1000 kg m -1 s -1 is forecast make landfall over the West Coast this Weekend
Severe Weather Potential for Southeast Texas
 Severe Weather Potential for Southeast Texas Dan Reilly, Kent Prochazka, Scott Overpeck National Weather Service Houston/Galveston 10 am Synopsis Storm to likely bring severe weather to Southeast Texas
Overview of a Changing Climate in Rhode Island
 Overview of a Changing Climate in Rhode Island David Vallee, Hydrologist in Charge, National Weather Service Northeast River Forecast Center, NOAA Lenny Giuliano, Air Quality Specialist, Rhode Island Department
Ed Tomlinson, PhD Bill Kappel Applied Weather Associates LLC. Tye Parzybok Metstat Inc. Bryan Rappolt Genesis Weather Solutions LLC
 Use of NEXRAD Weather Radar Data with the Storm Precipitation Analysis System (SPAS) to Provide High Spatial Resolution Hourly Rainfall Analyses for Runoff Model Calibration and Validation Ed Tomlinson,
Stochastic Modeling of Extreme Floods on the American River at Folsom Dam
 US Army Corps of Engineers Hydrologic Engineering Center Stochastic Modeling of Extreme Floods on the American River at Folsom Dam Appendix D - Procedures Implemented for Conducting Storm Analyses in Support
Stochastic Modeling of Extreme Floods on the American River at Folsom Dam
 US Army Corps of Engineers Hydrologic Engineering Center Stochastic Modeling of Extreme Floods on the American River at Folsom Dam Appendix J - Analysis of Storms Antecedent and Posterior to Extreme Storms
What Is the Weather Like in Different Regions of the United States?
 Learning Set 1 What Is Weather, and How Is It Measured and Described? 1.3 Explore What Is the Weather Like in Different Regions of the United States? trends: patterns or tendencies you can see over a broad
Delaware River Flood Advisory Committee
 Delaware River Flood Advisory Committee A Partnership to Support Flood Mitigation Alan Tamm Pennsylvania Emergency Management Agency Bureau of Recovery and Mitigation atamm@state.pa.us Peter Gabrielsen
*Corresponding author address: Charles Barrere, Weather Decision Technologies, 1818 W Lindsey St, Norman, OK
 P13R.11 Hydrometeorological Decision Support System for the Lower Colorado River Authority *Charles A. Barrere, Jr. 1, Michael D. Eilts 1, and Beth Clarke 2 1 Weather Decision Technologies, Inc. Norman,
Radar Analysis for Design Storm Application
 37th Conference on Radar Meteorology Norman Oklahoma 14 18 September 2015 Norman, OK Radar Analysis for Design Storm Application Baxter E. Vieux, Vieux & Associates, Inc. Annjanette Dodd, Kimley-Horn,
Presented by Jerry A. Gomez, P.E. National Hydropower Association Northeast Regional Meeting - September 17, 2009
 Presented by Jerry A. Gomez, P.E. National Hydropower Association Northeast Regional Meeting - September 17, 2009 Defining Probable Maximum Precipitation (PMP) PMP is the theoretically greatest depth of