TXHYETO.XLS: A Tool To Facilitate Use of Texas- Specific Hyetographs for Design Storm Modeling. Caroline M. Neale Texas Tech University
|
|
|
- Kerrie McDonald
- 5 years ago
- Views:
Transcription
1 TXHYETO.XLS: A Tool To Facilitate Use of Texas- Specific Hyetographs for Design Storm Modeling Caroline M. Neale Texas Tech University
2 Acknowledgements Funding and direction provided by the Texas Department of Transportation through research contract , New Rainfall Coefficients Disclaimer: The contents of this presentation reflect the views of the author(s), who is (are) responsible for the facts and the accuracy of the data presented herein. The contents do not necessarily reflect the official view or policies of the Federal Highway Administration (FHWA) or the Texas Department of Transportation (TxDOT). This report does not constitute a standard, specification, or regulation. This presentation is not intended for construction, bidding, or permit purposes. The United States Government and the State of Texas do not endorse products or manufacturers.
3 Outline Overview Methods Currently in Use Empirical, Dimensionless Hyetographs (Williams-Sether, 2004) Graphical Method Linear Interpolation Proposed Alternative Method Distribution Mixture Model
4 Overview Empirical, Dimensionless, Cumulative Rainfall Hyetographs Developed for Selected Watersheds in Texas The graphical method for dimensional modeling found using the Texas Dimensionless Hyetographs is widely used but is limited with small or non-incremental time steps Two methods of interpolation were explored Linear interpolation Distribution-mixture function TXHYETO.XLS, a provisional tool, was created
5 Texas Dimensionless Hyetographs Texas-specific storm hyetographs were reported in Williams-Sether et. al. (2004) as a design storm tool for use in drainage design These hyetographs are limited because of difficulty in dimensionalizing the tabulated hyetograph values for use in hydrologic software (SWMM/HECHMS) Difficulties in dimensionalizing is two-fold Tabulated values must be rescaled into dimensional values Dimensionalized tabulation time intervals may not correspond to the time intervals of interest
6 Texas Dimensionless Hyetographs Williams-Sether et. al. (2004) analyzed data from over 1,600 runoff-producing storms at 91 USGS streamflow-gauging stations in North and South Central Texas.
7 Texas Dimensionless Hyetographs They developed empirical, dimensionless, cumulative-rainfall hyetographs. Storm-quartile classifications were determined using Huff 1967, and 1990 type classification
8 Texas Dimensionless Hyetographs First- Quartile Second- Quartile Third- Quartile Fourth- Quartile
9 Texas Dimensionless Hyetographs A combined dimensionless family of envelopes was produced Presented in both graphical and tabular form. Used to estimate distributions of rainfall with time for Texas watersheds drainage areas of <160 mi 2.
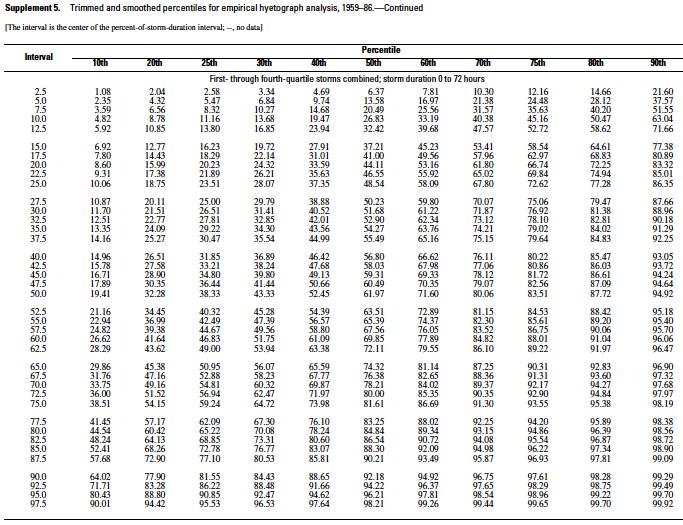
10
11
12 Dimensionalization Requires the user to rescale the time and percent cumulative rainfall into actual durations and total storm depth. Engineer must determine the depth for a particular duration Various of tools to do this in Texas: Asquith and Roussel (2004) and Asquith (1998) (DDF Atlas) Frederick et. Al (1997) Hershfield (1961) (TP-40) EBDLKUP-NEW (a campanion product for this project) Examples of tools elsewhere: NOAA Atlas 14
13 Example of Rescaling Axes Example Suppose a 4% chance (25 year), 6 hour storm in Texas has an anticipated depth of 10 inches After rescaling, the horizontal axis would range from 0 to 6 hours After rescaling, the vertical axis would range from 0 to 10 inches
14 Rescale Depth Rescale Time
15 10 inches 6.1 inches 5.4 inches 3.9 inches 1hrs 2hrs 3hrs
16 Alternative Method-Linear Interpolation An initial alternative method of Linear Interpolation was explored using Excel Linear Interpolation takes specified values of depth and duration, rescales them, and exports time and depth for time steps specified by user

17 Input desired duration and depth Exports rescaled duration and depth to linear interpolation tab Linear Interpolation Methodology

18 Methodology User chooses desired time step Reprogramming is necessary for different time steps
19 Alternative Method-Distribution Mixture Model Linear interpolation method is situation specific Distribution-mixture model fits smooth functions to the tabulation values from Texas Dimensionless Hyetograph can be used to directly estimate time-depth pairs Time depth pairs can be directly input into computer based runoff modeling software (SWMM/HECHMS)
20 Distribution-Mixture Model Several candidate functions were explored based on the shape of the 50 th and 90 th percentile curves A function built from a mixture of two distributions was selected as the best fit functional form because it was able to reproduce the shape of the dimensionless hyetographs over the entire range of the dimensionless storm better than the other functions researched. The functional form was fit using a non-linear leastsquares approach where the difference between the model value and the tabulated value were minimized by changing the values of the parameters
21 Methodology Distribution-mixture function model
22 Parameter Estimation The functional form was fit using a non-linear leastsquares approach. The difference between the model value and the tabulated values were minimized by changing the parameters. Excel Solver (GRG Algorithm) was used. Program defaults were used with initial estimates by trial-and-error
23 Distribution-Mixture Model Comparison of Williams-Sether tabulated values to distribution-mixture model function

24 TXHYETO.XLS
25 Compare the interpolation and distributionmixture model less than 5% difference Comparison
26 HEC-HMS Example

27 HEC-HMS TXHYETO.XLS efficiently supplies design storms for Texas into HEC-HMS or SWMM Example for 6-hour storm with 15 min. increments Input desired time increments (15 min. for this example)

28 HEC-HMS The purpose of the tool is to simplify supplying design storms for Texas into HEC-HMS or SWMM. Input desired storm duration (6-hour storm)


29 HEC-HMS Input tabulated depths from TXHYETO.XLS
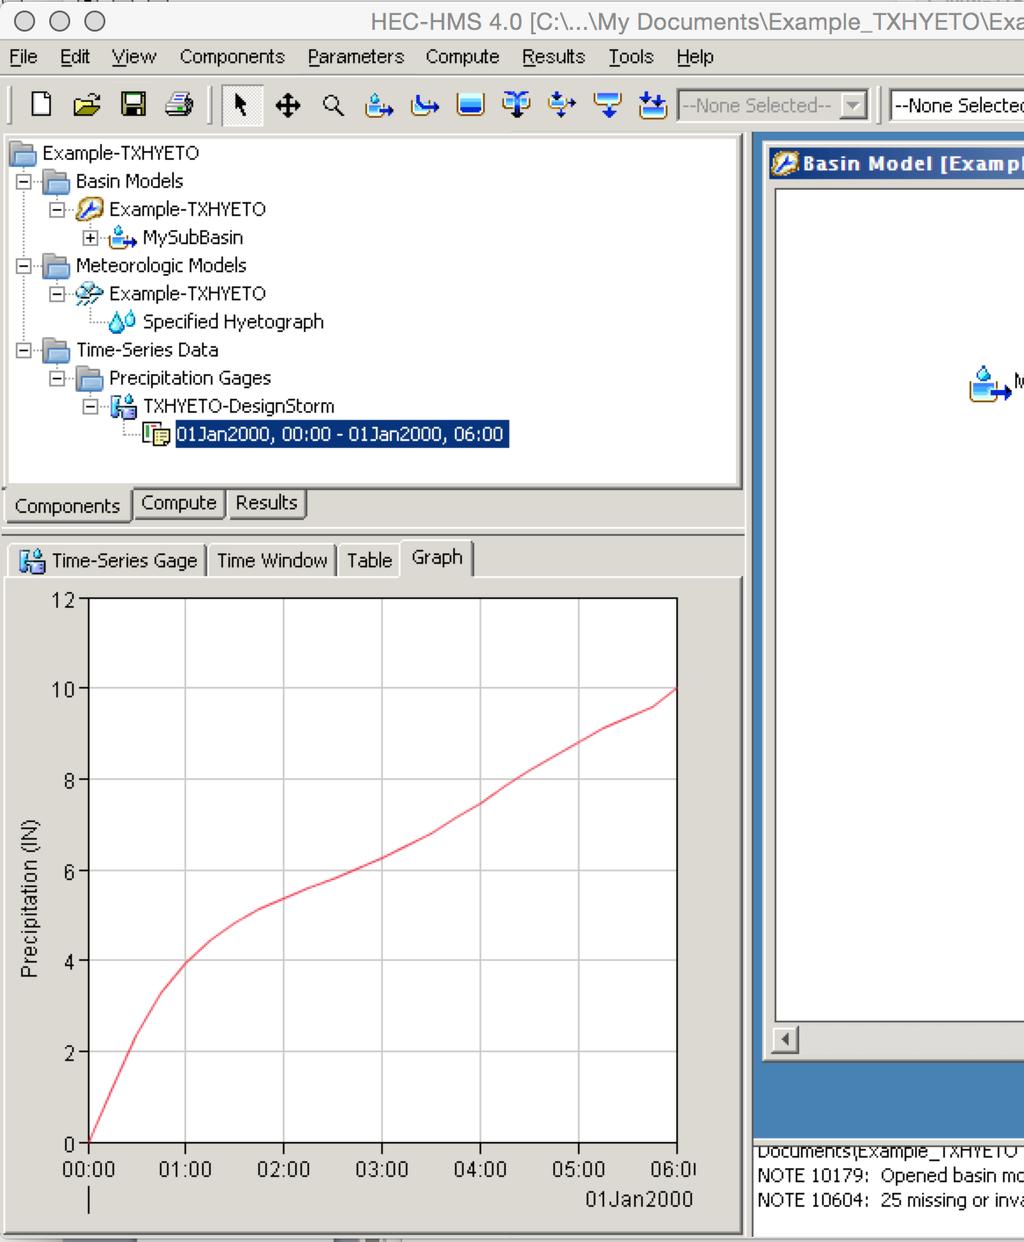
30 HEC-HMS
31 Conclusions The provisional tool, TXHYETO.XLS, dimensionalizes the Texas dimensionless hyetographs for use in rainfall-runoff models Tool uses a distribution-mixture function to approximate the shape of the Texas Dimensionless Hyetograph Distribution-mixture model utilized in TXHYETO.XLS replicates estimates made using linear interpolation with a relative error of <5%
32 References Williams-Sether, Tara, Asquith, W.H., Thompson, D.B., Cleveland, T.G., and Fang, Xing, 2004, Empirical, dimensionless, cumulative-rainfall hyetographs developed from storm data for selected small watersheds in Texas: U.S. Geological Survey Scientific Investigations Report , 125 p. Asquith, W.H., 1998, Depth-duration frequency of precipitation for Texas: U.S. Geological Survey Water-Resources Investigations Report , 107 p., wri /. Asquith, W.H., and Roussel, M.C., 2004, Atlas of depth-duration frequency of precipitation annual maxima for Texas: U.S. Geological Survey Scientific Investigations Report , 106 p. Frederick, R.H., Meyers, V.A., and Auciello, E.P., 1977, Five to 60-minute precipitation frequency for the eastern and central United States: Silver Springs, Md., U.S. Department of Commerce, National Oceanic and Atmospheric Administration, National Weather Service, NOAA Technical Memorandum NWS HYDRO 35, 36 p. Hershfield, D.M., 1961, Rainfall frequency atlas of the United States for durations from 30 minutes to 24 hours and return periods from 1 to 100 years: Washington, D.C., U.S. Weather Bureau Technical Paper 40, 61 p. Huff, F.A., 1967, Time distribution of rainfall in heavy storms: Water Resources Research, v. 3, no. 4, p. 1,007 1,019. Huff, F.A., 1990, Time distributions of heavy rainstorms in Illinois: Champaign, Illinois, Illinois State Water Survey Circular 173, 18 p.
SUMMARY OF DIMENSIONLESS TEXAS HYETOGRAPHS AND DISTRIBUTION OF STORM DEPTH DEVELOPED FOR TEXAS DEPARTMENT OF TRANSPORTATION RESEARCH PROJECT
 U.S. Geological Survey, Austin, Texas Texas Tech University University of Houston Lamar University SUMMARY OF DIMENSIONLESS TEXAS HYETOGRAPHS AND DISTRIBUTION OF STORM DEPTH DEVELOPED FOR TEXAS DEPARTMENT
Design Storms for Hydrologic Analysis
 Design Storms for Hydrologic Analysis Course Description This course is designed to fulfill two hours of continuing education credit for Professional Engineers. Its objective is to provide students with
Depth-Duration Frequency (DDF) and Depth-Area- Reduction Factors (DARF)
 and Depth-Area- Reduction Factors (DARF)") Spatial Analysis of Storms Using GIS Brian Hoblit, Steve Zelinka, Cris Castello, and David Curtis Abstract Point data from rain gages have been historically used to develop depth-area relationships, design
Spatial Analysis of Storms Using GIS Brian Hoblit, Steve Zelinka, Cris Castello, and David Curtis Abstract Point data from rain gages have been historically used to develop depth-area relationships, design
Empirical, Dimensionless, CumulativeRainfall Hyetographs Developed From Storm Data for Selected Small Watersheds in Texas
 In cooperation with the Texas Department of Transportation Empirical, Dimensionless, CumulativeRainfall Hyetographs Developed From 1959 86 Storm Data for Selected Small Watersheds in Texas Scientific Investigations
LITERATURE REVIEW. History. In 1888, the U.S. Signal Service installed the first automatic rain gage used to
 LITERATURE REVIEW History In 1888, the U.S. Signal Service installed the first automatic rain gage used to record intensive precipitation for short periods (Yarnell, 1935). Using the records from this
Extreme Rain all Frequency Analysis for Louisiana
 78 TRANSPORTATION RESEARCH RECORD 1420 Extreme Rain all Frequency Analysis for Louisiana BABAK NAGHAVI AND FANG XIN Yu A comparative study of five popular frequency distributions and three parameter estimation
Technical Report Documentation Page
 NOTICE The United States Government and the State of Texas do not endorse products or manufacturers. Trade or manufacturers names appear herein solely because they are considered essential to the object
The Beleaguered Figure 15
 The Beleaguered Figure 15 TFMA 2015 Fall Technical Summit After the Floods: Texas Rising Craig Loftin, PE, CFM US Weather Bureau Technical Paper No. 40, Figure 15 Village Creek Watershed 1 100-Year 30-Minute
The Beleaguered Figure 15 TFMA 2015 Fall Technical Summit After the Floods: Texas Rising
 The Beleaguered Figure 15 TFMA 2015 Fall Technical Summit After the Floods: Texas Rising Craig Loftin, PE, CFM US Weather Bureau Technical Paper No. 40, Figure 15 Village Creek Watershed 100-Year 30-Minute
USGS ATLAS. BACKGROUND
 USGS ATLAS. BACKGROUND 1998. Asquith. DEPTH-DURATION FREQUENCY OF PRECIPITATION FOR TEXAS. USGS Water-Resources Investigations Report 98 4044. Defines the depth-duration frequency (DDF) of rainfall annual
New NOAA Precipitation-Frequency Atlas for Wisconsin
 New NOAA Precipitation-Frequency Atlas for Wisconsin #215966 Presentation to the Milwaukee Metropolitan Sewerage District Technical Advisory Team January 16, 2014 Michael G. Hahn, P.E., P.H. SEWRPC Chief
Recent Updates to NOAA/NWS Precipitation Frequency Estimates
 Recent Updates to NOAA/NWS Precipitation Frequency Estimates Geoffrey M. Bonnin Director, Hydrometeorological Design Studies Center Chief, Hydrologic Data Systems Branch Office of Hydrologic Development
HEC-HMS Lab 4 Using Frequency Storms in HEC-HMS
 HEC-HMS Lab 4 Using Frequency Storms in HEC-HMS Created by Venkatesh Merwade (vmerwade@purdue.edu) Learning outcomes The objective of this lab is to learn how HEC-HMS is used to determine design flow by
MAPPING THE RAINFALL EVENT FOR STORMWATER QUALITY CONTROL
 Report No. K-TRAN: KU-03-1 FINAL REPORT MAPPING THE RAINFALL EVENT FOR STORMWATER QUALITY CONTROL C. Bryan Young The University of Kansas Lawrence, Kansas JULY 2006 K-TRAN A COOPERATIVE TRANSPORTATION
Rainfall and Design Storms
 Methods in Stormwater Management Using HydroCAD Rainfall and Design Storms H03 Rainfall and Design Storms.pdf 1 Topics Covered 1. Rainfall characteristics 2. Rainfall sources 3. Design Storms 4. Example:
Storm rainfall. Lecture content. 1 Analysis of storm rainfall 2 Predictive model of storm rainfall for a given
 Storm rainfall Lecture content 1 Analysis of storm rainfall 2 Predictive model of storm rainfall for a given max rainfall depth 1 rainfall duration and return period à Depth-Duration-Frequency curves 2
Changes to Extreme Precipitation Events: What the Historical Record Shows and What It Means for Engineers
 Changes to Extreme Precipitation Events: What the Historical Record Shows and What It Means for Engineers Geoffrey M Bonnin National Oceanic and Atmospheric Administration National Weather Service Office
Leon Creek Watershed October 17-18, 1998 Rainfall Analysis Examination of USGS Gauge Helotes Creek at Helotes, Texas
 Leon Creek Watershed October 17-18, 1998 Rainfall Analysis Examination of USGS Gauge 8181400 Helotes Creek at Helotes, Texas Terrance Jackson MSCE Candidate University of Texas San Antonio Abstract The
An Alternative Temporal Rainfall Distribution for Hydrologic Analysis and Design
 An Alternative Temporal Rainfall Distribution for Hydrologic Analysis and Design Joseph P. Wilson, PE, PH Wilson Hydro, LLC PhD Candidate Missouri University of Science Technology Rolla, Missouri Sorry
NRC Workshop - Probabilistic Flood Hazard Assessment Jan 2013
 Regional Precipitation-Frequency Analysis And Extreme Storms Including PMP Current State of Understanding/Practice Mel Schaefer Ph.D. P.E. MGS Engineering Consultants, Inc. Olympia, WA NRC Workshop - Probabilistic
INTRODUCTION TO HYDROLOGIC MODELING USING HEC-HMS
 INTRODUCTION TO HYDROLOGIC MODELING USING HEC-HMS By Thomas T. Burke, Jr., PhD, PE Luke J. Sherry, PE, CFM Christopher B. Burke Engineering, Ltd. October 8, 2014 1 SEMINAR OUTLINE Overview of hydrologic
Generation of synthetic design storms for the Upper Thames River basin
 Generation of synthetic design storms for the Upper Thames River basin CFCAS project: Assessment of Water Resources Risk and Vulnerability to Changing Climatic Conditions Project Report V. November 2004
CIVE322 BASIC HYDROLOGY
 CIVE322 BASIC HYDROLOGY Homework No.3 Solution 1. The coordinates of four precipitation gauging stations are A = (3,4), B = (9,4), C = (3,12), and D = (9,12). The observed precipitation amounts at these
Using PRISM Climate Grids and GIS for Extreme Precipitation Mapping
 Using PRISM Climate Grids and GIS for Extreme Precipitation Mapping George H. Taylor, State Climatologist Oregon Climate Service 316 Strand Ag Hall Oregon State University Corvallis OR 97331-2209 Tel:
TEMPORAL DISTIRUBTION OF PMP RAINFALL AS A FUNCTION OF AREA SIZE. Introduction
 TEMPORAL DISTIRUBTION OF PMP RAINFALL AS A FUNCTION OF AREA SIZE Bill D. Kappel, Applied Weather Associates, LLC Edward M. Tomlinson, Ph.D., Applied Weather Associates, LLC Tye W. Parzybok, Metstat, Inc.
StreamStats: Delivering Streamflow Information to the Public. By Kernell Ries
 StreamStats: Delivering Streamflow Information to the Public By Kernell Ries U.S. Department of the Interior U.S. Geological Survey MD-DE-DC District 410-238-4317 kries@usgs.gov StreamStats Web Application
Results of Intensity-Duration- Frequency Analysis for Precipitation and Runoff under Changing Climate
 Results of Intensity-Duration- Frequency Analysis for Precipitation and Runoff under Changing Climate Supporting Casco Bay Region Climate Change Adaptation RRAP Eugene Yan, Alissa Jared, Julia Pierce,
Areal Reduction Factors for the Colorado Front Range and Analysis of the September 2013 Colorado Storm
 Areal Reduction Factors for the Colorado Front Range and Analysis of the September 2013 Colorado Storm Doug Hultstrand, Bill Kappel, Geoff Muhlestein Applied Weather Associates, LLC - Monument, Colorado
Dam Safety: Revisiting PMPs
 Dam Safety: Revisiting PMPs Many dam safety officials use probable maximum precipitation (PMP) for dam safety evaluations and design requirements. But the series of federal publications that provides PMP
Areal Reduction Factors for the Colorado Front Range and Analysis of the September 2013 Colorado Storm
 Areal Reduction Factors for the Colorado Front Range and Analysis of the September 2013 Colorado Storm Doug Hultstrand, Bill Kappel, Geoff Muhlestein Applied Weather Associates, LLC - Monument, Colorado
Basins-Level Heavy Rainfall and Flood Analyses
 Basins-Level Heavy Rainfall and Flood Analyses Peng Gao, Greg Carbone, and Junyu Lu Department of Geography, University of South Carolina (gaop@mailbox.sc.edu, carbone@mailbox.sc.edu, jlu@email.sc.edu)
Another 100-Year Storm. October 26, 2016 Mark Dennis, PE, CFM
 Another 100-Year Storm October 26, 2016 Mark Dennis, PE, CFM Agenda Are severe rainfall events becoming more frequent? Is there confusion about the 100-year storm that makes it seem like they happen all
The general procedure for estimating 24-hour PMP includes the following steps:
 14th Conference on Applied Climatology Abstract # 71520 Using PRISM Climate Grids and GIS for Extreme Precipitation Mapping George H. Taylor and Christopher Daly Oregon State University Corvallis Oregon
The effectiveness of the Natural Resource Conservation Service (NRCS) and Huff rainfall distribution methods for use in detention basin design
 and Huff rainfall distribution methods for use in detention basin design") Scholars' Mine Masters Theses Student Theses and Dissertations Spring 2010 The effectiveness of the Natural Resource Conservation Service (NRCS) and Huff rainfall distribution methods for use in detention
Scholars' Mine Masters Theses Student Theses and Dissertations Spring 2010 The effectiveness of the Natural Resource Conservation Service (NRCS) and Huff rainfall distribution methods for use in detention
Detailed Storm Rainfall Analysis for Hurricane Ivan Flooding in Georgia Using the Storm Precipitation Analysis System (SPAS) and NEXRAD Weather Radar
 and NEXRAD Weather Radar") Detailed Storm Rainfall Analysis for Hurricane Ivan Flooding in Georgia Using the Storm Precipitation Analysis System (SPAS) and NEXRAD Weather Radar Ed Tomlinson, PhD and Bill Kappel Applied Weather Associates
Detailed Storm Rainfall Analysis for Hurricane Ivan Flooding in Georgia Using the Storm Precipitation Analysis System (SPAS) and NEXRAD Weather Radar Ed Tomlinson, PhD and Bill Kappel Applied Weather Associates
Texas Transportation Institute The Texas A&M University System College Station, Texas
 1. Report No. FHWA/TX-03/4150-1 4. Title and Subtitle ANALYSIS OF TXDOT THICKNESS MEASUREMENT PROCEDURES FOR THERMOPLASTIC PAVEMENT MARKINGS Technical Report Documentation Page 2. Government Accession
Updating PMP to Provide Better Dam and Spillway Design
 Protections 2016 2 nd International Seminar on Dam Protection Against Overtopping ISBN: 978-1-1889143-27-9 DOI: Ft. Collins, Colorado, USA, 7-9 September 2016 Updating PMP to Provide Better Dam and Spillway
Precipitation Rabi H. Mohtar
 Precipitation Rabi H. Mohtar The objectives of this module are to present and analyze: 1) Precipitation forms, characteristics, and measurements 2) Intensity, Duration, Frequency (IDF) curves and rainfall
Typical Hydrologic Period Report (Final)
") (DELCORA) (Final) November 2015 (Updated April 2016) CSO Long-Term Control Plant Update REVISION CONTROL REV. NO. DATE ISSUED PREPARED BY DESCRIPTION OF CHANGES 1 4/26/16 Greeley and Hansen Pg. 1-3,
(DELCORA) (Final) November 2015 (Updated April 2016) CSO Long-Term Control Plant Update REVISION CONTROL REV. NO. DATE ISSUED PREPARED BY DESCRIPTION OF CHANGES 1 4/26/16 Greeley and Hansen Pg. 1-3,
Stochastic Modeling of Extreme Floods on the American River at Folsom Dam
 US Army Corps of Engineers Hydrologic Engineering Center Stochastic Modeling of Extreme Floods on the American River at Folsom Dam Appendix E - Description of Stochastic Storm Resampling Approach and Selection
Lecture 6: Precipitation Averages and Interception
 Lecture 6: Precipitation Averages and Interception Key Questions 1. How much and when does Whatcom County receive rain? 2. Where online can you find rainfall data for the state? 3. How is rainfall averaged
A GIS-based Approach to Watershed Analysis in Texas Author: Allison Guettner
 Texas A&M University Zachry Department of Civil Engineering CVEN 658 Civil Engineering Applications of GIS Instructor: Dr. Francisco Olivera A GIS-based Approach to Watershed Analysis in Texas Author:
Stochastic Modeling of Extreme Floods on the American River at Folsom Dam
 US Army Corps of Engineers Hydrologic Engineering Center Stochastic Modeling of Extreme Floods on the American River at Folsom Dam Appendix D - Procedures Implemented for Conducting Storm Analyses in Support
Volume 1, Chapter 4 Rainfall
 Volume 1, Chapter 4 Rainfall Users Guidance: If a UDFCD Section number in this chapter is skipped: It was adopted as is; please refer to that Section in the corresponding UDFCD Manual, Volume, Chapter
Cacapon Institute s Potomac Highlands Watershed School High School Lesson Plan for the Real-Time Data
 Cacapon Institute s Potomac Highlands Watershed School High School Lesson Plan for the Real-Time Data March 1 Overview The Real Time Data Portal can be used to explore scientific concepts of graphing,
Impacts of Urbanization and Climate Variability on Floods in Northeastern Illinois
 Impacts of Urbanization and Climate Variability on Floods in Northeastern Illinois Momcilo Markus and Sally McConkey, Illinois State Water Survey Abstract Annual flood peaks on 12 small urbanizing watersheds
Monte Carlo Simulations for Probabilistic Flood Hazard Assessment
 Monte Carlo Simulations for Probabilistic Flood Hazard Assessment Jemie Dababneh, Ph.D., P.E., 1 and Mark Schwartz, P.E. 1 1 RIZZO Associates, Monroeville, Pennsylvania Presentation to PSA 2017 International
Speakers: NWS Buffalo Dan Kelly and Sarah Jamison, NERFC Jeane Wallace. NWS Flood Services for the Black River Basin
 Speakers: NWS Buffalo Dan Kelly and Sarah Jamison, NERFC Jeane Wallace NWS Flood Services for the Black River Basin National Weather Service Who We Are The National Oceanic and Atmospheric Administration
Radar Analysis for Design Storm Application
 37th Conference on Radar Meteorology Norman Oklahoma 14 18 September 2015 Norman, OK Radar Analysis for Design Storm Application Baxter E. Vieux, Vieux & Associates, Inc. Annjanette Dodd, Kimley-Horn,
RELIABILITY OF DESIGN STORMS IN MODELLING
 Page 1 of 13 RELIABILITY OF DESIGN STORMS IN MODELLING BY BEN URBONAS CHIEF, MASTER P LANNING P ROGRAM URBAN DRAINAGE AND FLOOD CONTROL DISTRICT DENVER, COLORADO Abstract. Stormwater runoff is generally
Updated Precipitation Frequency Estimates for Minnesota
 1 Updated Precipitation Frequency Estimates for Minnesota Presenter: Authors: (alphabetical order) Sanja Perica, Director Hydrometeorological Design Studies Center (HDSC), Office of Hydrology, National
Delaware River Flood Advisory Committee
 Delaware River Flood Advisory Committee A Partnership to Support Flood Mitigation Alan Tamm Pennsylvania Emergency Management Agency Bureau of Recovery and Mitigation atamm@state.pa.us Peter Gabrielsen
DESIGN RAINFALL DISTRIBUTIONS FOR THE STATE OF WYOMING. Patrick T. Tyrrell Victor R. Hasfurther August, 1983
 WWRC-83-08 DESIGN RAINFALL DISTRIBUTIONS FOR THE STATE OF WYOMING Patrick T. Tyrrell Victor R. Hasfurther August, 1983 Department of Civil Engineering College of Engineering University of Wyoming Research
Memorandum. Background
 Memorandum To: Kevin Stewart, P.E., Information Systems & Flood Warning Program Manager From: Mark Mitisek, H.I.T. Reviewed by: Kelly Close, P.E. Date: 02/11/2013 Project: Boulder Creek Hydromodel Subject:
Snow Melt with the Land Climate Boundary Condition
 Snow Melt with the Land Climate Boundary Condition GEO-SLOPE International Ltd. www.geo-slope.com 1200, 700-6th Ave SW, Calgary, AB, Canada T2P 0T8 Main: +1 403 269 2002 Fax: +1 888 463 2239 Introduction
Format of CLIGEN weather station statistics input files. for CLIGEN versions as of 6/2001 (D.C. Flanagan).
.") Format of CLIGEN weather station statistics input files for CLIGEN versions 4.1-5.1 as of 6/2001 (D.C. Flanagan). updated 12/11/2008 - Jim Frankenberger These files are also known as CLIGEN state files
Format of CLIGEN weather station statistics input files for CLIGEN versions 4.1-5.1 as of 6/2001 (D.C. Flanagan). updated 12/11/2008 - Jim Frankenberger These files are also known as CLIGEN state files
INFLOW DESIGN FLOOD CONTROL SYSTEM PLAN 40 C.F.R. PART PLANT YATES ASH POND 2 (AP-2) GEORGIA POWER COMPANY
 GEORGIA POWER COMPANY") INFLOW DESIGN FLOOD CONTROL SYSTEM PLAN 40 C.F.R. PART 257.82 PLANT YATES ASH POND 2 (AP-2) GEORGIA POWER COMPANY EPA s Disposal of Coal Combustion Residuals from Electric Utilities Final Rule (40 C.F.R.
INFLOW DESIGN FLOOD CONTROL SYSTEM PLAN 40 C.F.R. PART 257.82 PLANT YATES ASH POND 2 (AP-2) GEORGIA POWER COMPANY EPA s Disposal of Coal Combustion Residuals from Electric Utilities Final Rule (40 C.F.R.
Development and Land Use Change in the Central Potomac River Watershed. Rebecca Posa. GIS for Water Resources, Fall 2014 University of Texas
 Development and Land Use Change in the Central Potomac River Watershed Rebecca Posa GIS for Water Resources, Fall 2014 University of Texas December 5, 2014 Table of Contents I. Introduction and Motivation..4
Updating Precipitation Intensities for Runoff Estimation and Infrastructure Designs.
 PROJECT TITLE: Estimation and Infrastructure Designs. PROJECT MANAGER: C. Bruce Wilson AFFILIATION : Minnesota Pollution Control Agency MAILING ADDRESS: 520 Lafayette Road North CITY/STATE/ZIP: St. Paul,
APPENDIX B Hydrologic Model Spring Event
 Jock River Flood Risk Mapping (within the City of Ottawa) Hydrology Report July 2004 PageB1 APPENDIX B Hydrologic Model Spring Event Snowmelt+Rainfall Calibration and Validation Results Design Events Explanation
George Mason University Department of Civil, Environmental and Infrastructure Engineering
 George Mason University Department of Civil, Environmental and Infrastructure Engineering Dr. Celso Ferreira Prepared by Lora Baumgartner December 2015 Revised by Brian Ross July 2016 Exercise Topic: Getting
Probable Maximum Precipitation Study
 Probable Maximum Precipitation Study Virginia Floodplain Management Association Workshop Thursday, October 29, 2015 Robert T. Bennett, PE, RA, CFM DCR Dam Safety & Floodplain Management Definition (4VAC50-20-50.H)
ESTIMATING JOINT FLOW PROBABILITIES AT STREAM CONFLUENCES USING COPULAS
 ESTIMATING JOINT FLOW PROBABILITIES AT STREAM CONFLUENCES USING COPULAS Roger T. Kilgore, P.E., D. WRE* Principal Kilgore Consulting and Management 2963 Ash Street Denver, CO 80207 303-333-1408 David B.
Experimental Test of the Effects of Z R Law Variations on Comparison of WSR-88D Rainfall Amounts with Surface Rain Gauge and Disdrometer Data
 JUNE 2001 NOTES AND CORRESPONDENCE 369 Experimental Test of the Effects of Z R Law Variations on Comparison of WSR-88D Rainfall Amounts with Surface Rain Gauge and Disdrometer Data CARLTON W. ULBRICH Department
SAMPLE. SITE SPECIFIC WEATHER ANALYSIS Rainfall Report. Bevens Engineering, Inc. Susan M. Benedict REFERENCE:
 SAMPLE SITE SPECIFIC WEATHER ANALYSIS Rainfall Report PREPARED FOR: Bevens Engineering, Inc. Susan M. Benedict REFERENCE: DUBOWSKI RESIDENCE / FILE# 11511033 CompuWeather Sample Report Please note that
9. PROBABLE MAXIMUM PRECIPITATION AND PROBABLE MAXIMUM FLOOD
 9. PROBABLE MAXIMUM PRECIPITATION AND PROBABLE MAXIMUM FLOOD 9.1. Introduction Due to the size of Watana Dam and the economic importance of the Project to the Railbelt, the Probable Maximum Flood (PMF)
Pompton Lakes Dam Downstream Effects of the Floodgate Facility. Joseph Ruggeri Brian Cahill Michael Mak Andy Bonner
 Pompton Lakes Dam Downstream Effects of the Joseph Ruggeri Brian Cahill Michael Mak Andy Bonner ASFPM 2013: Overview Page 2 Overview Page 3 Overview Page 4 Overview Page 5 Overview - Historical Pompton
Analysis of the Sacramento Soil Moisture Accounting Model Using Variations in Precipitation Input
 Meteorology Senior Theses Undergraduate Theses and Capstone Projects 12-216 Analysis of the Sacramento Soil Moisture Accounting Model Using Variations in Precipitation Input Tyler Morrison Iowa State University,
Jones Creek Case Study
 Jones Creek Case Study Introduction In this case study we will examine the fictitious watershed of Jones Creek. This watershed has one confluence and can therefore be divided into three subbasins. The
STRUCTURAL ENGINEERS ASSOCIATION OF OREGON
 STRUCTURAL ENGINEERS ASSOCIATION OF OREGON P.O. Box 3285 PORTLAND, OR 97208 503.753.3075 www.seao.org E-mail: jane@seao.org 2010 OREGON SNOW LOAD MAP UPDATE AND INTERIM GUIDELINES FOR SNOW LOAD DETERMINATION
Designing a Dam for Blockhouse Ranch. Haley Born
 Designing a Dam for Blockhouse Ranch Haley Born CE 394K GIS in Water Resources Term Paper Fall 2011 Table of Contents Introduction... 1 Data Sources... 2 Precipitation Data... 2 Elevation Data... 3 Geographic
Presented at WaPUG Spring Meeting 1 st May 2001
 Presented at WaPUG Spring Meeting 1 st May 21 Author: Richard Allitt Richard Allitt Associates Ltd 111 Beech Hill Haywards Heath West Sussex RH16 3TS Tel & Fax (1444) 451552 1. INTRODUCTION The Flood Estimation
HEC-HMS Lab 2 Using Thiessen Polygon and Inverse Distance Weighting
 HEC-HMS Lab 2 Using Thiessen Polygon and Inverse Distance Weighting Created by Venkatesh Merwade (vmerwade@purdue.edu) Learning outcomes The objective of this lab is to learn how to input data from multiple
Design Flood Estimation in Ungauged Catchments: Quantile Regression Technique And Probabilistic Rational Method Compared
 Design Flood Estimation in Ungauged Catchments: Quantile Regression Technique And Probabilistic Rational Method Compared N Rijal and A Rahman School of Engineering and Industrial Design, University of
Real-Time Flood Forecasting Modeling in Nashville, TN utilizing HEC-RTS
 Real-Time Flood Forecasting Modeling in Nashville, TN utilizing HEC-RTS Brantley Thames, P.E. Hydraulic Engineer, Water Resources Section Nashville District, USACE August 24, 2017 US Army Corps of Engineers
Using a high-resolution ensemble modeling method to inform risk-based decision-making at Taylor Park Dam, Colorado
 Using a high-resolution ensemble modeling method to inform risk-based decision-making at Taylor Park Dam, Colorado Michael J. Mueller 1, Kelly Mahoney 2, Kathleen Holman 3, David Gochis 4 1 Cooperative
Overview of a Changing Climate in Rhode Island
 Overview of a Changing Climate in Rhode Island David Vallee, Hydrologist in Charge, National Weather Service Northeast River Forecast Center, NOAA Lenny Giuliano, Air Quality Specialist, Rhode Island Department
Impacts of Updated Design Rainfall Values on Louisiana Infrastructure
 Louisiana State University LSU Digital Commons LSU Master's Theses Graduate School 9-1-2018 Impacts of Updated Design Rainfall Values on Louisiana Infrastructure Mario Durbic mdurbi3@lsu.edu Follow this
INDIAN INSTITUTE OF SCIENCE STOCHASTIC HYDROLOGY. Lecture -30 Course Instructor : Prof. P. P. MUJUMDAR Department of Civil Engg., IISc.
 INDIAN INSTITUTE OF SCIENCE STOCHASTIC HYDROLOGY Lecture -30 Course Instructor : Prof. P. P. MUJUMDAR Department of Civil Engg., IISc. Summary of the previous lecture IDF relationship Procedure for creating
Module 1. Lecture 2: Weather and hydrologic cycle (contd.)
") Lecture 2: Weather and hydrologic cycle (contd.) Hydrology Hydor + logos (Both are Greek words) Hydor means water and logos means study. Hydrology is a science which deals with the occurrence, circulation
Lecture 2: Weather and hydrologic cycle (contd.) Hydrology Hydor + logos (Both are Greek words) Hydor means water and logos means study. Hydrology is a science which deals with the occurrence, circulation
PLANNED UPGRADE OF NIWA S HIGH INTENSITY RAINFALL DESIGN SYSTEM (HIRDS)
") PLANNED UPGRADE OF NIWA S HIGH INTENSITY RAINFALL DESIGN SYSTEM (HIRDS) G.A. Horrell, C.P. Pearson National Institute of Water and Atmospheric Research (NIWA), Christchurch, New Zealand ABSTRACT Statistics
PLANNED UPGRADE OF NIWA S HIGH INTENSITY RAINFALL DESIGN SYSTEM (HIRDS) G.A. Horrell, C.P. Pearson National Institute of Water and Atmospheric Research (NIWA), Christchurch, New Zealand ABSTRACT Statistics
Area-Depth Studies for Thunderstorm Rainfall in Illinois
 Circular No. 39 1952 STATE OF ILLINOIS Area-Depth Studies for Thunderstorm Rainfall in Illinois by F. A. HUFF AND G. E. STOUT Issued by Department of Registration and Education C. HOBART ENGLE, Director
Review of existing statistical methods for flood frequency estimation in Greece
 EU COST Action ES0901: European Procedures for Flood Frequency Estimation (FloodFreq) 3 rd Management Committee Meeting, Prague, 28 29 October 2010 WG2: Assessment of statistical methods for flood frequency
+ ( f o. (t) = f c. f c. )e kt (1)
 = f c. f c. )e kt (1)") CIVE Basic Hydrology Jorge A. Ramírez Computations Example Assume that the time evolution of the infiltration capacity for a given soil is governed by Horton's equation (Note that this equation assumes
CIVE Basic Hydrology Jorge A. Ramírez Computations Example Assume that the time evolution of the infiltration capacity for a given soil is governed by Horton's equation (Note that this equation assumes
1. TEMPORAL CHANGES IN HEAVY RAINFALL FREQUENCIES IN ILLINOIS
 to users of heavy rainstorm climatology in the design and operation of water control structures. A summary and conclusions pertaining to various phases of the present study are included in Section 8. Point
SAMPLE. SITE SPECIFIC WEATHER ANALYSIS Wind Report. Robinson, Smith & Walsh. John Smith REFERENCE:
 SAMPLE SITE SPECIFIC WEATHER ANALYSIS Wind Report PREPARED FOR: Robinson, Smith & Walsh John Smith REFERENCE: JACK HIGGINS / 4151559-01 CompuWeather Sample Report Please note that this report contains
SAMPLE. SITE SPECIFIC WEATHER ANALYSIS Rainfall Report. Bevins Engineering, Inc. Susan M. Benedict. July 1, 2017 REFERENCE:
 SAMPLE SITE SPECIFIC WEATHER ANALYSIS Rainfall Report PREPARED FOR: Bevins Engineering, Inc. Susan M. Benedict July 1, 2017 REFERENCE: DUBOWSKI RESIDENCE / FILE# 11511033 1500 Water Street, Pensacola,
BSYSE 456/556 Surface Hydrologic Processes and Modeling
 BSYSE 456/556 Surface Hydrologic Processes and Modeling Lab 9 (Prepared by Erin Brooks and Jan Boll, UI, and Joan Wu, WSU) P Introduction One of the most difficult tasks in watershed assessment and management
REPORT DOCUMENTATION FORM
 1 Report Number Special Report 9:23:83 Rainfall Frequency Study for Oahu: Option 1-preparation of Rainfall Frequency Maps 8Author(s)' Dr. Thomas W. Giambelluca Dr. L. Stephen Lau Dr. Yu-Si Fok Dr. Thomas
Statistical Analysis of Climatological Data to Characterize Erosion Potential: 2. Precipitation Events in Eastern Oregon/Washington
 E jiyu), Statistical Analysis of Climatological Data to Characterize Erosion Potential:. Precipitation Events in Eastern Oregon/Washington Special Report September Agricultural Experiment Station Oregon
RAINFALL FREQUENCY ANALYSIS FOR NEW BRAUNFELS, TX (or Seems like we ve been having lots of 100-yr storms)
") RAINFALL FREQUENCY ANALYSIS FOR NEW BRAUNFELS, TX (or Seems like we ve been having lots of 100-yr storms) Presented By: SAUL NUCCITELLI, PE, CFM (LAN) BLAKE KRONKOSKY, EIT (LAN) JIM KLEIN, PE (CITY OF
RAINFALL FREQUENCY ANALYSIS FOR NEW BRAUNFELS, TX (or Seems like we ve been having lots of 100-yr storms) Presented By: SAUL NUCCITELLI, PE, CFM (LAN) BLAKE KRONKOSKY, EIT (LAN) JIM KLEIN, PE (CITY OF
SAMPLE. SITE SPECIFIC WEATHER ANALYSIS Wind Report. Robinson, Smith & Walsh. John Smith. July 1, 2017 REFERENCE: 1 Maple Street, Houston, TX 77034
 SAMPLE SITE SPECIFIC WEATHER ANALYSIS Wind Report PREPARED FOR: Robinson, Smith & Walsh John Smith July 1, 2017 REFERENCE: JACK HIGGINS / 4151559-01 1 Maple Street, Houston, TX 77034 CompuWeather Sample
Intensity-Duration-Frequency (IDF) Curves Example
 Curves Example") Intensity-Duration-Frequency (IDF) Curves Example Intensity-Duration-Frequency (IDF) curves describe the relationship between rainfall intensity, rainfall duration, and return period (or its inverse, probability
Intensity-Duration-Frequency (IDF) Curves Example Intensity-Duration-Frequency (IDF) curves describe the relationship between rainfall intensity, rainfall duration, and return period (or its inverse, probability
David R. Vallee Hydrologist-in-Charge NOAA/NWS Northeast River Forecast Center
 David R. Vallee Hydrologist-in-Charge NOAA/NWS Northeast River Forecast Center Record flooding along the Shawsheen River during the 2006 Mother s Day Floods Calibrate and implement a variety of hydrologic
Hydrology and Hydraulics Design Report. Background Summary
 To: National Park Services Montezuma Castle National Monument Richard Goepfrich, Facility Manager From: Multicultural Technical Engineers Date: Tuesday - February 13, 2018 Subject: 30% Hydrology and Hydraulics
A Spatial-Temporal Downscaling Approach To Construction Of Rainfall Intensity-Duration- Frequency Relations In The Context Of Climate Change
 City University of New York (CUNY) CUNY Academic Works International Conference on Hydroinformatics 8-1-2014 A Spatial-Temporal Downscaling Approach To Construction Of Rainfall Intensity-Duration- Frequency
Regional Climate Change Effects Report
 Regional Climate Change Effects Report Aug 6, 2010 Robert Kafalenos, FHWA U.S. Department of Transportation Federal Highway Administration 1 Past Performance does not guarantee future returns Past weather
Storm and Runoff Calculation Standard Review Snowmelt and Climate Change
 Storm and Runoff Calculation Standard Review Snowmelt and Climate Change Presented by Don Moss, M.Eng., P.Eng. and Jim Hartman, P.Eng. Greenland International Consulting Ltd. Map from Google Maps TOBM
Rainfall data analysis and storm prediction system
 Rainfall data analysis and storm prediction system SHABARIRAM, M. E. Available from Sheffield Hallam University Research Archive (SHURA) at: http://shura.shu.ac.uk/15778/ This document is the author deposited
APPENDIX B HYDROLOGY
 APPENDIX B HYDROLOGY TABLE OF CONTENTS 1.0 INTRODUCTION... 1 2.0 PROBABLE MAXIMUM PRECIPITATION (PMP)... 1 3.0 DESIGN FLOW CALCULATION... 1 4.0 DIVERSION CHANNEL SIZING... 2 5.0 REFERENCES... 4 LIST OF