Lecture 6: Precipitation Averages and Interception
|
|
|
- Claire Prudence Lewis
- 6 years ago
- Views:
Transcription

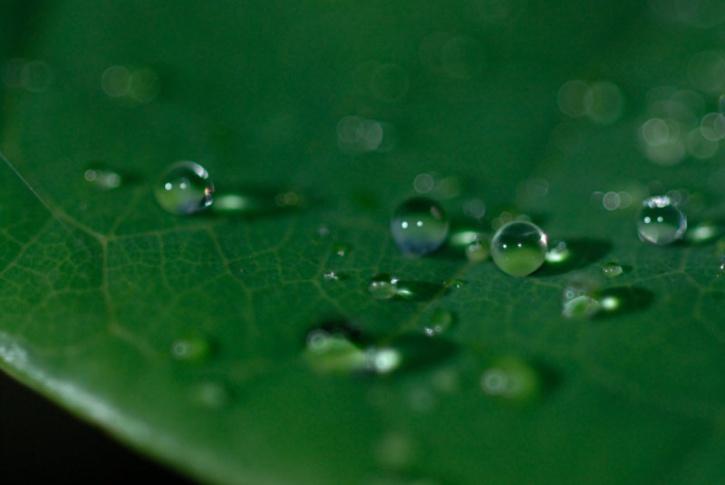
1 Lecture 6: Precipitation Averages and Interception Key Questions 1. How much and when does Whatcom County receive rain? 2. Where online can you find rainfall data for the state? 3. How is rainfall averaged over a watershed? 4. What is interception and what controls its magnitude? 5. Why does so much rain get intercepted in the PNW? Intercepted rain on a leaf
2 Point Measurement of Rainfall Accurate measurements are necessary for quantitative hydrologic analyses. Two questions arise: 1. How accurate are point measurements? 2. How accurately can point measurements be extrapolated over an area?

3 City of Bellingham Rain Gauge Locations


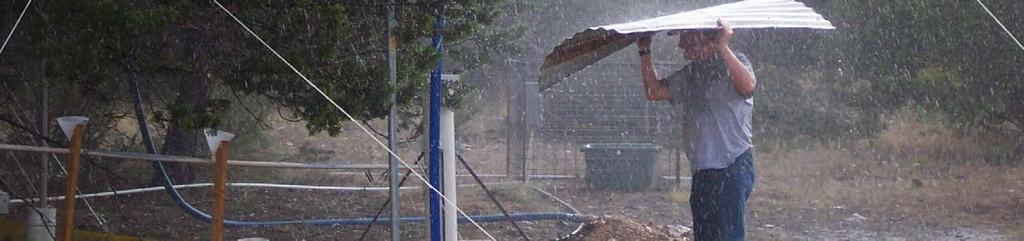
4 Tipping Bucket Rain Gauge 8 inch diameter Collects 1 mm (0.01 inch) of rain and tips, empties and send an electronic digital signal that is recorded.
5 Variables that affect accuracy Wind (keep about 1 m above the ground) Obstacles (place in open areas away from trees and structures) Brannian Creek Rain Gauge Splashing Evaporation Annual measurement accuracy is 5-15% up to 75% for a single storm
6 Lake Whatcom Watershed Rain Gauge Locations
7 North Shore Meteorological (MET) Station Measures rain, temperature, humidity, wind speed, wind direction, and solar radiation

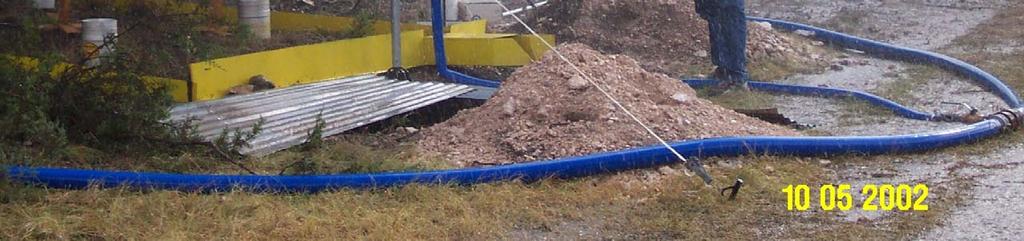
8 Brannian Creek Rain Gauge

9 Geneva Rain Gauge

10 Bloedel Donovan Rain Gauge
11 North Shore Hyetograph: 2010 Water Year Oct 1 Apr 1 Sep 30
12 North Shore Monthly Totals: 2010 Water Year

13 North Shore Meteorological (MET) Station There are 8760 hours in one year. How many hours (or what percentage) of 8760 do you think it rains in Bellingham? In 2010, the North Shore gauge recorded rainfall 1221 hours out of Meaning that it rained14% of the year. Measures rain, temperature, humidity, wind speed, wind direction, and solar radiation
14 Hourly rainfall frequency for the 1221 hours of recorded rainfall at the North Shore gauge in % of the 1221 hours of recorded rainfall in 2010, were 0.1 inches. What does this say about rainfall intensity in the watershed?
15 Cumulative Rainfall: 2010 Water Year Oct 1 Apr 1 Sep 30

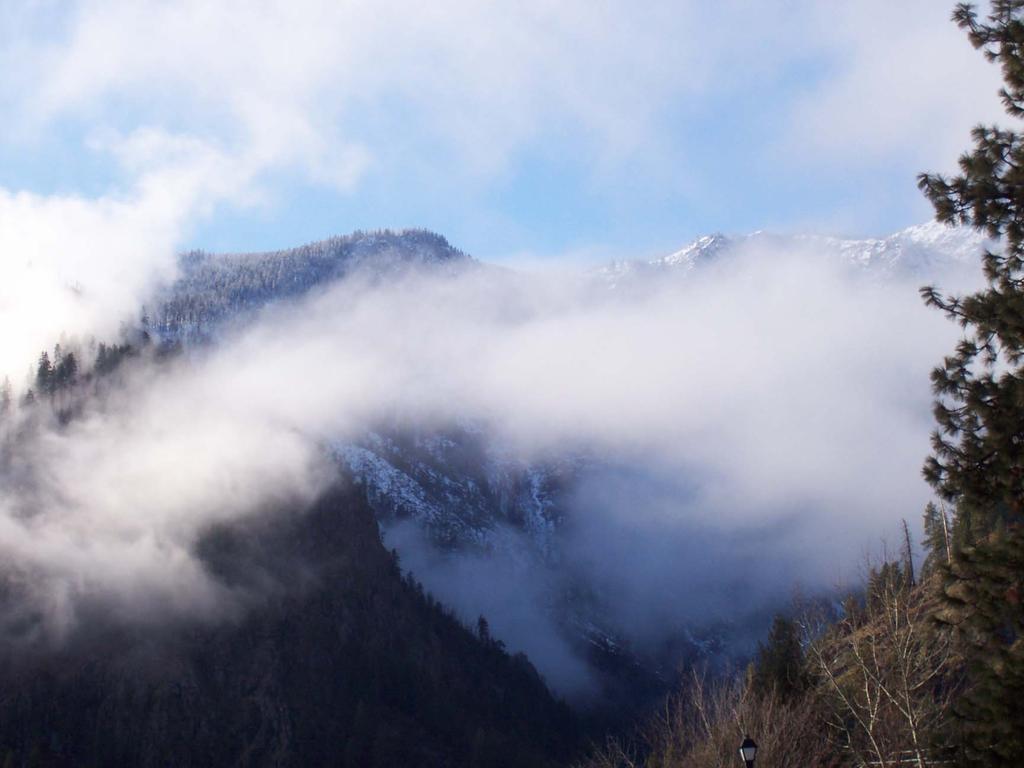
16 Why does it rain more in the southern part of the Lake Whatcom Watershed?

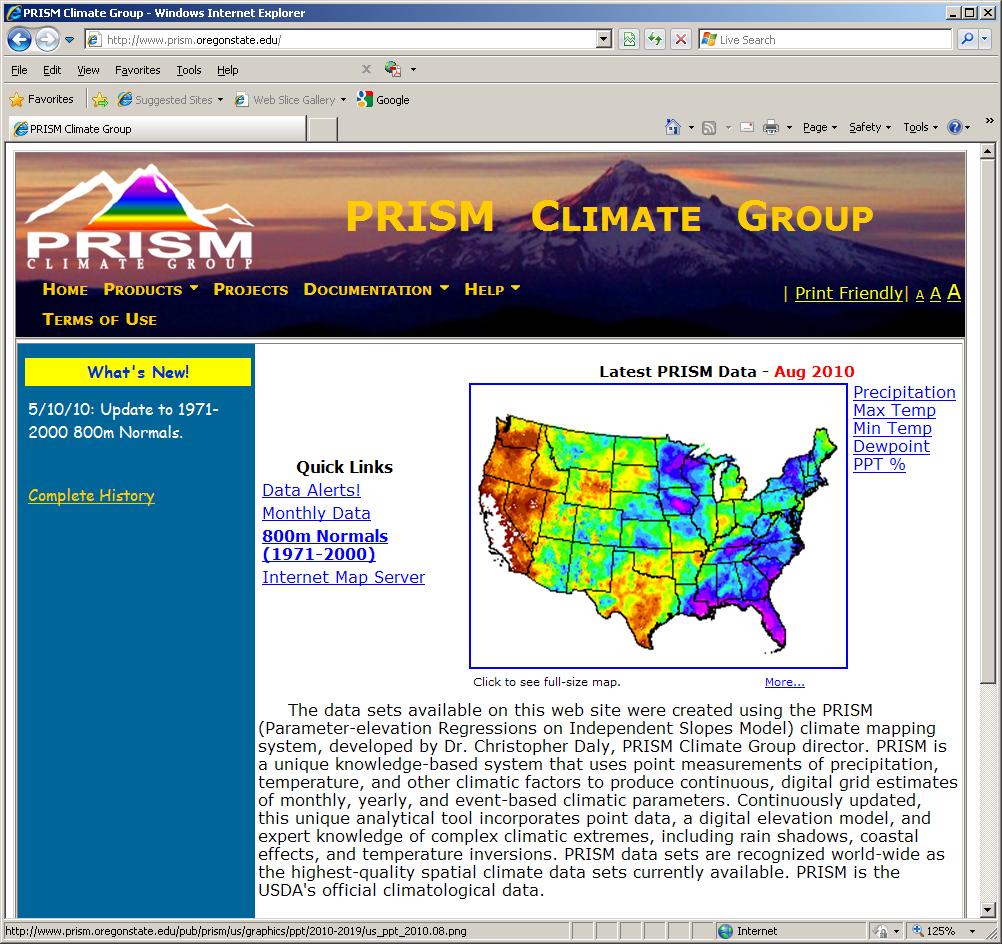
17 Western Regional Climate Center

18 Washington Agricultural Weather Network

19 WWU Ski and Snowboard Club by Cory Tarilton

20 How is the average rainfall over an area determined from point measurements?
21 Areal Average: Arithmetic P = 1 G G g =1 P g P = P = inches


22 Areal Average: Thiessen Polygons A 1 A 3 P = 1 G Area g =1 A g x P g A 2 A x A2 x A3 x A4 x P = A 1 + A 2 + A 3 + A 4 P = inches A 4

23 Statistical techniques can be used in ArcGIS to estimate an areal average.

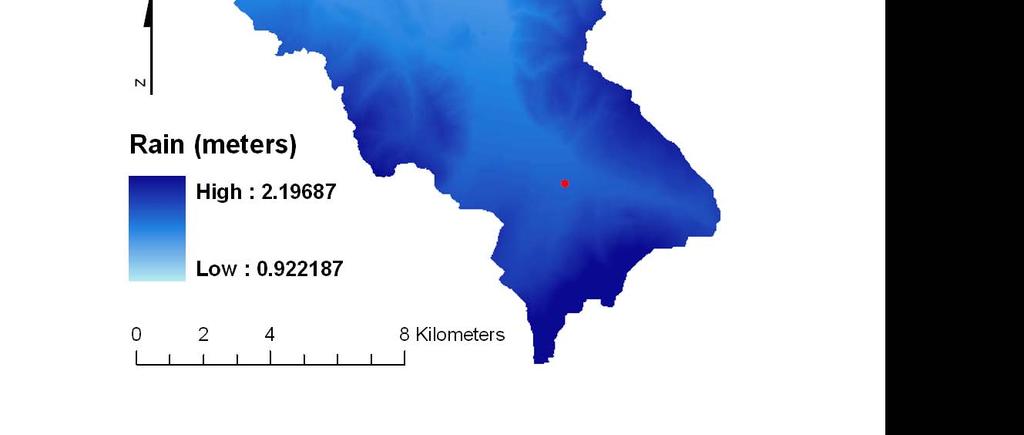
24 Areal Average: Spline Interpolation P = inches
25 On average the Bellingham withdrawals about 11,000,000 gallons-perday from the lake. Assuming all the extra rainfall goes directly to the lake as runoff how many days worth of water does the difference represent ( = 1.52 inches)?


26 On average the Bellingham withdrawals about 11,000,000 gallons-perday from the lake. Assuming all the extra rainfall goes directly to the lake as runoff how many days worth of water does the difference represent ( = 1.52 inches)? 136 days
27


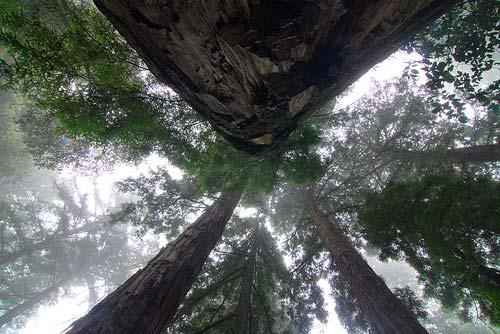
28 Vegetation type and distribution affects how much precipitation hits the ground surface, and hence streamflow Lake Whatcom Watershed Lake Whatcom Watershed

29 Vegetation intercepts and stores precipitation (snow)

30 Vegetation intercepts and stores precipitation
31 The magnitude of interception and storage is determined by 1. Type and growth stage of the vegetation


 heavy")
32 The magnitude of interception and storage is determined by 1. Type and growth stage of the vegetation 2. Precipitation characteristics (intensity and duration) heavy rain light rain intermittent light rain
33 gross rainfall
34 gross rainfall throughfall
35 gross rainfall canopy interception stem flow throughfall

36 through fall measurements
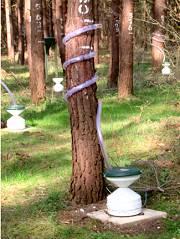
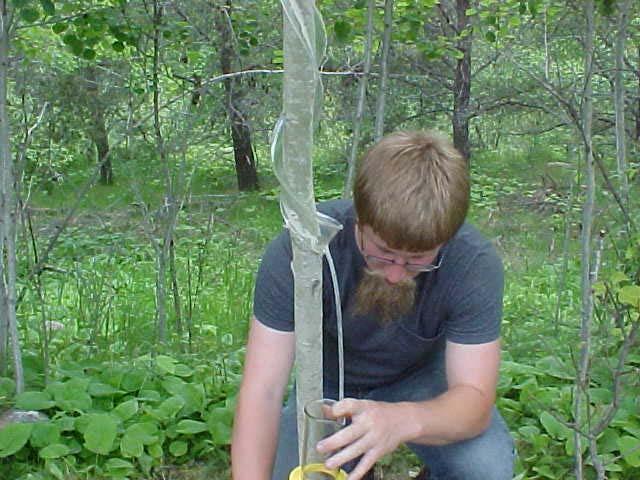
37 stem flow measurements

38 through fall and stem flow measurements
 stem flow (S t ) throughfall (T h")
39 E c = P g (T h + S t ) gross rainfall (P g ) canopy interception (E c ) stem flow (S t ) throughfall (T h )


40 The magnitude of interception and storage is determined by 1. Type and growth stage of the vegetation 2. Precipitation characteristics (intensity and duration)

41 The canopy area available for precipitation interception and storage is quantified by a variable called LEAF AREA INDEX (LIA)

42 LAI = the ratio of canopy area to projected ground area LAI = 1 = 10,000 m 2 per 10,000 m 2 LAI = 2 = 20,000 m 2 per 10,000 m 2 LAI = 6 = 60,000 m 2 per 10,000 m 2
43 Regression equations are used to estimate the magnitude of throughfall (T h ) and stem flow (S t ) that occurs in a forested watershed. The equation below is an estimate for a coastal conifer forest (units are in cm). T h + S t = P n = 0.79 P g 0.13n Where P n is the net precipitation, P g is the gross precipitation (rain falling above the forest) and n is the number of storms.
44 T h + S t = P n = 0.79 P g 0.13n P n is the net precipitation The magnitude of P n is controlled by the rainfall intensity.
45 T h + S t = P n = 0.79 P g 0.13n P n is the net precipitation Determine P n where P g is 10 cm and n = 5
46 T h + S t = P n = 0.79 P g 0.13n P n is the net precipitation Determine P n where P g is 10 cm and n = 5 P n = 7.25 cm
47 T h + S t = P n = 0.79 P g 0.13n P n is the net precipitation Determine P n where P g is 10 cm and n = 20
48 T h + S t = P n = 0.79 P g 0.13n P n is the net precipitation Determine P n where P g is 10 cm and n = 20 P n = 5.30 cm
49 Because of the high amount of low intensity rainfall events in the PNW, about 30% of the rain is intercepted.

50 Occult Precipitation (water)
51 Fog Drip
52 Occult Precipitation (ice)
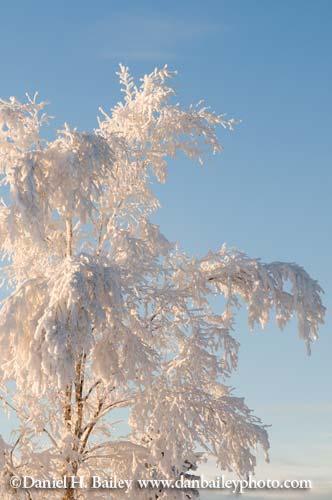
53 Rhime
Lecture 5: Precipitation
 Lecture 5: Precipitation Key Questions 1. What physical concepts control the formation of precipitation (air pressure, expanding gases and cooling, and vapor pressure)? 2. What are some air mass lifting
GEOG415 Mid-term Exam 110 minute February 27, 2003
 GEOG415 Mid-term Exam 110 minute February 27, 2003 1 Name: ID: 1. The graph shows the relationship between air temperature and saturation vapor pressure. (a) Estimate the relative humidity of an air parcel
Precipitation Rabi H. Mohtar
 Precipitation Rabi H. Mohtar The objectives of this module are to present and analyze: 1) Precipitation forms, characteristics, and measurements 2) Intensity, Duration, Frequency (IDF) curves and rainfall
Module 1. Lecture 2: Weather and hydrologic cycle (contd.)
") Lecture 2: Weather and hydrologic cycle (contd.) Hydrology Hydor + logos (Both are Greek words) Hydor means water and logos means study. Hydrology is a science which deals with the occurrence, circulation
Lecture 2: Weather and hydrologic cycle (contd.) Hydrology Hydor + logos (Both are Greek words) Hydor means water and logos means study. Hydrology is a science which deals with the occurrence, circulation
CIVE322 BASIC HYDROLOGY
 CIVE322 BASIC HYDROLOGY Homework No.3 Solution 1. The coordinates of four precipitation gauging stations are A = (3,4), B = (9,4), C = (3,12), and D = (9,12). The observed precipitation amounts at these
Lecture 3A: Interception
 3-1 GEOG415 Lecture 3A: Interception What is interception? Canopy interception (C) Litter interception (L) Interception ( I = C + L ) Precipitation (P) Throughfall (T) Stemflow (S) Net precipitation (R)
UWM Field Station meteorological data
 University of Wisconsin Milwaukee UWM Digital Commons Field Station Bulletins UWM Field Station Spring 992 UWM Field Station meteorological data James W. Popp University of Wisconsin - Milwaukee Follow
Lecture 2: Precipitation
 2-1 GEOG415 Lecture 2: Precipitation Why do we study precipitation? Precipitation measurement -- depends on the study purpose. Non-recording (cumulative) Recording (tipping bucket) Important parameters
Lecture notes: Interception and evapotranspiration
 Lecture notes: Interception and evapotranspiration I. Vegetation canopy interception (I c ): Portion of incident precipitation (P) physically intercepted, stored and ultimately evaporated from vegetation
Lake Tahoe Watershed Model. Lessons Learned through the Model Development Process
 Lake Tahoe Watershed Model Lessons Learned through the Model Development Process Presentation Outline Discussion of Project Objectives Model Configuration/Special Considerations Data and Research Integration
Table (6): Annual precipitation amounts as recorded by stations X and Y. No. X Y
: Annual precipitation amounts as recorded by stations X and Y. No. X Y") Example: X and Y are two neighboring rainfall stations. Station X has complete records and station Y has some missing values. Find the linear correlation equation between the two series as mentioned in
Example: X and Y are two neighboring rainfall stations. Station X has complete records and station Y has some missing values. Find the linear correlation equation between the two series as mentioned in
SOUTH MOUNTAIN WEATHER STATION: REPORT FOR QUARTER 2 (APRIL JUNE) 2011
 2011") SOUTH MOUNTAIN WEATHER STATION: REPORT FOR QUARTER 2 (APRIL JUNE) 2011 Prepared for ESTANCIA BASIN WATERSHED HEALTH, RESTORATION AND MONITORING STEERING COMMITTEE c/o CLAUNCH-PINTO SOIL AND WATER CONSERVATION
SOUTH MOUNTAIN WEATHER STATION: REPORT FOR QUARTER 2 (APRIL JUNE) 2011 Prepared for ESTANCIA BASIN WATERSHED HEALTH, RESTORATION AND MONITORING STEERING COMMITTEE c/o CLAUNCH-PINTO SOIL AND WATER CONSERVATION
Precipitation. Prof. M.M.M. Najim
 Precipitation Prof. M.M.M. Najim Learning Outcome At the end of this section students will be able to Explain different forms of precipitation Identify different types of rain gauges Measure rainfall using
Appendix A Calibration Memos
 Appendix A Calibration Memos University of Washington Department of Civil and Environmental Engineering TO: Joe Dvorak FROM: Margaret Hahn and Richard Palmer RE: DVSVM Calibration DATE: June 28, 21 This
Climatic Change Implications for Hydrologic Systems in the Sierra Nevada
 Climatic Change Implications for Hydrologic Systems in the Sierra Nevada Part Two: The HSPF Model: Basis For Watershed Yield Calculator Part two presents an an overview of why the hydrologic yield calculator
Water Year Day 2010
 mm mm SCA, % Storage, mm Sto, 1 mm Sat def, 1 mm 25 2 15 1 5 4 3 2 1 2 5 25 2 Saturation deficit depth (water table) Saturation deficit volume Root zone storage Unsaturated soil storage Groundwater storage
LOCAL CLIMATOLOGICAL DATA Monthly Summary July 2013
 Deg. Days Precip Ty Precip Wind Solar Hu- Adj. to Sea Level mid- ity Avg Res Res Peak Minute 1 fog 2 hvy fog 3 thunder 4 ice plt 5 hail 6 glaze 7 duststm 8 smk, hz 9 blw snw 1 2 3 4A 4B 5 6 7 8 9 12 14
CoCoRaHS Monitoring Colorado s s Water Resources through Community Collaborations
 CoCoRaHS Monitoring Colorado s s Water Resources through Community Collaborations Nolan Doesken Colorado Climate Center Atmospheric Science Department Colorado State University Presented at Sustaining
LOCAL CLIMATOLOGICAL DATA Monthly Summary September 2016
 Deg. Days Precip Ty Precip Wind Solar Hu- Adj. to Sea Level mid- ity Avg Res Res Peak 2 Minute 1 fog 2 hvy fog 3 thunder 4 ice plt 5 hail 6 glaze 7 duststm 8 smk, hz 9 blw snw 1 2 3 4A 4B 5 6 7 8 9 11
Fenhe (Fen He) Map of River. Table of Basic Data. China 10
 Map of River. Table of Basic Data. China 10") Fenhe (Fen He) Map of River Table of Basic Data Name(s): Fenhe (in Huanghe River) Location: Shanxi Province, Northern China Area: 39,471 km 2 Origin: Mt. Guancen (2,147 m) Outlet: Huanghe Serial No. :
Fenhe (Fen He) Map of River Table of Basic Data Name(s): Fenhe (in Huanghe River) Location: Shanxi Province, Northern China Area: 39,471 km 2 Origin: Mt. Guancen (2,147 m) Outlet: Huanghe Serial No. :
CHAPTER 1 INTRODUCTION
 CHAPTER 1 INTRODUCTION Mean annual precipitation (MAP) is perhaps the most widely used variable in hydrological design, water resources planning and agrohydrology. In the past two decades one of the basic
Rong Jiang. Map of River. Table of Basic Data. China 14. Serial No. : China-14
 Rong Jiang Map of River Table of Basic Data Name(s): Rong Jiang Location: Guangdong Province, Coastways China Area: 4,408 km 2 Serial No. : China-14 N 23 11' ~ 23 55' E 115 37' ~ 116 38' Length of the
Memo. I. Executive Summary. II. ALERT Data Source. III. General System-Wide Reporting Summary. Date: January 26, 2009 To: From: Subject:
 Memo Date: January 26, 2009 To: From: Subject: Kevin Stewart Markus Ritsch 2010 Annual Legacy ALERT Data Analysis Summary Report I. Executive Summary The Urban Drainage and Flood Control District (District)
Environment Canada Modelling Systems and the 2013 Alberta Floods
 Environment Canada Modelling Systems and the 2013 Alberta Floods Calgary, Alberta February 19, 2014 Bruce Davison (EC) Al Pietroniro (EC) Nick Kouwen (UW) Anthony Liu (EC) Muluneh Mekonnen (AB) Ron Goodison
January 25, Summary
 January 25, 2013 Summary Precipitation since the December 17, 2012, Drought Update has been slightly below average in parts of central and northern Illinois and above average in southern Illinois. Soil
Gridding of precipitation and air temperature observations in Belgium. Michel Journée Royal Meteorological Institute of Belgium (RMI)
") Gridding of precipitation and air temperature observations in Belgium Michel Journée Royal Meteorological Institute of Belgium (RMI) Gridding of meteorological data A variety of hydrologic, ecological,
Gridding of precipitation and air temperature observations in Belgium Michel Journée Royal Meteorological Institute of Belgium (RMI) Gridding of meteorological data A variety of hydrologic, ecological,
HEC-HMS Lab 4 Using Frequency Storms in HEC-HMS
 HEC-HMS Lab 4 Using Frequency Storms in HEC-HMS Created by Venkatesh Merwade (vmerwade@purdue.edu) Learning outcomes The objective of this lab is to learn how HEC-HMS is used to determine design flow by
Assessment of rainfall observed by weather radar and its effect on hydrological simulation performance
 386 Hydrology in a Changing World: Environmental and Human Dimensions Proceedings of FRIED-Water 2014, Montpellier, France, October 2014 (IAHS Publ. 363, 2014). Assessment of rainfall observed by weather
Results of Intensity-Duration- Frequency Analysis for Precipitation and Runoff under Changing Climate
 Results of Intensity-Duration- Frequency Analysis for Precipitation and Runoff under Changing Climate Supporting Casco Bay Region Climate Change Adaptation RRAP Eugene Yan, Alissa Jared, Julia Pierce,
2003 Water Year Wrap-Up and Look Ahead
 2003 Water Year Wrap-Up and Look Ahead Nolan Doesken Colorado Climate Center Prepared by Odie Bliss http://ccc.atmos.colostate.edu Colorado Average Annual Precipitation Map South Platte Average Precipitation
The Hydrologic Cycle: How Do River Forecast Centers Measure the Parts?
 The Hydrologic Cycle: How Do River Forecast Centers Measure the Parts? Greg Story Meteorologist National Weather Service Fort Worth, TX Overview n Introduction What is the mission of an RFC? n The Hydrologic
Tropical Montane Cloud Forests: Importance and Challenges in a Changing Environment
 Tropical Montane Cloud Forests: Importance and Challenges in a Changing Environment Daniel E. Comarazamy and Jorge E. González The NOAA-CREST Center & Department of Mechanical Engineering, City College
Hydrologic Overview & Quantities
 Hydrologic Overview & Quantities It is important to understand the big picture when attempting to forecast. This includes the interactive components and hydrologic quantities. Hydrologic Cycle The complexity
Flood Forecasting Tools for Ungauged Streams in Alberta: Status and Lessons from the Flood of 2013
 Flood Forecasting Tools for Ungauged Streams in Alberta: Status and Lessons from the Flood of 2013 John Pomeroy, Xing Fang, Kevin Shook, Tom Brown Centre for Hydrology, University of Saskatchewan, Saskatoon
Instructions for Running the FVS-WRENSS Water Yield Post-processor
 Instructions for Running the FVS-WRENSS Water Yield Post-processor Overview The FVS-WRENSS post processor uses the stand attributes and vegetative data from the Forest Vegetation Simulator (Dixon, 2002)
Advance Preparation Students should be comfortable using the internet and Microsoft Excel.
 Streamflow and the Manoa flood Lesson 4 --------------------------------------------------------------------------------------------------------------------- Objectives The student will be able to do the
Northern New England Climate: Past, Present, and Future. Basic Concepts
 Northern New England Climate: Past, Present, and Future Basic Concepts Weather instantaneous or synoptic measurements Climate time / space average Weather - the state of the air and atmosphere at a particular
Lecture 14: Floods. Key Questions
 Lecture 14: Floods Key Questions 1. What is an upstream flood? 2. What is a downstream flood? 3. What were the setup conditions that cause floods? 4. What is a 100-year flood? 5. How are 100-year flood
Mapping the extent of temperature-sensitive snowcover and the relative frequency of warm winters in the western US
 Mapping the extent of temperature-sensitive snowcover and the relative frequency of warm winters in the western US Anne Nolin Department of Geosciences Oregon State University Acknowledgements Chris Daly,
APPENDIX A LAKE EVAPORATION
 APPENDICES APPENDIX A LAKE EVAPORATION 457 APPENDIX A LAKE EVAPORATION A.1 INTRODUCTION The net historic monthly inflows to Okanagan Lake as determined by change in lake storage and outflow corrected for
MET 3102-U01 PHYSICAL CLIMATOLOGY (ID 17901) Lecture 14
 Lecture 14") MET 3102-U01 PHYSICAL CLIMATOLOGY (ID 17901) Lecture 14 The hydrologic cycle evaporation vapor transport precipitation precipitation evaporation runoff Evaporation, precipitation, etc. in cm Vapor transported
MET 3102-U01 PHYSICAL CLIMATOLOGY (ID 17901) Lecture 14 The hydrologic cycle evaporation vapor transport precipitation precipitation evaporation runoff Evaporation, precipitation, etc. in cm Vapor transported
Leon Creek Watershed October 17-18, 1998 Rainfall Analysis Examination of USGS Gauge Helotes Creek at Helotes, Texas
 Leon Creek Watershed October 17-18, 1998 Rainfall Analysis Examination of USGS Gauge 8181400 Helotes Creek at Helotes, Texas Terrance Jackson MSCE Candidate University of Texas San Antonio Abstract The
CIMIS. California Irrigation Management Information System
 CIMIS California Irrigation Management Information System What is CIMIS? A network of over 130 fully automated weather stations that collect weather data throughout California and provide estimates of
Evaluation of MPE Radar Estimation Using a High Density Rain Gauge Network within a Hydro-Estimator Pixel and Small SubWatershed
 Evaluation of MPE Radar Estimation Using a High Density Rain Gauge Network within a Hydro-Estimator Pixel and Small SubWatershed ALEJANDRA M. ROJAS GONZÁLEZ 1, ERIC W. HARMSEN 2 AND SANDRA CRUZ POL 3 1
Radar precipitation for winter hydrological modelling
 Weather Radar Information and Distributed Hydrological Modelling (Proceedings of symposium IIS03 held during IUOG2003 al Sapporo. July 2003). IAHS Publ. no. 282. 2003. 35 Radar precipitation for winter
EFFECTS OF TEMPORAL RESOLUTION ON RIVER FLOW FORECASTING WITH SIMPLE INTERCEPTION MODEL WITHIN A DISTRIBUTED HYDROLOGICAL MODEL
 www.arpapress.com/volumes/vol8issue1/ijrras_8_1_02.pdf EFFECTS OF TEMPORAL RESOLUTION ON RIVER FLOW FORECASTING WITH SIMPLE INTERCEPTION MODEL WITHIN A DISTRIBUTED HYDROLOGICAL MODEL Azinoor Azida ABU
Severe Weather Watches, Advisories & Warnings
 Severe Weather Watches, Advisories & Warnings Tornado Watch Issued by the Storm Prediction Center when conditions are favorable for the development of severe thunderstorms and tornadoes over a larger-scale
Why Cloud Droplets Don t Fall
 Introduction to Climatology GEOGRAPHY 300 Tom Giambelluca University of Hawai i at Mānoa Precipitation Processes Why Cloud Droplets Don t Fall Cloud droplets are too small to fall to the ground: Low terminal
Climates of NYS. Definitions. Climate Regions of NYS. Storm Tracks. Climate Controls 10/13/2011. Characteristics of NYS s Climates
 Definitions Climates of NYS Prof. Anthony Grande 2011 Weather and Climate Weather the state of the atmosphere at one point in time. The elements of weather are temperature, air pressure, wind and moisture.
Geostatistical Analysis of Rainfall Temperature and Evaporation Data of Owerri for Ten Years
 Atmospheric and Climate Sciences, 2012, 2, 196-205 http://dx.doi.org/10.4236/acs.2012.22020 Published Online April 2012 (http://www.scirp.org/journal/acs) Geostatistical Analysis of Rainfall Temperature
Section 2 Rainfall and Climatic Data
 Section 2 Rainfall and Climatic Data Introduction and General Program Description Monterey County agribusiness, residential water users, the tourist industry, and all other businesses depend on rainfall
Effect of Storm Separation Time on Rainfall Characteristics-A Case Study of Johor, Malaysia
 European Journal of Scientific Research ISSN 1450-216X Vol.45 No.2 (2010), pp.162-167 EuroJournals Publishing, Inc. 2010 http://www.eurojournals.com/ejsr.htm Effect of Storm Separation Time on Rainfall
Colorado s 2003 Moisture Outlook
 Colorado s 2003 Moisture Outlook Nolan Doesken and Roger Pielke, Sr. Colorado Climate Center Prepared by Tara Green and Odie Bliss http://climate.atmos.colostate.edu How we got into this drought! Fort
Lecture 8: Snow Hydrology
 GEOG415 Lecture 8: Snow Hydrology 8-1 Snow as water resource Snowfall on the mountain ranges is an important source of water in rivers. monthly pcp (mm) 100 50 0 Calgary L. Louise 1 2 3 4 5 6 7 8 9 10
CW3E Atmosphere River Update - Summary
 CW3E Atmosphere River Update - Summary Two Atmospheric Rivers (ARs) made landfall over the Pacific Northwest over the previous four days These events combined to produce >400 mm of precipitation in southern
Coastal Flooding in Brevard County, Florida
 Helen Gerlach CE 394K.3 December 4, 2015 Coastal Flooding in Brevard County, Florida Introduction My project was to create a model of the coastal flooding that occurred in Brevard County, Florida in August
Cloud Water Interception
 Tropical Montane Cloud Forests in Hawai`i Cloud Water Interception T. Giambelluca GEOG 405 University of Hawai i at Mānoa Receive water input directly from cloud Refuge for scarce native species Important
The elevations on the interior plateau generally vary between 300 and 650 meters with
 11 2. HYDROLOGICAL SETTING 2.1 Physical Features and Relief Labrador is bounded in the east by the Labrador Sea (Atlantic Ocean), in the west by the watershed divide, and in the south, for the most part,
Variability of Reference Evapotranspiration Across Nebraska
 Know how. Know now. EC733 Variability of Reference Evapotranspiration Across Nebraska Suat Irmak, Extension Soil and Water Resources and Irrigation Specialist Kari E. Skaggs, Research Associate, Biological
Introduction to Climatology. GEOG/ENST 2331: Lecture 1
 Introduction to Climatology GEOG/ENST 2331: Lecture 1 Us! Graham Saunders (RC 2006C) graham.saundersl@lakeheadu.ca! Jason Freeburn (RC 2004) jtfreebu@lakeheadu.ca Graham Saunders! Australian Weather Bureau!
MARYLAND/DC COCORAHS Volume 1, Issue 3 June 2009
 MARYLAND/DC COCORAHS Volume 1, Issue 3 June 2009 More on Cleaning Your Rain Gauge One of our observers, Stan (MD-MG-52) has had success in cleaning with a 10 pct solution of bleach with water and that
Solution: The ratio of normal rainfall at station A to normal rainfall at station i or NR A /NR i has been calculated and is given in table below.
 3.6 ESTIMATION OF MISSING DATA Data for the period of missing rainfall data could be filled using estimation technique. The length of period up to which the data could be filled is dependent on individual
Meteorology. Chapter 15 Worksheet 1
 Chapter 15 Worksheet 1 Meteorology Name: Circle the letter that corresponds to the correct answer 1) The Tropic of Cancer and the Arctic Circle are examples of locations determined by: a) measuring systems.
Drought in Southeast Colorado
 Drought in Southeast Colorado Nolan Doesken and Roger Pielke, Sr. Colorado Climate Center Prepared by Tara Green and Odie Bliss http://climate.atmos.colostate.edu 1 Historical Perspective on Drought Tourism
12 SWAT USER S MANUAL, VERSION 98.1
 12 SWAT USER S MANUAL, VERSION 98.1 CANOPY STORAGE. Canopy storage is the water intercepted by vegetative surfaces (the canopy) where it is held and made available for evaporation. When using the curve
2003 Moisture Outlook
 2003 Moisture Outlook Nolan Doesken and Roger Pielke, Sr. Colorado Climate Center Prepared by Tara Green and Odie Bliss http://climate.atmos.colostate.edu Through 1999 Through 1999 Fort Collins Total Water
Identifying Biomes from Climatograms
 Identifying Biomes from Welcome to your climatogram lab. In this lab you will investigate the between the amount of rainfall and the variance of temperature and the effect on the distribution of biomes
Definitions Weather and Climate Climates of NYS Weather Climate 2012 Characteristics of Climate Regions of NYS NYS s Climates 1.
 Definitions Climates of NYS Prof. Anthony Grande 2012 Weather and Climate Weather the state of the atmosphere at one point in time. The elements of weather are temperature, t air pressure, wind and moisture.
Basins-Level Heavy Rainfall and Flood Analyses
 Basins-Level Heavy Rainfall and Flood Analyses Peng Gao, Greg Carbone, and Junyu Lu Department of Geography, University of South Carolina (gaop@mailbox.sc.edu, carbone@mailbox.sc.edu, jlu@email.sc.edu)
Climate Variability in South Asia
 Climate Variability in South Asia V. Niranjan, M. Dinesh Kumar, and Nitin Bassi Institute for Resource Analysis and Policy Contents Introduction Rainfall variability in South Asia Temporal variability
Anticipated and Observed Trends in the Global Hydrological Cycle. Kevin E. Trenberth NCAR
 Anticipated and Observed Trends in the Global Hydrological Cycle Kevin E. Trenberth NCAR The presence of moisture affects the disposition of incoming solar radiation: Evaporation (drying) versus temperature
Applications/Users for Improved S2S Forecasts
 Applications/Users for Improved S2S Forecasts Nolan Doesken Colorado Climate Center Colorado State University WSWC Precipitation Forecasting Workshop June 7-9, 2016 San Diego, CA First -- A short background
VIC Hydrology Model Training Workshop Part II: Building a model
 VIC Hydrology Model Training Workshop Part II: Building a model 11-12 Oct 2011 Centro de Cambio Global Pontificia Universidad Católica de Chile Ed Maurer Civil Engineering Department Santa Clara University
3) What is the difference between latitude and longitude and what is their affect on local and world weather and climate?
 What is the difference between latitude and longitude and what is their affect on local and world weather and climate?") www.discoveryeducation.com 1) Describe the difference between climate and weather citing an example of each. Describe how water (ocean, lake, river) has a local effect on weather and climate and provide
www.discoveryeducation.com 1) Describe the difference between climate and weather citing an example of each. Describe how water (ocean, lake, river) has a local effect on weather and climate and provide
The relationship between catchment characteristics and the parameters of a conceptual runoff model: a study in the south of Sweden
 FRIEND: Flow Regimes from International Experimental and Network Data (Proceedings of the Braunschweie _ Conference, October 1993). IAHS Publ. no. 221, 1994. 475 The relationship between catchment characteristics
San Francisco Public Utilities Commission Hydrological Conditions Report For April 2014
 San Francisco Public Utilities Commission Hydrological Conditions Report For April 2014 J. Chester, C. Graham, A. Mazurkiewicz, & M. Tsang, May 13, 2014 Snow in the High Country The view from Bond Pass
2015 Fall Conditions Report
 2015 Fall Conditions Report Prepared by: Hydrologic Forecast Centre Date: December 21 st, 2015 Table of Contents Table of Figures... ii EXECUTIVE SUMMARY... 1 BACKGROUND... 2 SUMMER AND FALL PRECIPITATION...
Impact of climate change on freshwater resources in the Changjiang river basin
 Impact of climate change on freshwater resources in the Changjiang river basin Wenfa Yang, Yan Huang Bureau of Hydrology, Changjiang Water Resources Commission, MWR, China April,2009 Objective To identify
IMPACT OF CLIMATE CHANGE OVER THE ARABIAN PENINSULA
 IMPACT OF CLIMATE CHANGE OVER THE ARABIAN PENINSULA By: Talal Alharbi June, 29 2017 1 Motivation: In arid and semi-arid regions of the world the demand for fresh water resources is increasing due to: increasing
Tracking the Climate Of Northern Colorado Nolan Doesken State Climatologist Colorado Climate Center Colorado State University
 Tracking the Climate Of Northern Colorado Nolan Doesken State Climatologist Colorado Climate Center Colorado State University Northern Colorado Business Innovations November 20, 2013 Loveland, Colorado
Analysis of Radar-Rainfall Uncertainties and effects on Hydrologic Applications. Emad Habib, Ph.D., P.E. University of Louisiana at Lafayette
 Analysis of Radar-Rainfall Uncertainties and effects on Hydrologic Applications Emad Habib, Ph.D., P.E. University of Louisiana at Lafayette Motivation Rainfall is a process with significant variability
Inflow forecasting for lakes using Artificial Neural Networks
 Flood Recovery Innovation and Response III 143 Inflow forecasting for lakes using Artificial Neural Networks R. K. Suryawanshi 1, S. S. Gedam 1 & R. N. Sankhua 2 1 CSRE, IIT Bombay, Mumbai, India 2 National
Study of Hydrometeorology in a Hard Rock Terrain, Kadirischist Belt Area, Anantapur District, Andhra Pradesh
 Open Journal of Geology, 2012, 2, 294-300 http://dx.doi.org/10.4236/ojg.2012.24028 Published Online October 2012 (http://www.scirp.org/journal/ojg) Study of Hydrometeorology in a Hard Rock Terrain, Kadirischist
Science Standard 1: Students analyze monthly precipitation and temperature records, displayed in bar charts, collected in metric units (mm).
.") Title: Precipitation Patterns across the Globe NSF GK-12 Fellow: Terry Legg Type of Lesson: STEM Grade Level(s): 4 th - 7 th grade This activity can be tailored to older, more advanced students by having
Title: Precipitation Patterns across the Globe NSF GK-12 Fellow: Terry Legg Type of Lesson: STEM Grade Level(s): 4 th - 7 th grade This activity can be tailored to older, more advanced students by having
APPENDIX B Hydrologic Model Spring Event
 Jock River Flood Risk Mapping (within the City of Ottawa) Hydrology Report July 2004 PageB1 APPENDIX B Hydrologic Model Spring Event Snowmelt+Rainfall Calibration and Validation Results Design Events Explanation
LOCAL CLIMATOLOGICAL DATA Monthly Summary November 2006
 Deg. Days Precip Ty Precip Wind Sun Hu- Adj. to Sea Level mid- ity Avg Res Res Peak Minute 1 fog 2 hvy fog 3 thunder 4 ice plt 5 hail 6 glaze 7 duststm 8 smk, hz 9 blw snw 1 2 3 4A 4B 5 6 7 8 9 12 14 15
The Climate of Payne County
 The Climate of Payne County Payne County is part of the Central Great Plains in the west, encompassing some of the best agricultural land in Oklahoma. Payne County is also part of the Crosstimbers in the
San Francisco Public Utilities Commission Hydrological Conditions Report For March 2016
 San Francisco Public Utilities Commission Hydrological Conditions Report For March 2016 J. Chester, C. Graham, A. Mazurkiewicz, & M. Tsang, April 7, 2016 Snow Surveyor Chris Graham crossing Huckleberry
Climate Variability. Eric Salathé. Climate Impacts Group & Department of Atmospheric Sciences University of Washington. Thanks to Nathan Mantua
 Climate Variability Eric Salathé Climate Impacts Group & Department of Atmospheric Sciences University of Washington Thanks to Nathan Mantua Northwest Climate: the mean Factors that influence local/regional
Assessing methods to disaggregate daily precipitation for hydrological simulation
 Assessing methods to disaggregate daily precipitation for hydrological simulation Peng Gao, Gregory Carbone, Daniel Tufford, Aashka Patel, and Lauren Rouen Department of Geography University of South Carolina
P2.1 DIRECT OBSERVATION OF THE EVAPORATION OF INTERCEPTED WATER OVER AN OLD-GROWTH FOREST IN THE EASTERN AMAZON REGION
 P2.1 DIRECT OBSERVATION OF THE EVAPORATION OF INTERCEPTED WATER OVER AN OLD-GROWTH FOREST IN THE EASTERN AMAZON REGION Matthew J. Czikowsky (1)*, David R. Fitzjarrald (1), Osvaldo L. L. Moraes (2), Ricardo
Estimating the Spatial Variability of Weather in Mountain Environments
 Estimating the Spatial Variability of Weather in Mountain Environments C. Baigorria 1, W. Bowen 2, and j. Stoorvogel Models of crop and soil systems are useful tools for understanding the complexity of
Rainfall Observations in the Loxahatchee River Watershed
 Rainfall Observations in the Loxahatchee River Watershed Richard C. Dent Loxahatchee River District September 1997 Introduction Rain is a common occurrence in south Florida, yet its presence or absence
Rainfall Analysis in Mumbai using Gumbel s Extreme Value Distribution Model
 Rainfall Analysis in Mumbai using Gumbel s Extreme Value Distribution Model S. Sangita Mishra 1, M. Solapure 2, R. Satpathy 3, K. Phadtare 4, S. Pawar 5 1 Assistant Professor, 2,3,4,5 Undergraduate students
Temperature (T) degrees Celsius ( o C) arbitrary scale from 0 o C at melting point of ice to 100 o C at boiling point of water Also (Kelvin, K) = o C
 degrees Celsius ( o C) arbitrary scale from 0 o C at melting point of ice to 100 o C at boiling point of water Also (Kelvin, K) = o C") 1 2 3 4 Temperature (T) degrees Celsius ( o C) arbitrary scale from 0 o C at melting point of ice to 100 o C at boiling point of water Also (Kelvin, K) = o C plus 273.15 0 K is absolute zero, the minimum
1 2 3 4 Temperature (T) degrees Celsius ( o C) arbitrary scale from 0 o C at melting point of ice to 100 o C at boiling point of water Also (Kelvin, K) = o C plus 273.15 0 K is absolute zero, the minimum
Rainfall-runoff modelling using merged rainfall from radar and raingauge measurements
 Rainfall-runoff modelling using merged rainfall from radar and raingauge measurements Nergui Nanding, Miguel Angel Rico-Ramirez and Dawei Han Department of Civil Engineering, University of Bristol Queens
Type of Precipitation
 Precipitation Type of Precipitation Measurement of rainfall Location of rain gauges Categorisation Climate Estimation of basin rainfall Finding Average rainfall, Standard deviation, and Coefficient of
Global Climates. Name Date
 Global Climates Name Date No investigation of the atmosphere is complete without examining the global distribution of the major atmospheric elements and the impact that humans have on weather and climate.
Development of Pakistan s New Area Weighted Rainfall Using Thiessen Polygon Method
 Pakistan Journal of Meteorology Vol. 9, Issue 17: July 2012 Technical Note Development of Pakistan s New Area Weighted Rainfall Using Thiessen Polygon Method Faisal, N. 1, 2, A. Gaffar 2 ABSTRACT In this
Snow Melt with the Land Climate Boundary Condition
 Snow Melt with the Land Climate Boundary Condition GEO-SLOPE International Ltd. www.geo-slope.com 1200, 700-6th Ave SW, Calgary, AB, Canada T2P 0T8 Main: +1 403 269 2002 Fax: +1 888 463 2239 Introduction