NIDIS Intermountain West Drought Early Warning System February 6, 2018
|
|
|
- Daisy Leonard
- 5 years ago
- Views:
Transcription


1 NIDIS Intermountain West Drought Early Warning System February 6, 2018 Precipitation The images above use daily precipitation statistics from NWS COOP, CoCoRaHS, and CoAgMet stations. From top to bottom, and left to right: most recent 7-days of accumulated precipitation in inches; current month-to-date accumulated precipitation in inches; last month's precipitation as a percent of average; water-year-to-date precipitation as a percent of average. Standardized Precipitation Index Page 1 of 14
2 Standardized Precipitation Index standardizes precipitation accumulations for a specified time period into percentile rankings to -1.5 is equivalent to a D1 to D to -2.0 is equivalent to a D2 to D and worse is equivalent to a D3 to D and 60-day SPIs focus on short-term conditions while 6- and 9-month SPIs focus on long-term conditions. SPI data provided by High Plains Regional Climate Center. Snotel and Snowpack Page 2 of 14
3 The above image shows sub-basin averaged snow water equivalent accumulations as a percent of average. The images below show accumulated snow water equivalent in inches (green) compared to average (blue) and last year (red) for several different sub-basins across the UCRB (and were created by the Colorado Basin River Forecast Center). Streamflow Page 3 of 14

4 Page 4 of 14


.")
.")
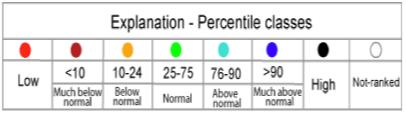
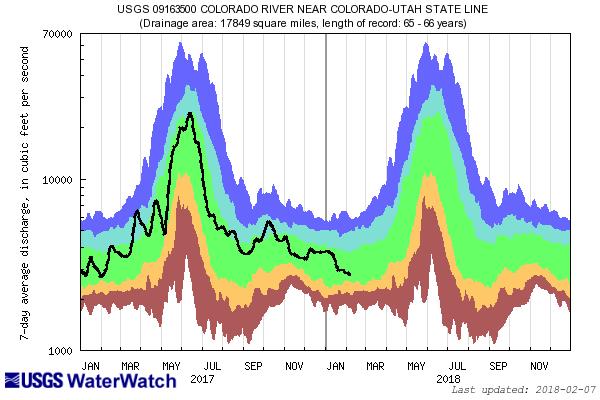
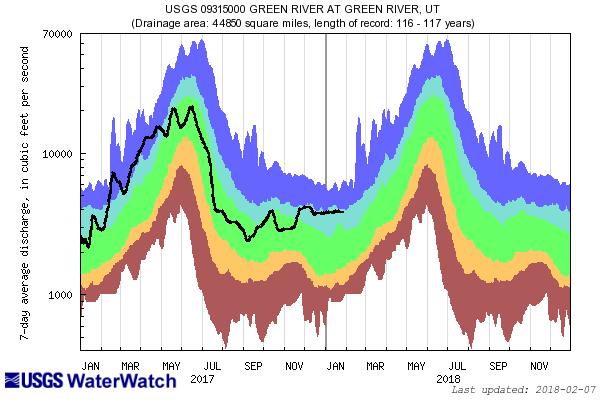
5 The top left image shows 7-day averaged streamflows as a percentile ranking across the UCRB. The top right image shows 7-day averaged discharge over time at three key sites around the UCRB: The Colorado River at the CO-UT state line; the Green River at Green River, UT; and the San Juan River near Bluff, UT. All streamflow data provided by United States Geological Survey. Surface Water The top left image shows VIC modeled soil moisture as a percentile ranking. The top right image shows satellite-derived vegetation from the VegDRI product (which updates on Mondays). The graphs shown below are plots of reservoir volumes over the past full year and current year to date (black). The dashed line at the top of each graphic indicates the reservoir's capacity, and the background color-coded shading provides context for the range of reservoir Page 5 of 14


6 levels observed over the past 30 years. The data are obtained from the Bureau of Reclamation. Some of the reservoir percentiles don't line up at the new year due to differences in reservoir levels at the beginning of 1985 and the end of Dead storage has been subtracted. Note: Lake Granby data are obtained from the Colorado Division of Water Resources, and only goes back to the year Evaporative Demand Page 6 of 14

 project, which assimilates observations of temperature, wind speed, radiation, and vapor")
7 The above images are available courtesy of NOAA s Evaporative Demand Drought Index (EDDI). Drought classification listed is a function of the depth of reference evapotranspiration accumulated over a given period of record with respect to a climatology of The drought categories displayed are in line with the US Drought Monitor's Percentile Ranking Scheme. Data used to generate these maps come from the North American Land Data Assimilation System Phase-2 (NLDAS-2) project, which assimilates observations of temperature, wind speed, radiation, and vapor pressure deficit. The date indicates the last day of the period of record, and the week number indicates the window size for the period of record. Temperature All images show temperature departures from average over different time periods (last 7 days on top left; month-to-date on top right; last full month on bottom). Temperature departure maps provided by HPRCC ACIS. Page 7 of 14

8 Condition Monitoring and Impacts Map of current condition monitoring reports submitted to CoCoRaHS in the last week overlaid on the current U.S. Drought Monitor depiction. Specific impacts reports from local experts listed below. Page 8 of 14

9 Southwest CO Extension Winter season conditions are very bad. Winter wheat crops in the area look to be at a total loss. Grand Junction area Extension SNOTEL is not quite capturing how little snow there currently is at the mid-elevations. The highest ridges look fairly decent. Mid-elevation (around 9,000 ft) are in very poor condition, with little to no snow. Northeast CO Extension Winter wheat looks pretty good. Southeat CO Extension While conditions are not good right now, it doesn't sound as bad as the southwest or the San Luis Valley portions of the state. Outlook Page 9 of 14


10 The top two images show Climate Prediction Center's Precipitation and Temperature outlooks for 8-14 days. The middle image shows the Weather Prediction Center's Quantitative Precipitation Forecast accumulation for seven days. The bottom left image shows the 3-month precipitation outlook from Climate Prediction Center, and the bottom right image shows the Climate Prediction Center's most recent release of the U.S. Seasonal Drought Outlook. > Summary and Recommendations Page 10 of 14

11 Above is the most recent release of the U.S. Drought Monitor map for the UCRB region. Below shows the proposed changes for this week, with supporting text. Page 11 of 14
12 Summary: February 6, 2018 Last week brought a continuation of the dominant cold season La Niña pattern to the Intermountain West (IMW) where the northern mountains were favored with precipitation and the southern mountains missed out. The northeast plains also received beneficial moisture last week, while the southeast plains received very little to no precipitation. February has brought much above average temperatures to most of the IMW, with more seasonal temperatures along the eastern plains. Snowpack throughout the IMW continues to show a north-south, as well as elevational, gradient. In western WY, snowpack is in good condition, and it is probable that the region will see near average peak snowpack. In the northern mountains of CO, it's a little bit less than average, but there is still a chance (with a couple very good accumulating events) that they could Page 12 of 14
13 recover and get near average peak snowpack in the spring. The southern mountains of CO and into NM, and the UT mountains are much below average. The highest elevations are faring better, but for many of the midelevation locations, the ground is bare and the chances of making up the seasonal snowpack deficits are minimal. Water supplies remain in good condition, thanks to previous wetter water years. Most other indicators point to short-term, and moving into long-term, drought conditions. As spring approaches, we can expect to see streamflow percentiles decrease to drought levels, and soil moisture percentiles will also begin to reflect those dry conditions. The short-term outlook shows that below average precipitation is likely for the IMW, and that warmer than average temperatures are likely to continue. The seasonal outlook (going into the spring) also shows that most of the region has an increased likelihood of warmer and drier than average conditions. If these outlooks verify, we would likely see the expansion of D3 drought in the southern portion of the IMW, with an introduction of D3 drought imminent for the Four Corners region and along the CO/NM border. Recommendations UCRB: Status quo is recommended. The current U.S. Drought Monitor author has slightly tweaked the D1 and D2 lines in western CO. Further changes are not recommended at this time. This region is being closely monitored for possible future degradations. While many indicators (3-month and 6-month SPI, snowpack, EDDI, impacts) point to D3 or worse conditions, we are still in the midst of the big accumulating snow season. How storms pan out over the next couple of weeks will be very telling of what the spring holds for us. Near average storms would not allow for any improvements. Below average accumulating events or no accumulating events would likely mean we'll begin pushing for introduction of D3 around the Four Corners, into the San Juan Mountains, possibly into the San Luis Valley and along the Sangre de Cristo mountains. For now, we're taking a "wait and see" approach. Eastern Colorado: A slight improvement from D1 to D0 is recommended in northeast CO (green shape). In this region, 3-month SPIs still show slightly negative, but the 6-month SPIs are in good condition. January precipitation was near to slightly above average, and the last week brought a half to 1 inch of moisture to the area. Extension in the area has reported that the winter wheat looks to be in good condition. This recommendation could impact the D1 depiction in parts of Nebraska and Kansas, so we leave that to other local experts and to the USDM author. The USDM author also slightly expanded D2 in southeast CO. We are in support of this change, but we want to emphasize that we recommend Page 13 of 14
14 holding off on any D3 expansion into southeast CO at this time. Conditions to the west are much worse, so we likely won't recommend or support any D3 in southeast CO before an introduction of D3 to the west has occurred (barring any big surprises over the next couple of weeks). Page 14 of 14
NIDIS Intermountain West Drought Early Warning System November 14, 2017
 NIDIS Intermountain West Drought Early Warning System November 14, 2017 Precipitation The images above use daily precipitation statistics from NWS COOP, CoCoRaHS, and CoAgMet stations. From top to bottom,
NIDIS Intermountain West Drought Early Warning System April 16, 2019
 NIDIS Intermountain West Drought Early Warning System April 16, 2019 Precipitation The images above use daily precipitation statistics from NWS COOP, CoCoRaHS, and CoAgMet stations. From top to bottom,
NIDIS Intermountain West Drought Early Warning System January 15, 2019
 NIDIS Drought and Water Assessment NIDIS Intermountain West Drought Early Warning System January 15, 2019 Precipitation The images above use daily precipitation statistics from NWS COOP, CoCoRaHS, and
NIDIS Intermountain West Drought Early Warning System December 11, 2018
 NIDIS Drought and Water Assessment NIDIS Intermountain West Drought Early Warning System December 11, 2018 Precipitation The images above use daily precipitation statistics from NWS COOP, CoCoRaHS, and
NIDIS Intermountain West Drought Early Warning System February 19, 2019
 NIDIS Intermountain West Drought Early Warning System February 19, 2019 Precipitation The images above use daily precipitation statistics from NWS COOP, CoCoRaHS, and CoAgMet stations. From top to bottom,
NIDIS Intermountain West Drought Early Warning System January 22, 2019
 NIDIS Drought and Water Assessment NIDIS Intermountain West Drought Early Warning System January 22, 2019 Precipitation The images above use daily precipitation statistics from NWS COOP, CoCoRaHS, and
NIDIS Intermountain West Regional Drought Early Warning System February 7, 2017
 NIDIS Drought and Water Assessment NIDIS Intermountain West Regional Drought Early Warning System February 7, 2017 Precipitation The images above use daily precipitation statistics from NWS COOP, CoCoRaHS,
NIDIS Intermountain West Drought Early Warning System December 18, 2018
 NIDIS Intermountain West Drought Early Warning System December 18, 2018 Precipitation The images above use daily precipitation statistics from NWS COOP, CoCoRaHS, and CoAgMet stations. From top to bottom,
NIDIS Intermountain West Drought Early Warning System November 21, 2017
 NIDIS Drought and Water Assessment NIDIS Intermountain West Drought Early Warning System November 21, 2017 Precipitation The images above use daily precipitation statistics from NWS COOP, CoCoRaHS, and
NIDIS Intermountain West Drought Early Warning System February 12, 2019
 NIDIS Intermountain West Drought Early Warning System February 12, 2019 Precipitation The images above use daily precipitation statistics from NWS COOP, CoCoRaHS, and CoAgMet stations. From top to bottom,
NIDIS Intermountain West Drought Early Warning System September 4, 2018
 NIDIS Drought and Water Assessment NIDIS Intermountain West Drought Early Warning System September 4, 2018 Precipitation The images above use daily precipitation statistics from NWS COOP, CoCoRaHS, and
NIDIS Intermountain West Drought Early Warning System January 16, 2018
 NIDIS Drought and Water Assessment NIDIS Intermountain West Drought Early Warning System January 16, 2018 Precipitation The images above use daily precipitation statistics from NWS COOP, CoCoRaHS, and
NIDIS Intermountain West Drought Early Warning System May 23, 2017
 NIDIS Drought and Water Assessment NIDIS Intermountain West Drought Early Warning System May 23, 2017 Precipitation The images above use daily precipitation statistics from NWS COOP, CoCoRaHS, and CoAgMet
NIDIS Intermountain West Drought Early Warning System November 13, 2018
 NIDIS Intermountain West Drought Early Warning System November 13, 2018 Precipitation The images above use daily precipitation statistics from NWS COOP, CoCoRaHS, and CoAgMet stations. From top to bottom,
NIDIS Intermountain West Drought Early Warning System December 30, 2018
 1/2/2019 NIDIS Drought and Water Assessment NIDIS Intermountain West Drought Early Warning System December 30, 2018 Precipitation The images above use daily precipitation statistics from NWS COOP, CoCoRaHS,
NIDIS Intermountain West Drought Early Warning System October 17, 2017
 NIDIS Drought and Water Assessment NIDIS Intermountain West Drought Early Warning System October 17, 2017 Precipitation The images above use daily precipitation statistics from NWS COOP, CoCoRaHS, and
Precipitation. Standardized Precipitation Index. NIDIS Intermountain West Regional Drought Early Warning System January 3, 2017
 1/3/2017 NIDIS Drought and Water Assessment NIDIS Intermountain West Regional Drought Early Warning System January 3, 2017 Precipitation The images above use daily precipitation statistics from NWS COOP,
NIDIS Intermountain West Drought Early Warning System August 8, 2017
 NIDIS Drought and Water Assessment 8/8/17, 4:43 PM NIDIS Intermountain West Drought Early Warning System August 8, 2017 Precipitation The images above use daily precipitation statistics from NWS COOP,
NIDIS Intermountain West Drought Early Warning System July 18, 2017
 NIDIS Drought and Water Assessment NIDIS Intermountain West Drought Early Warning System July 18, 2017 Precipitation The images above use daily precipitation statistics from NWS COOP, CoCoRaHS, and CoAgMet
NIDIS Intermountain West Drought Early Warning System March 26, 2019
 NIDIS Intermountain West Drought Early Warning System March 26, 2019 The images above use daily precipitation statistics from NWS COOP, CoCoRaHS, and CoAgMet stations. From top to bottom, and left to right:
NIDIS Intermountain West Drought Early Warning System October 30, 2018
 10/30/2018 NIDIS Drought and Water Assessment NIDIS Intermountain West Drought Early Warning System October 30, 2018 Precipitation The images above use daily precipitation statistics from NWS COOP, CoCoRaHS,
NIDIS Intermountain West Drought Early Warning System May 1, 2018
 NIDIS Intermountain West Drought Early Warning System May 1, 2018 Precipitation The images above use daily precipitation statistics from NWS COOP, CoCoRaHS, and CoAgMet stations. From top to bottom, and
NIDIS Intermountain West Drought Early Warning System April 18, 2017
 1 of 11 4/18/2017 3:42 PM Precipitation NIDIS Intermountain West Drought Early Warning System April 18, 2017 The images above use daily precipitation statistics from NWS COOP, CoCoRaHS, and CoAgMet stations.
NIDIS Intermountain West Drought Early Warning System December 4, 2018
 12/4/2018 NIDIS Drought and Water Assessment NIDIS Intermountain West Drought Early Warning System December 4, 2018 Precipitation The images above use daily precipitation statistics from NWS COOP, CoCoRaHS,
Precipitation. Standardized Precipitation Index. NIDIS Intermountain West Regional Drought Early Warning System December 6, 2016
 12/9/2016 NIDIS Drought and Water Assessment NIDIS Intermountain West Regional Drought Early Warning System December 6, 2016 Precipitation The images above use daily precipitation statistics from NWS COOP,
Precipitation. Standardized Precipitation Index. NIDIS Intermountain West Drought Early Warning System September 5, 2017
 9/6/2017 NIDIS Drought and Water Assessment NIDIS Intermountain West Drought Early Warning System September 5, 2017 Precipitation The images above use daily precipitation statistics from NWS COOP, CoCoRaHS,
NIDIS Intermountain West Drought Early Warning System April 24, 2018
 NIDIS Intermountain West Drought Early Warning System April 24, 2018 Precipitation The images above use daily precipitation statistics from NWS COOP, CoCoRaHS, and CoAgMet stations. From top to bottom,
NIDIS Drought and Water Assessment
 NIDIS Drought and Water Assessment PRECIPITATION The images above use daily precipitation statistics from NWS COOP, CoCoRaHS, and CoAgMet stations. From top to bottom, and left to right: most recent 7-days
PRECIPITATION. Last Week Precipitation:
 12/3/2014 NIDIS Drought and Water Assessment PRECIPITATION The images above use daily precipitation statistics from NWS COOP, CoCoRaHS, and CoAgMet stations. From top to bottom, and left to right: most
NIDIS Drought and Water Assessment
 7/23/13 1:57 PM PRECIPITATION The images above use daily precipitation statistics from NWS COOP, CoCoRaHS, and CoAgMet stations. From top to bottom, and left to right: most recent 7-days of accumulated
PRECIPITATION. Last Week Precipitation:
 2/24/2015 NIDIS Drought and Water Assessment PRECIPITATION The images above use daily precipitation statistics from NWS COOP, CoCoRaHS, and CoAgMet stations. From top to bottom, and left to right: most
-Assessment of current water conditions. - Precipitation Forecast. - Recommendations for Drought Monitor
 2 May 1 st, 2012 -Assessment of current water conditions - Precipitation Forecast - Recommendations for Drought Monitor AHPS Water Year Precipitation as Percentage of Normal 7-day average
Webinar and Weekly Summary February 15th, 2011
 Webinar and Weekly Summary February 15th, 2011 -Assessment of current water conditions - Precipitation Forecast - Recommendations for Drought Monitor Upper Colorado Normal Precipitation Upper Colorado
PRECIPITATION. Last Week Precipitation:
 3/30/2016 NIDIS Drought and Water Assessment PRECIPITATION The images above use daily precipitation statistics from NWS COOP, CoCoRaHS, and CoAgMet stations. From top to bottom, and left to right: most
PRECIPITATION. Last Week Precipitation:
 PRECIPITATION The images above use daily precipitation statistics from NWS COOP, CoCoRaHS, and CoAgMet stations. From top to bottom, and left to right: most recent 7-days of accumulated precipitation in
NIDIS Weekly Climate, Water and Drought Assessment Summary. Upper Colorado River Basin
 NIDIS Weekly Climate, Water and Drought Assessment Summary Upper Colorado River Basin August 3, 2010 Precipitation and Snowpack Fig. 1: July precipitation in inches Fig. 2: July precip as percent of average
 October 16 th, 2012 2010-12 La Niña event reached its biggest peak since the mid-70s in late 2010, followed by a brief excursion to ENSOneutral conditions during mid-2011; it reached a second peak last
NIDIS Weekly Climate, Water and Drought Assessment Summary. Upper Colorado River Basin July 31, 2012
 NIDIS Weekly Climate, Water and Drought Assessment Summary Upper Colorado River Basin July 31, 2012 Fig. 1: July month-to-date precipitation in inches. Fig. 2: SNOTEL WYTD precipitation percentiles (50%
PRECIPITATION. Last Week Precipitation:
 7/23/2014 NIDIS Drought and Water Assessment PRECIPITATION The images above use daily precipitation statistics from NWS COOP, CoCoRaHS, and CoAgMet stations. From top to bottom, and left to right: most
PRECIPITATION. Last Week Precipitation:
 12/30/2014 NIDIS Drought and Water Assessment PRECIPITATION The images above use daily precipitation statistics from NWS COOP, CoCoRaHS, and CoAgMet stations. From top to bottom, and left to right: most
-Assessment of current water conditions. - Precipitation Forecast. - Recommendations for Drought Monitor
 2 June 26 th, 2012 -Assessment of current water conditions - Precipitation Forecast - Recommendations for Drought Monitor CMPDSI Value Percentile Rank Characteristic -1.0 - -1.9 21-30 Abnormally
PRECIPITATION. Last Week Precipitation:
 12/1/2015 NIDIS Drought and Water Assessment PRECIPITATION The images above use daily precipitation statistics from NWS COOP, CoCoRaHS, and CoAgMet stations. From top to bottom, and left to right: most
-Assessment of current water conditions. - Precipitation Forecast. - Recommendations for Drought Monitor
 2 May 8 th, 2012 -Assessment of current water conditions - Precipitation Forecast - Recommendations for Drought Monitor AHPS Analysis 5/7/12 7-day average discharge compared to historical
NIDIS Weekly Climate, Water and Drought Assessment Summary. Upper Colorado River Basin February 28, 2012
 NIDIS Weekly Climate, Water and Drought Assessment Summary Upper Colorado River Basin February 28, 2012 PrecipitaGon and Snowpack Fig. 1: February month- to- date precipitagon in inches. Fig. 2: February
-Assessment of current water conditions. - Precipitation Forecast. - Recommendations for Drought Monitor
 May 31 st, 2011 -Assessment of current water conditions - Precipitation Forecast - Recommendations for Drought Monitor Upper Colorado River Basin Snow Snowpack % of average to date: 347% Percent
NIDIS Weekly Climate, Water and Drought Assessment Summary. Upper Colorado River Basin February 12, 2013
 NIDIS Weekly Climate, Water and Drought Assessment Summary Upper Colorado River Basin February 12, 2013 Fig. 1: January precipitagon as a percent of average. Fig. 2: February 1 9 precipitagon in inches.
-Assessment of current water conditions. - Precipitation Forecast. - Recommendations for Drought Monitor
 2 June 12, 2012 -Assessment of current water conditions - Precipitation Forecast - Recommendations for Drought Monitor 7-day average discharge compared to historical discharge for the day
PRECIPITATION. Last Week Precipitation:
 PRECIPITATION The images above use daily precipitation statistics from NWS COOP, CoCoRaHS, and CoAgMet stations. From top to bottom, and left to right: most recent 7-days of accumulated precipitation in
NIDIS Weekly Climate, Water and Drought Assessment Summary. Upper Colorado River Basin June 28, 2011
 NIDIS Weekly Climate, Water and Drought Assessment Summary Upper Colorado River Basin June 28, 2011 PrecipitaFon and Snowpack Fig. 1: June month to date precipitafon in inches. Fig. 2: June 19 25 precipitafon
NIDIS Drought and Water Assessment
 NIDIS Drought and Water Assessment PRECIPITATION The images above use daily precipitation statistics from NWS COOP, CoCoRaHS, and CoAgMet stations. From top to bottom, and left to right: most recent 7-days
PRECIPITATION. Last Week Precipitation:
 5/19/2015 NIDIS Drought and Water Assessment PRECIPITATION The images above use daily precipitation statistics from NWS COOP, CoCoRaHS, and CoAgMet stations. From top to bottom, and left to right: most
NIDIS Weekly Climate, Water and Drought Assessment Summary. Upper Colorado River Basin September 20, 2011
 NIDIS Weekly Climate, Water and Drought Assessment Summary Upper Colorado River Basin September 20, 2011 PrecipitaEon and Snowpack Fig. 1: September month to date precipitaeon in inches. Fig. 2: September
NIDIS Weekly Climate, Water and Drought Assessment Summary. Upper Colorado River Basin September 27, 2011
 NIDIS Weekly Climate, Water and Drought Assessment Summary Upper Colorado River Basin September 27, 2011 PrecipitaFon and Snowpack Fig. 1: Water year to date precipitafon as a percent of average. Fig.
NIDIS Weekly Climate, Water and Drought Assessment Summary Upper Colorado River Basin Pilot Project 13 July 2010
 NIDIS Weekly Climate, Water and Drought Assessment Summary Upper Colorado River Basin Pilot Project 13 July 2010 Precipitation and Snowpack Over the past week, precipitation in the Upper Colorado River
NIDIS Weekly Climate, Water and Drought Assessment Summary. Upper Colorado River Basin January 3, 2012
 NIDIS Weekly Climate, Water and Drought Assessment Summary Upper Colorado River Basin January 3, 2012 PrecipitaFon and Snowpack Fig. 1: December precipitafon as a percent of average. Fig. 2: December 25
NIDIS Weekly Climate, Water and Drought Assessment Summary. Upper Colorado River Basin June 21, 2011
 NIDIS Weekly Climate, Water and Drought Assessment Summary Upper Colorado River Basin June 21, 2011 PrecipitaEon and Snowpack Fig. 1: June month to date precipitaeon in inches. Fig. 2: 24 hour accumulated
NIDIS Weekly Climate, Water and Drought Assessment Summary. Upper Colorado River Basin May 31, 2011
 NIDIS Weekly Climate, Water and Drought Assessment Summary Upper Colorado River Basin May 31, 2011 PrecipitaFon and Snowpack Fig. 1: May month to date precipitafon in inches. Fig. 2: May 22 28 precipitafon
NIDIS Weekly Climate, Water and Drought Assessment Summary. Upper Colorado River Basin May 29, 2012
 NIDIS Weekly Climate, Water and Drought Assessment Summary Upper Colorado River Basin May 29, 2012 PrecipitaFon and Snowpack Fig. 1: May 1 19 precipitafon in inches. Fig. 2: May 20 27 precipitafon in inches.
PRECIPITATION. Last Week Precipitation:
 1/28/2015 NIDIS Drought and Water Assessment PRECIPITATION The images above use daily precipitation statistics from NWS COOP, CoCoRaHS, and CoAgMet stations. From top to bottom, and left to right: most
NIDIS Weekly Climate, Water and Drought Assessment Summary. Upper Colorado River Basin July 12, 2011
 NIDIS Weekly Climate, Water and Drought Assessment Summary Upper Colorado River Basin July 12, 2011 PrecipitaEon and Snowpack Fig. 1: October June precipitaeon as a percent of average. Fig. 2: July month
PRECIPITATION. Last Week Precipitation:
 9/9/2015 NIDIS Drought and Water Assessment PRECIPITATION The images above use daily precipitation statistics from NWS COOP, CoCoRaHS, and CoAgMet stations. From top to bottom, and left to right: most
NIDIS Weekly Climate, Water and Drought Assessment Summary. Upper Colorado River Basin June 26, 2012
 NIDIS Weekly Climate, Water and Drought Assessment Summary Upper Colorado River Basin June 26, 2012 Fig. 1: June 17 23 precipitafon in inches. Fig. 2: SNOTEL WYTD precipitafon percenfles (50% is median,
PRECIPITATION. Last Week Precipitation:
 7/14/2015 NIDIS Drought and Water Assessment PRECIPITATION The images above use daily precipitation statistics from NWS COOP, CoCoRaHS, and CoAgMet stations. From top to bottom, and left to right: most
PRECIPITATION. Last Week Precipitation:
 4/28/2015 NIDIS Drought and Water Assessment PRECIPITATION The images above use daily precipitation statistics from NWS COOP, CoCoRaHS, and CoAgMet stations. From top to bottom, and left to right: most
PRECIPITATION. Last Week Precipitation:
 6/23/2015 NIDIS Drought and Water Assessment PRECIPITATION The images above use daily precipitation statistics from NWS COOP, CoCoRaHS, and CoAgMet stations. From top to bottom, and left to right: most
NIDIS Weekly Climate, Water and Drought Assessment Summary. Upper Colorado River Basin November 22, 2011
 NIDIS Weekly Climate, Water and Drought Assessment Summary Upper Colorado River Basin November 22, 2011 PrecipitaEon and Snowpack Fig. 1: November month to date precipitaeon in inches. Fig. 2: November
PRECIPITATION. Last Week Precipitation:
 10/21/2015 NIDIS Drought and Water Assessment PRECIPITATION The images above use daily precipitation statistics from NWS COOP, CoCoRaHS, and CoAgMet stations. From top to bottom, and left to right: most
-Assessment of current water conditions. - Precipitation Forecast. - Recommendations for Drought Monitor
 June 1, 2010 -Assessment of current water conditions - Precipitation Forecast - Recommendations for Drought Monitor Snotel WYTD Precipitation as Percentage of Average Upper Colorado Headwaters 88% of
PRECIPITATION. Last Week Precipitation:
 9/29/2015 NIDIS Drought and Water Assessment PRECIPITATION The images above use daily precipitation statistics from NWS COOP, CoCoRaHS, and CoAgMet stations. From top to bottom, and left to right: most
-Assessment of current water conditions. - Precipitation Forecast. - Recommendations for Drought Monitor
 April 27, 2010 -Assessment of current water conditions - Precipitation Forecast - Recommendations for Drought Monitor 7 Day Precipitation 19-25 April 2010 Month-to-Date Precipitation 1-25 April 2010
Oregon Water Conditions Report May 1, 2017
 Oregon Water Conditions Report May 1, 2017 Mountain snowpack in the higher elevations has continued to increase over the last two weeks. Statewide, most low and mid elevation snow has melted so the basin
Upper Missouri River Basin December 2017 Calendar Year Runoff Forecast December 5, 2017
 Upper Missouri River Basin December 2017 Calendar Year Runoff Forecast December 5, 2017 Calendar Year Runoff Forecast Explanation and Purpose of Forecast U.S. Army Corps of Engineers, Northwestern Division
PRECIPITATION. Last Week Precipitation:
 8/11/2015 NIDIS Drought and Water Assessment PRECIPITATION The images above use daily precipitation statistics from NWS COOP, CoCoRaHS, and CoAgMet stations. From top to bottom, and left to right: most
Oregon Water Conditions Report April 17, 2017
 Oregon Water Conditions Report April 17, 2017 Mountain snowpack continues to maintain significant levels for mid-april. By late March, statewide snowpack had declined to 118 percent of normal after starting
-Assessment of current water conditions. - Precipitation Forecast. - Recommendations for Drought Monitor
 April 20 th, 2010 -Assessment of current water conditions - Precipitation Forecast - Recommendations for Drought Monitor 7 Day Precipitation 12-18 April 2010 Month-to-Date Precipitation 1-28 March 2010
NIDIS Weekly Climate, Water and Drought Assessment Summary. Upper Colorado River Basin July 26, 2011
 NIDIS Weekly Climate, Water and Drought Assessment Summary Upper Colorado River Basin July 26, 2011 PrecipitaFon and Snowpack Fig. 1: July month to date precipitafon in inches. Fig. 2: July 17 23 precipitafon
Weather and Climate Summary and Forecast February 2018 Report
 Weather and Climate Summary and Forecast February 2018 Report Gregory V. Jones Linfield College February 5, 2018 Summary: For the majority of the month of January the persistent ridge of high pressure
Becky Bolinger Water Availability Task Force November 13, 2018
 Colorado Climate Center WATF Climate Update Becky Bolinger Water Availability Task Force November 13, 2018 COLORADO CLIMATE CENTER Water Year 2018 Colorado s Climate in Review COLORADO CLIMATE CENTER
Weather and Climate Summary and Forecast April 2018 Report
 Weather and Climate Summary and Forecast April 2018 Report Gregory V. Jones Linfield College April 4, 2018 Summary: A near Miracle March played out bringing cooler and wetter conditions to the majority
January 2011 Calendar Year Runoff Forecast
 January 2011 Calendar Year Runoff Forecast 2010 Runoff Year Calendar Year 2010 was the third highest year of runoff in the Missouri River Basin above Sioux City with 38.8 MAF, behind 1978 and 1997 which
Weather and Climate Summary and Forecast March 2018 Report
 Weather and Climate Summary and Forecast March 2018 Report Gregory V. Jones Linfield College March 7, 2018 Summary: The ridge pattern that brought drier and warmer conditions from December through most
Wind River Indian Reservation and Surrounding Area Climate and Drought Summary
 Northern Arapaho Tribe Wind River Indian Reservation and Surrounding Area Climate and Drought Summary Winter Events & Spring Outlook 2015-2016 Winter Was Warm And Dry Winter was warm and dry for the Wind
Weather and Climate Summary and Forecast Winter
 Weather and Climate Summary and Forecast Winter 2016-17 Gregory V. Jones Southern Oregon University February 7, 2017 What a difference from last year at this time. Temperatures in January and February
Upper Missouri River Basin February 2018 Calendar Year Runoff Forecast February 6, 2018
 Upper Missouri River Basin February 2018 Calendar Year Runoff Forecast February 6, 2018 Calendar Year Runoff Forecast Explanation and Purpose of Forecast U.S. Army Corps of Engineers, Northwestern Division
Illinois Drought Update, December 1, 2005 DROUGHT RESPONSE TASK FORCE Illinois State Water Survey, Department of Natural Resources
 Illinois Drought Update, December 1, 2005 DROUGHT RESPONSE TASK FORCE Illinois State Water Survey, Department of Natural Resources For more drought information please go to http://www.sws.uiuc.edu/. SUMMARY.
Colorado CoCoRaHS. Colorado CoCoRaHS. December 2013 Volume 1, Issue 8 NOVEMBER PRECIPITATION NOVEMBER TEMPERATURES
 NOVEMBER PRECIPITATION The month of November brought a flip-flop in precipitation patterns to some areas compared to the previous month, especially for locations in the foothills north of I-70 and in south-central
Monthly Long Range Weather Commentary Issued: February 15, 2015 Steven A. Root, CCM, President/CEO
 Monthly Long Range Weather Commentary Issued: February 15, 2015 Steven A. Root, CCM, President/CEO sroot@weatherbank.com JANUARY 2015 Climate Highlights The Month in Review During January, the average
Weather and Climate Summary and Forecast January 2018 Report
 Weather and Climate Summary and Forecast January 2018 Report Gregory V. Jones Linfield College January 5, 2018 Summary: A persistent ridge of high pressure over the west in December produced strong inversions
The following information is provided for your use in describing climate and water supply conditions in the West as of April 1, 2003.
 Natural Resources Conservation Service National Water and Climate Center 101 SW Main Street, Suite 1600 Portland, OR 97204-3224 Date: April 8, 2003 Subject: April 1, 2003 Western Snowpack Conditions and
DK DM M EMORANDUM D ECEMBER 28, 2018 SUBJECT:
 TO: CC: FROM: SUBJECT: BOARD OF DIRECTORS M EMORANDUM D ECEMBER 28, 2018 ANDY MUELLER, GENERAL MANAGER DAVE DK KANZER, P.E. & DON MEYER, P.E. DK DM COLORADO RIVER BASIN WATER SUPPLY CONDITIONS UPDATE AND
Colorado s 2003 Moisture Outlook
 Colorado s 2003 Moisture Outlook Nolan Doesken and Roger Pielke, Sr. Colorado Climate Center Prepared by Tara Green and Odie Bliss http://climate.atmos.colostate.edu How we got into this drought! Fort
INVISIBLE WATER COSTS
 Every Drop Every Counts... Drop Counts... INVISIBLE WATER COSTS Corn - 108.1 gallons per pound How much water it takes to produce... Apple - 18.5 gallons to grow Beef - 1,581 gallons per pound Oats - 122.7
Upper Missouri River Basin January 2018 Calendar Year Runoff Forecast January 3, 2018
 Calendar Year Runoff Forecast Upper Missouri River Basin January 2018 Calendar Year Runoff Forecast January 3, 2018 Explanation and Purpose of Forecast U.S. Army Corps of Engineers, Northwestern Division
Colorado weather and climate update: a bit more than halfway through the water year (Or: What s going on with the weather?? )
") Colorado weather and climate update: a bit more than halfway through the water year (Or: What s going on with the weather?? ) Russ S. Schumacher Colorado State Climatologist Director, Colorado Climate
Colorado weather and climate update: a bit more than halfway through the water year (Or: What s going on with the weather?? ) Russ S. Schumacher Colorado State Climatologist Director, Colorado Climate
Weather and Climate Summary and Forecast December 2017 Report
 Weather and Climate Summary and Forecast December 2017 Report Gregory V. Jones Linfield College December 5, 2017 Summary: November was relatively cool and wet from central California throughout most of
Highlights of the 2006 Water Year in Colorado
 Highlights of the 2006 Water Year in Colorado Nolan Doesken, State Climatologist Atmospheric Science Department Colorado State University http://ccc.atmos.colostate.edu Presented to 61 st Annual Meeting
Wind River Indian Reservation and Surrounding Area Climate and Drought Summary
 Northern Arapaho Tribe Wind River Indian Reservation and Surrounding Area Climate and Drought Summary Summer Events & Fall Outlook 2015 Summer Was Near, Precipitation Was Highly Variable Across The Region
Climate Impacts to Southwest Water Sector. Dr. Dave DuBois New Mexico State Climatologist
 Climate Impacts to Southwest Water Sector Dr. Dave DuBois New Mexico State Climatologist Presented at EPA Extreme Events and Climate Adaptation Planning Workshop June 3, 2015 Water Year Precip. % of Average
A Review of the 2007 Water Year in Colorado
 A Review of the 2007 Water Year in Colorado Nolan Doesken Colorado Climate Center, CSU Mike Gillespie Snow Survey Division, USDA, NRCS Presented at the 28 th Annual AGU Hydrology Days, March 26, 2008,
Drought Update May 11, 2018
 Drought Update May 11, 2018 Current status After a record cold April, May has started with much warmer than normal temperatures. The statewide average temperature for the week ending on May 8th was 65.7