Enhancing indicators on urban public transport in combination with geostatistics
|
|
|
- Clarence Carson
- 5 years ago
- Views:
Transcription

1 Enhancing indicators on urban public transport in combination with geostatistics Hugo Poelman European Commission DG and Urban GIS team April 2015


 Copernicus")

 But: comparable")

2 Harmonised indicators on European cities? EU-OECD definition of cities Eurostat city statistics (Urban Audit) Copernicus Urban Atlas land use data EFGS GEOSTAT population grid (1 km²) But: comparable indicators on public transport in urban areas remain problematic
3 Aim of the analysis Develop comparable indicators on Access to public transport in urban areas Frequency and speed of urban public transport Using standardised data sources Referring to harmonised concepts City definitions Spatial distribution of population


4 Measuring access to public transport: input data Location of all public transport stops Timetables of services: 2 groups: bus and tram train and metro Population per building block based on: detailed population grids census tracts neighbourhood statistics plus disaggregation using land use data and/or imperviousness if needed

5 Timetables: General Transit Feed Specification model


6 Location of stops Bus and tram Train and metro Stockholm


7 Average stops an hour from 6:00 to 20:00 on a normal week day


8 Service areas around stops Stops near to each other are clustered stops at both sides of a street; bus stations sum of available departures per cluster Service areas 5 minutes walking distance for bus and tram 10 minutes for train and metro created using comprehensive street network, accessible to pedestrians
9 Frequency classes Number of departures per service area In overlapping areas: maximum value of the overlapping service areas Frequency classes of departures High: > 10 departures an hour Medium: more than 4 but less than 10 an hour Low: less than 4 an hour Null: no public transport stops within walking distance
10 Typology of frequency classes Very high High Medium Low Null Access to more than ten departures an hour for both medium- and high-speed modes Access to more than ten departures an hour for one mode, but not both Access to between four and ten departures an hour on one or both modes, but no access to more than ten departures and hour less than four departures an hour for one or both modes, but no access to more than four departures an hour No access within walking distance


11 Population distribution Urban Atlas: land use Population by block


12 Urban centre versus administrative city

13 Stockholm: areas and population by access to public transport and its frequency 844,000 1,135,000 1,542,000 2,042,000 inh. inh. inh. inh.

14
15


")
16 Population density, job density and typology of frequencies Population density (250x250 m cell size) Job density (workplace-based employment) (250x250 m cell size) Dublin Helsinki
17 Population distribution and number of departures in large cities* Y% of population has access to more than X departures an hour * cities: defined as urban centres
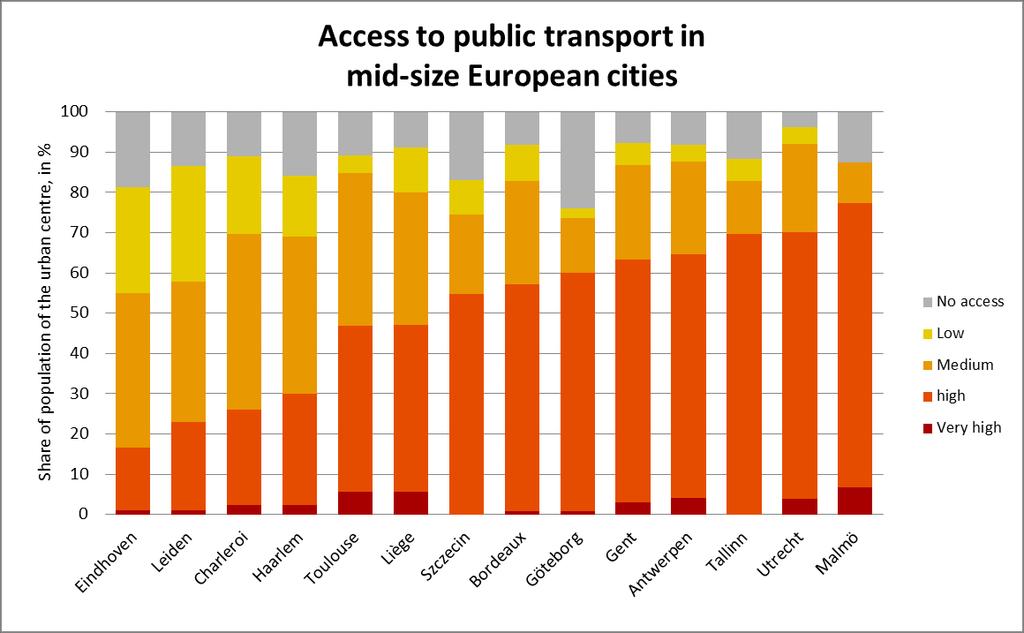
18 Population distribution and number of departures in mid-size cities* Y% of population has access to more than X departures an hour * cities: defined as urban centres

19 Median number of departures an hour Number of departures to which 50% of the urban population has easy access Varies between 7.4 and 28.3 departures in bigger cities Between 3.5 and 20.2 in medium-sized cities
20 Conclusion A harmonised way of assessing access to public transport and services' performance Gives an internationally comparable method of assessment Could also be used to develop regional indicators Uses quite big data: millions of departures, thousands of bus, tram, train and metro stops
21 Challenges Timeliness and spatial resolution of population distribution data Spatial distribution of employment data A more harmonised implementation of public transport data standards Documentation and conversion of data according to national standards Availability of open data (timetables), data licensing policy (Performance of) origin/destination modelling
22 Forthcoming analysis Measuring frequency and speed of the services (by mode) inside the cities Origin/destination modelling Assess connectivity between cities by rail
23 Sources Delineation of cities: EC-OECD city definition Population distribution: national statistical institutes, GEOSTAT 2006 grid Copernicus Urban Atlas 2006 land use data Road network: TomTom MultiNet Public transport data: BE: VVM De Lijn, STIB-MIVB, SRWT-TEC, NMBS-Infrabel; CZ (Praha): urban transport: DK: Rejseplanen.dk; EE: IE: dublinked.ie; FR: open data portals of cities/départements and of SNCF; IT (Torino): open data Torino; NL: OV-9292; PL (Szczecin): ZDITM; FI: HSL; SE: UK: Data.gov.uk (NapTAN and NPTDR); various cities: Die Bahn; station locations from EuroMap (EuroGeographics)
24 References Eurostat city statistics (Urban Audit): Copernicus Urban Atlas: European Forum for Geography and Statistics: Eurostat GEOSTAT project: Population estimates for the Urban Atlas polygons: qms_h08_intesa_deliverable_2_2_eur_26437.pdf Cities in Europe: the new OECD-EU definition: General Transit Feed Specification:

25 Questions?
Developing harmonised indicators on urban public transport in Europe
 Developing harmonised indicators on urban public transport in Europe Hugo Poelman European Commission DG Regional and Urban GIS team Regional May 2015 context EU Cohesion European Regional Development
How the science of cities can help European policy makers: new analysis and perspectives
 How the science of cities can help European policy makers: new analysis and perspectives By Lewis Dijkstra, PhD Deputy Head of the Economic Analysis Unit, DG Regional and European Commission Overview Data
Towards indicators of proximity to services in Europe's major cities
 Towards indicators of proximity to services in Europe's major cities Enhancing the analytical use of the GMES Urban Atlas in combination with population distribution data Hugo Poelman European Commission
A WALK TO THE PARK? ASSESSING ACCESS TO GREEN AREAS IN EUROPE'S CITIES
 Working Papers A series of short papers on regional research and indicators produced by the Directorate-General for Regional Policy WP 01/2016 A WALK TO THE PARK? ASSESSING ACCESS TO GREEN AREAS IN EUROPE'S
A WALK TO THE PARK? ASSESSING ACCESS TO GREEN AREAS IN EUROPE'S CITIES
 A WALK TO THE PARK? ASSESSING ACCESS TO GREEN AREAS IN EUROPE'S CITIES UPDATE USING COMPLETED COPERNICUS URBAN ATLAS DATA Hugo Poelman Working Papers A series of short papers on regional research and indicators
True Smart and Green City? 8th Conference of the International Forum on Urbanism
 ,, doi:10.3390/ifou-. True Smart and Green City? 8th Conference of the International Forum on Urbanism Conference Proceedings Paper Comparable Measures of Accessibility to Public Transport by the General
How proximity to a city influences the performance of rural regions by Lewis Dijkstra and Hugo Poelman
 n 01/2008 Regional Focus A series of short papers on regional research and indicators produced by the Directorate-General for Regional Policy Remote Rural Regions How proximity to a city influences the
Vít PÁSZTO Karel MACKŮ
 What is a rural region? A comparative study on Eurostat data and methods for rural areas delimitation Vít PÁSZTO Karel MACKŮ Department of Geoinformatics, Faculty of Science, Palacký University Olomouc,
Compact guides GISCO. Geographic information system of the Commission
 Compact guides GISCO Geographic information system of the Commission What is GISCO? GISCO, the Geographic Information System of the COmmission, is a permanent service of Eurostat that fulfils the requirements
PASSENGER RAIL ACCESSIBILITY IN EUROPE'S BORDER AREAS
 PASSENGER RAIL ACCESSIBILITY IN EUROPE'S BORDER AREAS HUGO POELMAN AND LINDE ACKERMANS Working Papers A series of short papers on regional research and indicators produced by the Directorate-General for
Refinement of the OECD regional typology: Economic Performance of Remote Rural Regions
 [Preliminary draft April 2010] Refinement of the OECD regional typology: Economic Performance of Remote Rural Regions by Lewis Dijkstra* and Vicente Ruiz** Abstract To account for differences among rural
The Combination of Geospatial Data with Statistical Data for SDG Indicators
 Session 3: Sustainable Development Goals, SDG indicators The Combination of Geospatial Data with Statistical Data for SDG Indicators Pier-Giorgio Zaccheddu (with the assistance of Francisco Vala & Cátia
"Transport statistics" MEETING OF THE WORKING GROUP ON RAIL TRANSPORT STATISTICS. Luxembourg, 25 and 26 June Bech Building.
 Document: Original: Rail/2007/9/EN English "Transport statistics" MEETING OF THE WORKING GROUP ON RAIL TRANSPORT STATISTICS Luxembourg, 25 and 26 June 2007 Bech Building Room BECH Ampere Beginning 10:00
Developing a global, peoplebased definition of cities and settlements
 Developing a global, peoplebased definition of cities and settlements By Lewis Dijkstra, Lewis.Dijkstra@ec.europa.eu Head of the Economic Analysis Sector DG for Regional and Urban Policy, Regional & Urban
TOWARDS REGIONAL AND URBAN INDICATORS ON RAIL PASSENGER SERVICES, USING TIMETABLE INFORMATION
 Working Papers A series of short papers on regional research and indicators produced by the Directorate-General for Regional Policy WP 02/2016 TOWARDS REGIONAL AND URBAN INDICATORS ON RAIL PASSENGER SERVICES,
Travel Related Urban Zones in Finland
 Travel Related Urban Zones in Finland Theory of Urban Fabrics Seminar in Helsinki, SYKE, 24.10.2013 Mika Ristimäki, Maija Tiitu, Ville Helminen, Panu Söderström, Kari Oinonen Finnish Environment Institute
UN-GGIM: Europe Work Group on Data Integration. Facilitating the wider utilization of geospatial information to produce indicators
 UN-GGIM: Europe Work Group on Data Integration Facilitating the wider utilization of geospatial information to produce indicators IAEG SDG WG GI, Meeting 06-08.12.2018, NY Copyright 2013 EuroGeographics
TERCET: A European regulation on statistical units and territorial typologies
 TERCET: A European regulation on statistical units and territorial typologies NUAC Meeting 10 May 2016 Eurostat Unit E4 Regulation (EC) No 1059/2003: - Establishes a classification of territorial units
Changes in population and industries in the rural areas of Finland: from analysis of administrative regions to a GIS based approach
 Toivo Muilu*, Jarmo Rusanen** * University of Oulu, Department of Geography, Agrifood Research Finland, Ruukki Research Station P.O. Box 3000, FIN-90014, Finland toivo.muilu@oulu.fi ** University of Oulu,
BROOKINGS May
 Appendix 1. Technical Methodology This study combines detailed data on transit systems, demographics, and employment to determine the accessibility of jobs via transit within and across the country s 100
ESPON Typology Compilation. Kai Böhme Sabine Zillmer, Kai Pflanz, Tomas Hanell & Petteri Niemi
 ESPON Typology Compilation Kai Böhme Sabine Zillmer, Kai Pflanz, Tomas Hanell & Petteri Niemi Scope of the study Tasks Compilation / assessment of existing typologies of typologies for ESPON Interim report
City definitions. Sara Ben Amer. PhD Student Climate Change and Sustainable Development Group Systems Analysis Division
 City definitions Sara Ben Amer PhD Student Climate Change and Sustainable Development Group Systems Analysis Division sbea@dtu.dk Contents 1. Concept of a city 2. Need for the city definition? 3. Challenges
Transit-Oriented Development. Christoffer Weckström
 Transit-Oriented Development Christoffer Weckström 31.10.2017 Outline Context of Transit-oriented Development Elements of Transit-oriented Development A short history of land use and transit integration
European Regional and Urban Statistics
 European Regional and Urban Statistics Dr. Berthold Feldmann berthold.feldmann@ec.europa.eu Eurostat Structure of the talk Regional statistics in the EU The tasks of Eurostat Regional statistics Urban
Developing a global, people-based definition of cities and settlements
 Developing a global, people-based definition of cities and settlements Cooperation between: Directorate General for Regional and, Joint Research Centre, EUROSTAT (European Commission, European Union) OECD,
Urban settlements delimitation using a gridded spatial support
 Urban settlements delimitation using a gridded spatial support Rita Nicolau 1, Elisa Vilares 1, Cristina Cavaco 1, Ana Santos 2, Mário Lucas 2 1 - General Directorate for Territory Development DGT, Portugal
THE NEW DEGREE OF URBANISATION
 THE NEW DEGREE OF URBANISATION EXECUTIVE SUMMARY This paper describes the new degree of urbanisation classification as approved by the Eurostat Labour Market Working Group in 2011. This classification
Swedish examples on , and
 Swedish examples on 11.2.1, 11.3.1 and 11.7.1 Marie Haldorson, Director Seminar in Nairobi 7 Dec 2018 SDG Indicator Tests by Countries in Europe GEOSTAT 3: ESS Project with a purpose to guide countries
Note on Transportation and Urban Spatial Structure
 Note on Transportation and Urban Spatial Structure 1 By Alain Bertaud, Washington, ABCDE conference, April 2002 Email: duatreb@msn.com Web site: http://alain-bertaud.com/ http://alainbertaud.com/ The physical
The European Forum for Geospatial Statistics Benefits and challenges of INSPIRE in the field of statistics
 INSPIRE Conference 2016 Barcelona, Spain 26th 30th September 2016 The European Forum for Geospatial Statistics Benefits and challenges of INSPIRE in the field of statistics Janusz Dygaszewicz EFGS President
accessibility instruments in planning practice
 accessibility instruments in planning practice Spatial Network Analysis for Multi-Modal Transport Systems (SNAMUTS): Helsinki Prof Carey Curtis, Dr Jan Scheurer, Curtin University, Perth - RMIT University,
The Combination of Geospatial Data with Statistical Data for SDG Indicators
 Session x: Sustainable Development Goals, SDG indicators The Combination of Geospatial Data with Statistical Data for SDG Indicators Pier-Giorgio Zaccheddu Fabio Volpe 5-8 December2018, Nairobi IAEG SDG
Sharthi Laldaparsad Statistics South Africa, Policy Research & Analysis. Sub-regional workshop on integration of administrative data,
 Sub-regional workshop on integration of administrative data, big data and geospatial information for the compilation of SDG indicators and International Workshop on Global Fundamental Geospatial Data Themes
Copernicus Overview and Emergency Management Service
 Copernicus Overview and Emergency Management Service Frédéric BASTIDE European Commission Open informal session of the United Nations Inter-Agency Meeting on Outer Space Activities 12 March 2013, Geneva
Public Transport Versus Private Car: GIS-Based Estimation of Accessibility Applied to the Tel Aviv Metropolitan Area
 Public Transport Versus Private Car: GIS-Based Estimation of Accessibility Applied to the Tel Aviv Metropolitan Area Itzhak Benenson 1, Karel Martens 3, Yodan Rofe 2, Ariela Kwartler 1 1 Dept of Geography
Transit Time Shed Analyzing Accessibility to Employment and Services
 Transit Time Shed Analyzing Accessibility to Employment and Services presented by Ammar Naji, Liz Thompson and Abdulnaser Arafat Shimberg Center for Housing Studies at the University of Florida www.shimberg.ufl.edu
Improving rural statistics. Defining rural territories and key indicators of rural development
 Improving rural statistics Defining rural territories and key indicators of rural development Improving rural statistics Improving Rural Statistics In 2016, the Global Strategy to improve Agricultural
Country
 Total EU-12 89,6 89,4 85,7 82,9 85,9 86,9 87,4 EU-15 89,6 85,7 83,1 86,2 87,0 87,5 EU-25 87,9 A 95,1 90,2 88,0 90,8 88,2 93,7 B 80,7 91,1 84,6 84,3 86,3 89,6 85,8 D 95,1 94,1 86,1 86,3 88,0 86,4 89,4 D-W
Land Use and Land cover statistics (LUCAS)
") EUROPEAN COMMISSION EUROSTAT Directorate E: Sectoral and regional statistics Doc. ENV/DIMESA/7.1/2012 Original in EN Agenda point 7.1 Land Use and Land cover statistics (LUCAS) DIMESA Directors' Meeting
EUROPEAN COMMISSION EUROSTAT Directorate E: Sectoral and regional statistics Doc. ENV/DIMESA/7.1/2012 Original in EN Agenda point 7.1 Land Use and Land cover statistics (LUCAS) DIMESA Directors' Meeting
Governance and Functional Urban Areas CEMAT Conference
 Governance and Functional Urban Areas CEMAT Conference Mart Grisel Bucharest, Romania 30/05/2017 FUA: various definitions KEY ASPECTS: CITY & COMMUTING AREA The area occupied by a large city and its surrounding
A proposal for building an infrastructure for European geospatial statistics. Marie Haldorson, Statistics Sweden Ekkehard Petri, Eurostat
 A proposal for building an infrastructure for European geospatial statistics Marie Haldorson, Statistics Sweden Ekkehard Petri, Eurostat What is geospatial statistics? The location, extent or spatial relations
European Forum for Geography & Statistics Conference 2018
 European Forum for Geography & Statistics Conference 2018 Welcome speech Dr. Janusz Dygaszewicz EFGS President Director of ICT Systems, Geostatistics and Census Department Statistics Poland Helsinki, Finland,
TOWNs in Europe. Loris Servillo. Luxemburg, 12 December 2014
 Luxembourgish Small and Medium-Sized Towns in Europe: Challenges and Opportunities Ministère du Développement durable et des Infrastructures Luxemburg-Kirchberg TOWNs in Europe Loris Servillo Luxemburg,
Merging statistics and geospatial information
 Merging statistics and geospatial information Demography / Commuting / Spatial planning / Registers Mirosław Migacz Chief GIS Specialist Janusz Dygaszewicz Director Central Statistical Office of Poland
REGIONAL PATTERNS OF KIS (KNOWLEDGE INTENSIVE SERVICES) ACTIVITIES: A EUROPEAN PERSPECTIVE
 ACTIVITIES: A EUROPEAN PERSPECTIVE") REGIONAL PATTERNS OF KIS (KNOWLEDGE INTENSIVE SERVICES) ACTIVITIES: A EUROPEAN PERSPECTIVE Esther Schricke and Andrea Zenker Fraunhofer-Institut für System- und Innovationsforschung (ISI) Karlsruhe evoreg-workshop
REGIONAL PATTERNS OF KIS (KNOWLEDGE INTENSIVE SERVICES) ACTIVITIES: A EUROPEAN PERSPECTIVE Esther Schricke and Andrea Zenker Fraunhofer-Institut für System- und Innovationsforschung (ISI) Karlsruhe evoreg-workshop
Land Cover and Land Use Diversity Indicators in LUCAS 2009 data
 Land Cover and Land Use Diversity Indicators in LUCAS 2009 data A. Palmieri, L. Martino, P. Dominici and M. Kasanko Abstract Landscape diversity and changes are connected to land cover and land use. The
Data driven approaches to Urban Planning Experience from Derry/Londonderry
 Data driven approaches to Urban Planning Experience from Derry/Londonderry Anna Rose RTPI Belfast 11 th of September 1 June 26 07:47AM 2 The value of the City The space of the city is a theatre: playing
Overview of numbers submitted for Statistics on Pending Mutual Agreement Procedures (MAPs) under the Arbitration Convention (AC) at the End of 2017
 under the Arbitration Convention (AC) at the End of 2017") EUROPEAN COMMISSION DIRECTORATE-GENERAL TAXATION AND CUSTOMS UNION Direct taxation, Tax Coordination, Economic Analysis and Evaluation Direct Tax Policy & Cooperation Brussels, September 2018 Taxud/D2
EUROPEAN COMMISSION DIRECTORATE-GENERAL TAXATION AND CUSTOMS UNION Direct taxation, Tax Coordination, Economic Analysis and Evaluation Direct Tax Policy & Cooperation Brussels, September 2018 Taxud/D2
A proposal for building an infrastructure for European geospatial statistics
 A proposal for building an infrastructure for European geospatial statistics Marie Haldorson, Statistics Sweden Ekkehard Petri, Eurostat What is geospatial statistics? The location, extent or spatial relations
Measuring connectivity in London
 Measuring connectivity in London OECD, Paris 30 th October 2017 Simon Cooper TfL City Planning 1 Overview TfL Connectivity measures in TfL PTALs Travel time mapping Catchment analysis WebCAT Current and
SPIMA Spatial dynamics and strategic planning in metropolitan areas
 SPIMA Spatial dynamics and strategic planning in metropolitan areas Dr. Vanya Simeonova Wageningen Environmental Research Wageningen University and research, The Netherlands Key outcomes: SPIMA Framework
INSPIRE Basics. Vlado Cetl European Commission Joint Research Centre. https://ec.europa.eu/jrc/
 INSPIRE Basics Vlado Cetl European Commission Joint Research Centre https://ec.europa.eu/jrc/ Serving society Stimulating innovation Supporting legislation Outline SDI? Why European SDI? INSPIRE Policy
SPATIAL INEQUALITIES IN PUBLIC TRANSPORT AVAILABILITY: INVESTIGATION WITH SMALL-AREA METRICS
 SPATIAL INEQUALITIES IN PUBLIC TRANSPORT AVAILABILITY: INVESTIGATION WITH SMALL-AREA METRICS Research conducted by Yeran Sun and Piyushimita (Vonu) Thakuriah Presented by Obinna C.D. Anejionu INTRODUCTION
SDI-Challenges European perspective
 THE HIGH LEVEL FORUM ON GLOBAL GEOSPATIAL INFORMATION MANAGEMENT Seoul, Republic of Korea, 24-26 October 2011 Session 1: Challenges in geospatial policy formation and institutional arrangements SDI-Challenges
Applications of GIS and Urban Modelling for Environmental Policy. Overview
 Decision Support Tools for Managing Urban Environment in Ireland Applications of GIS and Urban Modelling for Environmental Policy Sheila Convery, HarutyunShahumyan Overview The MOLAND Model Waste water
ACCESSIBILITY OF INTERMODAL CENTERS STUDY
 ACCESSIBILITY OF INTERMODAL CENTERS STUDY Presentation for VDOT Forum - Coordinating Transportation Planning and Land Use Wednesday, April 2, 2014 Vlad Gavrilovic, AICP - Renaissance Planning Group Tasks
Geodatabase for Sustainable Urban Development. Presented By Rhonda Maronn Maurice Johns Daniel Ashney Jack Anliker
 Geodatabase for Sustainable Urban Development Presented By Rhonda Maronn Maurice Johns Daniel Ashney Jack Anliker Objective Build a Geodatabase that will enable urban planners to create and assess the
2040 MTP and CTP Socioeconomic Data
 SE Data 6-1 24 MTP and CTP Socioeconomic Data Purpose of Socioeconomic Data The socioeconomic data (SE Data) shows the location of the population and employment, median household income and other demographic
Noise Maps, Report & Statistics, Dublin City Council Noise Mapping Project Roads and Traffic Department
 Noise Maps, Report & Statistics, Dublin City Council Noise Mapping Project Roads and Traffic Department Produced by Traffic Noise & Air Quality Unit November 2007 Contact: brian.mcmanus@dublincity.ie Ph;
Spatial Statistical Information Services in KOSTAT
 Distr. GENERAL WP.30 12 April 2010 ENGLISH ONLY UNITED NATIONS ECONOMIC COMMISSION FOR EUROPE (UNECE) CONFERENCE OF EUROPEAN STATISTICIANS EUROPEAN COMMISSION STATISTICAL OFFICE OF THE EUROPEAN UNION (EUROSTAT)
How rural the EU RDP is? An analysis through spatial funds allocation
 How rural the EU RDP is? An analysis through spatial funds allocation Beatrice Camaioni, Roberto Esposti, Antonello Lobianco, Francesco Pagliacci, Franco Sotte Department of Economics and Social Sciences
IAEG SDGs WG GI, , Mexico City
 IAEG SDGs WG GI, 12-14.12.2016, Mexico City UN-GGIM:Europe s perspective and activities to support better integration of geospatial information and statistics and the UN SDG monitoring Pier-Giorgio Zaccheddu,
FROM PHYSICAL TO DIGITAL SPACES Exploring space-time mobility through a telegeomonitoring approach
 1 July 2016 Session 7: The potential of open data and big data for territorial information designed to respond to the PT07 Mainstreaming Gender Equality and Promoting Work Life Balance (2nd Open Call -Support
Global Geospatial Information Management Country Report Finland. Submitted by Director General Jarmo Ratia, National Land Survey
 Global Geospatial Information Management Country Report Finland Submitted by Director General Jarmo Ratia, National Land Survey Global Geospatial Information Management Country Report Finland Background
USING DOWNSCALED POPULATION IN LOCAL DATA GENERATION
 USING DOWNSCALED POPULATION IN LOCAL DATA GENERATION A COUNTRY-LEVEL EXAMINATION CONTENT Research Context and Approach. This part outlines the background to and methodology of the examination of downscaled
Accessibility Instruments in Planning Practice Spatial Network Analysis for Multi-Modal Transport Systems (SNAMUTS): Adelaide
: Adelaide") Accessibility Instruments in Planning Practice Spatial Network Analysis for Multi-Modal Transport Systems (SNAMUTS): Adelaide Prof Carey Curtis, Dr Jan Scheurer, Roger Mellor, Oscar Thomson Curtin University,
Accessibility Instruments in Planning Practice Spatial Network Analysis for Multi-Modal Transport Systems (SNAMUTS): Adelaide Prof Carey Curtis, Dr Jan Scheurer, Roger Mellor, Oscar Thomson Curtin University,
Country
 Total A 36,3 31,1 B 33,8 36,9 37,4 D 41,4 D-W 41,6 37,7 40,7 42,4 D-E 28,2 36,9 36,8 DK 55,8 49,1 48,8 E 33,2 39,5 33,2 28,9 F 44,4 33,1 36,3 FIN 62,2 30,9 50,6 54,6 GB 26,1 26,2 27,1 GR 14,5 I 34,5 32,1
DEFINING AND MEASURING WORLD-METRO REGIONS FOR INTERNATIONAL COMPARISONS
 DEFINING AND MEASURING WORLD-METRO REGIONS FOR INTERNATIONAL COMPARISONS Mario Piacentini, OECD 27th Scorus Conference, 11-13 August 2010, Latvia Why we need comparable measures of city performance Growing
Achieving the Vision Geo-statistical integration addressing South Africa s Developmental Agenda. geospatial + statistics. The Data Revolution
 Achieving the Vision Geo-statistical integration addressing South Africa s Developmental Agenda geospatial + statistics The Data Revolution humble beginnings, present & future - South Africa UN World Data
Travel behavior of low-income residents: Studying two contrasting locations in the city of Chennai, India
 Travel behavior of low-income residents: Studying two contrasting locations in the city of Chennai, India Sumeeta Srinivasan Peter Rogers TRB Annual Meet, Washington D.C. January 2003 Environmental Systems,
TRACC Transport Accessibility at Regional/Local Scale and Patterns in Europe
 TRACC Transport Accessibility at Regional/Local Scale and Patterns in Europe Applied Research 2013/1/10 Final Report Version 30/06/2013 Volume 3 TRACC Regional Case Study Book Part G Finland case study
Transport Planning in Large Scale Housing Developments. David Knight
 Transport Planning in Large Scale Housing Developments David Knight Large Scale Housing Developments No longer creating great urban spaces in the UK (Hall 2014) Transport Planning Transport planning processes
EARTH OBSERVATION FOR ENVIRONMENTAL AND HEALTH IMPACT ASSESSMENT A METHODOLOGY WITH SYNERGIES FOR EUROPEAN POLICIES
 EARTH OBSERVATION FOR ENVIRONMENTAL AND HEALTH IMPACT ASSESSMENT A METHODOLOGY WITH SYNERGIES FOR EUROPEAN POLICIES Andreas N. Skouloudis (1), David G. Rickerby (2), Peter Pärt (3) (1) European Commission,
COMPREHENSIVE LAND-USE MANAGEMENT UNDERSTANDING THE INTERRELATIONSHIP BETWEEN SPATIAL PLANNING, LAND MANAGEMENT AND LAND ADMINISTRATION
 COMPREHENSIVE LAND-USE MANAGEMENT UNDERSTANDING THE INTERRELATIONSHIP BETWEEN SPATIAL PLANNING, LAND MANAGEMENT AND LAND ADMINISTRATION Daniel Galland & Stig Enemark Department of Development and Planning
Territorial evidence for a European Urban Agenda TOWN in Europe
 Territorial evidence for a European Urban Agenda TOWN in Europe Loris Servillo Brussels, 25 November 2014 Outline 1. SMSTs in the EU territory 2. General vs specific trends? 3. Evidences for more appropriated
Infrastructure for Spatial Information in Europe (INSPIRE)
") Infrastructure for Spatial Information in Europe (INSPIRE) 2011 GISCO Working Party 8-9.3.2012 INSPIRE is about improving access to spatial information: the environment doesn t stop at borders EU Geoportal
Infrastructure for Spatial Information in Europe (INSPIRE) 2011 GISCO Working Party 8-9.3.2012 INSPIRE is about improving access to spatial information: the environment doesn t stop at borders EU Geoportal
ReCAP Status Review of the Updated Rural Access Index (RAI) Stephen Vincent, Principal Investigator
 Stephen Vincent, Principal Investigator") ReCAP Status Review of the Updated Rural Access Index (RAI) Stephen Vincent, Principal Investigator Establishment of RAI in 2005/2006 2006 Definition of the RAI Note by Peter Roberts Dated September 2005
ReCAP Status Review of the Updated Rural Access Index (RAI) Stephen Vincent, Principal Investigator Establishment of RAI in 2005/2006 2006 Definition of the RAI Note by Peter Roberts Dated September 2005
Introducing the WISERD Geoportal. WISERD DATA TEAM Dr Robert Berry & Dr Richard Fry, University of Glamorgan Dr Scott Orford, Cardiff University
 Introducing the WISERD Geoportal WISERD DATA TEAM Dr Robert Berry & Dr Richard Fry, University of Glamorgan Dr Scott Orford, Cardiff University WISERD What is WISERD? Wales Institute of Social and Economic
Governance approaches to ruralurban partnerships: a functional perspective to policy making
 Governance approaches to ruralurban partnerships: a functional perspective to policy making web page: www.oecd.org/regional/rurban Paolo Veneri Regional Development Policy Division GOV OECD Warsaw, 24
Typical information required from the data collection can be grouped into four categories, enumerated as below.
 Chapter 6 Data Collection 6.1 Overview The four-stage modeling, an important tool for forecasting future demand and performance of a transportation system, was developed for evaluating large-scale infrastructure
GIS Analysis of Crenshaw/LAX Line
 PDD 631 Geographic Information Systems for Public Policy, Planning & Development GIS Analysis of Crenshaw/LAX Line Biying Zhao 6679361256 Professor Barry Waite and Bonnie Shrewsbury May 12 th, 2015 Introduction
Financing Urban Transport. UNESCAP-SUTI Event
 Financing Urban Transport UNESCAP-SUTI Event October 2017 Urban Transport in Context 2 The spiky urban economy of global cities 3 Mass transit networks converge towards a characteristic structure with
ArcGIS Enterprise: Out-of-the-Box Spatial Analysis. Vicki Cove Hilary Curtis
 ArcGIS Enterprise: Out-of-the-Box Spatial Analysis Vicki Cove Hilary Curtis Agenda What is spatial analysis? Spatial analysis with ArcGIS Enterprise Analysis demos: - Sunflower proximity to bees - Tourists
Statistics on Pending Mutual Agreement Procedures (MAPs) under the Arbitration Convention at the End of 2015
 under the Arbitration Convention at the End of 2015") EUROPEAN COMMISSION DIRECTORATE-GENERAL TAXATION AND CUSTOMS UNION Direct taxation, Tax Coordination, Economic Analysis and Evaluation Direct Tax Policy and Cooperation Brussels, October 2016 Taxud/D2
EUROPEAN COMMISSION DIRECTORATE-GENERAL TAXATION AND CUSTOMS UNION Direct taxation, Tax Coordination, Economic Analysis and Evaluation Direct Tax Policy and Cooperation Brussels, October 2016 Taxud/D2
What are we like? Population characteristics from UK censuses. Justin Hayes & Richard Wiseman UK Data Service Census Support
 What are we like? Population characteristics from UK censuses Justin Hayes & Richard Wiseman UK Data Service Census Support Who are we? Richard Wiseman UK Data Service / Jisc Justin Hayes UK Data Service
Emergency Management Service (EMS) mapping
 mapping") GMES Emergency Management Service (EMS) mapping Frédéric BASTIDE GMES unit, European Commission UN-SPIDER Expert Meeting: "Crowdsource Mapping for Disaster Risk Management and Emergency Response" 3-5 December,
GMES Emergency Management Service (EMS) mapping Frédéric BASTIDE GMES unit, European Commission UN-SPIDER Expert Meeting: "Crowdsource Mapping for Disaster Risk Management and Emergency Response" 3-5 December,
Speakers: Jeff Price, Federal Transit Administration Linda Young, Center for Neighborhood Technology Sofia Becker, Center for Neighborhood Technology
 Speakers: Jeff Price, Federal Transit Administration Linda Young, Center for Neighborhood Technology Sofia Becker, Center for Neighborhood Technology Peter Haas, Center for Neighborhood Technology Craig
Managing Growth: Integrating Land Use & Transportation Planning
 Managing Growth: Integrating Land Use & Transportation Planning Metro Vancouver Sustainability Community Breakfast Andrew Curran Manager, Strategy June 12, 2013 2 Integrating Land Use & Transportation
Common geographies for dissemination of SDG Indicators
 5 th High Level Forum on United Nations GGIM, Mexico 2017 Common geographies for dissemination of SDG Indicators Understanding statistical and geodetic division of territory Janusz Dygaszewicz Central
Problems arising during the implementation of CLC2006
 Problems arising during the implementation of CLC2006 George Büttner, Barbara Kosztra ETC-LUSI / FÖMI (HU) EIONET WG meeting on Land Monitoring IGN Portugal, 10-12 March 2010 Contents of presentation Present
Status of the European Indoor Radon Map
 Status of the European Indoor Radon Map Tore Tollefsen 1, Marc De Cort 1, Peter Bossew 2 1 Joint Research Centre Institute for Environment and Sustainability Radioactivity Environmental Monitoring (REM)
Accessibility and the evaluation of investments on the Beijing subway
 THE JOURNAL OF TRANSPORT AND LAND USE VOL. 10 NO. 1 [2016] pp. 395 408 http://jtlu.org Accessibility and the evaluation of investments on the Beijing subway Haibing Jiang University of Minnesota haibingjiang1@163.com
Second Administrative Level Boundaries (SALB) initiative & geographic names in cartography. Geospatial Information Section
 initiative & geographic names in cartography. Geospatial Information Section") Second Administrative Level Boundaries (SALB) initiative & geographic names in cartography Geospatial Information Section Introduction Goals Global agenda How does SALB work? Latest News on geographic
Second Administrative Level Boundaries (SALB) initiative & geographic names in cartography Geospatial Information Section Introduction Goals Global agenda How does SALB work? Latest News on geographic
The Spatial Structure of Cities: International Examples of the Interaction of Government, Topography and Markets
 Module 2: Spatial Analysis and Urban Land Planning The Spatial Structure of Cities: International Examples of the Interaction of Government, Topography and Markets Alain Bertaud Urbanist Summary What are
Integrating Official Statistics and Geospatial Information NBS Experience
 Integrating Official Statistics and Geospatial Information NBS Experience Presented by Eng. Reda AL Sabbagh Director of IT Dept. Prepared by Eng. Adham Makky GIS Specialist Topics to be covered: Background
Accessibility as an Instrument in Planning Practice. Derek Halden DHC 2 Dean Path, Edinburgh EH4 3BA
 Accessibility as an Instrument in Planning Practice Derek Halden DHC 2 Dean Path, Edinburgh EH4 3BA derek.halden@dhc1.co.uk www.dhc1.co.uk Theory to practice a starting point Shared goals for access to
Policy Research Corporation
 Policy Research Corporation SOUND SOLUTIONS BASED ON SCIENTIFIC RESEARCH EC DG Mare study The role of Maritime Clusters to enhance the strength and development of maritime sectors Dr. Harry Webers Rome,
Resource efficiency and Geospatial data What EUROSTAT does. What could do.
 Resource efficiency and Geospatial data What EUROSTAT does. What could do. Pedro Díaz Muñoz Director Sectoral and Regional Statistics, Eurostat 29/06/2011 Statements - Large amount of information to understand
www. TransportForIreland. ie National Public Transport Access Nodes dataset StopArea - Stop
 www. TransportForIreland. ie NaPTAN National Public Transport Access Nodes dataset StopArea - Stop www. TransportForIreland. ie NaPTAN & NPTG National Public Transit Access Nodes National Public Transport
ESDIN Results from a Crossborder INSPIRE Preparatory Project. Jörgen Hartnor, Lantmäteriet.
 ESDIN Results from a Crossborder INSPIRE Preparatory Project Jörgen Hartnor, Lantmäteriet www.esdin.eu Ett econtentplus Best Practice Network projekt September 2008 February 2011 Coordinated by EuroGeographics