Rangeland Carbon Fluxes in the Northern Great Plains
|
|
|
- Avice Stokes
- 5 years ago
- Views:
Transcription
 USGS: Earth Surface Dynamics, Land Remote Sensing, and Geographic Analysis and Monitoring National")

1 Rangeland Carbon Fluxes in the Northern Great Plains Wylie, B.K., T.G. Gilmanov, A.B. Frank, J.A. Morgan, M.R. Haferkamp, T.P. Meyers, E.A. Fosnight, L. Zhang US Geological Survey National Center for Earth Resources Observation Science (EROS) USGS: Earth Surface Dynamics, Land Remote Sensing, and Geographic Analysis and Monitoring National Science Foundation/EPSCoR Grant No through the South Dakota Center for Biocomplexity Studies and by the State of South Dakota USAID GL-CRSP project Grant No. PCE-G to Univ. of California, Davis USDA Agricultural Research Service Agriflux network US Agency for International Development Grant No. PCE-G , Global Bureau, Office of Agriculture and Food Security U.S. Department of the Interior U.S. Geological Survey
2 Objectives Exhaustively model and map Carbon fluxes in rangelands to quantify the fluxes and Investigate temporal and patterns to understand climate and environmental influences.
 If NDVI >=.")
3 METHODS: Develop Empirical Model Tree Algorithms to Predict Flux Tower Carbon Observations From Spatial Data Localized Detailed Measurements Spatial Variables Through Time C Flux Mapping Model Tree If NDVI <.4 C fluxes = f(x1, X2, X4) If NDVI >=.4 C fluxes = f(x1, X4, X6) C Flux Maps Northern Great Plains
, Canada: Larry Flanagan Ft.")
, MT: Marshall Haferkamp Brookings, SD")
4 Flux Tower Data is used to Develop Models for the Mapping of 1-day Carbon Dynamics on Rangelands Lethbridge (LE), Canada: Larry Flanagan Ft. Peck (FP), MT; Tilden Meyers Mandan (MA), ND; Al Frank New Towers Cottonwood, SD Miles City (MC), MT: Marshall Haferkamp Brookings, SD Cheyenne (CN), WY: Jack Morgan
5 METHODS: Tower C Fluxes Associated with Basic Ecosystem Functions of Gross Primary Production (Pg) and Total Ecosystem Respiration (Re) are Derived From Light Response Curves on 3 min. Datasets. Tagir Gilmanov, SDSU, coordinator of the FLUXNET WORLDGRASSFLUX working group N E E P(Q,T s ; α,β,γ,θ,κ )= 1 2θ αq + β (αq + β)2 4αβθQ γ eκt s, Derives estimates of daytime respiration independent of nighttime flux data (others often use relationships derived from nighttime fluxes and apply them to daytime observations) PROVIDES: 1) Tower Pg, Re, and NEE 2) Facilitates flux tower data gap filling 3) Quantifies ecophysiological parameters (quantum yield (α), maximum gross photosynthesis (β), & daytime respiration (γ))
6 4-May 15-Mar 25-Jan 6-Dec 23-Jun 9-Jan 2-Nov 1-Oct 12-Aug Ecosystem Process Carbon Partitioning: Added Value Re Bkwd_finalGPP_RE_NEEmodel4c.xls NEE Pg Source Sink g C m-2 day-1
7 8 14 Flux Tower Pg Group: Significant Early Rain, High Pg Pg (g C m-2/day-1) day precipitation (mm) CH 1998 Pg MA 1999 Pg CH 1998 ppt MA 1999 ppt 1-Jan 2-Feb 1-Apr 3-May 19-Jul 7-Sep 27-Oct 16-Dec 8 14 Flux Tower Pg Group: Moderate Rain, Moderate Pg Pg (g C m -2 /day -1 ) day precipitation (mm) FP 2 Pg MA 2 Pg MA 21 Pg MC 21 Pg FP 2 ppt MA 2 ppt MA 21 ppt MC 21 ppt 1-Jan 2-Feb 1-Apr 3-May 19-Jul 7-Sep 27-Oct 16-Dec Day of Year 8 14 Flux Tower Pg Group: Low Rain, Low Pg Pg (g C m-2/day-1) day precipitation (mm) LE 2 Pg LE 21 Pg MC 2 Pg MC 2 ppt LE 2 ppt LE 21 ppt 1-Jan 2-Feb 1-Apr 3-May 19-Jul 7-Sep 27-Oct 16-Dec Day of Year
 DOY day of")
8 Model Development Data Set Consists of Flux Tower Pg, Re, and NEE Combined With Spatial Variables from Remote Sensing and GIS (1-day Time Step) Variable name Seasonally Dynamic Solar Radiation nd ppt temp par Definition function of DOY and latitude Smoothed NDVI precipitation temperature PAR Seasonally Dynamic but dependent on time sincesost Days since Start of Season (NDVI metric) DOY day of year = photoperiodism solstice days prior or post summer solstice Annually Dynamic sosn sost tin year Site Dynamic sitecat c4pct co3surf pctclaysurf pctgrass omernick Elevation Aspect NDVI at Start of Season Start of Season DOY Time Integrated NDVI Categorical variable for testing year effects Categorical variable for testing site effects % C4 from STATSGO Surface calcium carbonates from STATSGO % clay in surface layer from STATSGO % grass from STATSGO Categorical variable for testing ecoregion effects
9 Tower versus Spatial Data - Takes into account the accuracy of spatial data sets when developing model. - Process-based models typically rely heavily on precipitation - Precipitation can have high spatial and temporal variability that is difficult to map accurately. Precipitation Temperature y = 1.331x R 2 =.4247 y = 1.171x R 2 =.9852 Tower Precipitation (mm) Tower Temperature ( o C) Mapped Precipitation (mm) Mapped Temperature ( o C)
10 Distinct Model Trees Models that predict: Net Ecosystem Exchange (NEE) Gross Primary Production (Pg) Respiration (Re)
11 Empirical Piecewise Regression Model Cubist Parsimonious and transparent selection of variables Stratification of data into homogeneous information spaces Multiple regression defined for each information space
12 NEE Model example (g CO 2 m -2 day -1 ) Rule 1: [98 cases, mean , range to , est err ] if nd <= 14 and sincesost > 85 then NEE = nd -.91 ppt -.19 sosn -.9 par -.1 temp -.15 sincesost Rule 2: [21 cases, mean , range to , est err ] if nd > 14 and par <= 1 then NEE = par -.4 temp +.33 nd -.3 sosn -.8 ppt -.14 sincesost Rule 3: [6 cases, mean , range to , est err ] if nd <= 14 and sincesost <= 85 then NEE = par -.46 temp -.54 tin +.43 nd -.4 sosn -.12 ppt -.19 sincesost
13 Rules or respective information spaces Flux Tower Training Data Set and Respective NEE Rules 4 3 Tower NEE (g C m -2 day -1 ) rule 1, Rel. Err..11 rule 2, Rel. Err..24 rule 3 Rel. Err..16 rule 4 Rel. Err..25 rule 5 Rel. Err..22 April - Oct May 15-Mar 25-Jan 6-Dec 23-Jun 28-Feb 9-Jan 2-Nov 1-Oct 12-Aug Date
14 Variables used to predict NEE Variables used to predict P g Variables used to predict R e Theme Count Pct. Weight Pct par nd sincesost temp ppt tin sosn Theme Count Pct. Weight Pct nd par doy temp sincesost c4pct sost tin Theme Count Pct. Weight Pct temp nd ppt par sincesost doy pctgrass tin
15 Model Accuracy Assessment MAD = 1/n observed predicted Range = 95th percentile - 5th percentile Relative Error = MAD / Range
16 Winter fluxes difficult to estimate. NGP winter NEE NEE (g C m-2 day-1) Temperature (C) 3 min. data sets indicate snow depth and wind speed important
17 Winter fluxes (Nov. - Mar.) are need to convert model tree maps (Apr. - Oct.) to Annual Fluxes -.1 Mandan 1-2 Mandan 96- Miles City Lacombe Average Average NEE (g C m -2 day -1 ) Winter C flux Grassland Studies Mandan 1-2, Gilmanov 22; Mandan 96-, Frank et al. 22, Miles City, Gilmanov 22; Lacombe, Baron et al. 24
18 Cross validation Results Methodology to quantify robustness of small training data sets Random cross-validation produces realistic error estimates Cross-validation by sites evaluates influence of individual sites Cross-validation by year evaluates influence of individual years Five-fold NEE (g C m -2 day -1 ) cross-validation (random) Random sample as test Fold 1 Fold 2 Fold 3 Fold 4 Fold 5 Hold out data sample size Mean Absolute Difference Relative Error Average MAD =.48
19 Cross-validation NEE (g C m -2 day -1 ) by site Site withheld as test LE MA FP CN MC None Sample size (train) Mean Absolute Difference (train) Relative Error (train) Sample size (test) Mean Absolute Difference Relative Error Cross-validation NEE (g C m -2 day -1 ) by years Year withheld as test None Sample size (train) Mean Absolute Difference (train) Relative Error (train) Sample size (test) Mean Absolute Difference (test) Relative Error (test)
20 Pg: Jack_site_summary3.xls Robustness of Pg model tree: Cross Validation using Sites Site Withheld CN FP LE MA MC None MAD (g C m -2 day -1 ) Relative Error N Cheyenne and Mandan are influential sites (high Pg in CH 1998 and MA 1999) (MA is only high precipitation, eastern site) Relative Errors on the other sites was from 7 to 12 %
21 Results How Well do 1-day Model Tree Predictions Averaged over the Growing Season Compare with Flux Tower Observation? NGP Modeled April -- Oct. average Re NEE (g C (g mc -2 mday -2-1 day ) versus -1 ) versus Observed Re NEE NGP Modeled April - Oct. average Pg (g C m -2 day -1 ) versus Observed Pg, MAE =.15 Tower Tower NEE Re.82.5 y = 1.274x y =.8382x R 2 R = =.639 MC 2 2 MC 2 MC 21.4 MC 21 MA 21 MA 21 MA 2 MA 2.2 FP FP 2 MA 1999 MA :1 Line 1:1 Line Regression Regression Miles City 2 flux data begins 4/ Modeled Re Modeled NEE Twrlocalbxy_gpp_nee1_Re.xls Tower Pg y =.962x R 2 =.949 Miles City 2 flux data begins 4/ Modeled Pg MC 2 MC 21 MA 21 MA 2 FP 2 MA :1 Line Regression
22 Model Tree Predictions Match 21 Flux Tower Observations Better than MODIS Net Photosynthesis Captures General Tend in Tower Pg Predictions seem site specific Model Tree (trained from all towers) (withheld 21 MAD was.48) MODIS GPP 6 5 MAD =.32 Relative Error = MAD =.56 Relative Error =.16 Estimated Pg (g C m -2 day -1 ) LE MA MC 1:1 Line Estimated Pg (g C m -2 day -1 ) LE MA MC 1:1 Line Tower Pg (g C m -2 day -1 ) Tower Pg (g C m -2 day -1 )

 MODIS")
23 Regional Comparison of 21 MODIS GPP and Model Tree Pg on Rangelands General Agreement MODIS had outlier values > 6 g C m -2 day -1 Pg (g C m-2 day-1) MODIS Model Tree
24
25
26
27
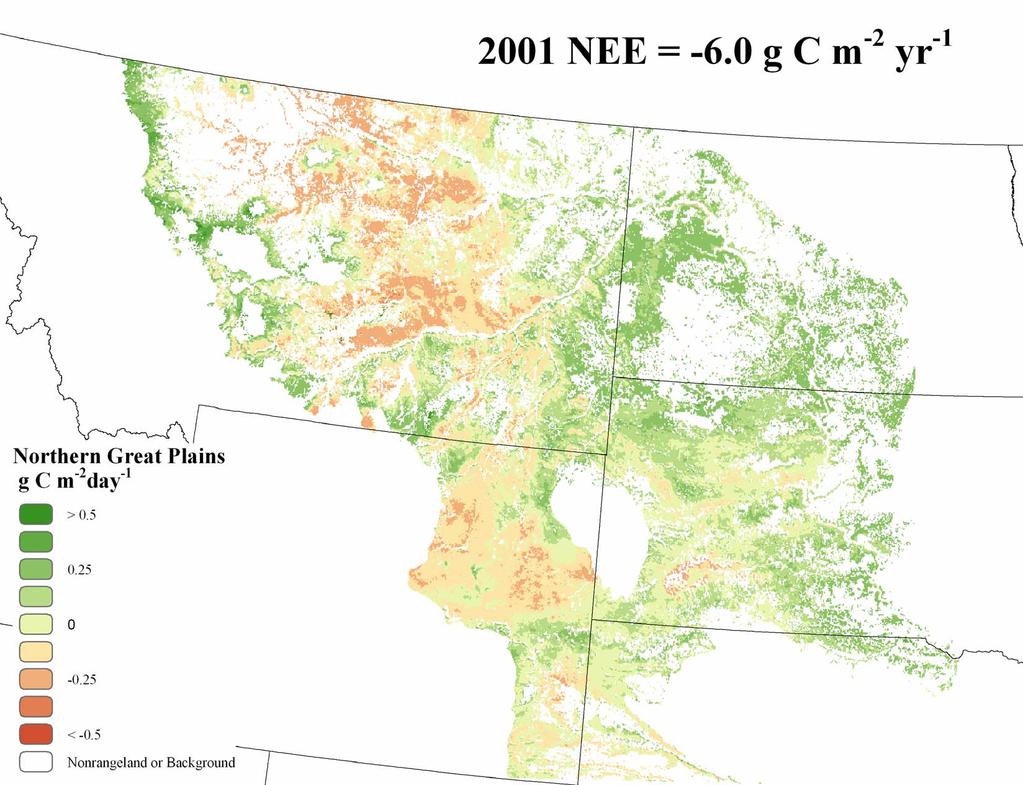
28 NEE (g C m 2 yr -1 ) 1998 = = = = -6. Average = -16.
29 Why was 2 NEE so low? 9 Precipitation (mm) Ppt_temp_monthy_rangelands.xls Month Ppt_temp_monthly_rangelands.xls NEE (g C m 2 yr -1 ) 1998 = = = = -6. Average = -16. Low June precipitation Low previous fall precipitation

30 Investigating Causes of Sinks and Sources: 1999 High NEE 1 and NEE (gc m -2 day -1 ) 1 High 1 High 2 Low 1 Low 2 Low NEE 1 and /9 3/31 5/2 7/9 8/28 1/17 12/6 4 Date Percent Clay 2 NDVI High 1 High 2 Low 1 Low High 1 High 2 Low 1 Low 2 2/9 3/31 5/2 7/9 8/28 1/17 12/6 Date


")

31 Environmental Drivers of Source Areas Average Temperature STATSGO April-June Range (Apr. percent - Production Oct., clay Precipitation ) Normal Year (C) Percent mm13.7 clay Kg 15.5 ha <= >=
32 Conclusions Model Tree predictions of Pg and NEE agreed well with tower observations Heavy reliance of Model Tree predictions on NDVI insures tracking of temporal and spatial dynamics not evident in climatic data sets Winter flux estimates need improvement N. Great Plains Rangelands from were a WEAK source of C.
Evaluation and comparison of gross primary production estimates for the Northern Great Plains grasslands
 University of Nebraska - Lincoln DigitalCommons@University of Nebraska - Lincoln USGS Staff -- Published Research US Geological Survey 2007 Evaluation and comparison of gross primary production estimates
GAMINGRE 8/1/ of 7
 FYE 09/30/92 JULY 92 0.00 254,550.00 0.00 0 0 0 0 0 0 0 0 0 254,550.00 0.00 0.00 0.00 0.00 254,550.00 AUG 10,616,710.31 5,299.95 845,656.83 84,565.68 61,084.86 23,480.82 339,734.73 135,893.89 67,946.95
Spatiotemporal variations of alpine climate, snow cover and phenology
 Spatiotemporal variations of alpine climate, snow cover and phenology S. Asam, M. Callegari, M. Matiu, G. Fiore, L. De Gregorio, A. Jacob, A. Menzel, C. Notarnicola, M. Zebisch Asam et al., Spatiotemporal
Variability of Reference Evapotranspiration Across Nebraska
 Know how. Know now. EC733 Variability of Reference Evapotranspiration Across Nebraska Suat Irmak, Extension Soil and Water Resources and Irrigation Specialist Kari E. Skaggs, Research Associate, Biological
Modeling the Effects of Climate and Land Cover Change in the Stoney Brook Subbasin of the St. Louis River Watershed
 Modeling the Effects of Climate and Land Cover Change in the Stoney Brook Subbasin of the St. Louis River Watershed Joe Johnson and Jesse Pruette 214 NASA Research Internship Geospatial Technologies Program
Interdisciplinary research for carbon cycling in a forest ecosystem and scaling to a mountainous landscape in Takayama,, central Japan.
 Asia-Pacific Workshop on Carbon Cycle Observations (March 17 19, 2008) Interdisciplinary research for carbon cycling in a forest ecosystem and scaling to a mountainous landscape in Takayama,, central Japan.
The Climate of Grady County
 The Climate of Grady County Grady County is part of the Central Great Plains, encompassing some of the best agricultural land in Oklahoma. Average annual precipitation ranges from about 33 inches in northern
Interannual variation of MODIS NDVI in Lake Taihu and its relation to climate in submerged macrophyte region
 Yale-NUIST Center on Atmospheric Environment Interannual variation of MODIS NDVI in Lake Taihu and its relation to climate in submerged macrophyte region ZhangZhen 2015.07.10 1 Outline Introduction Data
Quenching the Valley s thirst: The connection between Sierra Nevada snowpack & regional water supply
 Quenching the Valley s thirst: The connection between Sierra Nevada snowpack & regional water supply Roger Bales, UC Merced Snow conditions Snow & climate change Research directions Sierra Nevada snow
The Climate of Bryan County
 The Climate of Bryan County Bryan County is part of the Crosstimbers throughout most of the county. The extreme eastern portions of Bryan County are part of the Cypress Swamp and Forest. Average annual
Regents Earth Science Unit 7: Water Cycle and Climate
 Regents Earth Science Unit 7: Water Cycle and Climate Name Section Coastal and Continental Temperature Ranges Lab # Introduction: There are large variations in average monthly temperatures among cities
Future Weather in Toronto and the GTA
 Future Weather in Toronto and the GTA Due to Climate Change Electrical Sector Meeting, Nov. 23 rd, 2011 Christopher Ll. Morgan, PhD Toronto Environment Office Contents 2 Introduction (Why We Did What We
Climate Change and Water Supply Research. Drought Response Workshop October 8, 2013
 Climate Change and Water Supply Research Drought Response Workshop October 8, 2013 DWR Photo Oroville Reservoir, 2009 Talk Overview Expectations History Atmospheric Rivers and Water Supply Current Research
The Climate of Payne County
 The Climate of Payne County Payne County is part of the Central Great Plains in the west, encompassing some of the best agricultural land in Oklahoma. Payne County is also part of the Crosstimbers in the
The Climate of Marshall County
 The Climate of Marshall County Marshall County is part of the Crosstimbers. This region is a transition region from the Central Great Plains to the more irregular terrain of southeastern Oklahoma. Average
Missouri River Basin Water Management Monthly Update
 Missouri River Basin Water Management Monthly Update Participating Agencies 255 255 255 237 237 237 0 0 0 217 217 217 163 163 163 200 200 200 131 132 122 239 65 53 80 119 27 National Oceanic and Atmospheric
The Climate of Oregon Climate Zone 5 High Plateau
 105 E55 Unbound issue i". 9 13oes not circulate CZe Special Report 917 May 1993 The Climate of Oregon Climate Zone 5 Property of OREGON STATE UNIVERSITY Library Serials Corvallis, OR 97331-4503 Agricultural
Climate Change and Arizona s Rangelands: Management Challenges and Opportunities
 Climate Change and Arizona s Rangelands: Management Challenges and Opportunities Mike Crimmins Climate Science Extension Specialist Dept. of Soil, Water, & Env. Science & Arizona Cooperative Extension
2003 Water Year Wrap-Up and Look Ahead
 2003 Water Year Wrap-Up and Look Ahead Nolan Doesken Colorado Climate Center Prepared by Odie Bliss http://ccc.atmos.colostate.edu Colorado Average Annual Precipitation Map South Platte Average Precipitation
The Climate of Oregon Climate Zone 4 Northern Cascades
 /05 E55 Unbound issue No. 9/ is Does not circulate Special Report 916 May 1993 The Climate of Oregon Climate Zone 4 Property of OREGON STATE UNIVERSITY Library Serials Corvallis, OR 97331-4503 Agricultural
The Climate of Kiowa County
 The Climate of Kiowa County Kiowa County is part of the Central Great Plains, encompassing some of the best agricultural land in Oklahoma. Average annual precipitation ranges from about 24 inches in northwestern
Jackson County 2014 Weather Data
 Jackson County 2014 Weather Data 62 Years of Weather Data Recorded at the UF/IFAS Marianna North Florida Research and Education Center Doug Mayo Jackson County Extension Director 1952-2008 Rainfall Data
Jackson County 2013 Weather Data
 Jackson County 2013 Weather Data 61 Years of Weather Data Recorded at the UF/IFAS Marianna North Florida Research and Education Center Doug Mayo Jackson County Extension Director 1952-2008 Rainfall Data
YACT (Yet Another Climate Tool)? The SPI Explorer
? The SPI Explorer") YACT (Yet Another Climate Tool)? The SPI Explorer Mike Crimmins Assoc. Professor/Extension Specialist Dept. of Soil, Water, & Environmental Science The University of Arizona Yes, another climate tool for
YACT (Yet Another Climate Tool)? The SPI Explorer Mike Crimmins Assoc. Professor/Extension Specialist Dept. of Soil, Water, & Environmental Science The University of Arizona Yes, another climate tool for
The Climate of Pontotoc County
 The Climate of Pontotoc County Pontotoc County is part of the Crosstimbers. This region is a transition region from the Central Great Plains to the more irregular terrain of southeast Oklahoma. Average
Global Climates. Name Date
 Global Climates Name Date No investigation of the atmosphere is complete without examining the global distribution of the major atmospheric elements and the impact that humans have on weather and climate.
The Climate of Seminole County
 The Climate of Seminole County Seminole County is part of the Crosstimbers. This region is a transition region from the Central Great Plains to the more irregular terrain of southeastern Oklahoma. Average
Funding provided by NOAA Sectoral Applications Research Project CLIMATE. Basic Climatology Colorado Climate Center
 Funding provided by NOAA Sectoral Applications Research Project CLIMATE Basic Climatology Colorado Climate Center Remember These? Factor 1: Our Energy Source Factor 2: Revolution & Tilt Factor 3: Rotation!
Agricultural Science Climatology Semester 2, Anne Green / Richard Thompson
 Agricultural Science Climatology Semester 2, 2006 Anne Green / Richard Thompson http://www.physics.usyd.edu.au/ag/agschome.htm Course Coordinator: Mike Wheatland Course Goals Evaluate & interpret information,
Changing Hydrology under a Changing Climate for a Coastal Plain Watershed
 Changing Hydrology under a Changing Climate for a Coastal Plain Watershed David Bosch USDA-ARS, Tifton, GA Jeff Arnold ARS Temple, TX and Peter Allen Baylor University, TX SEWRU Objectives 1. Project changes
Jackson County 2018 Weather Data 67 Years of Weather Data Recorded at the UF/IFAS Marianna North Florida Research and Education Center
 Jackson County 2018 Weather Data 67 Years of Weather Data Recorded at the UF/IFAS Marianna North Florida Research and Education Center Doug Mayo Jackson County Extension Director 1952-2008 Rainfall Data
A SUMMARY OF RAINFALL AT THE CARNARVON EXPERIMENT STATION,
 A SUMMARY OF RAINFALL AT THE CARNARVON EXPERIMENT STATION, 1931-213 J.C.O. Du Toit 1#, L. van den Berg 1 & T.G. O Connor 2 1 Grootfontein Agricultural Development Institute, Private Bag X529, Middelburg
ESTIMATION OF BIOGENIC NMVOCs EMISSIONS OVER THE BALKAN REGION
 ESTIMATION OF BIOGENIC NMVOCs EMISSIONS OVER THE BALKAN REGION Poupkou A. 1, Symeonidis P. 1, Melas D. 1, Balis D. 1 and Zerefos C. 2,3 1 Laboratory of Atmospheric Physics, Department of Physics, AUTH
Climate Variability in South Asia
 Climate Variability in South Asia V. Niranjan, M. Dinesh Kumar, and Nitin Bassi Institute for Resource Analysis and Policy Contents Introduction Rainfall variability in South Asia Temporal variability
Monthly Long Range Weather Commentary Issued: APRIL 18, 2017 Steven A. Root, CCM, Chief Analytics Officer, Sr. VP,
 Monthly Long Range Weather Commentary Issued: APRIL 18, 2017 Steven A. Root, CCM, Chief Analytics Officer, Sr. VP, sroot@weatherbank.com MARCH 2017 Climate Highlights The Month in Review The average contiguous
2016 Meteorology Summary
 2016 Meteorology Summary New Jersey Department of Environmental Protection AIR POLLUTION AND METEOROLOGY Meteorology plays an important role in the distribution of pollution throughout the troposphere,
CliGen (Climate Generator) Addressing the Deficiencies in the Generator and its Databases William J Rust, Fred Fox & Larry Wagner
 Addressing the Deficiencies in the Generator and its Databases William J Rust, Fred Fox & Larry Wagner") CliGen (Climate Generator) Addressing the Deficiencies in the Generator and its Databases William J Rust, Fred Fox & Larry Wagner United States Department of Agriculture, Agricultural Research Service
CliGen (Climate Generator) Addressing the Deficiencies in the Generator and its Databases William J Rust, Fred Fox & Larry Wagner United States Department of Agriculture, Agricultural Research Service
Coupling of Diurnal Climate to Clouds, Land-use and Snow
 Coupling of Diurnal Climate to Clouds, Land-use and Snow Alan K. Betts akbetts@aol.com http://alanbetts.com Co-authors: Ray Desjardins, Devon Worth, Darrel Cerkowniak Agriculture and Agri-Food Canada Shusen
United States Climate
 25-1 Alabama Annual Average Temperature Data Source: http://www.wrcc.dri.edu/cgi-bin/divplot1_form.pl?0106 25-2 How does climate vary as we traverse the U.S. along 40 N? 25-3 Average Temperature Along
Monthly Long Range Weather Commentary Issued: APRIL 25, 2016 Steven A. Root, CCM, Chief Analytics Officer, Sr. VP, sales
 Monthly Long Range Weather Commentary Issued: APRIL 25, 2016 Steven A. Root, CCM, Chief Analytics Officer, Sr. VP, sales sroot@weatherbank.com MARCH 2016 Climate Highlights The Month in Review The March
Climate Change Impacts on Maple Syrup Yield
 Climate Change Impacts on Maple Syrup Yield Rajasekaran R. Lada, Karen Nelson, Arumugam Thiagarajan Maple Research Programme, Dalhousie Agricultural Campus Raj.lada@dal.ca Canada is the largest maple
Chiang Rai Province CC Threat overview AAS1109 Mekong ARCC
 Chiang Rai Province CC Threat overview AAS1109 Mekong ARCC This threat overview relies on projections of future climate change in the Mekong Basin for the period 2045-2069 compared to a baseline of 1980-2005.
Satellite-derived environmental drivers for top predator hotspots
 Satellite-derived environmental drivers for top predator hotspots Peter Miller @PeterM654 South West Marine Ecosystems 2017 21 Apr. 2017, Plymouth University Satellite environmental drivers for hotspots
Sierra Weather and Climate Update
 Sierra Weather and Climate Update 2014-15 Kelly Redmond Western Regional Climate Center Desert Research Institute Reno Nevada Yosemite Hydroclimate Workshop Yosemite Valley, 2015 October 8-9 Percent of
Missouri River Basin Water Management Monthly Update
 Missouri River Basin Water Management Monthly Update Participating Agencies 255 255 255 237 237 237 0 0 0 217 217 217 163 163 163 200 200 200 131 132 122 239 65 53 80 119 27 National Oceanic and Atmospheric
Weather and Climate of the Rogue Valley By Gregory V. Jones, Ph.D., Southern Oregon University
 Weather and Climate of the Rogue Valley By Gregory V. Jones, Ph.D., Southern Oregon University The Rogue Valley region is one of many intermountain valley areas along the west coast of the United States.
The Climate of Texas County
 The Climate of Texas County Texas County is part of the Western High Plains in the north and west and the Southwestern Tablelands in the east. The Western High Plains are characterized by abundant cropland
Colorado s 2003 Moisture Outlook
 Colorado s 2003 Moisture Outlook Nolan Doesken and Roger Pielke, Sr. Colorado Climate Center Prepared by Tara Green and Odie Bliss http://climate.atmos.colostate.edu How we got into this drought! Fort
The Cryosphere Radiative Effect in CESM. Justin Perket Mark Flanner CESM Polar Climate Working Group Meeting Wednesday June 19, 2013
 The Cryosphere Radiative Effect in CESM Justin Perket Mark Flanner CESM Polar Climate Working Group Meeting Wednesday June 19, 2013 Cryosphere Radiative Effect (CrRE) A new diagnostic feature is available
Presentation Overview. Southwestern Climate: Past, present and future. Global Energy Balance. What is climate?
 Southwestern Climate: Past, present and future Mike Crimmins Climate Science Extension Specialist Dept. of Soil, Water, & Env. Science & Arizona Cooperative Extension The University of Arizona Presentation
Tracking the Climate Of Northern Colorado Nolan Doesken State Climatologist Colorado Climate Center Colorado State University
 Tracking the Climate Of Northern Colorado Nolan Doesken State Climatologist Colorado Climate Center Colorado State University Northern Colorado Business Innovations November 20, 2013 Loveland, Colorado
HAIDA GWAII CLIMATE ASSESSMENT 2010 Special Report for MIEDS Franc Pridoehl
 HAIDA GWAII CLIMATE ASSESSMENT 2010 Special Report for MIEDS Franc Pridoehl INTRODUCTION Climatic conditions have varied considerably on Haida Gwaii over the past centuries and millennia (Hebda 2007).
Upscaling Carbon Fluxes Over the Great Plains Grasslands: Sinks and Sources
 South Dakota State University Open PRAIRIE: Open Public Research Access Institutional Repository and Information Exchange Natural Resource Management Faculty Publications Department of Natural Resource
IPC 24th Session, Dehradun Nov 2012
 Tree species that occupy large ranges at high latitude must adapt to widely variable growing periods associated with geography and climate. Climate driven adaptive traits in phenology and ecophysiology
Coupling Climate to Clouds, Precipitation and Snow
 Coupling Climate to Clouds, Precipitation and Snow Alan K. Betts akbetts@aol.com http://alanbetts.com Co-authors: Ray Desjardins, Devon Worth Agriculture and Agri-Food Canada Shusen Wang and Junhua Li
Missouri River Basin Water Management Monthly Update
 Missouri River Basin Water Management Monthly Update Participating Agencies 255 255 255 237 237 237 0 0 0 217 217 217 163 163 163 200 200 200 131 132 122 239 65 53 80 119 27 National Oceanic and Atmospheric
Gapfilling of EC fluxes
 Gapfilling of EC fluxes Pasi Kolari Department of Forest Sciences / Department of Physics University of Helsinki EddyUH training course Helsinki 23.1.2013 Contents Basic concepts of gapfilling Example
Missouri River Basin Water Management Monthly Update
 Missouri River Basin Water Management Monthly Update Participating Agencies 255 255 255 237 237 237 0 0 0 217 217 217 163 163 163 200 200 200 131 132 122 239 65 53 80 119 27 National Oceanic and Atmospheric
CoCoRaHS Monitoring Colorado s s Water Resources through Community Collaborations
 CoCoRaHS Monitoring Colorado s s Water Resources through Community Collaborations Nolan Doesken Colorado Climate Center Atmospheric Science Department Colorado State University Presented at Sustaining
Constructing a typical meteorological year -TMY for Voinesti fruit trees region and the effects of global warming on the orchard ecosystem
 Constructing a typical meteorological year -TMY for Voinesti fruit trees region and the effects of global warming on the orchard ecosystem ARMEANU ILEANA*, STĂNICĂ FLORIN**, PETREHUS VIOREL*** *University
Technical note on seasonal adjustment for M0
 Technical note on seasonal adjustment for M0 July 1, 2013 Contents 1 M0 2 2 Steps in the seasonal adjustment procedure 3 2.1 Pre-adjustment analysis............................... 3 2.2 Seasonal adjustment.................................
Drought in Southeast Colorado
 Drought in Southeast Colorado Nolan Doesken and Roger Pielke, Sr. Colorado Climate Center Prepared by Tara Green and Odie Bliss http://climate.atmos.colostate.edu 1 Historical Perspective on Drought Tourism
The Climate of Haskell County
 The Climate of Haskell County Haskell County is part of the Hardwood Forest. The Hardwood Forest is characterized by its irregular landscape and the largest lake in Oklahoma, Lake Eufaula. Average annual
WHEN IS IT EVER GOING TO RAIN? Table of Average Annual Rainfall and Rainfall For Selected Arizona Cities
 WHEN IS IT EVER GOING TO RAIN? Table of Average Annual Rainfall and 2001-2002 Rainfall For Selected Arizona Cities Phoenix Tucson Flagstaff Avg. 2001-2002 Avg. 2001-2002 Avg. 2001-2002 October 0.7 0.0
Climatography of the United States No
 Climate Division: AK 5 NWS Call Sign: ANC Month (1) Min (2) Month(1) Extremes Lowest (2) Temperature ( F) Lowest Month(1) Degree s (1) Base Temp 65 Heating Cooling 90 Number of s (3) Jan 22.2 9.3 15.8
The Climate of Murray County
 The Climate of Murray County Murray County is part of the Crosstimbers. This region is a transition between prairies and the mountains of southeastern Oklahoma. Average annual precipitation ranges from
Midwest and Great Plains Climate and Drought Update
 Midwest and Great Plains Climate and Drought Update June 20,2013 Laura Edwards Climate Field Specialist Laura.edwards@sdstate.edu 605-626-2870 2012 Board of Regents, South Dakota State University General
Champaign-Urbana 2001 Annual Weather Summary
 Champaign-Urbana 2001 Annual Weather Summary ILLINOIS STATE WATER SURVEY 2204 Griffith Dr. Champaign, IL 61820 wxobsrvr@sws.uiuc.edu Maria Peters, Weather Observer January: After a cold and snowy December,
OVERVIEW OF IMPROVED USE OF RS INDICATORS AT INAM. Domingos Mosquito Patricio
 OVERVIEW OF IMPROVED USE OF RS INDICATORS AT INAM Domingos Mosquito Patricio domingos.mosquito@gmail.com Introduction to Mozambique /INAM Introduction to AGRICAB/SPIRITS Objectives Material & Methods Results
Highlights of the 2006 Water Year in Colorado
 Highlights of the 2006 Water Year in Colorado Nolan Doesken, State Climatologist Atmospheric Science Department Colorado State University http://ccc.atmos.colostate.edu Presented to 61 st Annual Meeting
CLIMATE OF THE ZUMWALT PRAIRIE OF NORTHEASTERN OREGON FROM 1930 TO PRESENT
 CLIMATE OF THE ZUMWALT PRAIRIE OF NORTHEASTERN OREGON FROM 19 TO PRESENT 24 MAY Prepared by J. D. Hansen 1, R.V. Taylor 2, and H. Schmalz 1 Ecologist, Turtle Mt. Environmental Consulting, 652 US Hwy 97,
Met Éireann Climatological Note No. 15 Long-term rainfall averages for Ireland,
 Met Éireann Climatological Note No. 15 Long-term rainfall averages for Ireland, 1981-2010 Séamus Walsh Glasnevin Hill, Dublin 9 2016 Disclaimer Although every effort has been made to ensure the accuracy
Typical Hydrologic Period Report (Final)
") (DELCORA) (Final) November 2015 (Updated April 2016) CSO Long-Term Control Plant Update REVISION CONTROL REV. NO. DATE ISSUED PREPARED BY DESCRIPTION OF CHANGES 1 4/26/16 Greeley and Hansen Pg. 1-3,
(DELCORA) (Final) November 2015 (Updated April 2016) CSO Long-Term Control Plant Update REVISION CONTROL REV. NO. DATE ISSUED PREPARED BY DESCRIPTION OF CHANGES 1 4/26/16 Greeley and Hansen Pg. 1-3,
2015 Fall Conditions Report
 2015 Fall Conditions Report Prepared by: Hydrologic Forecast Centre Date: December 21 st, 2015 Table of Contents Table of Figures... ii EXECUTIVE SUMMARY... 1 BACKGROUND... 2 SUMMER AND FALL PRECIPITATION...
HYDROLOGIC AND WATER RESOURCES EVALUATIONS FOR SG. LUI WATERSHED
 HYDROLOGIC AND WATER RESOURCES EVALUATIONS FOR SG. LUI WATERSHED 1.0 Introduction The Sg. Lui watershed is the upper part of Langat River Basin, in the state of Selangor which located approximately 20
SEPTEMBER 2013 REVIEW
 Monthly Long Range Weather Commentary Issued: October 21, 2013 Steven A. Root, CCM, President/CEO sroot@weatherbank.com SEPTEMBER 2013 REVIEW Climate Highlights The Month in Review The average temperature
TILT, DAYLIGHT AND SEASONS WORKSHEET
 TILT, DAYLIGHT AND SEASONS WORKSHEET Activity Description: Students will use a data table to make a graph for the length of day and average high temperature in Utah. They will then answer questions based
5.0 WHAT IS THE FUTURE ( ) WEATHER EXPECTED TO BE?
 WEATHER EXPECTED TO BE?") 5.0 WHAT IS THE FUTURE (2040-2049) WEATHER EXPECTED TO BE? This chapter presents some illustrative results for one station, Pearson Airport, extracted from the hour-by-hour simulations of the future period
5.0 WHAT IS THE FUTURE (2040-2049) WEATHER EXPECTED TO BE? This chapter presents some illustrative results for one station, Pearson Airport, extracted from the hour-by-hour simulations of the future period
Missouri River Basin Water Management
 Missouri River Basin Water Management US Army Corps of Engineers Missouri River Navigator s Meeting February 12, 2014 Bill Doan, P.E. Missouri River Basin Water Management US Army Corps of Engineers BUILDING
Monthly Long Range Weather Commentary Issued: SEPTEMBER 19, 2016 Steven A. Root, CCM, Chief Analytics Officer, Sr. VP,
 Monthly Long Range Weather Commentary Issued: SEPTEMBER 19, 2016 Steven A. Root, CCM, Chief Analytics Officer, Sr. VP, sroot@weatherbank.com SEPTEMBER 2016 Climate Highlights The Month in Review The contiguous
WIND DATA REPORT FOR THE YAKUTAT JULY 2004 APRIL 2005
 WIND DATA REPORT FOR THE YAKUTAT JULY 2004 APRIL 2005 Prepared on July 12, 2005 For Bob Lynette 212 Jamestown Beach Lane Sequim WA 98382 By John Wade Wind Consultant LLC 2575 NE 32 nd Ave Portland OR 97212
Climate also has a large influence on how local ecosystems have evolved and how we interact with them.
 The Mississippi River in a Changing Climate By Paul Lehman, P.Eng., General Manager Mississippi Valley Conservation (This article originally appeared in the Mississippi Lakes Association s 212 Mississippi
Long-term Precipitation Trends in Colorado. Nolan Doesken Colorado State Climatologist Presented: Friday, December 12, 2008
 Long-term Precipitation Trends in Colorado Nolan Doesken Colorado State Climatologist Presented: Friday, December 12, 28 Colorado Mean Annual Precipitation (1971-2) Of All Our Climate Observing Stations
Basic human requirements
 Basic human requirements Core Temperature 37 0 C 36 0 C 34 0 C 32 0 C 31 0 C 28 0 C Room Temperature 0 o C 20 o C 35 o C Energy [kw/(m² μm)] 2.0-1.5 - Black body at 800 K Solar radiation at atmosphere
UPPLEMENT A COMPARISON OF THE EARLY TWENTY-FIRST CENTURY DROUGHT IN THE UNITED STATES TO THE 1930S AND 1950S DROUGHT EPISODES
 UPPLEMENT A COMPARISON OF THE EARLY TWENTY-FIRST CENTURY DROUGHT IN THE UNITED STATES TO THE 1930S AND 1950S DROUGHT EPISODES Richard R. Heim Jr. This document is a supplement to A Comparison of the Early
Many of remote sensing techniques are generic in nature and may be applied to a variety of vegetated landscapes, including
 Remote Sensing of Vegetation Many of remote sensing techniques are generic in nature and may be applied to a variety of vegetated landscapes, including 1. Agriculture 2. Forest 3. Rangeland 4. Wetland,
What Does It Take to Get Out of Drought?
 What Does It Take to Get Out of Drought? Nolan J. Doesken Colorado Climate Center Colorado State University http://ccc.atmos.colostate.edu Presented at the Insects, Diseases and Drought Workshop, May 19,
Modelling Denitrification
 Modelling Denitrification Tom Anderson, Mike Fasham National Oceanography Centre, Southampton, UK Vladimir Ryabchenko, Viktor Gorchakov P.P. Shirshov Institute of Oceanology, St Petersburg, Russia Questions:
Monthly Long Range Weather Commentary Issued: February 15, 2015 Steven A. Root, CCM, President/CEO
 Monthly Long Range Weather Commentary Issued: February 15, 2015 Steven A. Root, CCM, President/CEO sroot@weatherbank.com JANUARY 2015 Climate Highlights The Month in Review During January, the average
P7: Limiting Factors in Ecosystems
 P7: Limiting Factors in Ecosystems Purpose To understand that physical factors temperature and precipitation limit the growth of vegetative ecosystems Overview Students correlate graphs of vegetation vigor
2003 Moisture Outlook
 2003 Moisture Outlook Nolan Doesken and Roger Pielke, Sr. Colorado Climate Center Prepared by Tara Green and Odie Bliss http://climate.atmos.colostate.edu Through 1999 Through 1999 Fort Collins Total Water
CAMARGO RANCH, llc. CRAIG BUFORD BufordResources.com
 CAMARGO RANCH, llc 2897 +/- acre Wheat & Cattle Farm Mangum, greer county, oklahoma CRAIG BUFORD 405-833-9499 BufordResources.com 4101 Perimeter Center Dr., Suite 107 Oklahoma City, OK 73112 405.833.9499
CURRENT METHODS AND PRODUCTS OF SEASONAL PREDICTION IN KENYA
 CURRENT METHODS AND PRODUCTS OF SEASONAL PREDICTION IN KENYA BY Mr. PETER G. AMBENJE Deputy Director Kenya Meteorological Department Box 3259-1 NAIROBI OUTLINE Introduction Brief Geography of Kenya Brief
Supplementary Figures
 Supplementary Figures Supplementary Figure 1: The partial correlation coefficient of NDVI GS and GT for the first 15 years (1982-1996) and the last 15 years (1997-211) with five different definition of
Local Ctimatotogical Data Summary White Hall, Illinois
 SWS Miscellaneous Publication 98-5 STATE OF ILLINOIS DEPARTMENT OF ENERGY AND NATURAL RESOURCES Local Ctimatotogical Data Summary White Hall, Illinois 1901-1990 by Audrey A. Bryan and Wayne Armstrong Illinois
SPECIMEN. Date Morning/Afternoon. A Level Geography H481/01 Physical systems Sample Question Paper. Time allowed: 1 hour 30 minutes PMT
 Oxford Cambridge and RSA A Level Geography H481/01 Physical systems Sample Question Paper Date Morning/Afternoon Time allowed: 1 hour 30 minutes You must have: the Resource Booklet the OCR 12-page Answer
Plant Water Stress Frequency and Periodicity in Western North Dakota
 Plant Water Stress Frequency and Periodicity in Western North Dakota Llewellyn L. Manske PhD, Sheri Schneider, John A. Urban, and Jeffery J. Kubik Report DREC 10-1077 Range Research Program Staff North
LAB J - WORLD CLIMATE ZONES
 Introduction LAB J - WORLD CLIMATE ZONES The objective of this lab is to familiarize the student with the various climates around the world and the climate controls that influence these climates. Students
Exercise 6. Solar Panel Orientation EXERCISE OBJECTIVE DISCUSSION OUTLINE. Introduction to the importance of solar panel orientation DISCUSSION
 Exercise 6 Solar Panel Orientation EXERCISE OBJECTIVE When you have completed this exercise, you will understand how the solar illumination at any location on Earth varies over the course of a year. You
Simulations of Lake Processes within a Regional Climate Model
 Simulations of Lake Processes within a Regional Climate Model Jiming Jin Departments of Watershed Sciences and Plants, Soils, and Climate Utah State University, Logan, Utah Utah State University 850 Faculty