CliGen (Climate Generator) Addressing the Deficiencies in the Generator and its Databases William J Rust, Fred Fox & Larry Wagner
|
|
|
- Mitchell Nichols
- 5 years ago
- Views:
Transcription
1 CliGen (Climate Generator) Addressing the Deficiencies in the Generator and its Databases William J Rust, Fred Fox & Larry Wagner United States Department of Agriculture, Agricultural Research Service Engineering and Wind Erosion Research Unit Manhattan, Kansas USA Anchorage, AK ISELE September, 2011
2 CliGen Climate Generator What it is? What is it used for? History Problems/Deficiencies Solutions
3 CLIGEN What it is Stochastic weather generator mean + stdev * standard normal Produces daily estimates precipitation quantity, duration, time-to-peak, peak intensity temperature maximum, minimum, dew point solar radiation wind speed, direction
4 CLIGEN What it is Daily estimates are independent of other variables except: temperatures (Jan 2004) occurrence of precipitation for a single geographic point based on monthly statistics of historical data intended to match the monthly means and standard deviations of the historical data
5 Sample Cligen Output Station: ANDALUSIA AL CLIGEN VER Latitude Longitude Elevation (m) Obs. Years Beginning year Years da mo year prcp dur tp ip tmax tmin rad w-vl w-dir tdew (mm) (h) (C) (C) (l/d) (m/s)(deg) (C)
6 CLIGEN What is it for? Produces input files for downstream models where real data does not exist Allows stability testing of downstream models Allows parametric analysis for varying climates
7 CLIGEN History Based on generators for EPIC & SWRRB Circa: 1985 Developed initially for: Water Erosion Prediction Program (WEPP) Developed by: Arlin Nicks and Gene Gander USDA-ARS Durant, Oklahoma
8 CLIGEN History Last of Arlin Nick s changes (mid-1990 s) David Hall and Dayna Scheele (USDA-FS) addressed existing station data errors expanded number of U.S stations (1999) Bofu Yu (Griffith Univ. in Australia) addressed rainfall intensity issues (2000) Version 5.x
9 CLIGEN History Charles Myer (USDA-ARS) Addressed quality control of generated random numbers Added range checking to some parameters Added temperature correlation (2004) max daily temp min daily temp min daily temp dew pt temp Added several interpolation options attempting to address seasonal variations within a month none, linear, fourier, Yoder/Foster
10 Current Raw Data Inputs Daily precipitation, max and min temps 2590 stations (2718 with FS stations) data (9-117 yrs with 1100 having >44 yrs) Solar radiation, ½ hr maximum precipitation 142 stations (unknown origin of data) Time-to-peak distributions 1548 stations (unknown origin of original data) Dewpoint temperatures 273 stations (unknown origin of data) Wind 852 stations (unknown origin of data)
11 Updated Raw Data Inputs Problem Missing, unknown origin and/or dated input data Solution Update inputs with current data files available from NWS TD active stations and/or TD Fed stations Replaces original daily precipitation/temperature data files TD stations solar radiation data source (derive from terrestrial SR minus cloudiness) TD stations (1 min interval data) time-to-peak distributions (can be derived from data) dewpoint temperature (daily values can be computed) ½ hr max precipitation (can be derived from data) Cull stations/data based on defined quality controls minimum number years of data, missing/invalid data removed, etc. Generate new replacement parameter data files
12 Generator Issues Issues with interpolation methods K-S only tests normality of random numbers. Need randomness testing. For many stations: Poor solar radiation data Poor storm characteristics representation No correlation between most parameters
13 Updated Interpolation Problems Current interpolation procedures Don t match monthly means Linear & Fourier methods Discontinuities within months Linear & Yoder/Foster (YF) Solution New interpolation procedure Rust/Fox Fourier (RFF) Matches monthly mean values Eliminates discontinuities within months Does not interpolate monthly SD values Potential future improvement Remove seasonal cycle from monthly SD
14 Degrees Updated Interpolation Max Temp Means - Springfield, CO June - August No Interp Linear Fourier YF RFF Days
15 Stochastic Generation Update Problem Generated random number series not passing statistical means tests K-S tests for normality, but means testing more important Solution Guarantee zero mean for random deviates (-1,1) Generate half of random number deviates needed Fold (negative) deviate series values Mix folded deviates with original series
16 Solar Radiation Update Problem Limited station data (143) Causes interpolation issues (Yap Island vs CA coastal locations) Long daylight days (AK) Proposed Solutions Expand data set (TD stations) Determine suitability of station data for interpolation usage manually or within code
17 Solar Radiation Update YAP ISLAND OBS YAP ISLAND CAL JAN FEB MAR APR MAY JUN JUL AUG SEP OCT NOV DEC
18 Precipitation Update Problems Distribution of precipitation quantities doesn t match measured data for many locations Impacts plant growth response and water erosion Description of a storm needs improvement Directly impacts water erosion estimates Simple one size fits all functional relationships between storm duration, intensity and quantity of precipitation Multiple local peak storm intensities not simulated Distribution of storm durations not well reflected
19 Inches Weibull Precipitation 1 Princeton, IN August Precipitation PDF (M.52, SD.69, S 5.87) Calculated Actual Probability
20 Inches Weibull Precipitation 2 Waikamoi, HI August Precipitation PDF (M.27, SD.80, S 9.01) Calculated Actual Probability
21 Precipitation Update Proposed Solution Use ASOS one-minute data to create histograms for storm amount Create statistical storm descriptions of bands and breaks within individual storms Generate break-point descriptions of daily storms Remove time-to-peak, duration and intensity from output file
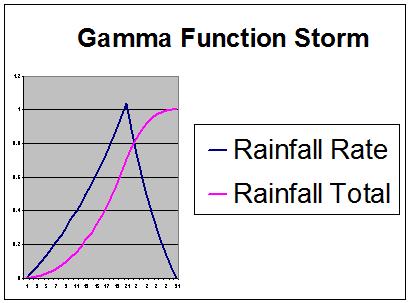
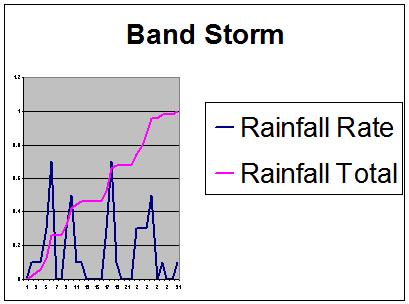
22 Storm Description
23 Correlation Update Problem Non-correlation among most parameters (except Tmax, Tmin and dewpoint) Possible (Partial) Solution Use GEM code for generating correlated params (Tmax, Tmin, precipitation quantity & dewpoint) Solar radiation and wind correlation not completed Precipitation time-to-peak, intensity and duration not even conceptualized within GEM project
24 Future Finish the Java version Develop and use serial correlation tests to assess quality of generated files Finish development of band storm model Convert more international data for use
25 Comments/Questions?
Validation of the Weather Generator CLIGEN with Precipitation Data from Uganda. W. J. Elliot C. D. Arnold 1
 Validation of the Weather Generator CLIGEN with Precipitation Data from Uganda W. J. Elliot C. D. Arnold 1 9/19/00 ABSTRACT. Precipitation records from highland and central plains sites in Uganda were
Format of CLIGEN weather station statistics input files. for CLIGEN versions as of 6/2001 (D.C. Flanagan).
.") Format of CLIGEN weather station statistics input files for CLIGEN versions 4.1-5.1 as of 6/2001 (D.C. Flanagan). updated 12/11/2008 - Jim Frankenberger These files are also known as CLIGEN state files
Format of CLIGEN weather station statistics input files for CLIGEN versions 4.1-5.1 as of 6/2001 (D.C. Flanagan). updated 12/11/2008 - Jim Frankenberger These files are also known as CLIGEN state files
Climatography of the United States No
 Climate Division: AK 5 NWS Call Sign: ANC Month (1) Min (2) Month(1) Extremes Lowest (2) Temperature ( F) Lowest Month(1) Degree s (1) Base Temp 65 Heating Cooling 90 Number of s (3) Jan 22.2 9.3 15.8
The Climate of Bryan County
 The Climate of Bryan County Bryan County is part of the Crosstimbers throughout most of the county. The extreme eastern portions of Bryan County are part of the Cypress Swamp and Forest. Average annual
Jackson County 2013 Weather Data
 Jackson County 2013 Weather Data 61 Years of Weather Data Recorded at the UF/IFAS Marianna North Florida Research and Education Center Doug Mayo Jackson County Extension Director 1952-2008 Rainfall Data
Changing Hydrology under a Changing Climate for a Coastal Plain Watershed
 Changing Hydrology under a Changing Climate for a Coastal Plain Watershed David Bosch USDA-ARS, Tifton, GA Jeff Arnold ARS Temple, TX and Peter Allen Baylor University, TX SEWRU Objectives 1. Project changes
The Climate of Payne County
 The Climate of Payne County Payne County is part of the Central Great Plains in the west, encompassing some of the best agricultural land in Oklahoma. Payne County is also part of the Crosstimbers in the
The Climate of Kiowa County
 The Climate of Kiowa County Kiowa County is part of the Central Great Plains, encompassing some of the best agricultural land in Oklahoma. Average annual precipitation ranges from about 24 inches in northwestern
Climatography of the United States No
 Climate Division: CA 5 NWS Call Sign: Elevation: 6 Feet Lat: 37 Month (1) Min (2) Month(1) Extremes Lowest (2) Temperature ( F) Lowest Month(1) Degree s (1) Base Temp 65 Heating Cooling 1 Number of s (3)
Climatography of the United States No
 Climate Division: CA 4 NWS Call Sign: Elevation: 2 Feet Lat: 37 Month (1) Min (2) Month(1) Extremes Lowest (2) Temperature ( F) Lowest Month(1) Degree s (1) Base Temp 65 Heating Cooling 1 Number of s (3)
Climatography of the United States No
 Climate Division: CA 4 NWS Call Sign: Elevation: 13 Feet Lat: 36 Month (1) Min (2) Month(1) Extremes Lowest (2) Temperature ( F) Lowest Month(1) Degree s (1) Base Temp 65 Heating Cooling 1 Number of s
Climatography of the United States No
 Climate Division: CA 5 NWS Call Sign: Elevation: 1,14 Feet Lat: 36 Month (1) Min (2) Month(1) Extremes Lowest (2) Temperature ( F) Lowest Month(1) Degree s (1) Base Temp 65 Heating Cooling 1 Number of
The Climate of Marshall County
 The Climate of Marshall County Marshall County is part of the Crosstimbers. This region is a transition region from the Central Great Plains to the more irregular terrain of southeastern Oklahoma. Average
APPENDIX G-7 METEROLOGICAL DATA
 APPENDIX G-7 METEROLOGICAL DATA METEOROLOGICAL DATA FOR AIR AND NOISE SAMPLING DAYS AT MMR Monthly Normals and Extremes for Honolulu International Airport Table G7-1 MMR RAWS Station Hourly Data Tables
Jackson County 2018 Weather Data 67 Years of Weather Data Recorded at the UF/IFAS Marianna North Florida Research and Education Center
 Jackson County 2018 Weather Data 67 Years of Weather Data Recorded at the UF/IFAS Marianna North Florida Research and Education Center Doug Mayo Jackson County Extension Director 1952-2008 Rainfall Data
Climatography of the United States No
 Climate Division: CA 6 NWS Call Sign: LAX Elevation: 1 Feet Lat: 33 Month (1) Min (2) Month(1) Extremes Lowest (2) Temperature ( F) Lowest Month(1) Degree s (1) Base Temp 65 Heating Cooling 1 Number of
Climatography of the United States No
 Climate Division: CA 6 NWS Call Sign: TOA Elevation: 11 Feet Lat: 33 2W Temperature ( F) Month (1) Min (2) Month(1) Extremes Lowest (2) Lowest Month(1) Degree s (1) Base Temp 65 Heating Cooling 1 Number
Jackson County 2014 Weather Data
 Jackson County 2014 Weather Data 62 Years of Weather Data Recorded at the UF/IFAS Marianna North Florida Research and Education Center Doug Mayo Jackson County Extension Director 1952-2008 Rainfall Data
United States Climate
 25-1 Alabama Annual Average Temperature Data Source: http://www.wrcc.dri.edu/cgi-bin/divplot1_form.pl?0106 25-2 How does climate vary as we traverse the U.S. along 40 N? 25-3 Average Temperature Along
The Climate of Pontotoc County
 The Climate of Pontotoc County Pontotoc County is part of the Crosstimbers. This region is a transition region from the Central Great Plains to the more irregular terrain of southeast Oklahoma. Average
Climatography of the United States No
 Climate Division: CA 4 NWS Call Sign: Month (1) Min (2) Month(1) Extremes Lowest (2) Temperature ( F) Lowest Month(1) Degree s (1) Base Temp 65 Heating Cooling 100 Number of s (3) Jan 55.6 39.3 47.5 77
Climatography of the United States No
 Climate Division: CA 5 NWS Call Sign: Month (1) Min (2) Month(1) Extremes Lowest (2) Temperature ( F) Lowest Month(1) Degree s (1) Base Temp 65 Heating Cooling 100 Number of s (3) Jan 56.6 36.5 46.6 81
Climatography of the United States No
 Climate Division: CA 1 NWS Call Sign: Month (1) Min (2) Month(1) Extremes Lowest (2) Temperature ( F) Lowest Month(1) Degree s (1) Base Temp 65 Heating Cooling 100 Number of s (3) Jan 57.9 38.9 48.4 85
Climatography of the United States No
 Climate Division: CA 5 NWS Call Sign: Month (1) Min (2) Month(1) Extremes Lowest (2) Temperature ( F) Lowest Month(1) Degree s (1) Base Temp 65 Heating Cooling 100 Number of s (3) Jan 44.8 25.4 35.1 72
Climatography of the United States No
 Climate Division: CA 4 NWS Call Sign: Month (1) Min (2) Month(1) Extremes Lowest (2) Temperature ( F) Lowest Month(1) Degree s (1) Base Temp 65 Heating Cooling 100 Number of s (3) Jan 49.4 37.5 43.5 73
Climatography of the United States No
 Climate Division: CA 6 NWS Call Sign: Month (1) Min (2) Month(1) Extremes Lowest (2) Temperature ( F) Lowest Month(1) Degree s (1) Base Temp 65 Heating Cooling 100 Number of s (3) Jan 69.4 46.6 58.0 92
Climatography of the United States No
 Climate Division: CA 6 NWS Call Sign: Month (1) Min (2) Month(1) Extremes Lowest (2) Temperature ( F) Lowest Month(1) Degree s (1) Base Temp 65 Heating Cooling 1 Number of s (3) Jan 67.5 42. 54.8 92 1971
Climatography of the United States No
 Climate Division: CA 4 NWS Call Sign: Month (1) Min (2) Month(1) Extremes Lowest (2) Temperature ( F) Lowest Month(1) Degree s (1) Base Temp 65 Heating Cooling 1 Number of s (3) Jan 58.5 38.8 48.7 79 1962
Climatography of the United States No
 Climate Division: CA 1 NWS Call Sign: Month (1) Min (2) Month(1) Extremes Lowest (2) Temperature ( F) Lowest Month(1) Degree s (1) Base Temp 65 Heating Cooling 1 Number of s (3) Jan 57.8 39.5 48.7 85 1962
The Climate of Grady County
 The Climate of Grady County Grady County is part of the Central Great Plains, encompassing some of the best agricultural land in Oklahoma. Average annual precipitation ranges from about 33 inches in northern
Variability of Reference Evapotranspiration Across Nebraska
 Know how. Know now. EC733 Variability of Reference Evapotranspiration Across Nebraska Suat Irmak, Extension Soil and Water Resources and Irrigation Specialist Kari E. Skaggs, Research Associate, Biological
Climatography of the United States No
 Climate Division: ND 8 NWS Call Sign: BIS Month (1) Min (2) Month(1) Extremes Lowest (2) Temperature ( F) Lowest Month(1) Degree s (1) Base Temp 65 Heating Cooling 100 Number of s (3) Jan 21.1 -.6 10.2
Climatography of the United States No
 Climate Division: TN 1 NWS Call Sign: Month (1) Min (2) Month(1) Extremes Lowest (2) Temperature ( F) Lowest Month(1) Degree s (1) Base Temp 65 Heating Cooling 100 Number of s (3) Jan 47.6 24.9 36.3 81
Climatography of the United States No
 Climate Division: CA 5 NWS Call Sign: FAT Month (1) Min (2) Month(1) Extremes Lowest (2) Temperature ( F) Lowest Month(1) Degree s (1) Base Temp 65 Heating Cooling 1 Number of s (3) Jan 53.6 38.4 46. 78
Climatography of the United States No
 Climate Division: CA 6 NWS Call Sign: 1L2 N Lon: 118 3W Month (1) Min (2) Month(1) Extremes Lowest (2) Temperature ( F) Lowest Month(1) Degree s (1) Base Temp 65 Heating Cooling 1 Number of s (3) Jan 63.7
Climatography of the United States No
 Climate Division: CA 5 NWS Call Sign: BFL Month (1) Min (2) Month(1) Extremes Lowest (2) Temperature ( F) Lowest Month(1) Degree s (1) Base Temp 65 Heating Cooling 1 Number of s (3) Jan 56.3 39.3 47.8
Climatography of the United States No
 No. 2 1971-2 Asheville, North Carolina 2881 COOP ID: 46175 Climate Division: CA 6 NWS Call Sign: 3L3 Elevation: 1 Feet Lat: 33 Month (1) Min (2) Month(1) Extremes Lowest (2) Temperature ( F) Lowest Month(1)
Climatography of the United States No
 No. 2 1971-2 Asheville, North Carolina 2881 COOP ID: 42713 Climate Division: CA 7 NWS Call Sign: Elevation: -3 Feet Lat: 32 Month (1) Min (2) Month(1) Extremes Lowest (2) Temperature ( F) Lowest Month(1)
The Climate of Seminole County
 The Climate of Seminole County Seminole County is part of the Crosstimbers. This region is a transition region from the Central Great Plains to the more irregular terrain of southeastern Oklahoma. Average
The Climate of Murray County
 The Climate of Murray County Murray County is part of the Crosstimbers. This region is a transition between prairies and the mountains of southeastern Oklahoma. Average annual precipitation ranges from
Climatography of the United States No
 Climate Division: TN 3 NWS Call Sign: BNA Month (1) Min (2) Month(1) Extremes Lowest (2) Temperature ( F) Lowest Month(1) Degree s (1) Base Temp 65 Heating Cooling 100 Number of s (3) Jan 45.6 27.9 36.8
The Climate of Haskell County
 The Climate of Haskell County Haskell County is part of the Hardwood Forest. The Hardwood Forest is characterized by its irregular landscape and the largest lake in Oklahoma, Lake Eufaula. Average annual
The Climate of Texas County
 The Climate of Texas County Texas County is part of the Western High Plains in the north and west and the Southwestern Tablelands in the east. The Western High Plains are characterized by abundant cropland
2003 Water Year Wrap-Up and Look Ahead
 2003 Water Year Wrap-Up and Look Ahead Nolan Doesken Colorado Climate Center Prepared by Odie Bliss http://ccc.atmos.colostate.edu Colorado Average Annual Precipitation Map South Platte Average Precipitation
Climatography of the United States No
 Month (1) Min (2) Month(1) Extremes Lowest (2) Temperature ( F) Lowest Month(1) Degree s (1) Base Temp 65 Heating Cooling 100 Number of s (3) Jan 63.9 39.3 51.6 86 1976 16 56.6 1986 20 1976 2 47.5 1973
Climatography of the United States No
 Temperature ( F) Month (1) Min (2) Month(1) Extremes Lowest (2) Lowest Month(1) Degree s (1) Base Temp 65 Heating Cooling 100 Number of s (3) Jan 32.8 21.7 27.3 62 1918 1 35.8 1983-24 1950 29 10.5 1979
Climatography of the United States No
 No. 2 1971-2 Asheville, North Carolina 2881 COOP ID: 46646 Climate Division: CA 4 NWS Call Sign: 8W Month (1) Min (2) Month(1) Extremes Lowest (2) Temperature ( F) Lowest Month(1) Degree s (1) Base Temp
Climatography of the United States No
 No. 2 1971-2 Asheville, North Carolina 2881 COOP ID: 4792 Climate Division: CA 6 NWS Call Sign: Month (1) Min (2) Month(1) Extremes Lowest (2) Temperature ( F) Lowest Month(1) Degree s (1) Base Temp 65
Climatography of the United States No
 Climate Division: CA 6 NWS Call Sign: Month (1) Min (2) Month(1) Extremes Lowest (2) Temperature ( F) Lowest Month(1) Degree s (1) Base Temp 65 Heating Cooling 100 Number of s (3) Jan 51.5 35.0 43.3 80
Climatography of the United States No
 Climate Division: CA 1 NWS Call Sign: Month (1) Min (2) Month(1) Extremes Lowest (2) Temperature ( F) Lowest Month(1) Degree s (1) Base Temp 65 Heating Cooling 100 Number of s (3) Jan 52.4 35.4 43.9 69
Climatography of the United States No
 Climate Division: CA 4 NWS Call Sign: Month (1) Min (2) Month(1) Extremes Lowest (2) Temperature ( F) Lowest Month(1) Degree s (1) Base Temp 65 Heating Cooling 100 Number of s (3) Jan 61.9 42.0 52.0 89
Climatography of the United States No
 Climate Division: CA 2 NWS Call Sign: Month (1) Min (2) Month(1) Extremes Lowest (2) Temperature ( F) Lowest Month(1) Degree s (1) Base Temp 65 Heating Cooling 100 Number of s (3) Jan 55.6 38.8 47.2 81
Climatography of the United States No
 Climate Division: CA 2 NWS Call Sign: Month (1) Min (2) Month(1) Extremes Lowest (2) Temperature ( F) Lowest Month(1) Degree s (1) Base Temp 65 Heating Cooling 100 Number of s (3) Jan 53.5 37.6 45.6 78
Climatography of the United States No
 Climate Division: CA 6 NWS Call Sign: Month (1) Min (2) Month(1) Extremes Lowest (2) Temperature ( F) Lowest Month(1) Degree s (1) Base Temp 65 Heating Cooling 100 Number of s (3) Jan 66.1 38.3 52.2 91
Climatography of the United States No
 Climate Division: CA 1 NWS Call Sign: Month (1) Min (2) Month(1) Extremes Lowest (2) Temperature ( F) Lowest Month(1) Degree s (1) Base Temp 65 Heating Cooling 1 Number of s (3) Jan 56.2 4.7 48.5 79 1962
Climatography of the United States No
 Climate Division: CA 1 NWS Call Sign: Month (1) Min (2) Month(1) Extremes Lowest (2) Temperature ( F) Lowest Month(1) Degree s (1) Base Temp 65 Heating Cooling 100 Number of s (3) Jan 50.2 31.2 40.7 65+
Climatography of the United States No
 Climate Division: CA 4 NWS Call Sign: Month (1) Min (2) Month(1) Extremes Lowest (2) Temperature ( F) Lowest Month(1) Degree s (1) Base Temp 65 Heating Cooling 100 Number of s (3) Jan 61.4 33.1 47.3 82+
Climatography of the United States No
 Climate Division: CA 5 NWS Call Sign: Month (1) Min (2) Month(1) Extremes Lowest (2) Temperature ( F) Lowest Month(1) Degree s (1) Base Temp 65 Heating Cooling 100 Number of s (3) 59.3 31.5 45.4 80 1976
Climatography of the United States No
 Climate Division: CA 7 NWS Call Sign: Month (1) Min (2) Month(1) Extremes Lowest (2) Temperature ( F) Lowest Month(1) Degree s (1) Base Temp 65 Heating Cooling 100 Number of s (3) 44.5 29.3 36.9 69 1951
Climatography of the United States No
 Climate Division: CA 2 NWS Call Sign: Month (1) Min (2) Month(1) Extremes Lowest (2) Temperature ( F) Lowest Month(1) Degree s (1) Base Temp 65 Heating Cooling 100 Number of s (3) 53.3 37.1 45.2 77 1962
Climatography of the United States No
 Climate Division: CA 2 NWS Call Sign: Month (1) Min (2) Month(1) Extremes Lowest (2) Temperature ( F) Lowest Month(1) Degree s (1) Base Temp 65 Heating Cooling 100 Number of s (3) 53.3 31.8 42.6 74+ 1975
Climatography of the United States No
 Climate Division: CA 2 NWS Call Sign: Month (1) Min (2) Month(1) Extremes Lowest (2) Temperature ( F) Lowest Month(1) Degree s (1) Base Temp 65 Heating Cooling 100 Number of s (3) 53.7 32.7 43.2 79 1962
Climatography of the United States No
 Climate Division: CA 6 NWS Call Sign: Month (1) Min (2) Month(1) Extremes Lowest (2) Temperature ( F) Lowest Month(1) Degree s (1) Base Temp 65 Heating Cooling 100 Number of s (3) 68.5 45.7 57.1 90 1971
Climatography of the United States No
 Climate Division: CA 7 NWS Call Sign: Month (1) Min (2) Month(1) Extremes Lowest (2) Temperature ( F) Lowest Month(1) Degree s (1) Base Temp 65 Heating Cooling 100 Number of s (3) 56.0 35.7 45.9 83 1975
Climatography of the United States No
 Climate Division: CA 7 NWS Call Sign: Month (1) Min (2) Month(1) Extremes Lowest (2) Temperature ( F) Lowest Month(1) Degree s (1) Base Temp 65 Heating Cooling 1 Number of s (3) 64.8 45.4 55.1 85 1971
Climatography of the United States No
 Climate Division: CA 7 NWS Call Sign: Month (1) Min (2) Month(1) Extremes Lowest (2) Temperature ( F) Lowest Month(1) Degree s (1) Base Temp 65 Heating Cooling 1 Number of s (3) 65.5 38.7 52.1 87 1962
Climatography of the United States No
 Climate Division: CA 7 NWS Call Sign: Month (1) Min (2) Month(1) Extremes Lowest (2) Temperature ( F) Lowest Month(1) Degree s (1) Base Temp 65 Heating Cooling 100 Number of s (3) 58.8 34.3 46.6 81+ 1948
Climatography of the United States No
 Climate Division: CA 7 NWS Call Sign: Month (1) Min (2) Month(1) Extremes Lowest (2) Temperature ( F) Lowest Month(1) Degree s (1) Base Temp 65 Heating Cooling 100 Number of s (3) 70.4 44.2 57.3 95 1971
Climatography of the United States No
 No. 2 1971-2 Asheville, North Carolina 2881 COOP ID: 43417 Climate Division: CA 4 NWS Call Sign: N Lon: 121 Month (1) Min (2) Month(1) Extremes Lowest (2) Temperature ( F) Lowest Month(1) Degree s (1)
Climatography of the United States No
 Climate Division: CA 7 NWS Call Sign: Month (1) Min (2) Month(1) Extremes Lowest (2) Temperature ( F) Lowest Month(1) Degree s (1) Base Temp 65 Heating Cooling 100 Number of s (3) Jan 54.4 36.9 45.7 77+
Climatography of the United States No
 Climate Division: CA 4 NWS Call Sign: Month (1) Min (2) Month(1) Extremes Lowest (2) Temperature ( F) Lowest Month(1) Degree s (1) Base Temp 65 Heating Cooling 100 Number of s (3) Jan 56.4 43.6 50.0 77
Climatography of the United States No
 No. 2 1971-2 Asheville, North Carolina 2881 COOP ID: 4795 Climate Division: CA 6 NWS Call Sign: SBA Month (1) Min (2) Month(1) Extremes Lowest (2) Temperature ( F) Lowest Month(1) Degree s (1) Base Temp
Climatography of the United States No
 Climate Division: SC 7 NWS Call Sign: CHS Month (1) Min (2) Month(1) Extremes Lowest (2) Temperature ( F) Lowest Month(1) Degree s (1) Base Temp 65 Heating Cooling 100 Number of s (3) Jan 58.9 36.9 47.9
GAMINGRE 8/1/ of 7
 FYE 09/30/92 JULY 92 0.00 254,550.00 0.00 0 0 0 0 0 0 0 0 0 254,550.00 0.00 0.00 0.00 0.00 254,550.00 AUG 10,616,710.31 5,299.95 845,656.83 84,565.68 61,084.86 23,480.82 339,734.73 135,893.89 67,946.95
Utilization of seasonal climate predictions for application fields Yonghee Shin/APEC Climate Center Busan, South Korea
 The 20 th AIM International Workshop January 23-24, 2015 NIES, Japan Utilization of seasonal climate predictions for application fields Yonghee Shin/APEC Climate Center Busan, South Korea Background Natural
Chiang Rai Province CC Threat overview AAS1109 Mekong ARCC
 Chiang Rai Province CC Threat overview AAS1109 Mekong ARCC This threat overview relies on projections of future climate change in the Mekong Basin for the period 2045-2069 compared to a baseline of 1980-2005.
Colorado s 2003 Moisture Outlook
 Colorado s 2003 Moisture Outlook Nolan Doesken and Roger Pielke, Sr. Colorado Climate Center Prepared by Tara Green and Odie Bliss http://climate.atmos.colostate.edu How we got into this drought! Fort
Climatography of the United States No
 Month (1) Min (2) Month(1) Extremes Lowest (2) Temperature ( F) Lowest Month(1) Degree s (1) Base Temp 65 Heating Cooling 100 Number of s (3) 42.6 24.2 33.4 79 1950 25 44.2 1974-16 1994 19 18.8 1977 977
Jackson County 2019 Weather Data 68 Years of Weather Data Recorded at the UF/IFAS Marianna North Florida Research and Education Center
 Jackson County 2019 Weather Data 68 Years of Weather Data Recorded at the UF/IFAS Marianna North Florida Research and Education Center Doug Mayo Jackson County Extension Director 1952-2008 Rainfall Data
LOCAL CLIMATOLOGICAL DATA Monthly Summary September 2016
 Deg. Days Precip Ty Precip Wind Solar Hu- Adj. to Sea Level mid- ity Avg Res Res Peak 2 Minute 1 fog 2 hvy fog 3 thunder 4 ice plt 5 hail 6 glaze 7 duststm 8 smk, hz 9 blw snw 1 2 3 4A 4B 5 6 7 8 9 11
Climatography of the United States No
 Month (1) Min (2) Month(1) Extremes Lowest (2) Temperature ( F) Lowest Month(1) Degree s (1) Base Temp 65 Heating Cooling 100 Number of s (3) Jan 54.3 40.1 47.2 75 1998 17 53.0 1995 18 1949 11 41.7 1972
Local Ctimatotogical Data Summary White Hall, Illinois
 SWS Miscellaneous Publication 98-5 STATE OF ILLINOIS DEPARTMENT OF ENERGY AND NATURAL RESOURCES Local Ctimatotogical Data Summary White Hall, Illinois 1901-1990 by Audrey A. Bryan and Wayne Armstrong Illinois
2016 Meteorology Summary
 2016 Meteorology Summary New Jersey Department of Environmental Protection AIR POLLUTION AND METEOROLOGY Meteorology plays an important role in the distribution of pollution throughout the troposphere,
CLIMATE OVERVIEW. Thunder Bay Climate Overview Page 1 of 5
 CLIMATE OVERVIEW The climate in the Thunder Bay area is typical of a mid-latitude inland location with a Great Lake Moderating influence. The moderating effect of Lake Superior results in cooler summer
CoCoRaHS Monitoring Colorado s s Water Resources through Community Collaborations
 CoCoRaHS Monitoring Colorado s s Water Resources through Community Collaborations Nolan Doesken Colorado Climate Center Atmospheric Science Department Colorado State University Presented at Sustaining
LOCAL CLIMATOLOGICAL DATA Monthly Summary July 2013
 Deg. Days Precip Ty Precip Wind Solar Hu- Adj. to Sea Level mid- ity Avg Res Res Peak Minute 1 fog 2 hvy fog 3 thunder 4 ice plt 5 hail 6 glaze 7 duststm 8 smk, hz 9 blw snw 1 2 3 4A 4B 5 6 7 8 9 12 14
Champaign-Urbana 1999 Annual Weather Summary
 Champaign-Urbana 1999 Annual Weather Summary ILLINOIS STATE WATER SURVEY 2204 Griffith Dr. Champaign, IL 61820 wxobsrvr@sws.uiuc.edu Maria Peters, Weather Observer A major snowstorm kicked off the new
Regents Earth Science Unit 7: Water Cycle and Climate
 Regents Earth Science Unit 7: Water Cycle and Climate Name Section Coastal and Continental Temperature Ranges Lab # Introduction: There are large variations in average monthly temperatures among cities
Drought in Southeast Colorado
 Drought in Southeast Colorado Nolan Doesken and Roger Pielke, Sr. Colorado Climate Center Prepared by Tara Green and Odie Bliss http://climate.atmos.colostate.edu 1 Historical Perspective on Drought Tourism
Ultra-High Resolution Time Traveling AgMet Information from Seeding to Harvesting
 Ultra-High Resolution Time Traveling AgMet Information from Seeding to Harvesting - seamless data for prospect estimation of crop yields - Dec. 5, 2016 Jai-ho Oh & Kyung-Min Choi Dept. Env. & Atmos. Sci.,
2003 Moisture Outlook
 2003 Moisture Outlook Nolan Doesken and Roger Pielke, Sr. Colorado Climate Center Prepared by Tara Green and Odie Bliss http://climate.atmos.colostate.edu Through 1999 Through 1999 Fort Collins Total Water
Appendix C. AMEC Evaluation of Zuni PPIW. Appendix C. Page C-1 of 34
 AMEC s Independent Estimate of PPIW Crop Water Use Using the ASCE Standardized Reference Evapotranspiration via Gridded Meteorological Data, and Estimation of Crop Coefficients, and Net Annual Diversions
The Climate of Oregon Climate Zone 5 High Plateau
 105 E55 Unbound issue i". 9 13oes not circulate CZe Special Report 917 May 1993 The Climate of Oregon Climate Zone 5 Property of OREGON STATE UNIVERSITY Library Serials Corvallis, OR 97331-4503 Agricultural
Champaign-Urbana 2001 Annual Weather Summary
 Champaign-Urbana 2001 Annual Weather Summary ILLINOIS STATE WATER SURVEY 2204 Griffith Dr. Champaign, IL 61820 wxobsrvr@sws.uiuc.edu Maria Peters, Weather Observer January: After a cold and snowy December,
Table of Contents. Page
 Eighteen Years (1990 2007) of Climatological Data on NMSU s Corona Range and Livestock Research Center Research Report 761 L. Allen Torell, Kirk C. McDaniel, Shad Cox, Suman Majumdar 1 Agricultural Experiment
Promoting Rainwater Harvesting in Caribbean Small Island Developing States Water Availability Mapping for Grenada Preliminary findings
 Promoting Rainwater Harvesting in Caribbean Small Island Developing States Water Availability Mapping for Grenada Preliminary findings National Workshop Pilot Project funded by The United Nations Environment
Comparison of meteorological data from different sources for Bishkek city, Kyrgyzstan
 Comparison of meteorological data from different sources for Bishkek city, Kyrgyzstan Ruslan Botpaev¹*, Alaibek Obozov¹, Janybek Orozaliev², Christian Budig², Klaus Vajen², 1 Kyrgyz State Technical University,
Global Climates. Name Date
 Global Climates Name Date No investigation of the atmosphere is complete without examining the global distribution of the major atmospheric elements and the impact that humans have on weather and climate.
Weather and Climate of the Rogue Valley By Gregory V. Jones, Ph.D., Southern Oregon University
 Weather and Climate of the Rogue Valley By Gregory V. Jones, Ph.D., Southern Oregon University The Rogue Valley region is one of many intermountain valley areas along the west coast of the United States.
LOCAL CLIMATOLOGICAL DATA Monthly Summary November 2006
 Deg. Days Precip Ty Precip Wind Sun Hu- Adj. to Sea Level mid- ity Avg Res Res Peak Minute 1 fog 2 hvy fog 3 thunder 4 ice plt 5 hail 6 glaze 7 duststm 8 smk, hz 9 blw snw 1 2 3 4A 4B 5 6 7 8 9 12 14 15