CAMARGO RANCH, llc. CRAIG BUFORD BufordResources.com
|
|
|
- Sara Young
- 6 years ago
- Views:
Transcription


1 CAMARGO RANCH, llc /- acre Wheat & Cattle Farm Mangum, greer county, oklahoma CRAIG BUFORD BufordResources.com


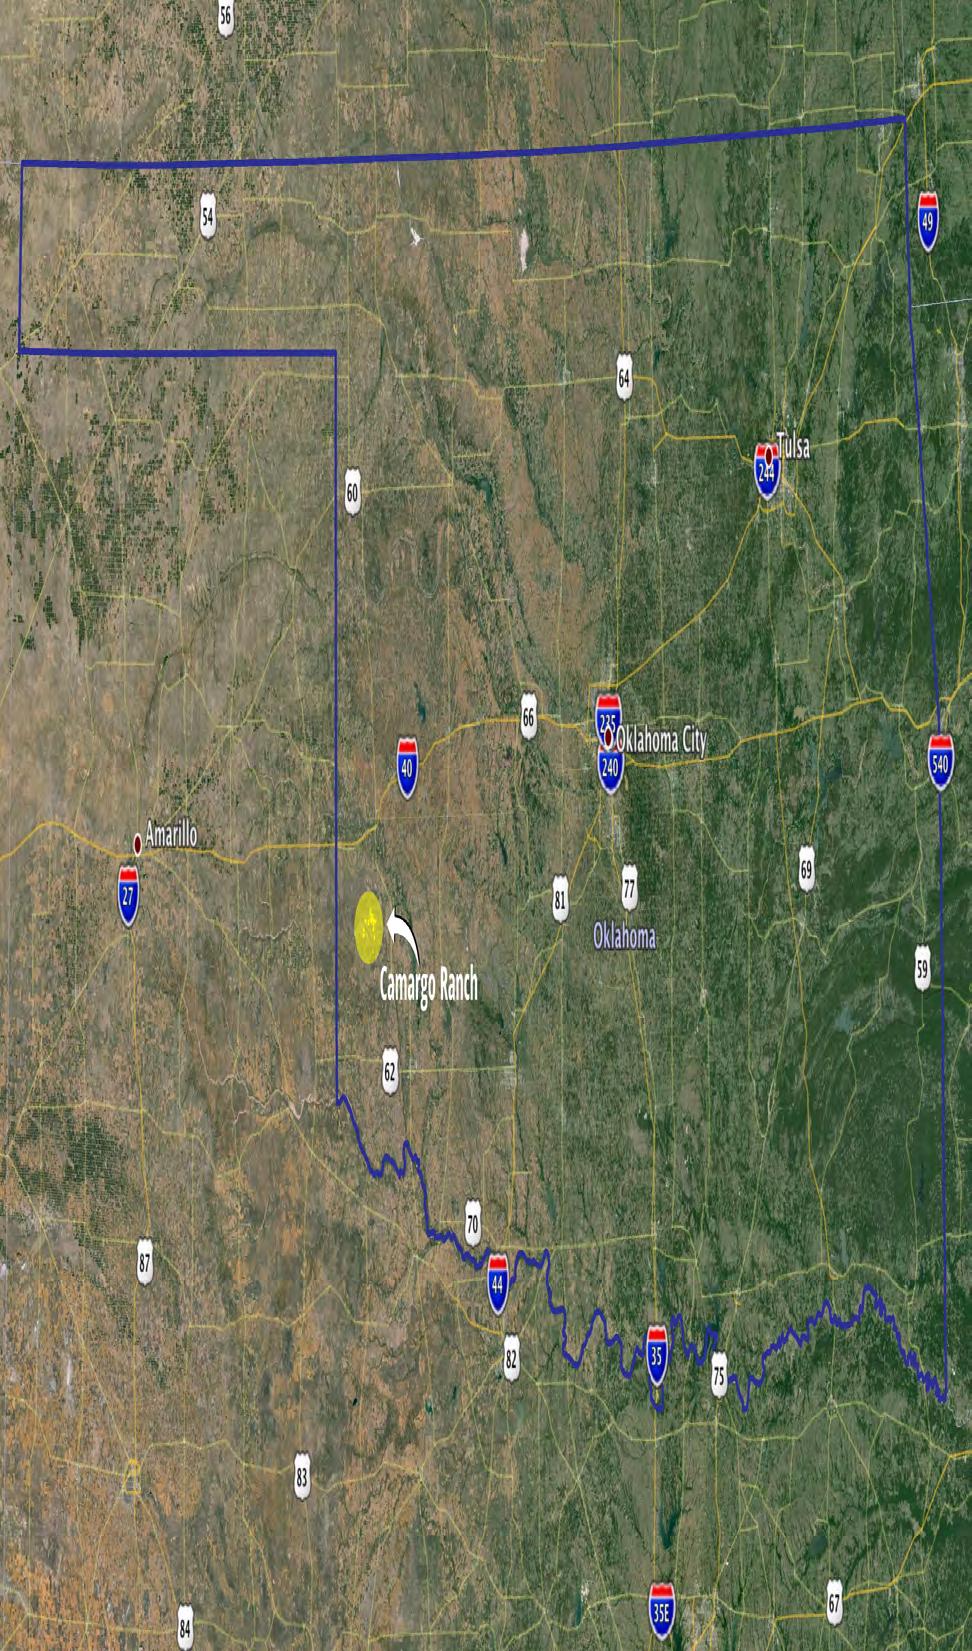
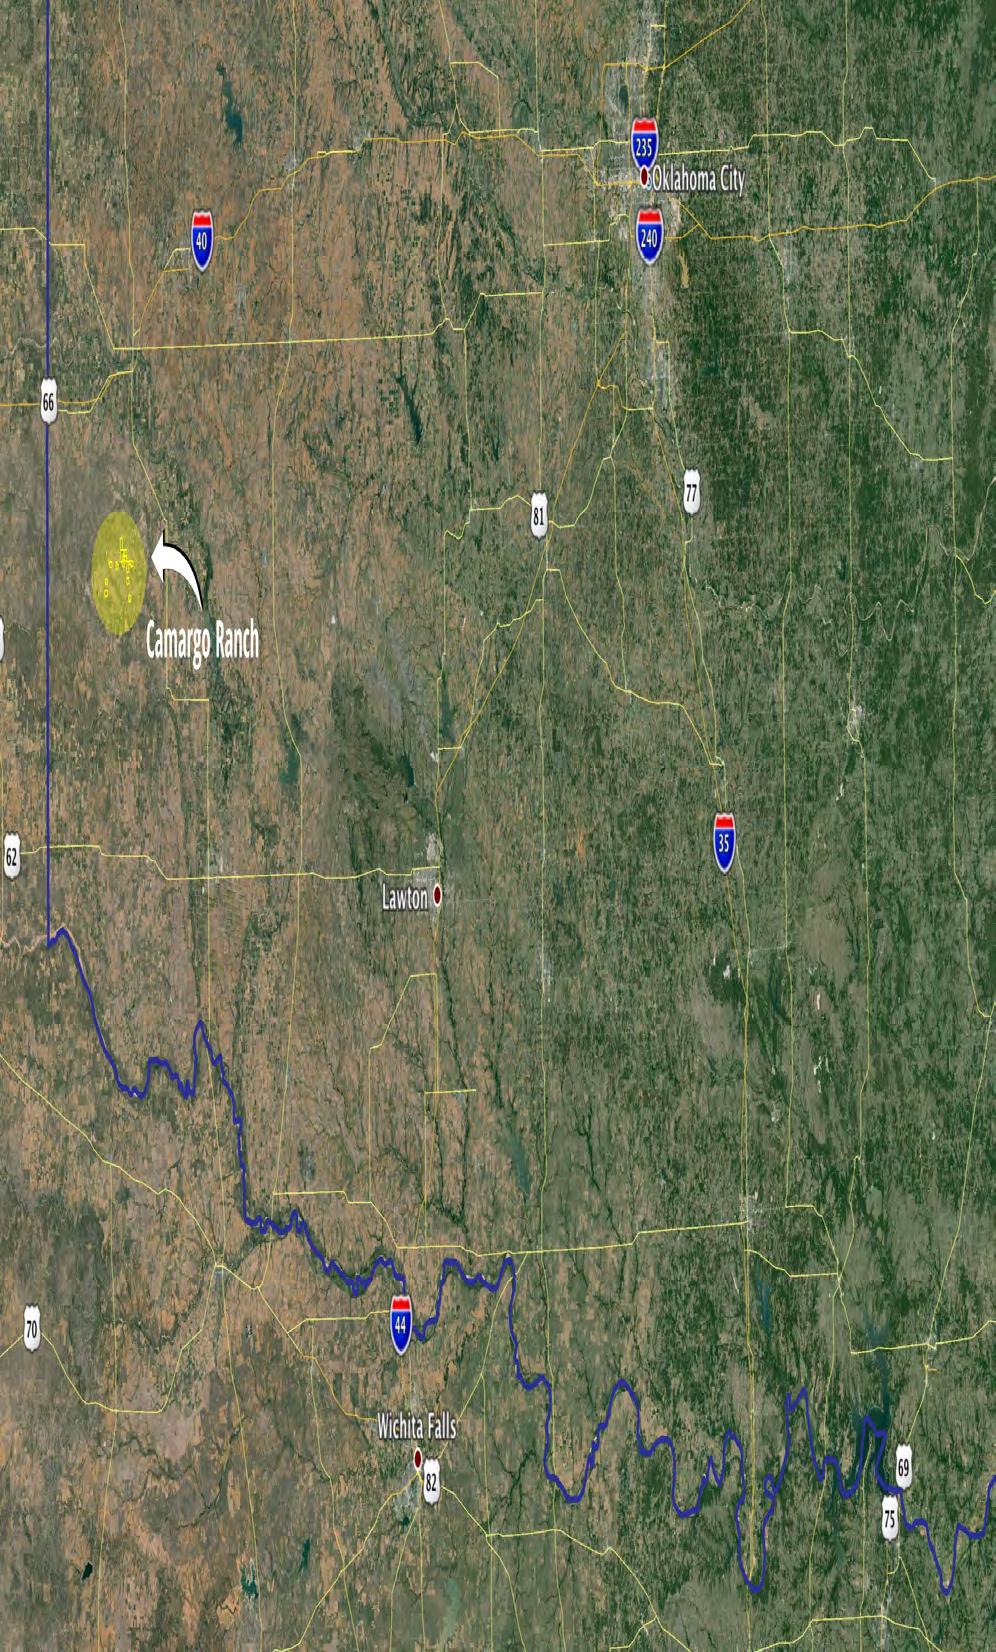
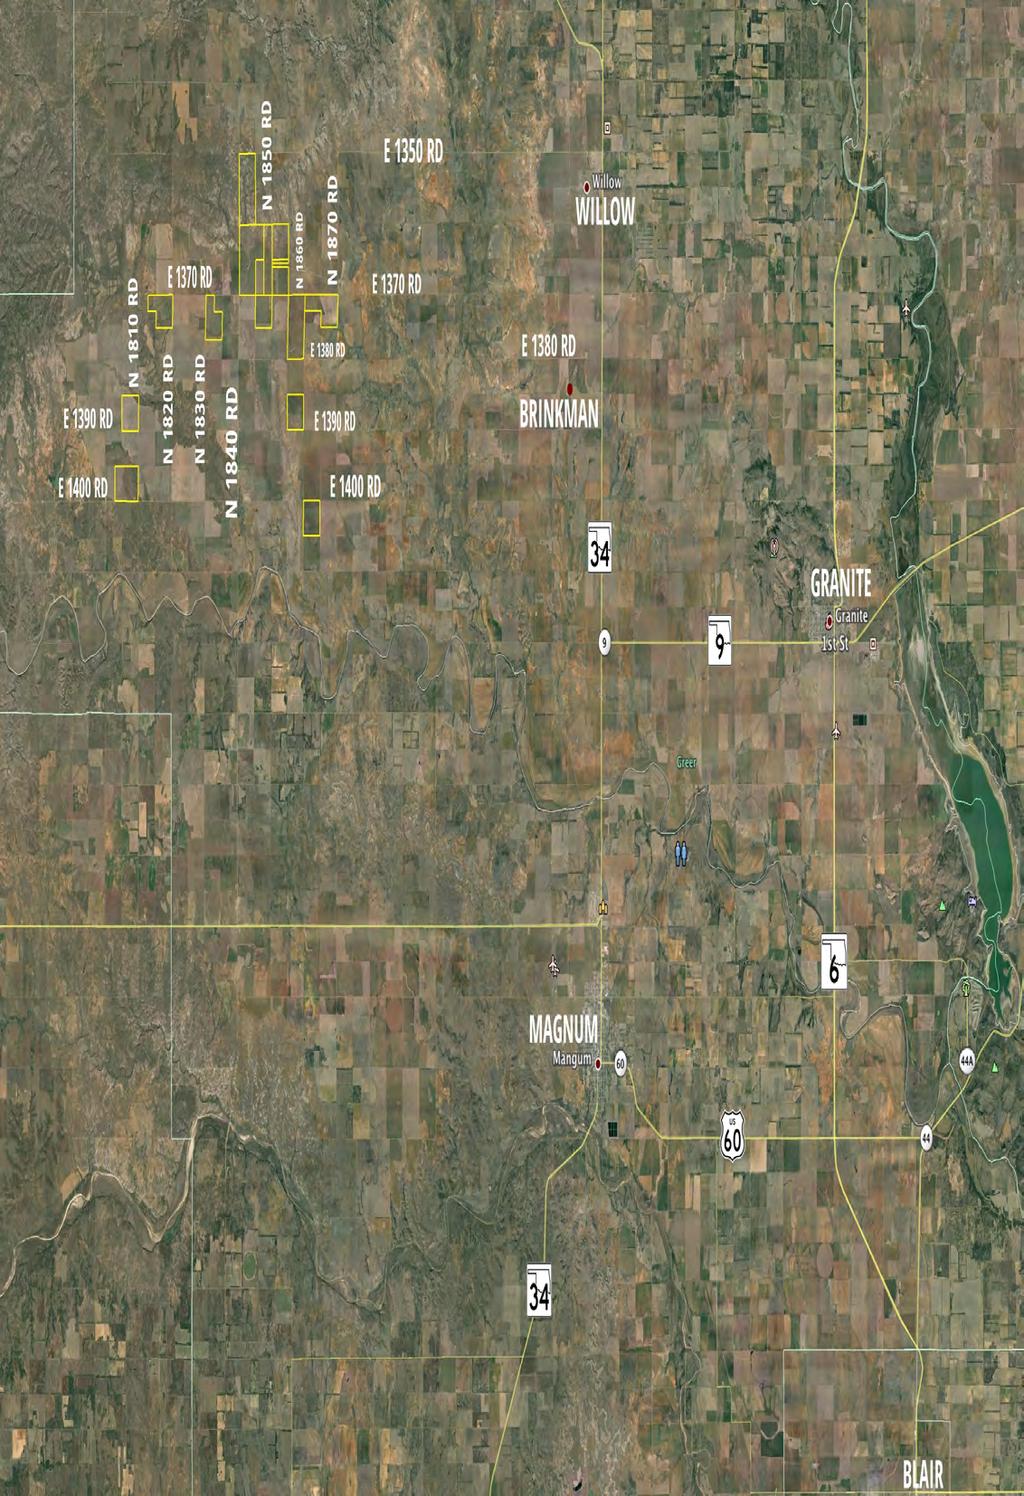
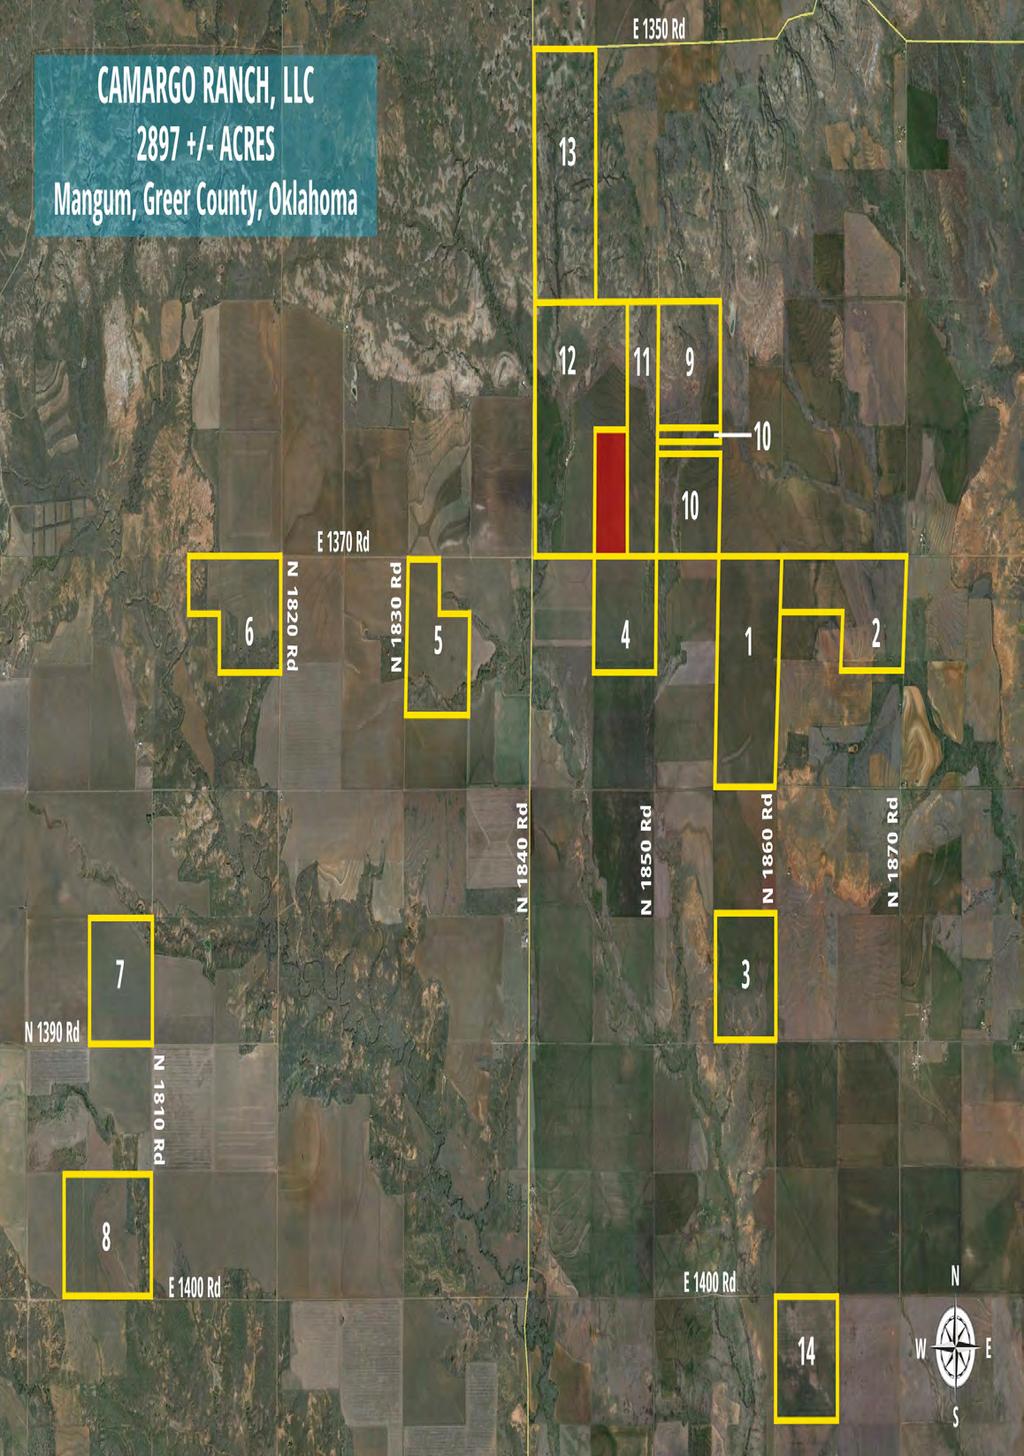
2 4101 Perimeter Center Dr., Suite 107 Oklahoma City, OK Camargo Ranch, LLC The Camargo Ranch, LLC property is approximately 2,897 acres located northwest of Mangum in Greer County, Oklahoma. Greer County is in the southwestern part of the state and is mainly an agricultural area growing wheat, cotton, sorghum, alfalfa, and producing cattle. The headquarters of this farm, tract 12, is 11 miles west and 9 miles north of Mangum. Oklahoma has some of the lowest property taxes in the nation. The most recent tax information indicates total annul taxes on this property to be $5, These farm tracts are not all contiguous but are all farmed together within an easy radius of 6 miles east and west and 4 miles north and south. Wide open rural county roads allow easy movement of large farm equipment. Annual rainfall according to the Oklahoma Climatological Survey is 28 per year. This property is currently being farmed on a lease basis with some 1800 acres of wheat and the balance in grass. Some of the wheat land is unfenced but can run yearlings with the use of electric fencing. According to the USDA Farm Service Agency, this farm has base acres of wheat, 9.4 base acres of oats, and base acres of cotton. Improvements consist of three large equipment sheds, two older barns, and one set of cattle working facilities. There are no homes or other structures. Community water is available via Thirsty Water Company and County Water and this property has 7 different meters and taps. Excellent farmers work other land in this area and an experienced successful tenant could be found for an investor/absentee owner. The property is only 145 miles from Amarillo, Texas, 150 miles from Oklahoma City, Oklahoma, and 245 miles from Dallas-Fort Worth.
3
4
5
6

7 CAMARGO RANCH Legend Greer County, Oklahoma Parcel # Legal Description Acres Lots 1 & 2 & S2NE 4; SE4 188/ Lt. 1 & S2NE4; Lts. 2-4 & S2NE4; 205/ SE4 188/707-09; 191/ Lts. 1 & 2 & S2NE4 188/707-09; 191/ Lt. 4 & S2NW4; N54A of N2SW4; 188/ Lts. 1 & 2 & S2NE4; Lt / SE4 187/ A Off E side SW4; SE4 187/ Lts. 1 & 2 & E2NW4 188/ N Acres of N Acres of SW4 & S Acre if SW4 Also Desc. As Lots 3 & 4 & E2SW4 192/ E2NE4; E2SE4 188/ W2NE4; NW4 Less 40' off W. side to Greer Co. Hwy; SW4 Less 40' off W. side to Greer Co. Hwy. 188/ NW4 Less 40' Side to Greer Co. Hwy; SW4 Less 40' off W. side to Greer Co. Hwy. 188/ NW4; 200/ TOTAL ACREAGE
 - - X 7 - X (TW) - - X 8 X - - - X 9 X - X - - 10 X X (TW) X - - 11 - - - - X X X X (TW) X 12 (Main Headquarters) X 13 X X (TW) - - - 14 - - - - - TW = Thirsty Water Corp.")
8 CAMARGO RANCH Property features TRACT FENCED RURAL WATER PONDS SHOPS/BARNS WHEAT GRAZING POTENTIAL X 2 X X 3 X - X - X 4 - X (TW) X X X 5 - X (COUNTY) X - X 6 - X (TW) - - X 7 - X (TW) - - X 8 X X 9 X - X X X (TW) X X X X X (TW) X 12 (Main Headquarters) X 13 X X (TW) TW = Thirsty Water Corp.
9
 Lowest: -11")

: 32 WINTER WEATHER Average Annual Snowfall: 5.5 inches Days with snow on ground: 3 Greatest Seasonal Snowfall: 27.")
10 Oklahoma Climatological Survey TEMPERATURE Average Annual: 61 degrees Average Maximum: 75 degrees Average Minimum: 48 degrees Highest: 117 degrees (Mangum, August 12, 1936) Lowest: -11 degrees (Mangum, December 23, 1989) Days of 90 Degrees or Higher: 98 Days of 20 Degrees or Lower: 21 PRECIPITATION Average Annual: inches Days With Precipitation: 63 Wettest Year: inches in 1986 Driest Year: inches in 1963 Greatest Daily Rainfall: 6.45 inches (Mangum, October 20, 1983) OTHER FACTS Average Wind Speed: 9 mph Sunshine: 60-80% Average Humidity: 64% Thunderstorm Days: 42 Hail Events: 3 per year Tornadoes ( ): 32 WINTER WEATHER Average Annual Snowfall: 5.5 inches Days with snow on ground: 3 Greatest Seasonal Snowfall: 27.6 inches ( ) Greatest Daily Snowfall: 10.0 inches (Mangum, February 18, 1921) Last Freeze in Spring: April 5 First Freeze in Autumn: November 2 Growing Season: 210 Days Greer County Climate Summary
11 The Climate of Greer County Greer County is at the western edge of the Central Great Plains, encompassing some of the best agricultural land in Oklahoma. Average annual precipitation ranges from about 25 to 38 inches across the county. Most of the precipitation comes in the springtime, with nearly one-third of the annual total falling in May and June. Autumn can also bring heavy rains, but not as consistently as the springtime. More than half of the winters have at least one inch of snow, with ten inches or more occurring about once every six years. Temperatures average from 59 degrees in northern parts of the county to 62 degrees along its southern border. Temperatures range from an average daytime high of 98 degrees in July to an average low of 25 degrees in January. Greer County averages a growing season of 211 days, but plants that can withstand short periods of colder temperatures may have an additional five weeks. Winds from the south to southeast are quite dominant, averaging more than nine miles-per-hour. Relative humidity, on average, ranges from 38% to 88% during the day. During the year, humidity is lowest in the summer and highest in late fall. Winter months tend to be cloudier than summer months. The percentage of possible sunshine ranges from an average of about 60% in winter to more than 80% in summer. Thunderstorms occur on about 42 days each year, predominantly in the spring and summer. During the period , Greer County recorded 32 tornadoes, although neighboring counties had substantially more. Greer County has not reported a significant tornado (F2 intensity or greater) since May 12, However, there have been more active patterns in the past. On April 27, 1912, three significant tornadoes struck Greer County on the same day, and two others occurred on May 7 just one decade later. Typically, there are about three events each year of hail exceeding one inch in diameter. As information collection improves, both the number of reported tornadoes and the number of severe hail events have increased. Temperature (deg F) Average Annual Temperature (Mangum) Year Precipitation (inches) Annual Precipitation (Mangum) Year
12 Temperature (deg Fahrenheit) AVERAGES ( ) EXTREMES ( ) AVG # DAYS PER MONTH ( ) Daily Max Daily Min Daily Avg Record High Record Low Max>100 Max>90 Max<32 Min<32 Min<0 Jan (24th, 1950) -9 (22nd, 1930) 3 26 * Feb (22nd, 1996) -5 (8th, 1933) * 1 17 * Mar (27th, 1971) -1 (11th, 1948) * 1 * 8 Apr (12th, 1972) 20 (2nd, 1936) * 3 2 May (29th, 1985) 33 (3rd, 1954) 1 9 Jun (24th, 1980) 45 (4th, 1939) 5 21 Jul (3rd, 1980) 52 (5th, 1924) Aug (12th, 1936) 51 (27th, 1962) Sep (1st, 1951) 31 (30th, 1984) 3 16 * Oct (4th, 2000) 14 (31st, 1993) * 4 * 1 Nov (8th, 1980) 8 (29th, 1976) * * 10 Dec (24th, 1955) -11 (23rd, 1989) 2 22 * Annual (Aug 12, 1936) -11 (Dec 23, 1989) * Precipitation (inches) AVERAGE EXTREMES ( ) AVG # DAYS PER MONTH ( ) Monthly Max Daily Max any meas 0.10"+ 0.25"+ 0.50"+ 1.00"+ Jan 0.90" 4.50" (1949) 2.92" (8th, 1939) * Feb 1.15" 4.30" (1997) 2.80" (20th, 1997) * Mar 1.71" 4.43" (1998) 2.70" (11th, 1923) Apr 2.26" 9.29" (1997) 3.74" (14th, 2002) May 4.68" 16.99" (1980) 5.30" (18th, 1935) Jun 4.22" 10.94" (1982) 3.78" (4th, 1994) Jul 2.22" 7.06" (1975) 4.62" (11th, 1972) Aug 2.73" 10.33" (1920) 5.12" (11th, 1997) Sep 3.15" 9.99" (1965) 5.46" (23rd, 1970) Oct 2.69" 15.75" (1923) 6.45" (20th, 1983) Nov 1.22" 3.68" (1940) 2.15" (2nd, 1961) * Dec 1.08" 5.00" (1932) 2.10" (23rd, 1932) * Annual 28.00" 16.99" (May 1980) 6.45" (Oct 20, 1983) Snow and Sleet (inches) AVERAGE EXTREMES ( ) AVG # DAYS PER MONTH ( ) Monthly Max Daily Max Greatest Depth any meas 0.50"+ 1.00"+ Pot. Glazing Jan 1.3" 15.2" (1930) 10.0" (9th, 1930) 7.0" (8th, 1920) * 1 Feb 0.8" 13.0" (1968) 10.0" (18th, 1921) 8.0" (10th, 1986) 1 * * * 1 Mar 0.0" 18.0" (1924) 9.0" (1st, 1942) 7.0" (10th, 1948) * Apr 0.1" 8.0" (1938) 5.0" (7th, 1938) 1.0" (13th, 1947) * * * * May 0.0" (1954) 0.0" (18th, 1949) Jun 0.0" (1953) 0.0" (5th, 1953) Jul 0.0" (1952) 0.0" (13th, 1952) Aug Sep 0.0" (1955) 0.0" (22nd, 1955) Oct 2.0" (1936) 2.0" (22nd, 1936) Nov 0.0" 2.0" (1923) 2.0" (28th, 1923) 2.0" (28th, 1958) * * * * Dec 0.9" 19.0" (1942) 10.0" (27th, 1942) 10.0" (27th, 1942) 1 * * * 1 Annual 3.0" 19.0" (Dec 1942) 10.0" (Feb 18, 1921) 10.0" (Dec 27, 1942)
13 TEMPERATURE AND PRECIPITATION From Mangum Cooperative Observer Station (345590); January 1920 June 2003 Latitude: 3453N Longitude: 09930W Elevation: 1594 ft Exceedence values (2 in 10 years) Maximum Minimum Temperature Temperature Precipitation Higher Than: Lower Than: Less Than: Precipitation More Than: Month: January February March April May June July August September October November December Annual First Freezing Temperature in Fall Probability 24 F or Lower 28 F or Lower 32 F or Lower 1 Year in 10 November 2 October 29 October 18 Earlier Than 2 Years in 10 November 11 November 3 October 23 Earlier Than 5 Years in 10 Earlier Than November 23 November 11 November 3 Last Freezing Temperature in Spring Probability 24 F or Lower 28 F or Lower 32 F or Lower 1 Year in 10 April 4 April 11 April 16 Later Than 2 Years in 10 March 29 April 7 April 13 Later Than 5 Years in 10 Later Than March 14 March 25 April 5 Number of Days in Growing Season Probability Higher than 24 F Higher than 28 F Higher than 32 F 9 Years in Years in Years in Years in Year in
14 WINDS From Mangum Mesonet Site (MANG); Jan 1994 Dec 2001 Latitude: 3450N Longitude: 09925W Elevation: 1509 ft Wind Roses show the prevailing direction from which the wind is blowing. North is up in the image. The circles show the percentage of time from which the wind is blowing in that direction. For example, Mangum records a south-southeasterly wind about 16 percent of the time, with northerly winds just over 7 percent of the time. The table below shows the percentage of time the wind is blowing from each of the 16-point compass headings, and the percent of time the prevailing wind is recorded in each speed bin. Maximum Gust: 90.5 mph Maximum Sustained: 50.6 mph Overall Average Speed: 9.4 mph MANG N NNE NE ENE E ESE SE SSE S SSW SW WSW W WNW NW NNW Totals Calm 1.0% 1-5 mph % 6-10 mph % mph % mph % mph % mph % mph % 35+ mph % Totals % MANG N NNE NE ENE E ESE SE SSE S SSW SW WSW W WNW NW NNW Max Gust Max 5 Min Avg Speed Due to rounding, column and row totals may not sum to exactly 100.0%.
15 HUMIDITY From Mangum Mesonet Site (MANG); Jan 1994 Dec 2003 Latitude: 3450N Longitude: 09925W Elevation: 1509 ft Mean Monthly Humidity and Moisture Daily Maximum Relative Humidity Daily Minimum Relative Humidity Daily Average Relative Humidity Daily Average Dewpoint ( o F) Daily Average Vapor Deficit January February March April May June July August September October November December Annual Vapor pressure is given in millibars. SOIL TEMPERATURES From Mangum Mesonet Site (MANG); Jan 1994 Dec 2003 Latitude: 3450N Longitude: 09925W Elevation: 1509 ft Soil Temperatures at 10 cm (4-inch) depth Average Temperature beneath sod Average Temperature beneath bare soil Average Daily Max Temperature Average Daily Min Temperature January February March April May June July August September October November December Annual Average daily maximum and minimum temperatures based on bare soil.
16 About the Data: The temperature and precipitation data from Mangum are from the National Weather Service Cooperative Observer station, which records daily maximum and minimum temperatures, precipitation, and snowfall. The station has been in operation since 1920, yielding a 84-year series of data. Extremes, frost and freeze data, and growing season lengths were determined using the entire 84-year series. The means for temperature, precipitation, and snowfall were determined using a subset of the series, from , corresponding with official national standards set by the National Climatic Data Center. Wind and humidity data are compiled from the Oklahoma Mesonet station at Mangum (5 miles southeast of town), which has been operational since The Oklahoma Mesonet is a cooperative project between Oklahoma State University and The University of Oklahoma. Data are collected and archived at the Oklahoma Climatological Survey. The Mesonet records a variety of weather information at 5-minute intervals throughout the day, with at least one reporting station in every county in Oklahoma. For more information on the Mesonet, see Solar radiation (sunshine) data were obtained from the Climatic Atlas of the United States, U.S. Department of Commerce, Severe storm information is available from the National Climatic Data Center, under Weather/Climate Events: Climatology & Extreme Events, U.S. Storm Events Database. The best site for online county tornado information for Oklahoma is through the National Weather Service, Norman Office, The tables and summary were prepared by the Oklahoma Climatological Survey. For more information, please contact OCS at Many climate summary products are available on the worldwide web at Need Additional Information? If you cannot find what you need here, or want some help interpreting what this means for your particular needs, please contact: The Oklahoma Climatological Survey 100 E. Boyd Street, Suite 1210 Norman, OK Phone: ocs@ou.edu In addition to maintaining records of all weather and climate information for Oklahoma, OCS has a staff of climatologists who specialize in tailoring information for particular needs. Whether you want to know how dry it has been or are planning a construction project, OCS can help.
The Climate of Payne County
 The Climate of Payne County Payne County is part of the Central Great Plains in the west, encompassing some of the best agricultural land in Oklahoma. Payne County is also part of the Crosstimbers in the
The Climate of Bryan County
 The Climate of Bryan County Bryan County is part of the Crosstimbers throughout most of the county. The extreme eastern portions of Bryan County are part of the Cypress Swamp and Forest. Average annual
The Climate of Kiowa County
 The Climate of Kiowa County Kiowa County is part of the Central Great Plains, encompassing some of the best agricultural land in Oklahoma. Average annual precipitation ranges from about 24 inches in northwestern
The Climate of Marshall County
 The Climate of Marshall County Marshall County is part of the Crosstimbers. This region is a transition region from the Central Great Plains to the more irregular terrain of southeastern Oklahoma. Average
The Climate of Texas County
 The Climate of Texas County Texas County is part of the Western High Plains in the north and west and the Southwestern Tablelands in the east. The Western High Plains are characterized by abundant cropland
The Climate of Pontotoc County
 The Climate of Pontotoc County Pontotoc County is part of the Crosstimbers. This region is a transition region from the Central Great Plains to the more irregular terrain of southeast Oklahoma. Average
The Climate of Grady County
 The Climate of Grady County Grady County is part of the Central Great Plains, encompassing some of the best agricultural land in Oklahoma. Average annual precipitation ranges from about 33 inches in northern
The Climate of Murray County
 The Climate of Murray County Murray County is part of the Crosstimbers. This region is a transition between prairies and the mountains of southeastern Oklahoma. Average annual precipitation ranges from
The Climate of Seminole County
 The Climate of Seminole County Seminole County is part of the Crosstimbers. This region is a transition region from the Central Great Plains to the more irregular terrain of southeastern Oklahoma. Average
The Climate of Haskell County
 The Climate of Haskell County Haskell County is part of the Hardwood Forest. The Hardwood Forest is characterized by its irregular landscape and the largest lake in Oklahoma, Lake Eufaula. Average annual
Champaign-Urbana 2001 Annual Weather Summary
 Champaign-Urbana 2001 Annual Weather Summary ILLINOIS STATE WATER SURVEY 2204 Griffith Dr. Champaign, IL 61820 wxobsrvr@sws.uiuc.edu Maria Peters, Weather Observer January: After a cold and snowy December,
Champaign-Urbana 2000 Annual Weather Summary
 Champaign-Urbana 2000 Annual Weather Summary ILLINOIS STATE WATER SURVEY 2204 Griffith Dr. Champaign, IL 61820 wxobsrvr@sws.uiuc.edu Maria Peters, Weather Observer January: January started on a mild note,
APPENDIX G-7 METEROLOGICAL DATA
 APPENDIX G-7 METEROLOGICAL DATA METEOROLOGICAL DATA FOR AIR AND NOISE SAMPLING DAYS AT MMR Monthly Normals and Extremes for Honolulu International Airport Table G7-1 MMR RAWS Station Hourly Data Tables
Champaign-Urbana 1999 Annual Weather Summary
 Champaign-Urbana 1999 Annual Weather Summary ILLINOIS STATE WATER SURVEY 2204 Griffith Dr. Champaign, IL 61820 wxobsrvr@sws.uiuc.edu Maria Peters, Weather Observer A major snowstorm kicked off the new
Champaign-Urbana 1998 Annual Weather Summary
 Champaign-Urbana 1998 Annual Weather Summary ILLINOIS STATE WATER SURVEY Audrey Bryan, Weather Observer 2204 Griffith Dr. Champaign, IL 61820 wxobsrvr@sparc.sws.uiuc.edu The development of the El Nìno
Local Ctimatotogical Data Summary White Hall, Illinois
 SWS Miscellaneous Publication 98-5 STATE OF ILLINOIS DEPARTMENT OF ENERGY AND NATURAL RESOURCES Local Ctimatotogical Data Summary White Hall, Illinois 1901-1990 by Audrey A. Bryan and Wayne Armstrong Illinois
LOCAL CLIMATOLOGICAL DATA Monthly Summary September 2016
 Deg. Days Precip Ty Precip Wind Solar Hu- Adj. to Sea Level mid- ity Avg Res Res Peak 2 Minute 1 fog 2 hvy fog 3 thunder 4 ice plt 5 hail 6 glaze 7 duststm 8 smk, hz 9 blw snw 1 2 3 4A 4B 5 6 7 8 9 11
LOCAL CLIMATOLOGICAL DATA Monthly Summary July 2013
 Deg. Days Precip Ty Precip Wind Solar Hu- Adj. to Sea Level mid- ity Avg Res Res Peak Minute 1 fog 2 hvy fog 3 thunder 4 ice plt 5 hail 6 glaze 7 duststm 8 smk, hz 9 blw snw 1 2 3 4A 4B 5 6 7 8 9 12 14
LOCAL CLIMATOLOGICAL DATA Monthly Summary November 2006
 Deg. Days Precip Ty Precip Wind Sun Hu- Adj. to Sea Level mid- ity Avg Res Res Peak Minute 1 fog 2 hvy fog 3 thunder 4 ice plt 5 hail 6 glaze 7 duststm 8 smk, hz 9 blw snw 1 2 3 4A 4B 5 6 7 8 9 12 14 15
Monthly Long Range Weather Commentary Issued: APRIL 1, 2015 Steven A. Root, CCM, President/CEO
 Monthly Long Range Weather Commentary Issued: APRIL 1, 2015 Steven A. Root, CCM, President/CEO sroot@weatherbank.com FEBRUARY 2015 Climate Highlights The Month in Review The February contiguous U.S. temperature
October 2015 Volume 22 Number 10
 The Weather Wire October 2015 Volume 22 Number 10 Contents: Local Frost/Freeze Information Drought Monitor September Summary/Statistics October Preview Rainfall Totals Local Frost Freeze Information Many
5.0 WHAT IS THE FUTURE ( ) WEATHER EXPECTED TO BE?
 WEATHER EXPECTED TO BE?") 5.0 WHAT IS THE FUTURE (2040-2049) WEATHER EXPECTED TO BE? This chapter presents some illustrative results for one station, Pearson Airport, extracted from the hour-by-hour simulations of the future period
5.0 WHAT IS THE FUTURE (2040-2049) WEATHER EXPECTED TO BE? This chapter presents some illustrative results for one station, Pearson Airport, extracted from the hour-by-hour simulations of the future period
Variability of Reference Evapotranspiration Across Nebraska
 Know how. Know now. EC733 Variability of Reference Evapotranspiration Across Nebraska Suat Irmak, Extension Soil and Water Resources and Irrigation Specialist Kari E. Skaggs, Research Associate, Biological
May 2016 Volume 23 Number 5
 The Weather Wire May 2016 Volume 23 Number 5 Contents: Winter Summary Current Colorado and West-wide Snow Pack Drought Monitor April Summary/Statistics May Preview Snowfall Totals Winter Summary The Front
Minnesota s Climatic Conditions, Outlook, and Impacts on Agriculture. Today. 1. The weather and climate of 2017 to date
 Minnesota s Climatic Conditions, Outlook, and Impacts on Agriculture Kenny Blumenfeld, State Climatology Office Crop Insurance Conference, Sep 13, 2017 Today 1. The weather and climate of 2017 to date
Monthly Long Range Weather Commentary Issued: February 15, 2015 Steven A. Root, CCM, President/CEO
 Monthly Long Range Weather Commentary Issued: February 15, 2015 Steven A. Root, CCM, President/CEO sroot@weatherbank.com JANUARY 2015 Climate Highlights The Month in Review During January, the average
The Weather Wire. Current Colorado Snowpack. Contents:
 The Weather Wire December 2018 Volume 25 Number 12 Contents: Current Colorado Snowpack Drought Monitor November Summary/Statistics December Preview Snowfall Totals Current Colorado Snowpack Although snowfall
Monthly Long Range Weather Commentary Issued: APRIL 18, 2017 Steven A. Root, CCM, Chief Analytics Officer, Sr. VP,
 Monthly Long Range Weather Commentary Issued: APRIL 18, 2017 Steven A. Root, CCM, Chief Analytics Officer, Sr. VP, sroot@weatherbank.com MARCH 2017 Climate Highlights The Month in Review The average contiguous
Table of Contents. Page
 Eighteen Years (1990 2007) of Climatological Data on NMSU s Corona Range and Livestock Research Center Research Report 761 L. Allen Torell, Kirk C. McDaniel, Shad Cox, Suman Majumdar 1 Agricultural Experiment
Jackson County 2013 Weather Data
 Jackson County 2013 Weather Data 61 Years of Weather Data Recorded at the UF/IFAS Marianna North Florida Research and Education Center Doug Mayo Jackson County Extension Director 1952-2008 Rainfall Data
LOCAL CLIMATOLOGICAL DATA FOR FREEPORT ILLINOIS
 Climatological Summary: LOCAL CLIMATOLOGICAL DATA FOR FREEPORT ILLINOIS 1905-1990 Freeport (Stephenson County) has a temperate continental climate, dominated by maritime tropical air from the Gulf of Mexico
Weather and Climate of the Rogue Valley By Gregory V. Jones, Ph.D., Southern Oregon University
 Weather and Climate of the Rogue Valley By Gregory V. Jones, Ph.D., Southern Oregon University The Rogue Valley region is one of many intermountain valley areas along the west coast of the United States.
WHEN IS IT EVER GOING TO RAIN? Table of Average Annual Rainfall and Rainfall For Selected Arizona Cities
 WHEN IS IT EVER GOING TO RAIN? Table of Average Annual Rainfall and 2001-2002 Rainfall For Selected Arizona Cities Phoenix Tucson Flagstaff Avg. 2001-2002 Avg. 2001-2002 Avg. 2001-2002 October 0.7 0.0
Monthly Long Range Weather Commentary Issued: SEPTEMBER 19, 2015 Steven A. Root, CCM, Chief Analytics Officer, Sr. VP, sales
 Monthly Long Range Weather Commentary Issued: SEPTEMBER 19, 2015 Steven A. Root, CCM, Chief Analytics Officer, Sr. VP, sales sroot@weatherbank.com AUGUST 2015 Climate Highlights The Month in Review The
2016 Meteorology Summary
 2016 Meteorology Summary New Jersey Department of Environmental Protection AIR POLLUTION AND METEOROLOGY Meteorology plays an important role in the distribution of pollution throughout the troposphere,
Drought in Southeast Colorado
 Drought in Southeast Colorado Nolan Doesken and Roger Pielke, Sr. Colorado Climate Center Prepared by Tara Green and Odie Bliss http://climate.atmos.colostate.edu 1 Historical Perspective on Drought Tourism
Weather History on the Bishop Paiute Reservation
 Weather History on the Bishop Paiute Reservation -211 For additional information contact Toni Richards, Air Quality Specialist 76 873 784 toni.richards@bishoppaiute.org Updated 2//214 3:14 PM Weather History
The Weather Wire. Current Colorado Snowpack. Contents:
 The Weather Wire January 2019 Volume 26 Number 1 Contents: Current Colorado Snowpack Denver Snowfall Since 1999-2000 Denver 2018 Climate Review Drought Monitor December Summary/Statistics January Preview
Monthly Long Range Weather Commentary Issued: NOVEMBER 16, 2015 Steven A. Root, CCM, Chief Analytics Officer, Sr. VP, sales
 Monthly Long Range Weather Commentary Issued: NOVEMBER 16, 2015 Steven A. Root, CCM, Chief Analytics Officer, Sr. VP, sales sroot@weatherbank.com OCTOBER 2015 Climate Highlights The Month in Review The
April 2011 Volume 18 Number 4
 The Weather Wire April 2011 Volume 18 Number 4 Contents: Winter Summary to Date Drought Monitor March Summary/Statistics April Preview Sunrise/Sunset Snow Totals Winter Summary to Date The Front Range
ZUMWALT WEATHER AND CLIMATE ANNUAL REPORT ( )
") ZUMWALT WEATHER AND CLIMATE ANNUAL REPORT (26-29) FINAL DRAFT (9 AUGUST 21) J.D. HANSEN 1, R.V. TAYLOR 2, AND V.S. JANSEN 3 INTRODUCTION The Zumwalt Prairie in northeastern Oregon is a unique grassland
ZUMWALT WEATHER AND CLIMATE ANNUAL REPORT (26-29) FINAL DRAFT (9 AUGUST 21) J.D. HANSEN 1, R.V. TAYLOR 2, AND V.S. JANSEN 3 INTRODUCTION The Zumwalt Prairie in northeastern Oregon is a unique grassland
The Weather Wire. Contents: Summer 2018 Outlook. Summer 2018 Outlook Drought Monitor May Summary/Statistics June Preview Rainfall Totals
 The Weather Wire June 2018 Volume 25 Number 6 Contents: Summer 2018 Outlook Drought Monitor May Summary/Statistics June Preview Rainfall Totals Summer 2018 Outlook June 1 st marked the first day of meteorological
The Climate of Oregon Climate Zone 5 High Plateau
 105 E55 Unbound issue i". 9 13oes not circulate CZe Special Report 917 May 1993 The Climate of Oregon Climate Zone 5 Property of OREGON STATE UNIVERSITY Library Serials Corvallis, OR 97331-4503 Agricultural
January 25, Summary
 January 25, 2013 Summary Precipitation since the December 17, 2012, Drought Update has been slightly below average in parts of central and northern Illinois and above average in southern Illinois. Soil
Funding provided by NOAA Sectoral Applications Research Project CLIMATE. Basic Climatology Colorado Climate Center
 Funding provided by NOAA Sectoral Applications Research Project CLIMATE Basic Climatology Colorado Climate Center Remember These? Factor 1: Our Energy Source Factor 2: Revolution & Tilt Factor 3: Rotation!
Monthly Long Range Weather Commentary Issued: APRIL 25, 2016 Steven A. Root, CCM, Chief Analytics Officer, Sr. VP, sales
 Monthly Long Range Weather Commentary Issued: APRIL 25, 2016 Steven A. Root, CCM, Chief Analytics Officer, Sr. VP, sales sroot@weatherbank.com MARCH 2016 Climate Highlights The Month in Review The March
Monthly Long Range Weather Commentary Issued: SEPTEMBER 19, 2016 Steven A. Root, CCM, Chief Analytics Officer, Sr. VP,
 Monthly Long Range Weather Commentary Issued: SEPTEMBER 19, 2016 Steven A. Root, CCM, Chief Analytics Officer, Sr. VP, sroot@weatherbank.com SEPTEMBER 2016 Climate Highlights The Month in Review The contiguous
The Climate of Oregon Climate Zone 4 Northern Cascades
 /05 E55 Unbound issue No. 9/ is Does not circulate Special Report 916 May 1993 The Climate of Oregon Climate Zone 4 Property of OREGON STATE UNIVERSITY Library Serials Corvallis, OR 97331-4503 Agricultural
Colorado s 2003 Moisture Outlook
 Colorado s 2003 Moisture Outlook Nolan Doesken and Roger Pielke, Sr. Colorado Climate Center Prepared by Tara Green and Odie Bliss http://climate.atmos.colostate.edu How we got into this drought! Fort
WIND DATA REPORT FOR THE YAKUTAT JULY 2004 APRIL 2005
 WIND DATA REPORT FOR THE YAKUTAT JULY 2004 APRIL 2005 Prepared on July 12, 2005 For Bob Lynette 212 Jamestown Beach Lane Sequim WA 98382 By John Wade Wind Consultant LLC 2575 NE 32 nd Ave Portland OR 97212
WIND DATA REPORT. Vinalhaven
 WIND DATA REPORT Vinalhaven July 1, 2004 September 30, 2004 Prepared for Fox Islands Electric Cooperative By Melissa L. Ray Anthony L. Rogers April 4, 2005 Renewable Energy Research Laboratory 160 Governors
The Pennsylvania Observer
 The Pennsylvania Observer May 31, 2012 May 2012 - Pennsylvania Weather Recap By: Paul Knight The majority of the fifth month had temperatures averaging well above seasonal levels with two distinct hot
Agricultural Science Climatology Semester 2, Anne Green / Richard Thompson
 Agricultural Science Climatology Semester 2, 2006 Anne Green / Richard Thompson http://www.physics.usyd.edu.au/ag/agschome.htm Course Coordinator: Mike Wheatland Course Goals Evaluate & interpret information,
Jackson County 2018 Weather Data 67 Years of Weather Data Recorded at the UF/IFAS Marianna North Florida Research and Education Center
 Jackson County 2018 Weather Data 67 Years of Weather Data Recorded at the UF/IFAS Marianna North Florida Research and Education Center Doug Mayo Jackson County Extension Director 1952-2008 Rainfall Data
Three main areas of work:
 Task 2: Climate Information 1 Task 2: Climate Information Three main areas of work: Collect historical and projected weather and climate data Conduct storm surge and wave modeling, sea-level rise (SLR)
The Climate of Oregon Climate Zone 3 Southwest Interior
 .k) 105 Unbound issue " " 1 4oes not circulate C4P. Special Report 915 May 1993 The Climate of Oregon Climate Zone 3 Southwest Interior Property of OREGON STATE UNIVERSITY Library Serials Corvallis, OR
Chiang Rai Province CC Threat overview AAS1109 Mekong ARCC
 Chiang Rai Province CC Threat overview AAS1109 Mekong ARCC This threat overview relies on projections of future climate change in the Mekong Basin for the period 2045-2069 compared to a baseline of 1980-2005.
SASKATOON STATION
 Day Max Max 1981-1 Temperature Degree-days Precipitation Min Min 1981-1 Mean Mean 1981-1 Growing Heating Cooling Weighing Gauge base 18 base 18 base Comments Preliminary DECEMBER 17 Snow-on- Ground 9h
Format of CLIGEN weather station statistics input files. for CLIGEN versions as of 6/2001 (D.C. Flanagan).
.") Format of CLIGEN weather station statistics input files for CLIGEN versions 4.1-5.1 as of 6/2001 (D.C. Flanagan). updated 12/11/2008 - Jim Frankenberger These files are also known as CLIGEN state files
Format of CLIGEN weather station statistics input files for CLIGEN versions 4.1-5.1 as of 6/2001 (D.C. Flanagan). updated 12/11/2008 - Jim Frankenberger These files are also known as CLIGEN state files
Fairbanks, Alaska Solar & Weather Information Factsheet
 Fairbanks, Alaska Solar & Weather Information Factsheet EEM-01355 Narrative Climatological Summary Fairbanks is located in the Tanana Valley of Interior Alaska. The area has a definite continental climate.
Sierra Weather and Climate Update
 Sierra Weather and Climate Update 2014-15 Kelly Redmond Western Regional Climate Center Desert Research Institute Reno Nevada Yosemite Hydroclimate Workshop Yosemite Valley, 2015 October 8-9 Percent of
November 2017 Volume 24 Number 11
 The Weather Wire November 2017 Volume 24 Number 11 Contents: Colorado Snow Statistics Drought Monitor October Summary/Statistics November Preview Snowfall Totals Rainfall Totals Colorado Snow Statistics
Highlights of the 2006 Water Year in Colorado
 Highlights of the 2006 Water Year in Colorado Nolan Doesken, State Climatologist Atmospheric Science Department Colorado State University http://ccc.atmos.colostate.edu Presented to 61 st Annual Meeting
Minnesota s Changing Climate: Winter Impacts
 Minnesota s Changing Climate: Winter Impacts Dr. Mark Seeley Climatologist/Meteorologist Dept of Soil, Water, and Climate University of Minnesota 15 th Annual Road Salt Symposium Minnesota Landscape Arboretum
Tornado Hazard Risk Analysis: A Report for Rutherford County Emergency Management Agency
 Tornado Hazard Risk Analysis: A Report for Rutherford County Emergency Management Agency by Middle Tennessee State University Faculty Lisa Bloomer, Curtis Church, James Henry, Ahmad Khansari, Tom Nolan,
Climate Change Impact on Air Temperature, Daily Temperature Range, Growing Degree Days, and Spring and Fall Frost Dates In Nebraska
 EXTENSION Know how. Know now. Climate Change Impact on Air Temperature, Daily Temperature Range, Growing Degree Days, and Spring and Fall Frost Dates In Nebraska EC715 Kari E. Skaggs, Research Associate
Jackson County 2014 Weather Data
 Jackson County 2014 Weather Data 62 Years of Weather Data Recorded at the UF/IFAS Marianna North Florida Research and Education Center Doug Mayo Jackson County Extension Director 1952-2008 Rainfall Data
SEPTEMBER 2013 REVIEW
 Monthly Long Range Weather Commentary Issued: October 21, 2013 Steven A. Root, CCM, President/CEO sroot@weatherbank.com SEPTEMBER 2013 REVIEW Climate Highlights The Month in Review The average temperature
Changing Hydrology under a Changing Climate for a Coastal Plain Watershed
 Changing Hydrology under a Changing Climate for a Coastal Plain Watershed David Bosch USDA-ARS, Tifton, GA Jeff Arnold ARS Temple, TX and Peter Allen Baylor University, TX SEWRU Objectives 1. Project changes
Monthly Long Range Weather Commentary Issued: May 15, 2014 Steven A. Root, CCM, President/CEO
 Monthly Long Range Weather Commentary Issued: May 15, 2014 Steven A. Root, CCM, President/CEO sroot@weatherbank.com APRIL 2014 REVIEW Climate Highlights The Month in Review The average temperature for
2003 Water Year Wrap-Up and Look Ahead
 2003 Water Year Wrap-Up and Look Ahead Nolan Doesken Colorado Climate Center Prepared by Odie Bliss http://ccc.atmos.colostate.edu Colorado Average Annual Precipitation Map South Platte Average Precipitation
2003 Moisture Outlook
 2003 Moisture Outlook Nolan Doesken and Roger Pielke, Sr. Colorado Climate Center Prepared by Tara Green and Odie Bliss http://climate.atmos.colostate.edu Through 1999 Through 1999 Fort Collins Total Water
Communicating Climate Change Consequences for Land Use
 Communicating Climate Change Consequences for Land Use Site: Prabost, Skye. Event: Kyle of Lochalsh, 28 th February 28 Further information: http://www.macaulay.ac.uk/ladss/comm_cc_consequences.html Who
WIND DATA REPORT. Vinalhaven
 WIND DATA REPORT Vinalhaven April 1, 2004 June 30, 2004 Prepared for Fox Islands Electric Cooperative By Melissa L. Ray Anthony L. Rogers April 4, 2005 Renewable Energy Research Laboratory 160 Governors
Memo. I. Executive Summary. II. ALERT Data Source. III. General System-Wide Reporting Summary. Date: January 26, 2009 To: From: Subject:
 Memo Date: January 26, 2009 To: From: Subject: Kevin Stewart Markus Ritsch 2010 Annual Legacy ALERT Data Analysis Summary Report I. Executive Summary The Urban Drainage and Flood Control District (District)
Climate. Annual Temperature (Last 30 Years) January Temperature. July Temperature. Average Precipitation (Last 30 Years)
 January Temperature. July Temperature. Average Precipitation (Last 30 Years)") Climate Annual Temperature (Last 30 Years) Average Annual High Temp. (F)70, (C)21 Average Annual Low Temp. (F)43, (C)6 January Temperature Average January High Temp. (F)48, (C)9 Average January Low Temp.
Climate Annual Temperature (Last 30 Years) Average Annual High Temp. (F)70, (C)21 Average Annual Low Temp. (F)43, (C)6 January Temperature Average January High Temp. (F)48, (C)9 Average January Low Temp.
Colorado CoCoRaHS. Colorado CoCoRaHS. December 2013 Volume 1, Issue 8 NOVEMBER PRECIPITATION NOVEMBER TEMPERATURES
 NOVEMBER PRECIPITATION The month of November brought a flip-flop in precipitation patterns to some areas compared to the previous month, especially for locations in the foothills north of I-70 and in south-central
2015 Fall Conditions Report
 2015 Fall Conditions Report Prepared by: Hydrologic Forecast Centre Date: December 21 st, 2015 Table of Contents Table of Figures... ii EXECUTIVE SUMMARY... 1 BACKGROUND... 2 SUMMER AND FALL PRECIPITATION...
The weather in Iceland 2012
 The Icelandic Meteorological Office Climate summary 2012 published 9.1.2013 The weather in Iceland 2012 Climate summary Sunset in Reykjavík 24th April 2012 at 21:42. View towards west from the balcony
November 2018 Weather Summary West Central Research and Outreach Center Morris, MN
 November 2018 Weather Summary Lower than normal temperatures occurred for the second month. The mean temperature for November was 22.7 F, which is 7.2 F below the average of 29.9 F (1886-2017). This November
Climatography of the United States No
 Climate Division: CA 5 NWS Call Sign: Elevation: 6 Feet Lat: 37 Month (1) Min (2) Month(1) Extremes Lowest (2) Temperature ( F) Lowest Month(1) Degree s (1) Base Temp 65 Heating Cooling 1 Number of s (3)
Climatography of the United States No
 Climate Division: CA 4 NWS Call Sign: Elevation: 2 Feet Lat: 37 Month (1) Min (2) Month(1) Extremes Lowest (2) Temperature ( F) Lowest Month(1) Degree s (1) Base Temp 65 Heating Cooling 1 Number of s (3)
Climatography of the United States No
 Climate Division: CA 4 NWS Call Sign: Elevation: 13 Feet Lat: 36 Month (1) Min (2) Month(1) Extremes Lowest (2) Temperature ( F) Lowest Month(1) Degree s (1) Base Temp 65 Heating Cooling 1 Number of s
Climatography of the United States No
 Climate Division: CA 5 NWS Call Sign: Elevation: 1,14 Feet Lat: 36 Month (1) Min (2) Month(1) Extremes Lowest (2) Temperature ( F) Lowest Month(1) Degree s (1) Base Temp 65 Heating Cooling 1 Number of
Arizona Climate Summary February 2012
 Arizona Climate Summary February 2012 Summary of conditions for January 2012 January 2012 Temperature and Precipitation Summary January 1 st 20 th : The New Year has started on a very dry note. The La
Tracking the Climate Of Northern Colorado Nolan Doesken State Climatologist Colorado Climate Center Colorado State University
 Tracking the Climate Of Northern Colorado Nolan Doesken State Climatologist Colorado Climate Center Colorado State University Northern Colorado Business Innovations November 20, 2013 Loveland, Colorado
Climatography of the United States No
 Climate Division: AK 5 NWS Call Sign: ANC Month (1) Min (2) Month(1) Extremes Lowest (2) Temperature ( F) Lowest Month(1) Degree s (1) Base Temp 65 Heating Cooling 90 Number of s (3) Jan 22.2 9.3 15.8
Climatography of the United States No
 Climate Division: CA 6 NWS Call Sign: LAX Elevation: 1 Feet Lat: 33 Month (1) Min (2) Month(1) Extremes Lowest (2) Temperature ( F) Lowest Month(1) Degree s (1) Base Temp 65 Heating Cooling 1 Number of
Climatography of the United States No
 Climate Division: CA 6 NWS Call Sign: TOA Elevation: 11 Feet Lat: 33 2W Temperature ( F) Month (1) Min (2) Month(1) Extremes Lowest (2) Lowest Month(1) Degree s (1) Base Temp 65 Heating Cooling 1 Number
Climatography of the United States No
 Climate Division: CA 4 NWS Call Sign: Month (1) Min (2) Month(1) Extremes Lowest (2) Temperature ( F) Lowest Month(1) Degree s (1) Base Temp 65 Heating Cooling 100 Number of s (3) Jan 55.6 39.3 47.5 77
Climatography of the United States No
 Climate Division: CA 5 NWS Call Sign: Month (1) Min (2) Month(1) Extremes Lowest (2) Temperature ( F) Lowest Month(1) Degree s (1) Base Temp 65 Heating Cooling 100 Number of s (3) Jan 56.6 36.5 46.6 81
Climatography of the United States No
 Climate Division: CA 1 NWS Call Sign: Month (1) Min (2) Month(1) Extremes Lowest (2) Temperature ( F) Lowest Month(1) Degree s (1) Base Temp 65 Heating Cooling 100 Number of s (3) Jan 57.9 38.9 48.4 85
Climatography of the United States No
 Climate Division: CA 5 NWS Call Sign: Month (1) Min (2) Month(1) Extremes Lowest (2) Temperature ( F) Lowest Month(1) Degree s (1) Base Temp 65 Heating Cooling 100 Number of s (3) Jan 44.8 25.4 35.1 72
Climatography of the United States No
 Climate Division: CA 4 NWS Call Sign: Month (1) Min (2) Month(1) Extremes Lowest (2) Temperature ( F) Lowest Month(1) Degree s (1) Base Temp 65 Heating Cooling 100 Number of s (3) Jan 49.4 37.5 43.5 73
Climatography of the United States No
 Climate Division: CA 6 NWS Call Sign: Month (1) Min (2) Month(1) Extremes Lowest (2) Temperature ( F) Lowest Month(1) Degree s (1) Base Temp 65 Heating Cooling 100 Number of s (3) Jan 69.4 46.6 58.0 92
Climatography of the United States No
 Climate Division: CA 4 NWS Call Sign: Month (1) Min (2) Month(1) Extremes Lowest (2) Temperature ( F) Lowest Month(1) Degree s (1) Base Temp 65 Heating Cooling 1 Number of s (3) Jan 58.5 38.8 48.7 79 1962
Climatography of the United States No
 Climate Division: CA 6 NWS Call Sign: Month (1) Min (2) Month(1) Extremes Lowest (2) Temperature ( F) Lowest Month(1) Degree s (1) Base Temp 65 Heating Cooling 1 Number of s (3) Jan 67.5 42. 54.8 92 1971
Climatography of the United States No
 Climate Division: CA 1 NWS Call Sign: Month (1) Min (2) Month(1) Extremes Lowest (2) Temperature ( F) Lowest Month(1) Degree s (1) Base Temp 65 Heating Cooling 1 Number of s (3) Jan 57.8 39.5 48.7 85 1962
Applications/Users for Improved S2S Forecasts
 Applications/Users for Improved S2S Forecasts Nolan Doesken Colorado Climate Center Colorado State University WSWC Precipitation Forecasting Workshop June 7-9, 2016 San Diego, CA First -- A short background
8.1 Attachment 1: Ambient Weather Conditions at Jervoise Bay, Cockburn Sound
 8.1 Attachment 1: Ambient Weather Conditions at Jervoise Bay, Cockburn Sound Cockburn Sound is 20km south of the Perth-Fremantle area and has two features that are unique along Perth s metropolitan coast