A Validated Tropical-Extratropical Flood Hazard Assessment for New York Harbor. Accepted to Journal of Geophysical Research, 10/24/2016 in press
|
|
|
- Logan Floyd
- 5 years ago
- Views:
Transcription
1 1 2 3 A Validated Tropical-Extratropical Flood Hazard Assessment for New York Harbor P.M. Orton 1*, T.M. Hall 2, S.A. Talke 3, A.F. Blumberg 1, N. Georgas 1, S. Vinogradov 1,4 Accepted to Journal of Geophysical Research, 10/24/2016 in press Stevens Institute of Technology, Castle Point on Hudson, Davidson Laboratory, Hoboken, NJ, 07030, USA 2 NASA Goddard Institute for Space Studies, New York, NY, 10025, USA 3 Portland State University, Department of Civil and Environmental Engineering, Post Office Box 751, Portland, OR, 97207, USA 4 Now at Earth Resources Technology, Inc., NOAA Coast Survey Development Lab, 1315 East West Highway, Silver Spring, MD, 20910, USA * Author to whom correspondence should be addressed; philip.orton@stevens.edu; Tel.: Three Key Points 1) A new approach for coastal flood hazard assessment is presented, using synthetic tropical cyclones 2) The return period for Hurricane Sandy s flood is 260 years; it was the largest back to at least ) Differing flood exceedance curves for extratropical and tropical cyclones require separate analysis Running title: Flood Assessment for New York Harbor
2 Abstract Recent studies of flood risk at New York Harbor (NYH) have shown disparate results for the 100-year storm tide, providing an uncertain foundation for the flood mitigation response after Hurricane Sandy. Here, we present a flood hazard assessment that improves confidence in our understanding of the region's present-day potential for flooding, by separately including the contribution of tropical cyclones (TCs) and extratropical cyclones (ETCs), and validating our modeling study at multiple stages against historical observations. The TC assessment is based on a climatology of 606 synthetic storms developed from a statistical-stochastic model of North Atlantic TCs. The ETC assessment is based on simulations of historical storms with many random tide scenarios. Synthetic TC landfall rates and the final TC and ETC flood exceedance curves are all shown to be consistent with curves computed using historical data, within 95% confidence ranges. Combining the ETC and TC results together, the 100-year return period storm tide at NYH is 2.70 m ( at 95% confidence), and Hurricane Sandy s storm tide of 3.38 m was a 260-year ( ) storm tide. Deeper analyses of historical flood reports from estimated Category-3 hurricanes in 1788 and 1821 lead to new estimates and reduced uncertainties for their floods, and show that Sandy s storm tide was the largest at NYH back to at least The flood exceedance curves for ETCs and TCs have sharply different slopes due to their differing meteorology and frequency, warranting separate treatment in hazard assessments
3 Introduction New York Harbor (NYH) and its connected tidal waterways lie at the apex of the New York Bight, and are surrounded by over 21 million people in cities such as New York, Newark, Jersey City and Hoboken. Hurricane Sandy in 2012 was a harsh reminder of the area s vulnerability to hurricane storm surges. Much of the land immediately surrounding NYH is filled-in former waterways and marshes, or flat coastal plains. The region was recently ranked second in the United States for present-day monetary risk from storm surge [Botts et al., 2013]. Unfortunately, because the last flood comparable to Sandy occurred during the pre-instrumental era, in 1821 (Figure 1) [Brandon et al., 2014; Coch, 1994; Scileppi and Donnelly, 2007; Swiss Re, 2014; Talke et al., 2014], Sandy s flood elevation and area came as a surprise to many. Now, scientists, insurance companies, decision-makers and citizens across the region are re-assessing their flood risk There is strong momentum across the U.S. Northeast toward building flood mitigation projects, which require an understanding of coastal flood hazards for determining the design level of protection. New York City developed a $20 billion plan for coastal adaptation under the Special Initiative on Rebuilding and Resilience [City of New York, 2013]. This included hundreds of proposed actions to improve resilience, many of which are currently underway. Over $1 billion of funding has gone to city and state governments implement the winning projects of the Rebuild By Design competition, organized by the federal Department of Housing and Urban Development [e.g., Orff et al., 2014]. Most recently, the US Army Corps of Engineers laid out a set of potential adaptation strategies in the North Atlantic Coast Comprehensive Study (NACCS)
4 67 68 report released in early 2015 [USACE, 2015]. Many of these plans seek to provide protection against a 100-year flood or worse Researchers have made major advancements in coastal flood hazard assessment methodologies in recent years. Lin et al. [2012] innovated within this area of hazard science by using a dynamical-statistical approach for simulating TCs that can be run with climate model simulations to account for future storm climatology changes. This work showed that future changes to storms could have a similar effect as sea level rise, for worsening flood risk. One of FEMA s [2014b] innovations has been to separately simulate and statistically evaluate TC and ETC flood probabilities in an assessment of total storm tide risk, as the US Mid-Atlantic and New York Bights are known to have severe floods arising from both storm types [Colle et al., 2008; Colle et al., 2010; Dolan and Davis, 1992; Orton et al., 2012]. A subsequent study similarly analyzed flood risk for cold- and warm-season storms, using data from an innovative Monte Carlo approach to create flood hazard statistics and to demonstrate the substantial seasonal differences in flood risk [Lopeman et al., 2015] However, the most prominent recent assessments of the present-day flood hazard at New York Harbor (NYH; the Battery tide gauge) disagree in their results, likely in part due to insufficient model validation against observations. Studies that have examined all types of storms have found the 100-year flood to be 2.44 m ( m at 95% confidence) [Zervas, 2013], and 3.50 m (with no confidence intervals provided) [FEMA, 2014b]. The Lin et al. [2012] study looked only at TCs and found a present-day 100-year storm tide of 2.03 m ( m at 90% confidence), which is substantially different from the same metric in the FEMA study, at 2.75 m. The
5 associated return period estimates for Hurricane Sandy s storm tide range from 100 years [FEMA, 2014b] to ~1500 years [Zervas, 2013]. These substantial differences in both the TC-only assessments and the complete flood assessments (TC plus ETC) may arise due to insufficient validation of flood modeling for specific historical events validation of storm tide modeling in the Lin et al. [2012] study was simply referenced to prior studies by other groups [e.g., Colle et al., 2008] and not performed with the specific simplified meteorological modeling methods used in their study. Validation of the FEMA study included evaluations of tides and 7 historical storms, but did not include the largest storm surge event in the study period of , a 1950 ETC [FEMA, 2014b] Several challenges complicate any assessment of the storm tide hazard for the region. Compared with the more heavily studied United States Gulf Coast, the larger tides in NYH increase the potential height of storm tides and also increase the magnitude of non-linear interaction between tides and surge. ETCs are the most common cause of flooding [Colle et al., 2010], a cold-season contribution to flood risk that is often neglected for warmer climates and even for NYH [e.g., Aerts et al., 2014]. TCs produce extremely rare, long-tail probability distribution events [Lin et al., 2010], that are difficult to predict. The converging New York Bight coastline also adds the potential for amplification of rare events where strong winds blow from the southeast quadrant. However, TC storm tracks typically veer eastward as they approach, so the area has a relative scarcity of historical TC floods upon which to base a hazard assessment. As a result, a hazard assessment method is needed that is not overly reliant on local historical storm tracks, such as is the case with the widely-used Joint Probability Method [e.g., Toro et al., 2010]. 112
6 In this paper, we present a thorough modeling study that quantifies the present day NYH flood hazard. We address the difficulties illuminated above, by separately assessing TCs and ETCs and including detailed validation of modeling and assessment results, ensuring they are consistent with historical observations and assessments, within uncertainty. The present-day storm climatology is based on recent historical ETCs and synthetic TCs. We utilize a new statisticalstochastic TC simulation method that utilizes historical storm data from the entire North Atlantic basin ( ) to create a set of synthetic storms that could affect that region. We also use an ETC assessment method where several historical storm events ( ) are simulated with 50 repetitions of random tides, capturing the important contribution of tides to flood levels. Section 2 summarizes methods including storm climatology development, atmosphere and ocean modeling, statistics, and uncertainty quantification. Section 3 is a reassessment of the 1821 hurricane storm tide, as well as a similar but less-studied event in 1788, both useful for model validation and context for Sandy. Section 4 presents study results including validations and exceedance curves (storm tide versus return period), Section 5 is a discussion of results that addresses differences between ours and other studies, TC and ETC storm tides, looks at the role of tide-surge interaction, and discusses the implications of the findings regarding the 1788 and 1821 hurricanes, and Section 6 lays out the primary conclusions of the study Methods A detailed operational ocean forecasting system was leveraged to run three-dimensional ocean simulations for a flood hazard assessment that accounts for a full climatology of TCs and ETCs,
7 seasonal cycles of sea level, stratification and air temperature, and a complete range of the region s possible tides. The goal is to accurately estimate storm tides at New York Harbor for return periods from 5 to years. Storm tides are defined here as the water elevation above a year s mean sea level. The hazard assessment separately integrates storm tide data over a climatology of TCs and ETCs, then merges the exceedance probabilities to quantify the total flood hazard. This is done because TCs occur less frequently and represent the worst flood events in NYH history, whereas ETCs occur more frequently (many times per year) and represent the more common, less-extreme flood events (Figure 1) Methods for developing sets of TCs and ETCs representing their present-day storm climatology are described in detail below in Sections 2.1 and 2.2, respectively. The historical record may not adequately represent the large TC storm tides, as there have been only a small number of events (Figures 1 and 2a). So, we use an ensemble approach where TCs are represented by a large number of synthetic storms created with a statistical model. This model leverages historical TC data from the entire North Atlantic Ocean from to create a 1 million year (1 My) record of TC activity. A subset of 606 TCs that spans the range of the TC flood hazard was selected from the full storm set, and simple parametric equations are used to represent each TC s wind and pressure forcing for the ocean model. We have no similar synthetic ETC model, but nearly 200 years of historical ETCs have a well-defined range of storm tide with no significant outliers (Figure 1) as long as we consider the powerful hybrid Sandy as part of the TC storm set. This separation enables us to use an existing set of 30 of the worst historical ETC storm surge events from to represent the present-day climatology, as was done by FEMA [2014c]. The worst ETCs are simulated with 50 tide scenarios to capture a near-complete range of
8 possible storm tides for each storm, because of the high importance of tides for ETC flooding in this region (see Section 2.4). Meteorological data from atmospheric reanalyses is used for the ETCs as ocean model forcing The flood hazard statistics are based on hydrodynamic modeling, described below in Section 2.3, instead of historical water levels, for three primary reasons (1) to merge tides and storm surge dynamically, as described in Section 2.4, as well as potentially other factors such as rainfall, (2) to estimate the storm tide over an entire region, not just at tide gauges, thus overcoming a limitation of tide-gauge based assessments; and (3) to account for realistic storm events and tide/storm combinations that have not occurred in the limited historical record. Synthetic events provide improved estimation of low probability events such as the 1% annual chance (100-year) storm tide, and even enable estimation of the 0.01% annual chance (10000-year) storm tide A heavy emphasis is placed on model validation using historical events, to leverage historical data and avoid bias. Validation should address the specific coupled ocean-atmosphere simulation methods, as error may exist in the ocean, atmosphere, and their coupling. Rare severe storm tide events are outside the normal range of variability, and thus forecast-oriented ocean models may be tuned toward normal conditions or annually-recurring storm conditions. In addition, atmospheric forcing data is typically a strong determinant of storm tide modeling accuracy [e.g., Colle et al., 2015; Orton et al., 2012]. Historical meteorological reanalyses are available for the ETCs [FEMA, 2014a], but simplified wind and pressure fields are used for the TCs, raising the possibility that oversimplification would lead to biases in the storm tide simulations. Historical storm validations for each storm type are given in Section 4, and include 42 historical events.
9 The storm tide error resulting from coupled ocean-atmospheric modeling is then incorporated in uncertainty analyses (Section 2.5) TC modeling and reduced storm set TC data are produced using a statistical-stochastic model of the complete life cycle of North Atlantic TCs, initially developed by Hall and Jewson [2007], and extended in Hall and Yonekura [2013]. The model consists of four components: genesis, propagation, and intensity (Vmax) and size (Rmax). Genesis, propagation, and Vmax are documented in detail in Hall and Yonekura [2013]. Genesis and propagation are based on optimized local regression of HURDAT data [Landsea et al., 2004] on repeating annual-cycle and interannually-varying climate covariates (500 mbar winds, North Atlantic subtropical SST with respect to the global subtropical mean, and ENSO state), while Vmax is based on a random sampling scheme with perturbation. A spacedate kernel-density PDF modulates the genesis rates to enforce seasonality. Rmax is modeled by log regression with Vmax and latitude covariates [e.g., Vickery et al., 2000], using extended besttrack data, [Demuth et al., 2006]. The error term is treated as lag-one autoregression The TC model is developed with historical HURDAT TC data from the entire North Atlantic Ocean from to create a synthetic million-year record of TC activity. The 1950 cutoff represents a compromise between the desire to maximize data quantity and data quality. TC aircraft reconnaissance only began in the late 1940s, and there is evidence for undercounts of non-landfalling TCs in the earlier part of the HURDAT record [Vecchi and Knutson, 2011]. A cutoff of 1950 should largely avoid these early quality issues. 204
10 The probability of a storm s temporal maximum storm tide ( max) exceeding a given arbitrary level ( ) is the multidimensional integral of the hurricane incidence probability times the conditional probability of inundation: P ) f ( x) P( ( x) ) dx (1) ( max max x Here, x is the vector of hurricane hazard variables (e.g. landfall intensity, size, location, bearing, and propagation speed), f(x) is the annual occurrence frequency of hazard x, and P( (x)> ) is the conditional probability that a storm of these characteristics will cause a storm tide in excess of an arbitrary value. The probability of hurricane event f at x is determined by the frequency of its set of TC parameters in the large stochastic hurricane set. As it stands, the integral in Eq. 1 suffers from the curse of dimensionality. It is too large to solve directly; for example, if x represents 10 hazard variables, each sampled at 5 values, then there are nearly 10 million (5 10 ) combinations, or nodes, at which P(h x) must be evaluated using the hydrodynamic model. As noted in prior studies [e.g., Condon and Sheng, 2012; Toro et al., 2010], approximation methods must be utilized Our approach is to limit the number of hazard variables to five, with each coarsely sampled: five landfall gates (Figure 2b), three landfall angles, six categories of intensity (wind speed), three storm sizes, and three storm translation speeds, the latter three variables evaluated at the last 6- hour time step prior to landfall. The intensity categories are 0 for tropical depressions and tropical storms, and 1-5 for the Saffir-Simpson categories. Landfall angles are defined counterclockwise from gate parallel, and are 0-45, 45-90, and degrees. These are not evenly spaced, but have finer divisions for storms heading NW-to-N across gates 0 and 1, and NE-to-E across gates 2-4, due to storms having preferred tracks in these directions, versus the larger
11 impact angles. The gates are chosen to capture all possible TC events with surges over 1.25 m (e.g. Figure 2a), capable of causing storm tides exceeding ~2 m. The potential for low-bias in our flood assessment, due to missing storms outside these gates, is evaluated at the start of Section 5.2. This method is different from studies that use optimal sampling [e.g. Toro et al. 2010], as the storm set is not optimized and leaves us with some storms with very low annual rates. However, our hydrodynamic/wave model is relatively fast compared with the models and resolutions used in that study, and we did not see a need for optimization to reduce the number of storms. Other studies use runs for all storms over a predefined period with a coarse, fast model (SLOSH), then run the most important (e.g. largest) ones using a detailed model [Lin et al. 2010; 2012] We refer to the specific combination x of hazard variables as the TC flavor, and the permutations of the five parameters give a total set of 810 TC flavors. The number of landfalls in each flavor in the million-year dataset defines the annual landfall rate simply as the number of events divided by 1,000,000 y. There are 204 storm flavors that are not observed to occur in the dataset, so the total storm set of probable storms comprises only 606 storm flavors. For each storm flavor, one storm is randomly selected as a representative event, and several of these tracks are shown in Figure 2. Compared with the total number of storms crossing the five gates in the million-year period, TCs, this set of 606 is much more tractable for numerical simulation. To quantify the typical variability of storm tides within a flavor, we separately simulated 50 events for 12 of the TC flavors, discussed below in Section
12 Data needed for creating wind, tides and other forcing data are provided from the Hall TC model, including date and time (for tides and seasonality of temperature and salinity), year (for tides, between 1950 and 2013), latitude, longitude, radius of maximum winds (Rmax) and speed of maximum winds (Vmax). Additional parameters needed are the central pressure (Pcentral), pressure drop P (or equivalently, the far-field pressure), and the Holland-B parameter, as described below. The Hall TC data are modeled on the 6-hour time step that is native to HURDAT, so we interpolate the data from 6 h to 60 min (SNAP grid; see Section 2.3 on ocean model grids) and 15 min (NYHOPS grid) prior to projection onto the ocean model grids as forcing. The 6-hour time step where a TC makes landfall should not be interpolated, as this would lead to a continuous weakening over a 6 h period, whereas storms weaken more abruptly after making landfall. To avoid interpolation and excessive storm weakening before landfall, wind speeds in the last 6-hour time step before landfall are projected forward without change up to the first 6- hour time step after landfall Synthetic TC pressure forcing The Hall TC model has not included central pressure (Pcentral) in prior publications, and a model was required here, due to the importance of atmospheric pressure for storm surges. Pcentral and Vmax are tightly, but imperfectly, correlated measures of TC intensity. A variety of regression relationships were tested to relate the central pressure deficit ( P = Penv - Pcentral) to Vmax. A successful candidate was: P = a0 + a1vmax + a2vmax 2 + a3vmax 3 + a4sin(lat) + a5vmaxsin(lat) + (2) The fitting was performed using HURDAT data from for TCs, and using climatological pressure for the ambient pressure, Penv. However, data prior to the 1970s plays
13 almost no role, as there are few Pcentral data. To test whether the resulting regression coefficients are significantly different from zero, a generalized jackknife test was employed, in which the model is refit multiple times with random 80% subsets of the data. We found that the linear term (a1) is not significantly different than zero, but the remaining terms are. Thus, the model we use is: P = a0 + a2vmax 2 + a3vmax 3 + a4sin(lat) + a5vmaxsin(lat) + (3) Here, a0 = , a2 = , a3 = e-5, a4 = 6.587, and a5 = for units Vmax m s -1 and Pcentral in hpa. The error ( ) term constitutes the stochastic component of the model. It is = x(t), where is the RMS variance of the residuals, the anomaly x(t) is lag-one autocorrelation (AR(1)): x(t) = c*x(t-1)+sqrt(1-c 2 ), c is the autocorrelation coefficient (ACC), and the standard normal forcing. We found the best results by making depend on Vmax: = b0 + b1vmax. The error-model coefficients are fit by an iterative process to minimize overall model variance from observations, and are b0 = 0.944, b1 = 0.161, and ACC = The model we use for radial profiles of pressure, P(r), is Holland [Holland, 1980]. exp (4) Here, it is assumed that the exponential pressure profile radius is equal to the radius of maximum winds (Rmax), though for moderate-sized and large-sized storms, the pressure radius becomes larger. The differences are small relative to the natural scatter in both variables [FEMA, 2014c]. Parameter B controls the profile shape, and is related to the maximum wind speed and pressure deficit [Holland, 1980]: B = Vmax 2 exp(1) / P (5) Here, is air density, computed from seasonally-varying air temperature.
14 Synthetic TC wind forcing The Sea, Lake, and Overland Surges from Hurricanes (SLOSH) wind profile model [Jelesnianski et al., 1992] can be expressed as:, (6) Here, Vvortex is the vortex wind speed, r is the radial location, Vmax,sym is the symmetrical maximum wind speed, and Rmax is the radius of maximum wind. The relationship between the symmetrical maximum wind speed and the maximum wind speed is:, (7) Here, is the background wind modification factor, and Vstorm is the storm translation speed. Departing from normal NWS SLOSH wind modeling, for the contribution of the background winds, we add the background wind velocity to the vortex wind velocity after using an empirical estimate of inflow angle of 20 degrees, and a modification factor of 0.55, shown to be more accurate representations of modeled wind and storm surge [Lin and Chavas, 2012] An empirical model of wind inflow angle is applied to the TC vortex winds [Bretschneider, 1972; Phadke et al., 2003]. Lastly, the TC vector wind velocity is the vector sum of the vortex wind velocity (V vortex ) and background wind velocity (V storm ) [Lin and Chavas, 2012]: (8) TC maximum wind speed in the HURDAT database and from the Hall model is the 1-minute maximum sustained wind, yet the ocean model requires 10-minute averages, so winds were
15 reduced by a 0.93 factor to account for gustiness [Harper et al., 2010]. This is done because the 1-minute maximum sustained wind is actually a gust, and because the model s wind stress is computed using a drag law that was developed using 10-minute average winds. An example of synthetic TC wind forcing applied to a historic storm, the 1821 hurricane, is shown in Figure 3, and validation of historical TCs with these methods is covered in Section ETC modeling and storm set A set of 30 regionally severe ETC storm surge events from was recently created for the FEMA [2014b] study, with reanalyses of wind and surface pressure created by Oceanweather, Inc. The reanalyses were constructed using the Interactive Objective Kinematic Analysis system and a wide variety of data (e.g. buoy, satellite), as described in Cox et al. [1995], and summarized in the recent FEMA [2014a] report. These 30 ETCs were selected from a 60 year period ( ), so each storm is given an annual rate of 1/60 y -1 in the assessment, following a peaks-over-threshold type assessment approach [Pickands, 1975]. We use hindcasts with historical tides for validation, but for the hazard assessment we simulate each storm with random tides and the 19 largest ETC surge events are simulated 50 times with different random tides, as explained in Section The FEMA ETC storm set we use here includes 8 of the top 10, and 19 of the top 30 ETC surge events at the NYH Battery tide gauge in the period (Table 1). Some events are missing due to unavailability of good marine meteorological data for the earlier periods (1950s and 1960s), and some are missing because the FEMA study was a regional study with the goal of creating a storm set for the entire study area of New Jersey and the New York City region
16 including western Long Island Sound, not only for NYH. To account for the two missing storms in the top 10, the annual occurrence rates of two storms with similar surges were simply doubled in the statistical analysis. The surge ranked #5 for was missing ( ; 1.53m surge) and was replaced by doubling the rate of #4 ( ; 1.57m); #7 was missing ( ; 1.47m) and replaced by doubling the rate of #6 ( ; 1.49m). Similarly, 9 storms ranked in the #11-30 range were missing, so nine storms rates were doubled for the statistical analysis (see Table 1). Lower surge events (below the top 30 in the 60 year period) are not fully represented in the statistical analysis, but appear to have little effect on the tail of the distribution which is of interest for 5-year and longer return periods Hybrid TC/ETC storms are classified differently in our study depending on how they are represented in the HURDAT database. While Sandy officially became an ETC just prior to landfall [Blake et al., 2013], we include Sandy in the assessment as a TC because Sandy is in the HURDAT database and its entire life cycle until landfall is part of the data that informs our statistical TC model. On the other hand, the ( The Perfect Storm ) is in the ETC set, though it was associated with a hurricane. According to HURDAT, the storm was purely an ETC up to the time of the peak storm surge at NYH, and only later did it transition to a hybrid storm. This storm had only a moderate surge at NYH of 1.41 m (ETC rank: #8; Table 1). Its data does not inform the statistical TC model because by the HURDAT database it began as an ETC and later became a TC. The impact of this separation is addressed in Section Detailed ocean modeling using the NYHOPS system
17 The Stevens ECOM (secom) three-dimensional hydrodynamic model [Blumberg et al., 1999; Georgas and Blumberg, 2009; Georgas et al., 2014; Orton et al., 2012] has been providing highly accurate storm surge forecasts on its NYHOPS grid/domain ( NYHOPS) for over a decade with mean water level errors of 0.10 m [Georgas and Blumberg, 2009]. The NYHOPS domain includes the Mid-Atlantic and Northeastern U.S. coastline from Maryland to Rhode Island (e.g. Figure 3). The NYHOPS secom domain includes measured or modeled freshwater and heat inputs from 544 sources including tributaries, power plants, wastewater treatment plants, and sewer inputs [Georgas and Blumberg, 2009; Georgas, 2010] A major uncertainty in storm surge modeling is the sea surface drag coefficient parameterization [Cardone and Cox, 2009; Lin and Chavas, 2012; Resio and Westerink, 2008]. Hindcast studies of two recent TCs with secom on the NYHOPS grid have found that replacing the wind drag parameterization used by the operational system [Large and Pond, 1981] with a wave-slope sensitive parameterization [Taylor and Yelland, 2001] gives improved results and RMS errors of 0.15 m for Tropical Storm Irene [Orton et al., 2012], and 0.17 m for Hurricane Sandy [Georgas et al., 2014], and the latter is used here. Recent studies have presented evidence that the drag coefficient hits a ceiling at high wind speeds [e.g., Powell et al., 2003], but this saturation has not been demonstrated for the shallow coastal ocean. Cardone and Cox [2009] point out that, due to uncertainties in wind and air-sea interaction physics, it is common to tune the drag coefficient ceiling based on model validations. Here, we find that the best fit for historical TCs (measured with RMS error) is attained with a drag coefficient ceiling of We use the same ceiling value for ETCs in this study, although the choice of ceiling value has a much smaller effect on ETC storm tides because the ETC wind drag here almost never exceeds
18 Modeling of each storm with secom is first performed on the Stevens Northwest Atlantic Predictions (SNAP) grid that extends to the Gulf of St. Lawrence and Cape Hatteras and ~2000 km offshore. Having a domain of this large extent can be crucial for remote sea level forcing for large TCs and for all ETCs (Figure 4). For the SNAP grid, secom is run with wind and pressure forcing (no tides or streamflows), with constant ocean temperature and salinity. Water elevation boundary conditions are based on a local inverse barometer calculation using atmospheric pressure The modeling on the nested NYHOPS grid is set up with clamped offshore water elevation boundary conditions that are a sum of timeseries of tides, surge from the SNAP domain, and mean observed seasonal variations in mean sea level, which vary from -10 cm (January) to +7 cm (September). All model runs for TCs are 6 days, allowing for 3.5 days spin-up time prior to storm landfall. Model runs for ETCs are 10 days, allowing for similar spin-up time but longer storm durations. Vertically- and spatially-varying ocean initial conditions (salinity and temperature) and a spatially constant air temperature (important to wind stress) are set as seasonally-varying climatological values. Freshwater inputs have only a very small effect on temporal-maximum NYH storm tides, on the order of a few centimeters [Orton et al., 2012], but modeled (TCs) and historical values (ETCs) were utilized to avoid any bias secom is coupled with a modified form of the Donelan [1977] wave model [Georgas et al., 2007; Georgas and Blumberg, 2009; Orton et al., 2012], including wave-slope sensitive wind stress as mentioned above [Taylor and Yelland, 2001] and wave-current bed stress. Bed stress is
19 adjusted due to wave-current interaction based on the theory of Grant and Madsen [Grant and Madsen, 1979], simplified by assuming co-linear waves and currents [Signell et al., 1990]. However, wave set-up of sea level due to breaking waves is not included. Inside a harbor like NYH with a wide deep entrance, wave setup is not expected to be large and one prior published study found a contribution to storm tide that averaged below 1.5% [Lin et al., 2012]. Nevertheless, this constitutes a low-bias, and its elimination is discussed in Section Tide forcing Tides were included in hydrodynamic simulations for each storm, to fully account for their wellknown nonlinear interaction with storm surge [e.g., Horsburgh and Wilson, 2007; Pugh, 1987; Tang et al., 1996]. The tides are modeled as normally is the case with the NYHOPS forecasting system, using nine constituents, equilibrium arguments and nodal factors to accurately cover semi-diurnal, diurnal, spring-neap, monthly, and interannual variations [Georgas and Blumberg, 2009]. Tide timeseries are imposed at the NYHOPS grid s offshore boundary and based on the EC2001 tide database [Mukai et al., 2002] For ETCs, to include a wide variety of random tide-surge phasing and build a smoother rate distribution for the statistical analysis, the 19 most intense storms (largest historical surge) were each simulated 50 times with different random tides from any date in this same year range (Table 1). Each of these storms annual rates was correspondingly divided by 50 in the statistical analysis. The remaining 12 storms are simulated only once and kept in the storm set for validation and for future studies of broader regional interest (e.g. the New Jersey coast), but have
20 only a small influence on the area of the storm tide distribution that is relevant for 5-year and longer return period events With TCs, where we have a much larger storm set (606 storms), we use a computationally inexpensive approach of simulating only one random tide, but smoothing the probability distribution to account for tide variability. We randomly select a tide timeseries within hurricane season from The distribution smoothing is done within the same framework as used for random storm selection (Section 2.1), by including random tides in the simulations of the 50 events for 5 of the TC flavors, discussed further in Section 2.5. This simplified smoothing approach for tides may lead to greater uncertainty, but on average the tides account for 36% of the peak ETC water levels in Figure 1, relative to only 10% for the TCs, and a prior study has noted a decreasing importance of tides for increasingly large TC storm tide events [Lin et al. 2012] Statistical analysis and assessment uncertainty Temporal maximum storm tides ( max) were compiled for each model run s 10-minute outputs datasets for analysis using exceedance statistics. Rate distributions (similar to probability distributions) were formed from these data and each storm s annual rate. Similar to Niedoroda et al. [2010], we do not use fitted distribution types in place of the resulting empirical rate distributions of storm tides, because we do not want to enforce a theoretical shape on the distribution when the results of the physical models can define it instead. Moreover, we are representing the tails smoothly, in the case of ETCs by using a large number of random tide simulations, and in the case of TCs with a large number of storm flavors, and smoothing,
21 described below. The inverse cumulative rate distribution is equivalent to the exceedance probability curve, and these are presented in Section 4.3 with return periods (inverse probabilities), as flood exceedance curves Each of the 606 TC flavors was represented using only one TC and one random tide event, as explained above. Each modeled storm tide result represents max(x) in Eq. 1 as a single value, yet one should ideally represent all the possible tides and TCs that occur within a flavor, and represent max(x) as a distribution of values instead. To study the distributions for a range of TC storm tides, we separately simulated 50 events for 12 of the TC flavors, with four ~1.5 m, four ~2.1 m, and four ~2.7 m TC flavors (average storm tide within the flavor). The chosen flavors were chosen to span both the New Jersey and Long Island coasts and have relatively high rates of occurrence (above y -1 ). The storm flavors were segregated into these three categories, and data for each flavor were differenced with their mean and merged to view the aggregate distribution of TC storm tides for each of the three categories. These aggregated distributions were fit with Generalized Extreme Value (GEV) distributions, shown in Figure 5, and show that the larger events were approximately Gaussian, the smaller events exhibited a positive skew, and the moderate events had a positive skew with a long-tail. The standard deviations of the small, moderate, and large events were 0.29, 0.58 and 0.67 m, respectively. These results show a clear floor on storm tides at about 1.0 m, which is due to tidal variations; high tide is typically m above mean sea level, and a surge event leads to higher values. The raw TC rate distribution is smoothed using these three GEV distributions, interpolated to cover the entire range of storm tide GEV distribution parameters for the 1.5 m case were used for smoothing
22 the TC storm tide distribution from 0 to 1.5 m, interpolated between 1.5 m and 2.7 m, and parameters for the 2.7 m case were used for smoothing the distribution at 2.7 m and above Uncertainty in the final TC flood exceedance curve was quantified as the spread above and below the median using 1000 Monte Carlo simulations, where in each case random Gaussian noise with a standard error equal to the total uncertainty was added. This uncertainty is the combination of RMS error in the validation, in the annual rates of each TC flavor, and in the use of using a single random tide and single storm per TC flavor. Regarding the annual TC rates, based on the TC-model jackknife uncertainty analysis in Hall and Sobel [2013] we use a ±20% (±2 sigma) uncertainty at the 0.01 y -1 rate, linearly increasing to ±80% at y -1. Regarding the use of a single tide and storm per TC flavor, we use standard deviations described above and illustrated in Figure Uncertainty in the final ETC flood exceedance curves was also quantified using 1000 Monte Carlo simulations, including a bootstrap re-sampling of historical events, of which there were effectively 41 after the doubling of rates for 11 storms. Random Gaussian noise was first added to results of each of the simulated storms, with a standard deviation equal to the RMS error in the validation (0.19 m). By running 50 iterations with random tides for all the important ETCs, it is assumed that uncertainty due to the contribution of random tide assignment is negligible Reassessment of extreme NYH storm tides back to 1700
23 Multiple hurricanes flood events in the 18 th and 19 th centuries [Brandon et al., 2014; Scileppi and Donnelly, 2007] suggest that large, possibly Hurricane Sandy magnitude events may occur once every order-of-100 years, so a better understanding of these rare extreme events is needed to understand flood risk in NYH. Qualitative historical storm and flood reports for NYH are available from newspapers and historical archives, and have been extensively reviewed [Boose et al., 2001; Kussman, 1957; Ludlum, 1963]. Estimates of wind velocity are also available for all events affecting the New England and NYC area back to the 1600s [Boose et al., 2001; Boose et al., 2003]. These data suggest that the estimated Category-3 hurricanes of 1788 and 1821 exceeded 2.5 m and possibly even 3.0 m storm tides [Kussman, 1957; Ludlum, 1963; Scileppi and Donnelly, 2007] To better understand and constrain the contribution of the 1788 and 1821 events to flood hazard, we reassess available archival data below (Section 3.1) and then simulate these events using best available data to check archival estimates (Section 4.2). To ensure against model bias, we apply the same modeling approach to reassess an August 1893 Category-1 hurricane whose storm track passed directly over NYH, as well as several other TC events. Such validation is necessary because archival estimates based on contemporary accounts can be mistaken; for example, the 1893 event was long thought to have caused a storm tide of 3.0 m +/- 0.5 m at NYH [Scileppi and Donnelly, 2007], but was recently shown to have registered a peak storm tide of only 1.6 m at NYH [Talke et al., 2014] The 1821 Norfolk and Long Island Hurricane
24 Records suggest that the 1821 hurricane struck NYH at low water, with peak winds occurring between 6 pm and 7:30 pm [Espy, 1839; Redfield, 1831]. Data for the storm such as wind magnitude, direction, and track were also compiled by Redfield [1831], [Espy, 1839], and modern sources [Boose et al., 2001; Boose et al., 2003; Kussman, 1957; Ludlum, 1963; Swiss Re, 2014], and suggest a fast moving storm eye (~50 km h -1 ) with a large storm surge or storm tide from Norfolk (3 m) to New York. Using 19 th century hourly tide data from Governors Island (NYH) to compute the tidal constituents [see Talke et al., 2014], we hindcast that a low tide of ca m below sea-level would have occurred at approximately 18:45 local time (EST) on Sept. 3, Wind speed measurements were not available during the 1821 storm, but dozens of observers along the U.S. East Coast made detailed observations of wind direction (eight points of the compass), qualitative reports of speeds, and detailed reports of damages [Ludlum, 1963]. These have recently been summarized [Boose et al., 2001; Elsner, 2006], and two estimated timeseries of storm location, maximum wind speed, and radius-to-maximum-wind have been derived based on this information [Boose et al., 2003]. Upon arrival at NYC, Boose et al. [2003] estimate a Rmax of 50 km, a Vmax of 51.4 m s -1 (a weak category 3 hurricane), and a storm translation speed of 12 m s -1. Separately, central pressure, Rmax, and translation speed near landfall have been estimated to be 965 mbar, 56 km and 15 m s -1 [Elsner, 2006] A recurrent misunderstanding about the extreme water levels at NYH produced by the 1821 event stems from Redfield [1831], who states that a 13 foot storm tide occurred from low water. Subsequent investigations have interpreted low water as the predicted low tide of -0.4 m
25 on September 3 rd, which implies that a storm tide of 13 ft (3.96 m) reached a height of approximately 3.2 m above MSL1821 [Ludlum, 1963; Scileppi and Donnelly, 2007]. However, contemporary newspapers upon which Redfield [1831] is based reported an exact surge of 13 ft, 4 in (4.0 m) in the East River relative to low water mark [The Gazette and General Advertiser, Sept ; see Boose et al., 2003; Kussman, 1957]. Here, as suggested also in Kussman [1957], we assert that the low water mark (LWM) was most likely an extreme low water datum, rather than the predicted low water for the evening of Sept. 3 rd, The inference of an LWM datum is supported by nautical maps such as Blunt s American Coast Pilot of 1827, or the US Coastal Survey map of These early maps, which referenced their depths to tidal datums using tide measurements, base their topography on an extreme low water datum called low water. The 1844 Hassler map datum explicitly uses the measured spring low water on Oct. 23 rd and 24th, 1835, which harmonic analysis suggests was approximately -1.0 m below MSL1835. Considering typical variation between measured and predicted tides, we suggest that the LWM datum used pre-1850 was approximately /- 0.2 m below MSL1821. We further assume that the 1821 measurement of 4.0 m carries a precision of +/- 0.2 m (we consider it probable that the storm tide estimate was made after the fact based on water-line or debris-line measurements, rather than direct observation, given the severity of the event and the 4 day time lag before the number was published) Considering these factors, we estimate that the storm tide of Sept. 3, 1821 was approximately 3.0 m ( m at 95% confidence) (Table 2), and represents a storm surge of 3.4 m, or 0.6 m larger than the hurricane Sandy storm surge. Our storm tide estimate approximately agrees with
26 the Kussman [1957] storm-tide estimate of 2.7 to 3.0 m relative to MSL1821, based on contemporary flooding accounts of structures, and is within the error bounds of the 3.2 +/- 0.5 m estimate of Scileppi & Donnelly [2007]. Because mean sea level at the Battery was 0.50 m lower in 1821 than 2012 [Kemp and Horton, 2013], and the storm tide was 0.4 m smaller (Table 2), the 1821 peak water elevation was 0.9 m lower than Sandy in absolute terms The 1788 hurricane News accounts and data compiled by Boose et al. [2001] and Ludlum [Ludlum, 1963] describe a small and fast hurricane that made landfall in Delaware Bay and traveled overland to NYH, parallel to the coast. "The storm that began on Monday, continued on Tuesday, and augmented to a greater degree of violence, wind at SE and ESE. At half past 11 increased to a perfect gale, which raged near half an hour with irresistible fury. Shipping would have been greatly damaged had not the wind shifted suddenly to E.N. and NW about mid day." (The Providence Gazette and Country Journal, Tues. 8/30/1788). "For upwards of 23 minutes it blew with incredible fury; and had the wind not suddenly shifted to the N every vessel in the harbour must have been drove on shore." (The Independent Journal (NYC), Wed. 8/20/1788) Upon arrival at NYC, Boose et al. [2001] estimate a Rmax of 50 km, a Vmax of 51.4 m s -1 (a weak category 3 hurricane), and storm track and timing data that imply a storm translation speed of 17.5 m s -1. The Boose storm track estimate suggests a fast storm translation speed of 17.5 m s -1 [Boose et al., 2003]. The Boose paper estimates storm sizes in categories of 50 km, 75 km and 100 km, but the news accounts and debates about whether it was a squall or a hurricane [Ludlum, 1963] suggest it was smaller than the 50 km minimum scale allowed in the Boose study. Also,
27 the extremely brief period of high winds has been used to infer that the 1788 hurricane was a small, fast-moving storm [Ludlum, 1963]. If we take 11:30 EST to be the time of maximum wind, 11:53 EST ( 23 minutes later) to be the time the eye began passing over NYC, and 12:00 EST ( about mid-day ) to be time of the directional switch, then the storm center passed at about ~11:57. A 27-minute time with a storm traveling ~63.5 km h -1 leads to an estimate of 29 km for the radius of maximum winds. We estimate with tide-only modeling that the high tide on 19 August 1788 at 09:30 EST would have been m, and the peak water level of 2.9 m would have occurred 2.75 h after high tide, at 12:15 EST, when the tide was at -0.1 m MSL. This contrasts with 1821, where the storm surge occurred at low tide Flood-driven damages of the storm in NYH included destruction of the Battery seawalls, many wharves, several bridges, and a filling in of many cellars on Lower Manhattan streets such as Front, Water and to a lesser extent Queen (now called Pearl Street) [Boose et al., 2003], similar to the 1821 TC. "It was full sea at 6 minutes past 11 A.M. but it still flowed until 12, when there was a rise of water of at least 5 feet higher than usual, which filled all the cellars in Front Street, besides many in Water Queen Streets, and on the North River [Hudson River]." (The Providence Gazette and Country Journal, Tues. 8/30/1788). Wind-driven damages from the roughly 50 m s -1 winds were also severe, with chimney and roof damage to many homes on Manhattan [Boose et al., 2003] The 1788 hurricane s storm tide has previously been estimated as 3.0 m at NYH (error bars from 2.5 to 3.5 m), based on the flooding of basements on Front and Water Streets and their present- day elevation [Scileppi and Donnelly, 2007], and multiple studies state or imply that the storm
28 tide was lower than that of the 1821 TC in the region [Donnelly et al., 2001; Scileppi and Donnelly, 2007]. We interpret " at least 5 ft higher than usual" as meaning 5 ft above spring high tide, meaning the 'usual variability of water', not mean high water [Again, the pre-1850 convention was to use spring tides when discussing a tidal datum; see e.g.,shalowitz, 1964]. By that interpretation, the storm was at least 1.52 m (5 ft) above the spring-high water line of 1.0 m, or, in other words, a storm tide of at least 2.5 m. Based on the water levels and damages described above, it is clear that it was nearly as high a storm tide as the 1821 hurricane, giving a likely range from 2.5 m up to the 1821 high-end estimate of 3.3 m Our final quantitative estimate of the observed 1788 storm tide comes from newspaper reports in September 1821, which state that the high water line for the 1821 event exceeded the previous high at a tidal mill by 0.10 m [ 4 inches ; Kussman, 1957, page 47]. No other known hurricane storm tide (e.g. 1805,1815) came close to the 1788 event, according to news quotes from Boose et al. [2003], so the 'previous high' appears to have been from Along with our 1821 estimate of 3.0 m, we use this to finalize our estimate as 2.9 m (2.3 to 3.3 at 95% confidence) for the 1788 TC storm tide. We use a larger low-end uncertainty for both the 1788 and 1821 events to account for our observation that contemporary accounts (e.g. newspapers, diaries) often overestimate, but seldom underestimate, storm tide magnitudes (e.g. the 1893 event mentioned at the top of Section 3). The resulting temporal-maximum storm surge estimate, differencing this estimated storm tide and the modeled tide, is 3.0 m (Table 2). Because mean sea level at the Battery was 0.56 m lower in 1788 than it was in 2012 [Kemp and Horton, 2013], the 1788 peak water elevation was about 1.05 m lower than Sandy in absolute terms. 636
29 Results Before presenting results for the flood hazard posed to NYH by TCs and ETCs (section 4.3 below), we first show that our model reproduces historical events (section 4.2 below) and that our modeled TC storm climatology approach (described in section 2.1) produces landfall rates that are consistent with those estimated from a historical observation database (section 4.1 below) Tropical cyclone climatology and landfall return period validation The modeled annual rates, intensities, storm sizes and storm tides of each of the 606 TC flavors are summarized in Figure 6. The TCs are organized in order of the gate crossed, from 0 to 4 as defined in Figure 2. Rates of landfall of any TC through gates 0 through 4 are 0.058, 0.012, 0.035, 0.065, and 0.121, respectively. Gate 4 is the most likely to be crossed by a TC in any given year, due to being a relatively long gate and being in line with the more common offshore storm tracks. While storms crossing Gate 0 are half as likely as Gate 4, they typically cause a higher storm tide because the largest observed winds are to the right of the storm track in the northern hemisphere (Figure 6b). Broken down by intensity, categories 0 through 5 occur at annual rates of 0.205, , , , and , or return periods of 4.9, 19, 50, 100, 340 and y. Integrated over all events, there is between a 1/3 and 1/4 chance of a TC occurring in any given year (probability = 0.29). Qualitatively, these return periods match with historical experience; for example, 3 Cat-1 or higher TCs are believed to have struck the
30 NYH area (gate 2) in the last 240 years (1788, 1821 and 1893), or once every 80 years, giving an observed probability similar to the y -1 return period we estimate The modeled probability of a TC passing any of our gates (Figure 6) is validated by comparing against the measured HURDAT database from 1950 to 2013 (Figure 7). The modeled probability (red line) of an event with a certain sustained wind speed follows historical observations (blue line) well. Both the modeled and measured curve are concave down, such that larger wind speed events have a sharply lower probability of occurrence in this area. Model landfall is unbiased, or consistent with historical landfall rates, to the extent that the observed return period curve falls inside the 95% confidence range of model-based return periods (orange lines), which is the case Storm tide modeling validations We next validate that our modeling approach by comparing measured and simulated storm tides for ETCs (Figure 8). Modeled results show a small mean bias of m with an RMSE of 0.19 m. This mean bias is subtracted from all modeled ETC storm tides before use in the statistical analysis. After bias correction, only four events have an error on the peak storm tide of greater than 0.30 m, the , , and storms, at 0.34, 0.37, 0.41 and m, respectively. A close look at Figure 8 shows that the 1950 ETC model result (storm #1) is nearly identical to the observed historical values. The 1950 ETC simulation was initially found to substantially overestimate the observed storm tide by 1.2 m (58%). This was not likely a problem with the secom model; we also performed simulations with the same 1950 meteorological reanalysis
31 data using the model ADCIRC in unpublished work related to a separate study [Orton et al., 2015a], and found the same amount of overestimation. This strong overestimation, coupled with this event being easily the largest storm surge in the ETC storm set, together motivated a reduction of wind speed to create a model simulation that better represents the historical event. A wind reduction factor of 0.83 was found to create a near-perfect fit to the event s peak storm tide, as well as an RMSE of 0.16 m and mean bias of m for the storm tide timeseries. The justification for this adjustment is discussed in Section 5.3. Due to this tuning of wind speed, this storm s results are not included in the statistics shown in Figure A set of 12 historical events (Table 2) was selected for validation of the TC atmosphere-ocean simulation methods, including five large surge events from m (1788, 1821, 2012 Sandy, 1960 Gloria, 1985 Donna) and another seven that are in the more common m surge range. The TC validation data is built by comparing peak storm tide ( max) model results to observations (Figure 9). For the 1788 and 1821 hurricanes, this is the maximum model result in 10-minute output timeseries, as the observation is a high water mark. For the other storms, it is the maximum model result in decimated output timeseries, as we use the hourly historical observation timeseries from the Battery [NOAA, 2015] or Fort Hamilton, two measurement stations in NYH [Talke et al., 2014]. To emulate the methods used for the synthetic TCs, the wind and pressure for historical TCs were modeled using methods summarized in Section 2.1, with data at 6-hourly intervals Parameters for validation storms are from the HURDAT database [NOAA-NHC-HRD, 2015], Extended HURDAT [Demuth et al., 2006], the recent FEMA study [FEMA, 2014a], and for the
32 oldest storms Boose et al [Boose et al., 2003]. The 1788 storm simulation, however, uses an Rmax of 29 km, as estimated in the prior section, due to the strong evidence for it being a smaller storm than the minimum in the Boose study. Pressure timeseries for the 1788, 1821 and 1893 storms are from Eq. 3, with central pressures around the time of passage at NYH of 952, 952 and 976 mbar, respectively The model mean bias for the TC hindcasts using parametric forcing is below 1 cm and rootmean-square error (RMSE) is 0.32 m (Figure 9). Hurricane Sandy s peak storm tide is overestimated by 0.71 m, whereas a few other storms are underestimated by m (1944, 1960 and 1821). However, a majority of the storms are simulated very accurately, within 0.20 m (1788, 1893, 1954, 1976, 1985, 1999, and 2011). The 1788 modeled storm tide of 2.95 m was 0.05 m higher than our archival estimate, and the 1821 modeled storm tide of 2.66 m was 0.34 m lower the archival estimate. The 1821 TC meteorology is highly uncertain and it is not surprising that the storm tide modeling error would be large. Sandy was a hybrid ETC/TC before landfall, and therefore simplified parametric methods may not accurately represent the event physics; in fact, modeled wind speed peak was far too high (29%) and RMS error was also high (5.6 m s -1 ) in New York Bight, compared with observations. The large overestimation of the Sandy storm tide can be explained largely by these excessive wind speeds, as secom runs with an accurate meteorological reanalysis have lower wind speeds and give very accurate results [Orton et al., 2015b]. This is likely due to Sandy s being a hybrid storm; in looking at other recent TCs (e.g. Gloria, Irene) the parametric wind modeling is much more accurate (wind speed RMS errors of 2.8 and 3.5 m s -1, respectively). These considerations show that the hydrodynamic model is working well, and suggest that though individual events may be over or underestimated with a
33 parametric approach, an ensemble with a sufficient number of events will yield unbiased estimates of storm tide hazard Annual rate distributions and flood exceedance curves Annual rate distributions for ETCs and TCs are shown in Figures 10-11, and show a strong contrast in distribution shapes. The annual rate distribution for ETCs has a short tail, with the highest ETC storm tide at 2.67 m. The 1950 ETC is an important storm, due to its largest observed ETC storm surge (2.41 m), and its 50 simulated events with random tides have a spread from 2.00 to 2.67 m. The annual rate distribution for TCs (Figure 11) and the smoothed version (explained in Section 2.5) are both very long-tailed, with low-rate events stretching out to the highest value of 5.77 m (a annual rate). Many storms represent the tail of the distribution, with 127 storm tide events above 3 m, and 12 events above 5 m Storm tide exceedance curves with 95% uncertainty shading are shown for ETCs and TCs in Figures The results show 100-year storm tides of 2.28 m ( ) for ETCs, and 2.65 m ( within 95% uncertainty) for TCs. The uncertainty for the ETC flood exceedance curve is slightly larger due to the reliance on a small number of historical events over a 60-year period, and is quantified with the bootstrap re-sampling of these events in the Monte Carlo uncertainty analysis The model-based assessments for ETCs and TCs are broadly consistent with tide gauge observations, based on comparisons with observation-based return period analyses and empirical point-by-point return periods (Figures 12-13). The ETC observational data are annual maximum
34 storm tides for events that were not matched up to a HURDAT historical TC, and TC observational data are annual maxima for events that are in HURDAT. Annual mean sea levels have been removed to obtain the observed storm tides. Both the ETC and TC observation-based assessments use a Generalized Pareto Distribution (GPD) distribution fit of data from The ETC, TC, and combined storm tide exceedance curve are all shown in Figure 14. The results of the combined assessment show 10-, 100-, 1000-, and year return period events of 1.94 m ( at 95% confidence), 2.70 m ( ), 4.35 m ( ), and 5.77 m ( ) respectively. The storm tide hazard for shorter return periods is produced primarily by ETCs, while the risk of larger events with 100-year return periods or longer is almost exclusively driven by hurricanes Discussion It is imperative that model-based flood hazard assessments have rigorous model validation, together with a verification that final flood exceedance curve results are not inconsistent with observation-based assessments. Our TC and ETC flood exceedance curves are consistent with historical data, to the extent that our curves fall within the uncertainty of empirical return periods and observation-based GPD curves (Figures 12-13). The ETC flood hazard at NYH is relatively well-constrained, with a 95% confidence range for the 100-year storm tide from m, and our curve and uncertainty overlap. Our TC assessment results are also consistent with the observations, though the observation-based uncertainties grow larger with higher return periods,
35 making it easier to achieve consistency between the observation- and model-based curves. As such, this type of comparison is a more useful evaluation or validation for shorter return periods, but less useful, and not a powerful validation for longer return periods greater than the length of the observational record. Moreover, cases can arise where the observational record is short and lacks any extreme surge events, resulting in a lack of consistency with the model-based assessment. It may be necessary in these cases to use news reports (e.g. the 1788 and 1821 storm in this study) or paleorecords to better characterize the historical assessment of the flood hazard [Lin et al., 2014] The observational and model-based results also demonstrate the importance of separately evaluating TCs and ETCs, for locations where both influence flooding at the return periods of interest. Flood return period curves for ETCs and TCs at this location have sharply different slopes, due to their differing meteorology. One primary inflection point is visible in the modeled flood exceedance curve (Figure 14). The lower return periods, up to a return period of about 100 years, have a concave shape, due to the switchover from ETC to TC dominance. The higher return periods above 100 years have a convex appearance. As a result, flood hazard assessments must treat the storm types separately in validation and return period computations. Fitting a single probability distribution to a combined storm tide dataset with this inflection would lead to a poor representation of the flood hazard Physically, the convex shape of the flood exceedance curve at high return periods is likely a direct result of the convex shape of the TC wind speed exceedance curve (Figure 7). The latter is an expected result of TCs traveling northward into the mid-latitudes and encountering declining
36 sea surface temperatures, leading to declining intensity and a lower probability of the strongest TCs [Emanuel, 2000]. The convex TC flood exceedance curve at high return periods is also likely a result of negative feedbacks on storm tide, such as wind drag saturation, tide-surge interaction, and oceanic mixing of cold subsurface water, which can both weaken storms and reduce wind stress. However, extratropical transition is only coarsely captured in our assessment through the parametric TC variables, for example the increase in TC size with latitude. Thus, uncertainty in our results for longer return periods is likely underestimated. The concave shape of the observation-based flood exceedance curve in Figures 13 and 14 leads to higher storm tides at long return periods than the model-based curve. This is at least partially a result of including Sandy in a GPD analysis of only a 64-year record ( ; in Figure 13), whereas we know it was the highest event in over 314 years Results clearly demonstrate that ETCs dominate relatively short return period storm tides which occur every 5-10 years, while TCs drive risk for the 100-year and larger storms tides. The crossover return period for the TC and ETC curves is at 60 years (Figure 14); both storms have a 1/60 annual probability of producing a 2.3 m storm tide. This means that a 30-year storm tide (2/60 annual chance) is equally likely to be caused by a TC as an ETC (uncertainty from 10 to 91 years at the 95% level, sampling from the Monte Carlo analysis results). This result contrasts with the FEMA [2014b] study, where results show ETCs driving the flood level for all return periods at NYH Other recent studies have found substantially different exceedance curves at NYH, as highlighted in Section 1. The 100-year storm tide at NYH has had estimates ranging from 2.44 m [Zervas,
37 ] to 3.50 m [FEMA, 2014b]. Our result of 2.70 m falls between these studies and is within the 95% confidence range of NOAA s historical-data based estimate ( m) [Zervas, 2013] and our own historical-data based estimate (Figure 14). Another more recent study found the 100-year storm tide to be 3.38 m ( ) after removing their 2013 mean sea level offset [Lopeman et al., 2015]. Our model-based 10-year return period storm tide of 1.94 m ( at 95% confidence) is within our observation-based range ( m) and fairly central in the range of most prior studies, comparing well to the Talke et al. [2014] result of 1.91 m, the Lopeman et al. [2015] result of 1.99 m ( ), and the NOAA result of 1.85 ( ) [Zervas, 2013]. An outlier is the FEMA 10-year storm tide [FEMA, 2014b] result of 2.19 m. Comparing longer return period events, only estimated in the Lin et al. [2012] TC study, our results of 4.35 m ( ) and 5.77 m ( ) for the 1000-year and year storm tides are larger than their results of 3.55 and 4.75 m, respectively. The return period for a Hurricane Sandy level storm tide of 3.38 m in our assessment is 260 years ( at 95% confidence), in comparison to values that can be inferred from other studies as ~100 years [FEMA, 2014b; Lopeman et al., 2015], ~850 years [Lin et al., 2012], and ~1500 years [Sweet et al., 2013; Zervas, 2013] Sensitivity of results to hydrodynamic model physics Differences between our study and the other recent studies are discussed separately for TCs and ETCs below, but hydrodynamic modeling differences used for both type of storm may be partially responsible. A major difference distinguishing factor between studies in this region is the sea surface drag coefficient parameterization and its ceiling (Section 2.3). We use a waveslope sensitive parameterization [Taylor and Yelland, 2001], and find that the best fit ceiling
38 value is , for fitting historical TC storm tides (measured with RMS error) with our simplified wind fields. Prior studies in the area have used the [Garratt, 1977] parameterization with ceilings of [Lin et al., 2012], [Wang et al., 2014], [FEMA, 2014b], and with no ceiling [Colle et al., 2015]. Misalignment of wind and swell can be a source of higher drag [e.g., Holthuijsen et al., 2012], but these processes are not well understood, and other factors such as storm translation speed are important [e.g., Reichl et al., 2014] and not represented by existing wind speed-based drag parameterizations. In our study region of the funnel-shaped coastline of New York Bight, this saturation ceiling could often be higher than straight coastlines due to misalignment. This can arise due to wave refraction bending waves shoreward on the broad continental shelf, or due to the fact that the winds that drive storm surge into the apex of the Bight are often not from the southeast (they are from the east or northeast) A recent study separated surge, tide and sea level rise, computed statistics and used data from a Monte Carlo simulation to create hazard statistics as the sum of the three components, and found a 100-year flood level of 3.38 m, greater than our storm tide estimate by 0.67 m [Lopeman et al., 2015]. We quantify the possible bias here from omission of tide-surge interactions in the storm tide hazard, by repeating our assessment with sums of randomly-shuffled modeled tide timeseries plus modeled surge timeseries, to emulate their use of a sum of observed storm surge and astronomical tides. The aforementioned modeled surge timeseries is computed as the modeled storm tide minus the modeled tide-only timeseries, emulating how their observations of surge are computed. This tide plus surge result is 0.25 m higher for the 100-year TC storm tide, is 0.23 m higher for the 100-year ETC storm tide, and is 0.30 m higher for the final combined 100-year storm tide. This result suggests that the omission of tide-surge interaction in the
39 Lopeman et al. [2015] paper would lead to a high-bias in their results of about 0.30 m at the Battery, or 10%. If one subtracts this from their result, the result is a 100-year storm tide of 3.08 m, only 0.38 m above ours, a much smaller discrepancy Different hydrodynamic models include different processes related to waves, though impacts on water elevation are likely small in deep-water harbor regions like NYH. Our modeling omits wave radiation stress and resulting wave setup, which was recently shown to increase NYH storm tides by a 1.5% on average [Lin et al., 2012]. This low bias may be counteracted in our modeling through other factors, such as a possible high-bias in wind stress (e.g., due to the choice of drag coefficient parameterization). Two-dimensional ADCIRC and SLOSH modeling used in the prior studies, however, neglect the contribution of wave orbital velocities to bed stress [Grant and Madsen, 1979], which we include in our three-dimensional modeling. In conclusion, a detailed study of the role these wave-related processes play in the modeling of storm tides is warranted A final way that our approach differs from prior NY region studies is that it leverages an existing ocean forecast system, and thus includes many more subtle details that are often treated as negligible in coastal flood hazard assessments. This includes incorporation of the seasonality of sea level and air temperature, the latter of which impacts air density and therefore wind stress. The former has an impact from -10 to +7 cm, and the latter +/- ~5% on storm tides for individual storms in this region, perhaps most importantly impacting the difference between warm-season TC storm tide and cool-season ETC storm tides. These seasonally-varying variables act in
40 opposition and will to some extent offset one another, but were simple to include in the assessment because of the availability of codes and datasets from the operational forecast system The TC storm tide hazard The results of our TC assessment give a 100-year TC storm tide of 2.64 m ( % confidence interval), relative to recent studies results of 2.03 m [Lin et al., 2012] and 2.75 m [FEMA, 2014b]. The former study simulated TCs within the NCEP/NCAR reanalysis-based climate conditions of , and does not account for extratropical transition effects, which may account for the lower result. Our study also differs from these two studies in its statistical TC modeling method, as well as its methods for estimating TC wind and pressure fields. The TC meteorology used in our study is simplistic, and we have observed it to give inaccurate winds for Hurricane Sandy, but generally good agreement with observations for a few other recent storms (Section 4.2). However, the validation of the model results with historic storm tides demonstrates the results are reasonable One difference in the TC storm climatology is clear in Figure 2, because we have left-hand turn storms that were not included in storm sets of the FEMA [2014] study. In our study, even though the westward-directed storms are rare, they do occur and tend to cause the largest storm tides. By contrast, while Lin et al. [2010; 2012] also have storms that head westward in this region, their largest storm tides were caused by storms moving northward. It would be useful to have a detailed inter-comparison study among TC hazard models for the region to elucidate the reasons for these differences. 911
41 Care must be taken with our method of building the TC storm subset, choosing landfall gates that capture all storms which are important for the combined flood hazard at NYH. The gates are chosen to capture all possible TC events with surges over 1.25 m (e.g. Figure 2a), capable of causing storm tides exceeding ~2 m. Sensitivity experiments were used to evaluate the importance of passing inland storms, storms that make landfall to the east of Long Island, and storms that never make landfall but pass within 2Rmax of NYH. The combined impact on the 100-year storm tide of using three more gates to account for these TCs is an increase of 1 cm, as inland storms are too weak to cause large surges and offshore storms cause a wind direction that is unable to cause a large surge for NYH. Inclusion of this broader set of TCs would moderately increase the 5-year and 10-year TC flood hazard, which tails off below the historically-based estimates at these low return periods (Figure 13). However, our final results do not use these TCs, because this region of the curve is not important for the total storm tide hazard (below a 1 cm change); ETCs completely dominate the 5-year and 10-year storm tides It is not surprising that our study and the FEMA study, which capped the sea surface drag coefficient (CD) at , found larger TC storm tides than the Lin et al. [2010; 2012] studies, which capped CD at We found the cap of gave us the best fit to historical events (see Section 2.3), but this doesn t mean it is the correct drag coefficient cap; it simply gives us the best results in the context of our coupled ocean-wave modeling and simplified wind and pressure fields. Nevertheless, TC assessments might collapse toward closer agreement if the same drag coefficient methods were utilized. This underscores the importance of coupled oceanatmosphere validation and possible model tuning using historical events, as was advocated for by Cardone and Cox [2009].
42 The ETC storm tide hazard The results of our ETC assessment give a 100-year ETC storm tide of 2.38 m ( % confidence range), relative to the FEMA study result of 3.23 m [FEMA, 2014b] and our observation-based (GPD) assessment of 2.22 m ( ). Our model-based and observationbased estimates are in general agreement, within uncertainty, and both are substantially lower than the FEMA result. Our observation-based estimate is lower than our model-based estimate because the largest historical ETC storm surge ( ) peaked at low tide, giving a storm tide of 2.12 m. The modeled ETC events occur at 50 random tide phases, giving storm tides from 2.07 to 2.71 m, accounting for a wider range of possible floods The difference in ETC results between our study and the FEMA study are the main reason for the differences between the studies combined flood exceedance curves, considering that the estimates of the 100-year TC storm tide are nearly the same. Our study differs from that study in the wind speed factors used, discussed below, and in our scaling up of 11 storm annual rates to make up for specific missing top-30 storm surge events at NYH (Section 2.2). The impact of scaling up storm rates for the missing storms is an increase from 1.79 to 1.86 m for the 10-year storm tide, and a small decrease from 2.29 to 2.27 m for the 100-year storm tide. A goal here is to accurately capture storm tides at short return periods down to 5 y, so the scale-ups appear useful The FEMA [2014b] study multiplied the reanalysis wind speeds for all storms by 1.04, whereas we keep the winds unmodified except for the 1950 storm, where we lower them by 17% to
43 accurately fit the hindcast event (Section 4.2). We suspect the need for downscaling of wind speed for this one storm either results from errors in the storm s wind speed estimates due to the absence of measurements over the ocean for that storm, or from error in our estimated drag coefficient ceiling value of On the latter possibility, this was a rare southeaster storm where winds were blowing steadily at m s -1 over a large fetch (Figure 4) and in the same direction that the wave field was traveling (toward the west-northwest); recent work has shown that the drag coefficient cap can be much lower for this scenario [Holthuijsen et al., 2012]. Our wave modeling results in New York Bight show a mean wave-wind misalignment of only 5 degrees for the 1950 ETC, blowing in the direction of wave propagation, in comparison to 95 degrees for Hurricane Sandy (average for October 2012), blowing along the wave crests The FEMA study storm set was completed in 2011 and only considered ETCs from , but our study has the benefit of a wealth of data that has become available since Hurricane Sandy in 2012 [e.g., Talke et al., 2014]. We can look at a broader time period to evaluate our result, and there appear to have been no ETC storm tides over 2.2 m at least back to 1821, indicating that their result of 3.23 m is very likely too high. Moreover, their study simulated only two random tide scenarios, but our 50 random tide scenario runs for the most intense storms shows ETC storm tides never reaching above 2.7 m Our designation of hybrid storms that begin like Hurricane Sandy as TCs is important here, as moving these storms into the ETC category could change our interpretation of the historical data and our comparison to our model-based results. However, it makes the most sense to divide them in this way because ETCs of non-tropical cyclone origin in this coastal region have historically
44 never shown a peak sustained wind speed more than 35 m s -1 at 10 m above sea level [e.g., Cardone et al., 1996; Dolan and Davis, 1992], whereas the HURDAT database [Landsea et al., 2004] reveals that North Atlantic TCs have historically had a top wind speed of 85 m s -1. The dynamical differences between TCs/hybrids and ETCs further justifies separation into two statistical distributions and extreme value statistical analyses. Because of the rare, but possible, chance of such extreme wind speeds, TC and hybrid storm surges exhibit a long-tailed probability distribution, and the worst-case flood scenario for a TC/hybrid is much larger than for an ETC Impacts of the 1788 and 1821 hurricanes at New York City Understanding what occurred during the 1788 and 1821 hurricanes is highly valuable because they are the two largest known prior storm tide events prior to Sandy and also exhibited much stronger wind speeds that would cause severe damage and airborne debris. Our parametric modeling showed excellent agreement with our archival estimates for the 1788 event, but underestimated the 1821 estimates by 0.34 m (Figure 9). The mixed results are unsurprising, considering that the meteorology for both storms consists of simplified wind and pressure fields based on land-damage from wind [Boose et al. 2001], and is therefore only approximate Our archival research-based 1821 storm tide estimate of approximately 3.0 m (and storm surge of 3.4 m) is a downgrade by 0.2 m from the widely-cited Scileppi and Donnelly [2007] paper. Our model result for the storm tide, however, is only 2.66 m. One possible explanation for this is inaccurate wind speed estimates; a prior recent study using SLOSH found a higher wind speed is needed, relative to the Boose et al. [2001] study estimate of 51.4 m s -1 at landfall, to fit a
45 presumed (inaccurate by +0.2 m) storm surge of 3.6 m, and the best fit came when maximum sustained wind speeds of 58 m s -1 [Brandon et al., 2014]. These results suggest that the Boose et al. [2001] wind speeds at sea for that storm may be too low. In a separate paper on nature-based flood protection, we used a peak wind speed of 58 m s -1, and obtained a storm tide peak of 2.95 m at NYH, much closer to the estimated observed value [Orton et al., 2015b] One widely-cited [Brandon et al., 2014; Coch, 1994; Redfield, 1831; Scileppi and Donnelly, 2007] and impressive factor with the 1821 storm tide in NYH was that the water rose 13 feet in one hour, based on a newspaper quote. The New Bedford Mercury quote read "In one hour during the [hurricane] of Monday evening, the water was forced into the East River 13 feet 4 inches [4.0 m] above low water mark. [Boose et al., 2003]. The quote is important because such a rapid rise in one hour is extreme and would require high water velocities and likely lead to substantial erosion and possible undermining of infrastructure. The maximum water rise rate in NYH during Hurricane Sandy, for contrast, was only 0.7 m hr Our historical reassessment shows that the 4 m h -1 rise rate for the 1821 TC is unlikely to have occurred, in part because the water only rose 3.4 m total, but also because our modeling suggests this rise rate was improbable. Our most accurate 1821 hurricane storm tide simulation [Orton et al., 2015b] shows a maximum rise rate of 1.8 m h -1 for the storm tide, and our simulation of the smaller and faster 1788 hurricane shows a faster rise rate of 2.4 m h -1. More broadly, the fastest water rise rate for m TC storm tide events in our modeling is 2.4 m h -1 and the average is 0.8 m h
46 A recent study of lagoonal sediment cores at New York City s Staten Island showed that the 1788 event had a much thinner and finer sand layer than the 1821 event [Brandon et al., 2014]. This same observation was made by Scileppi and Donnelly [2007], and they surmised that the smaller storm size explained the less prominent and sometimes missing sand overwash layer on Long Island. The maximum storm surge at NYH for the 1788 hurricane was only slightly smaller (2.9 m) than the 1821 storm tide (3.0 m), but the storm was of a smaller size (wind fetch), faster speed, and thus a shorter duration [Ludlum, 1963], likely resulting in smaller waves. Our model results show peak significant wave heights and wave periods in New York Bight s apex (NDBC Buoy 44065) for 1788 of 9.4 m with period 14.5 s, whereas they are 13.5 m and 18.1 s for 1821 (versus observed values of 9.9 m and 16.0 s for Hurricane Sandy). These factors likely explain why the 1788 sediment layers were smaller, with finer sediments The 1788 hurricane storm tide estimate is lowered by 0.1 m relative to the recent Scileppi and Donnelly [2007] estimate, and uncertainty is also reduced due to the fact that multiple sources of the estimate now exist and are in approximate agreement (1) the elevation over street level at Front and Water streets of lower Manhattan, because most cellars ended up filled with water, (2) a quantitative comparison of different storm tides at one tidal mill location (Section 3.2), and (3) our model result of 3.0 m. These all support our estimate of a storm tide of 2.9 m, at 95% confidence As recently noted by Swiss Re [2014], the impacts of these storms went beyond flooding, as they were Category-3 hurricanes that passed over NYC. Sustained maximum wind speeds at elevation over the city were roughly 50 m s -1 (not at 10 m level, which is more complicated and landscape-
47 dependent). If a hurricane of this intensity were to strike the region today, damages would likely be even greater than those from Sandy and would come from both winds and flooding [Swiss Re, 2014]. Our data suggest that the likelihood of a Category-3 or stronger hurricane passing near NYC (over landfall gate 1, 2 or 3) and causing a 3 m storm tide or higher is ~0.003 y -1. Similarly, the probability of any combination of wind speed and flood level can be analyzed using the data produced in our assessment Summary and Conclusions In this paper, we have reported on methods and results for a model-based flood hazard assessment we have conducted for New York Harbor, a region where prior assessments have differed widely. The methods are novel and provide a new and important contribution to the science of coastal flood hazard assessment. The assessment separately includes the contribution of TCs (including hybrids) and ETCs to the flood hazard, separating them because they represent storm tide events with different physical limits controlled by wind speed. The TC storm set includes results from a statistical TC model that has diverse storms including ones that curve westward like Hurricane Sandy. Resulting flood exceedance curves for any type of storm tide (TC and ETC) show 10-, 100-, 1000-, and year return period events of 1.94, 2.70, 4.35, and 5.77 m, respectively Our study is the most deeply validated study of storm tides for the region performed to date, and lays out a framework for conducting similar studies for other areas. The storm sets are demonstrated to be consistent with historical data, and our coupled ocean-atmosphere modeling
48 is accurate when validated against 42 historical events. The resulting TC and ETC flood exceedance curve results are consistent with an observation-based assessment for recent decades, as well as the empirical data points that include the worst events in the 1700s and 1800s that came prior to the tide gauge era A reassessment of the 1821 and 1788 hurricane storm tides at NYH was also performed, due to the fact that these are believed to have been Category-3 hurricanes with similar storm tides to Hurricane Sandy. The 1821 storm tide is estimated to be 3.0 m ( at 95% confidence), 0.2 m lower than a prior recent estimate [Scileppi and Donnelly, 2007]. The 1788 storm tide is estimated to be 2.9 m ( ). The downgrade and reductions in uncertainty allow for the conclusion that the storm tides were lower than Sandy, and a resulting conclusion of this work is that Hurricane Sandy s storm tide at NYH was the largest at least as far back as More research is needed to ensure we can both account for the large variety of storms, and also accurately capture the atmospheric and oceanic physics of these extreme storms, to reduce this uncertainty and the differences between studies. Hybrids are a rare but highly impactful type of storm which needs further study, as do extratropical cyclones and their sources of energy that can lead to hurricane strength winds (e.g. latent heat). The coupling between atmosphere and ocean through wind stress and sea surface drag coefficient is a particularly important area requiring study for New York Bight, where winds and waves are often misaligned during storms due to the coastal geometry. 1094
49 The assessment framework is useful for other purposes beyond estimation of the present-day flood hazard, including sea level rise and climate change impacts on flooding. The framework and models are also useful for performing adaptation quantification studies where the model is manipulated to emulate structural or natural flood protection efforts that are happening rapidly after Hurricane Sandy. Funded projects are currently addressing both needs, using the data for studies of the Hudson River and Jamaica Bay, New York City, and will be summarized in future publications Acknowledgements Work by PO, AB, NG and SV was funded by the NASA Centers call for support of the National Climate Assessment (Hall, PI; Agreements NNX12AI28G and NNX15AD61G), NASA s Research Opportunities in Space and Earth Science ROSES-2012 (grant NNX14AD48G), and NOAA s Regional Integrated Sciences and Assessments (RISA) program (Award NA10OAR ). Work by TH was also funded by the NASA projects listed above. Work by ST was funded by the U.S. Army Corps of Engineers (award W1927N ). Supercomputer resources were utilized under a grant of computer time from the City University of New York High Performance Computing Center under NSF Grants CNS , CNS and ACI The model data, compiled NOAA water elevation observations, and Matlab codes necessary to reproduce the study are available at
50 References Aerts, J., W. W. Botzen, K. Emanuel, N. Lin, H. de Moel, and E. O. Michel-Kerjan (2014), Evaluating Flood Resilience Strategies for Coastal Megacities, Science, 344(6183), Blake, E. S., T. B. Kimberlain, R. J. Berg, J. P. Cangialosi, and J. L. Beven (2013), Tropical Cyclone Report: Hurricane Sandy (AL182012), National Hurricane Cent., Miami, Fla. Blumberg, A. F., L. A. Khan, and J. St John (1999), Three-dimensional hydrodynamic model of New York Harbor region, J. Hydraul. Engin., 125(8), Boose, E. R., K. E. Chamberlin, and D. R. Foster (2001), Landscape and regional impacts of hurricanes in New England, Ecological Monographs, 71(1), Boose, E. R., D. R. Foster, and K. E. Chamberlin (2003), Harvard Forest Data Archive, HF011: Landscape and Regional Impacts of Hurricanes in New England , accessed March, Botts, H., W. Du, T. Jeffery, S. Kolk, Z. Pennycook, and L. Suhr (2013), CoreLogic Storm Surge Report 2013, 44 pp, CoreLogic, Irvine, CA. Brandon, C. M., J. D. Woodruff, J. P. Donnelly, and R. M. Sullivan (2014), How unique was Hurricane Sandy? Sedimentary reconstructions of extreme flooding from New York Harbor, Scientific reports, 4. Bretschneider, C. (1972), A non-dimensional stationary hurricane wave model, Proceedings of the Offshore Technology Conference, Vol 1, Cardone, V., R. Jensen, D. Resio, V. Swail, and A. Cox (1996), Evaluation of contemporary ocean wave models in rare extreme events: the Halloween Storm of October 1991 and the Storm of the Century of March 1993, J. Atmos. Oceanic Technol., 13(1),
51 Cardone, V., and A. Cox (2009), Tropical cyclone wind field forcing for surge models: critical issues and sensitivities, Natural hazards, 51(1), City of New York (2013), A stronger, More Resilient New York, 445 pp, New York, NY. Coch, N. K. (1994), Hurricane hazards along the northeastern Atlantic Coast of the United States, J. Coast. Res., Colle, B. A., F. Buonaiuto, M. J. Bowman, R. E. Wilson, R. Flood, R. Hunter, A. Mintz, and D. Hill (2008), New York City's vulnerability to coastal flooding, Bull. Amer. Meteorol. Soc., 89(6), Colle, B. A., K. Rojowsky, and F. Buonaito (2010), New York City Storm Surges: Climatology and an Analysis of the Wind and Cyclone Evolution, Journal of Applied Meteorology and Climatology, 49(1), Colle, B. A., M. J. Bowman, K. J. Roberts, M. H. Bowman, C. N. Flagg, J. Kuang, Y. Weng, E. B. Munsell, and F. Zhang (2015), Exploring Water Level Sensitivity for Metropolitan New York during Sandy (2012) Using Ensemble Storm Surge Simulations, Journal of Marine Science and Engineering, 3(2), Condon, A. J., and Y. P. Sheng (2012), Optimal storm generation for evaluation of the storm surge inundation threat, Ocean Engin., 43, Cox, A., J. Greenwood, V. Cardone, and V. Swail (1995), An interactive objective kinematic analysis system, paper presented at Fourth International Workshop on Wave Hindcasting and Forecasting. Demuth, J. L., M. DeMaria, and J. A. Knaff (2006), Improvement of advanced microwave sounding unit tropical cyclone intensity and size estimation algorithms, Journal of Applied Meteorology and Climatology, 45(11),
52 Dolan, R., and R. E. Davis (1992), An intensity scale for Atlantic coast northeast storms, J. Coast. Res., Donelan, M. (1977), A simple numerical model for wave and wind stress prediction, National Water Research Institute, Burlington, Ontario, 28pp. Donnelly, J. P., S. Roll, M. Wengren, J. Butler, R. Lederer, and T. Webb (2001), Sedimentary evidence of intense hurricane strikes from New Jersey, Geology, 29(7), Elsner, J. B. (2006), Historical Hurricane Information Tool (HHIT), Available online, accessed January 19, Emanuel, K. (2000), A statistical analysis of tropical cyclone intensity, Mon. Weather. Rev., 128(4), Espy (1839), Facts collected by Mr. Espy, taken from Newspapers of the time, Journal of the Franklin Institute 23, FEMA (2014a), Region II Storm Surge Project - Development of Wind and Pressure Forcing in Tropical and Extra-Tropical Storms 62 pp, Federal Emergency Management Agency, Washington DC. FEMA (2014b), Region II Coastal Storm Surge Study: Overview, 15 pp, Federal Emergency Management Agency, Washington, DC. FEMA (2014c), Region II Storm Surge Project - Joint probability analysis of hurricane and extratropical flood hazards, 95 pp, Federal Emergency Management Agency, Washington, DC. Galarneau, T. J., C. A. Davis, and M. A. Shapiro (2013), Intensification of Hurricane Sandy (2012) through extratropical warm core seclusion, Mon. Weather. Rev., 141(12),
53 Garratt, J. (1977), Review of drag coefficients over oceans and continents, Mon. Weather. Rev., 105(7), Georgas, N., A. Blumberg, and T. Herrington (2007), An operational coastal wave forecasting model for New Jersey and Long Island waters, Shore Beach, 75(2), Georgas, N., and A. F. Blumberg (2009), Establishing Confidence in Marine Forecast Systems: The Design and Skill Assessment of the New York Harbor Observation and Prediction System, Version 3 (NYHOPS v3), paper presented at Eleventh International Conference in Estuarine and Coastal Modeling (ECM11), ASCE, Seattle, Washington, USA, 4-6 November. Georgas, N. (2010), Establishing confidence in marine forecast systems: The design of a high fidelity marine forecast model for the NY/NJ harbor estuary and its adjoining coastal waters, 272 pp, Stevens Institute of Technology. Georgas, N., P. Orton, A. Blumberg, L. Cohen, D. Zarrilli, and L. Yin (2014), The impact of tidal phase on Hurricane Sandy's flooding around New York City and Long Island Sound, Journal of Extreme Events, DOI: /S Grant, W. D., and O. S. Madsen (1979), Combined wave and current interaction with a rough bottom, J. Geophys. Res., 84(C4), Hall, T., and S. Jewson (2007), Statistical modelling of North Atlantic tropical cyclone tracks, Tellus A, 59(4), Hall, T., and E. Yonekura (2013), North American tropical cyclone landfall and SST: A statistical model study, J. Clim., 26(21), Hall, T. M., and A. H. Sobel (2013), On the impact angle of Hurricane Sandy's New Jersey landfall, Geophys. Res. Lett., 40(10),
54 Harper, B., J. Kepert, and J. Ginger (2010), Guidelines for converting between various wind averaging periods in tropical cyclone conditions, World Meteor. Org., TCP Sub-Project Report, WMO/TD(1555). Holthuijsen, L. H., M. D. Powell, and J. D. Pietrzak (2012), Wind and waves in extreme hurricanes, J. Geophys. Res., 117(C9). Horsburgh, K., and C. Wilson (2007), Tide surge interaction and its role in the distribution of surge residuals in the North Sea, J. Geophys. Res., 112(C8). Jelesnianski, C., J. Chen, W. Shaffer, U. S. N. Oceanic, A. Administration, and U. S. N. W. Service (1992), SLOSH: Sea, lake, and overland surges from hurricanes, US Dept. of Commerce, National Oceanic and Atmospheric Administration, National Weather Service, Silver Spring, MD, USA. Kemp, A. C., and B. P. Horton (2013), Contribution of relative sea level rise to historical hurricane flooding in New York City, Journal of Quaternary Science, 28(6), Kussman, A. S. (1957), Report on the Hurricane of September 3, 1821, U.S. Weather Bureau, New York, NY, USA, 54 pp. Landsea, C. W., C. Anderson, N. Charles, G. Clark, J. Dunion, J. Fernandez-Partagas, P. Hungerford, C. Neumann, and M. Zimmer (2004), The Atlantic hurricane database reanalysis project: Documentation for the alterations and additions to the HURDAT database, Hurricanes and Typhoons: Past, Present and Future, Large, W. G., and S. Pond (1981), Open ocean momentum flux measurements in moderate to strong winds, J. Phys. Oceanogr., 11, Lin, N., K. Emanuel, J. Smith, and E. Vanmarcke (2010), Risk assessment of hurricane storm surge for New York City, J. Geophys. Res, 115.
55 Lin, N., and D. Chavas (2012), On hurricane parametric wind and applications in storm surge modeling, Journal of Geophysical Research: Atmospheres ( ), 117(D9). Lin, N., K. Emanuel, M. Oppenheimer, and E. Vanmarcke (2012), Physically based assessment of hurricane surge threat under climate change, Nature Climate Change, 2(6), Lin, N., P. Lane, K. A. Emanuel, R. M. Sullivan, and J. P. Donnelly (2014), Heightened hurricane surge risk in northwest Florida revealed from climatological hydrodynamic modeling and paleorecord reconstruction, Journal of Geophysical Research: Atmospheres, 119(14), Lopeman, M., G. Deodatis, and G. Franco (2015), Extreme storm surge hazard estimation in lower Manhattan, Natural Hazards, Ludlum, D. M. W. (1963), Early American Hurricanes, , American Meteorological Society, Boston. Mukai, A., J. Westerink, R. Luettich Jr, and D. Mark (2002), Eastcoast 2001, a tidal constituent database for western North Atlantic, Gulf of Mexico, and Caribbean Sea, DTIC Document. Niedoroda, A., D. Resio, G. Toro, D. Divoky, H. Das, and C. Reed (2010), Analysis of the coastal Mississippi storm surge hazard, Ocean Engin., 37(1), NOAA-NHC-HRD (2015), Atlantic hurricane best track (HURDAT), United States National Oceanic and Atmospheric Administration, National Hurricane Center, Hurricane Research Division, accessed December NOAA (2015), Tides and Currents, National Oceanographic and Atmospheric Administration, Available online: accessed, January, Orff, K., G. Wirth, P. Orton, and et al. (2014), Living Breakwaters: Volume II Staten Island and Raritan Bay, 118 pp, Housing and Urban Development, Rebuild By Design.
56 Orton, P., N. Georgas, A. Blumberg, and J. Pullen (2012), Detailed modeling of recent severe storm tides in estuaries of the New York City region, J. Geophys. Res., 117, C09030, DOI: /2012JC Orton, P., S. Vinogradov, N. Georgas, A. Blumberg, N. Lin, V. Gornitz, C. Little, K. Jacob, and R. Horton (2015a), New York City Panel on Climate Change 2015 report chapter 4: Dynamic coastal flood modeling, Ann. N. Y. Acad. Sci., 1336(1), Orton, P. M., S. A. Talke, D. A. Jay, L. Yin, A. F. Blumberg, N. Georgas, H. Zhao, H. J. Roberts, and K. MacManus (2015b), Channel Shallowing as Mitigation of Coastal Flooding, Journal of Marine Science and Engineering, 3(3), , DOI: /jmse Phadke, A. C., C. D. Martino, K. F. Cheung, and S. H. Houston (2003), Modeling of tropical cyclone winds and waves for emergency management, Ocean Engin., 30(4), Pickands, J. (1975), Statistical inference using extreme order statistics, the Annals of Statistics, Powell, M. D., P. J. Vickery, and T. A. Reinhold (2003), Reduced drag coefficient for high wind speeds in tropical cyclones, Nature, 422(6929), Pugh, D. T. (1987), Tides, surges and mean sea-level, John Wiley & Sons Ltd. Redfield, W. (1831), Remarks on the prevailing storms of the Atlantic coast of the North American States, Amer. J. of Science and Arts 20, Reichl, B. G., T. Hara, and I. Ginis (2014), Sea state dependence of the wind stress over the ocean under hurricane winds, J. Geophys. Res., 119(1), Resio, D. T., and J. J. Westerink (2008), Modeling the physics of storm surges, Phys. Today, 61,
57 Scileppi, E., and J. P. Donnelly (2007), Sedimentary evidence of hurricane strikes in western Long Island, New York, Geochem. Geophys., Geosyst., 8(6), DOI: /2006GC Shalowitz, A. L. (1964), Shore and Sea Boundaries, with Special Reference to the Interpretation and use of Coast and Geodetic Survey Data, Vol. 2: Interpretation and Use of Coast and Geodetic Survey Data, US Government Printing Office, Washington DC. Signell, R., R. Beardsley, H. Graber, and A. Capotondi (1990), Effect of wave current interaction on wind driven circulation in narrow, shallow embayments, J. Geophys. Res., 95(C6), Sweet, W., C. Zervas, S. Gill, and J. Park (2013), Section 6: Hurricane Sandy Inundation Probabilities Today and Tomorrow, in Explaining Extreme Events of 2012 from a Climate Perspective: Special supplement to the Bulletin of the American Meteorological Society vol. 94, no. 9, September 2013, edited by T. C. Peterson, et al., pp. S17-S20. Swiss Re (2014), The big one: The East Coast s USD 100 billion hurricane event, 21 pp, Swiss Re America Holding Corporation, Armonk, NY, USA. Talke, S., P. Orton, and D. Jay (2014), Increasing storm tides at New York City, , Geophys. Res. Lett., 41, DOI: /2014GL Tang, Y. M., B. Sanderson, G. Holland, and R. Grimshaw (1996), A numerical study of storm surges and tides, with application to the North Queensland coast, J. Phys. Oceanogr., 26(12), Taylor, P. K., and M. J. Yelland (2001), The dependence of sea surface roughness on the height and steepness of the waves, J. Phys. Oceanogr., 31(2), Toro, G., A. Niedoroda, C. Reed, and D. Divoky (2010), Quadrature-based approach for the efficient evaluation of surge hazard, Ocean Engin., 37(1),
58 USACE (2015), North Atlantic Coast Comprehensive Study: Resilient Adaptation to Increasing Risk: Main Report, 140 pp, United States Army Corps of Engineers. Vecchi, G. A., and T. R. Knutson (2011), Estimating annual numbers of Atlantic hurricanes missing from the HURDAT database ( ) using ship track density, J. Clim., 24(6), Vickery, P., P. Skerlj, and L. Twisdale (2000), Simulation of hurricane risk in the US using empirical track model, Journal of Structural Engineering, 126(10), Wang, H. V., J. D. Loftis, Z. Liu, D. Forrest, and J. Zhang (2014), The storm surge and sub-grid inundation modeling in New York City during Hurricane Sandy, Journal of Marine Science and Engineering, 2(1), Zervas, C. (2013), Extreme Water Levels of the United States , NOAA Technical Report NOS CO-OPS 067, NOAA National Ocean Service Center for Operational Oceanographic Products and Services, 200 pp, Silver Spring, Maryland
59 1316 Figure Captions Figure 1: The top 20 gauged historical storm tides from at the Battery (New York Harbor) and the two worst prior events back to 1700 (1788, 1821) were a mixture of extratropical cyclones (ETCs) and tropical cyclones (TCs). Data are water elevation above the year s mean sea level, and data are based on an updated version of the Talke et al. [2014] data set. Our estimated 1788 and 1821 storm tides have 95% confidence bars, and are discussed in Section Figure 2: Historical and modeled TC storm tracks affecting New York Harbor (NYH), shaded by Saffir-Simpson category (Cat). (top) Known TC or hybrid TC/ETC 1.25 m or greater surge events at NY Harbor, , with year, name (if any), and observed storm surge. (bottom left) Select modeled TC tracks, on a map that includes the landfall gate numbers. Storms are shown that led to storm tides close to the 100-year event ( m) which occur at a rate higher than y -1. (bottom right) Storms that led to the largest storm tides in the set, from m Figure 3: Estimated 1788 hurricane meteorology and modeled storm tide (elevation) shading and timeseries at NYH (NYHOPS model domain), for two snapshots in time. Wind velocity is shown as vectors (see 33 m/s key at bottom right) and pressure isobars are shown as white lines. The red vertical lines in the timeseries show the times represented in the maps. See Section 3.1 for a summary of the storm s history and data sources. 1337
60 Figure 4: The 1950 ETC meteorological reanalysis and modeled storm surge on the SNAP grid, near the time of peak surge. Wind velocity is shown as vectors, and pressure isobars as black lines. All storms in the study were simulated with only storm surge on the SNAP grid and then on the nested NYHOPS grid with tides Figure 5: Characterization of spread in modeled TC storm tides within a storm flavor. Three GEV-fitted distributions are shown that cover a range of storm intensities, each including 200 cases of randomly-chosen storms and tides. These curves are later used for TC rate-distribution smoothing Figure 6: Annual rates (top) and modeled storm tide (bottom) for each of the 606 synthetic TCs. Colors indicate Saffir-Simpson category, and landfall gates are also shown (0 for southern New Jersey, moving clockwise to 4 for eastern Long Island; shown in Figure 2). The bottom panel also shows storm size, an important determinant of storm tide Figure 7: Historical evaluation of the statistical TC model: Shown are landfall wind speed exceedance curves for the greater New York Bight region (across all 5 landfall gates). Yellow curves are shown for each of the simulations of the 64-yr ( ) period. The orange curves indicate the lower and upper bounds of the inner 95% across the simulations. The red curve is obtained by combining the simulations in series (i.e., a yr simulation). The blue curve is obtained directly from HURDAT landfalls. 1359
61 Figure 8: Historical evaluation of the ETC coupled ocean-atmosphere model results for the Battery tide gauge (NYH), including mean bias and RMSE. Numbering of data points (storm events) is given in Table Figure 9: Historical evaluation of the TC coupled ocean-atmosphere modeling results for the Battery tide gauge (NYH), including bias and RMSE. Storms numbers are shown in Table 2. Atmospheric forcing is based on simple parametric wind and pressure fields, not detailed data Figure 10: Annual rate distribution for modeled ETC storm tides Figure 11: Annual rate distribution for modeled TCs (blue), also with the distribution as smoothed to account for the random tide and storm variations (red). The inset panel shows a logarithmic y-axis, to show the data in the long tail Figure 12: Results -- ETC flood exceedance curve versus the observation-based Generalized Pareto Distribution (GPD) assessment, both with shaded 95% confidence ranges. Open circles are empirically-estimated return levels for specific events, with the highest point (the nor easter on 1992/12/11) appearing at a return period of 64 years (the record length) Figure 13: Results -- TC flood exceedance curve versus a observation-based GPD assessment, both with shaded 95% confidence ranges. Empirical points ( emp ) from and are also plotted. The latter shows empirical return periods for the 1788 and 1821 hurricanes, computed using the longer period of 314 years (up to 2013) because we know these were the second and third highest events since 1700.
62 Figure 14: Model-based and observation-based flood exceedance curves for NYH, combining TC and ETC curves from the prior two figures. The 95% confidence intervals are shown for the combined observed curve (red dotted lines) and modeled curve (grey shading). Storm tide is water level above mean sea level (MSL), and the model-based 100-year storm tide is 2.70 m, or 2.64 m NAVD88 when added on MSL
63 Table 1: ETC storm set, including the number of tide repetitions (Section 2.4), and in cases where a storm s annual rate was doubled, the missing storm that is accounted for (doubling storm). # Code yyyymmdd Year Month Day of peak Battery surge a Surge rank b Tide reps Doubling storm (m) a Surge is the peak water elevation minus tide, minus annual mean sea level b ETC surge rankings are for the period , the period of the reanalysis datasets
64 Table 2: Historical tropical cyclones used for model validation at NYH # year name month day Rmax g Vmax ag Pcentral g Vstorm g bearing max surge h max storm tide h km m/s mbar m/s degrees m m unnamed c unnamed b c unnamed b c unnamed unnamed Carol Donna Belle Gloria Floyd Irene Sandy a maximum sustained 1-minute average wind speed b Boose et al. [2003] c Hall model-based pressure estimate see Section e HURDAT data [Landsea et al., 2004] f EX-HURDAT [Demuth et al., 2006] d FEMA [2014] data g Storm data are from the 6 h time step prior to final landfall h Both surge and storm tide are corrected for the changing annual mean sea level 1405
65 Figure 1. Figure
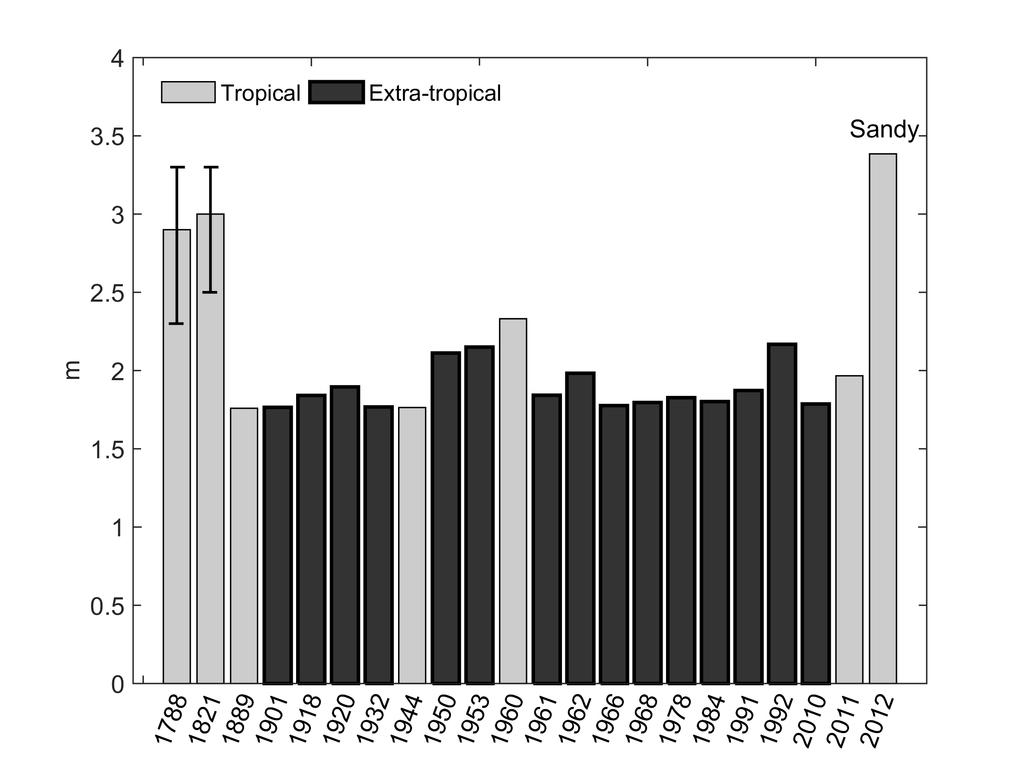
66
67 Figure 2. Figure
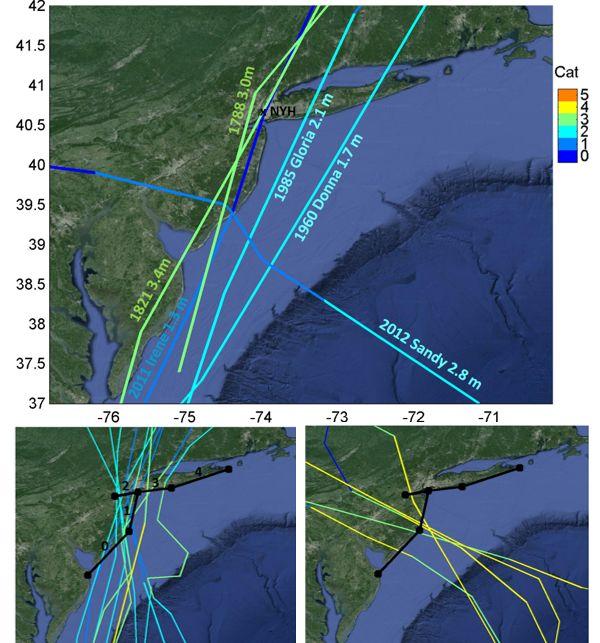
68
69 Figure 3. Figure
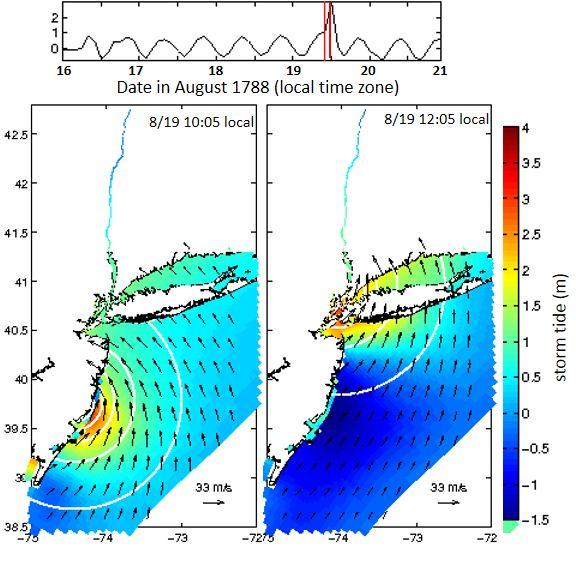
70
71 Figure 4. Figure

72
73 Figure 5. Figure

74
75 Figure 6. Figure

76
77 Figure 7. Figure

78
79 Figure 8. Figure
80
81 Figure 9. Figure
82
83 Figure 10. Figure
84
85 Figure 11. Figure
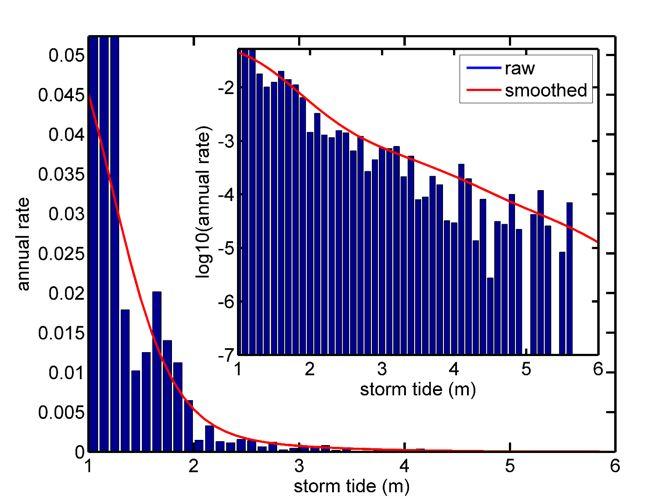
86
87 Figure 12. Figure

88
89 Figure 13. Figure
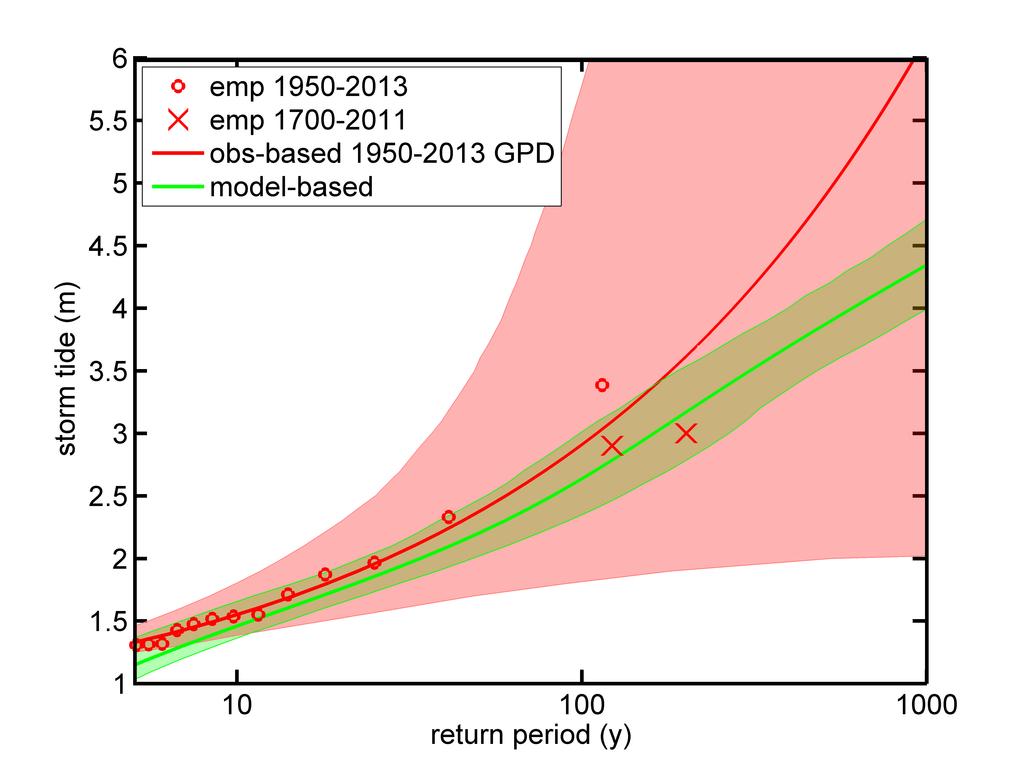
90
A Validated Tropical-Extratropical Flood Hazard Assessment for New York Harbor
 Portland State University PDXScholar Civil and Environmental Engineering Faculty Publications and Presentations Civil and Environmental Engineering 12-31-2016 A Validated Tropical-Extratropical Flood Hazard
On the Impact Angle of Hurricane Sandy s New Jersey Landfall
 On the Impact Angle of Hurricane Sandy s New Jersey Landfall Timothy M. Hall NASA Goddard Institute for Space Studies New York, NY Adam H. Sobel Department of Applied Physics and Applied Mathematics, Columbia
A Perfect Storm: The Collision of Tropical Cyclones, Climate Change and Coastal Population Growth. Jeff Donnelly Woods Hole Oceanographic Institution
 A Perfect Storm: The Collision of Tropical Cyclones, Climate Change and Coastal Population Growth Jeff Donnelly Woods Hole Oceanographic Institution Recent Hurricane Trends What Might the Future Hold?
SLOSH New Orleans Basin 2012 Update
 SLOSH New Orleans Basin 2012 Update Michael Koziara Science and Operations Officer National Weather Service Slidell, LA The Basics What is storm surge? What is SLOSH? Details Assumptions Inundation = Storm
Physically-based risk assessment of hurricane storm surge in a changing climate
 Physically-based risk assessment of hurricane storm surge in a changing climate Ning Lin Princeton University Department of Civil and Environmental Engineering Hurricane Ike 5 Year Workshop Rice University,
PERSPECTIVES ON FOCUSED WORKSHOP QUESTIONS
 PERSPECTIVES ON FOCUSED WORKSHOP QUESTIONS REGARDING PAST ECONOMIC IMPACTS OF STORMS OR FLOODS Tom Knutson Geophysical Fluid Dynamics Laboratory National Oceanic and Atmospheric Administration 1. According
2013 ATLANTIC HURRICANE SEASON OUTLOOK. June RMS Cat Response
 2013 ATLANTIC HURRICANE SEASON OUTLOOK June 2013 - RMS Cat Response Season Outlook At the start of the 2013 Atlantic hurricane season, which officially runs from June 1 to November 30, seasonal forecasts
COASTAL DATA APPLICATION
 2015 Coastal GeoTools Proactive By Design. Our Company Commitment COASTAL DATA APPLICATION Projecting Future Coastal Flood Risk for Massachusetts Bay Bin Wang, Tianyi Liu, Daniel Stapleton & Michael Mobile
Development of Operational Storm Surge Guidance to Support Total Water Predictions
 Development of Operational Storm Surge Guidance to Support Total Water Predictions J. Feyen 1, S. Vinogradov 1,2, T. Asher 3, J. Halgren 4, Y. Funakoshi 1,5 1. NOAA/NOS//Development Laboratory 2. ERT,
North Atlantic Coast Comprehensive Study (NACCS) APPENDIX A: ENGINEERING
 APPENDIX A: ENGINEERING") North Atlantic Coast Comprehensive Study (NACCS) APPENDIX A: ENGINEERING NORTH ATLANTIC COAST COMPREHENSIVE STUDY: RESILIENT ADAPTATION TO INCREASING RISK Appendix A - Engineering Table of Contents North
North Atlantic Coast Comprehensive Study (NACCS) APPENDIX A: ENGINEERING NORTH ATLANTIC COAST COMPREHENSIVE STUDY: RESILIENT ADAPTATION TO INCREASING RISK Appendix A - Engineering Table of Contents North
Assessing Storm Tide Hazard for the North-West Coast of Australia using an Integrated High-Resolution Model System
 Assessing Storm Tide Hazard for the North-West Coast of Australia using an Integrated High-Resolution Model System J. Churchill, D. Taylor, J. Burston, J. Dent September 14, 2017, Presenter Jim Churchill
Coastal Storms of the New Jersey Shore
 Coastal Storms of the New Jersey Shore Dr. Steven G. Decker Dept. of Environmental Sciences School of Environmental and Biological Sciences Rutgers University May 25, 2011 Overview Threats Historical Examples
Boston Coastal Flooding Analysis and Mapping
 Boston Coastal Flooding Analysis and Mapping Philip Orton, Dara Mendeloff, Jane Mills, Malgosia Madajewicz Funding This research was funded by the National Oceanic and Atmospheric Administration (NOAA)
PRMS WHITE PAPER 2014 NORTH ATLANTIC HURRICANE SEASON OUTLOOK. June RMS Event Response
 PRMS WHITE PAPER 2014 NORTH ATLANTIC HURRICANE SEASON OUTLOOK June 2014 - RMS Event Response 2014 SEASON OUTLOOK The 2013 North Atlantic hurricane season saw the fewest hurricanes in the Atlantic Basin
1.2 DEVELOPMENT OF THE NWS PROBABILISTIC EXTRA-TROPICAL STORM SURGE MODEL AND POST PROCESSING METHODOLOGY
 1.2 DEVELOPMENT OF THE NWS PROBABILISTIC EXTRA-TROPICAL STORM SURGE MODEL AND POST PROCESSING METHODOLOGY Huiqing Liu 1 and Arthur Taylor 2* 1. Ace Info Solutions, Reston, VA 2. NOAA / NWS / Science and
Hurricanes in a Warming World. Jeff Donnelly Woods Hole Oceanographic Institution
 Hurricanes in a Warming World Jeff Donnelly Woods Hole Oceanographic Institution Hurricanes impacting the NE US Hurricane Sandy Was Hurricane Sandy a freak of nature? Or had we just been lucky? What are
Probabilistic Assessment of Coastal Storm Hazards
 Resilience of Coastal Infrastructure Conference Hato Rey, PR March 8-9, 2017 Probabilistic Assessment of Coastal Storm Hazards Dr. Norberto C. Nadal-Caraballo Leader, Coastal Hazards Group Team: Victor
General background on storm surge. Pat Fitzpatrick and Yee Lau Mississippi State University
 General background on storm surge Pat Fitzpatrick and Yee Lau Mississippi State University Storm surge is an abnormal rise of water associated with a cyclone, not including tidal influences Low pressure
Comparative Analysis of Hurricane Vulnerability in New Orleans and Baton Rouge. Dr. Marc Levitan LSU Hurricane Center. April 2003
 Comparative Analysis of Hurricane Vulnerability in New Orleans and Baton Rouge Dr. Marc Levitan LSU Hurricane Center April 2003 In order to compare hurricane vulnerability of facilities located in different
6.1 CASE STUDY: SLOSH USING GRIDDED WIND FIELDS FOR HURRICANES IRENE-2011 AND SANDY-2012
 6.1 CASE STUDY: SLOSH USING GRIDDED WIND FIELDS FOR HURRICANES IRENE-2011 AND SANDY-2012 Dongming Yang 1* and Arthur Taylor 2 1. Ace Info Solutions, Reston, Virginia 2. NOAA / NWS / Office of Science and
Storm Surge Frequency Analysis using a Modified Joint Probability Method with Optimal Sampling (JPM-OS)
") Storm Surge Frequency Analysis using a Modified Joint Probability Method with Optimal Sampling (JPM-OS) Jay Ratcliff Coastal Hydraulics Lab, of Engineers (USACE) Engineering Research and Development Center
Storm Surge Frequency Analysis using a Modified Joint Probability Method with Optimal Sampling (JPM-OS) Jay Ratcliff Coastal Hydraulics Lab, of Engineers (USACE) Engineering Research and Development Center
PROJECT DESCRIPTION. 1. Introduction Problem Statement
 Salmun, H: A proposal submitted to PSC-CUNY program on October 15, 2009. Statistical prediction of storm surge associated with East Coast Cool-weather Storms at The Battery, New York. Principal Investigator:
30 If Vmax > 150, HSI intensity pts = 25
 Hurricane Severity Index: A New Way of Estimating a Tropical Cyclone s Destructive Potential 1. Introduction Christopher G. Hebert*, Robert A. Weinzapfel*, Mark A. Chambers* Impactweather, Inc., Houston,
Identification and Selection of Representative Storm Events from a Probabilistic Storm Data Base
 Identification and Selection of Representative Storm Events from a Probabilistic Storm Data Base by Mark B. Gravens and Dylan R. Sanderson PURPOSE: This Coastal and Hydraulics Engineering Technical Note
Coastal Inundation Risk for SE Florida Incorporating Climate Change Impact on Hurricanes & Sea Level Rise
 Coastal Inundation Risk for SE Florida Incorporating Climate Change Impact on Hurricanes & Sea Level Rise Y. Peter Sheng and V.A. Paramygin Justin R. Davis, Andrew Condon, Andrew Lapetina, Tianyi Liu,
KCC White Paper: The 100 Year Hurricane. Could it happen this year? Are insurers prepared? KAREN CLARK & COMPANY. June 2014
 KAREN CLARK & COMPANY KCC White Paper: The 100 Year Hurricane Could it happen this year? Are insurers prepared? June 2014 Copyright 2014 Karen Clark & Company The 100 Year Hurricane Page 1 2 COPLEY PLACE
P2.57 Cyclone Yasi Storm Surge in Australia Implications for Catastrophe Modeling
 P2.57 Cyclone Yasi Storm Surge in Australia Implications for Catastrophe Modeling Kevin A. Hill*, Peter Sousounis, and Jason Butke AIR Worldwide Corporation, Boston, Massachusetts 1. INTRODUCTION Storm
Coastal Hazards System: Interpretation and Application
 Lessons Learned and Best Practices: Resilience of Coastal Infrastructure Hato Rey, PR March 8-9, 2017 Coastal Hazards System: Interpretation and Application Victor M. Gonzalez, P.E. Team: PI: Jeffrey A.
RMS Medium Term Perspective on Hurricane Activity
 RMS Medium Term Perspective on Hurricane Activity Dr. Manuel Lonfat Florida Commission on Hurricane Loss Projection Methodology Workshop Tallahassee, July 27 2006 Agenda Multiyear autocorrelation of Atlantic,
29th Conference on Hurricanes and Tropical Meteorology, May 2010, Tucson, Arizona
 P2.96 A SIMPLE COASTLINE STORM SURGE MODEL BASED ON PRE-RUN SLOSH OUTPUTS 1. INTRODUCTION Liming Xu* FM Global Research, 1151 Boston Providence Turnpike, Norwood, MA 02062 Storm surge is an abnormal rise
HURRICANE IRENE. CONFERENCE CALL BRIEFING SLIDES Saturday August 27, :30 AM
 HURRICANE IRENE CONFERENCE CALL BRIEFING SLIDES Saturday August 27, 2011 8:30 AM NHC TRACK AND CONE HURRICANE IRENE WATCHES/WARNINGS Hurricane Warning along south coast including all of Cape Cod and Islands
CLIMATE READY BOSTON. Climate Projections Consensus ADAPTED FROM THE BOSTON RESEARCH ADVISORY GROUP REPORT MAY 2016
 CLIMATE READY BOSTON Sasaki Steering Committee Meeting, March 28 nd, 2016 Climate Projections Consensus ADAPTED FROM THE BOSTON RESEARCH ADVISORY GROUP REPORT MAY 2016 WHAT S IN STORE FOR BOSTON S CLIMATE?
Ch. 11: Hurricanes. Be able to. Define what hurricane is. Identify the life and death of a hurricane. Identify the ways we track hurricanes.
 Ch. 11: Hurricanes Be able to Define what hurricane is. Identify the life and death of a hurricane. Identify the ways we track hurricanes. What are Hurricanes? Smaller than mid-latitude cyclones. Don t
CURRENT AND FUTURE TROPICAL CYCLONE RISK IN THE SOUTH PACIFIC
 CURRENT AND FUTURE TROPICAL CYCLONE RISK IN THE SOUTH PACIFIC COUNTRY RISK PROFILE: SAMOA JUNE 2013 Samoa has been affected by devastating cyclones on multiple occasions, e.g. tropical cyclones Ofa and
The AIR Tropical Cyclone Model for India
 The AIR Tropical Cyclone Model for India Tropical cyclones have caused millions, and even billions, of dollars in damage in India. The growing number of properties on the coast, together with growing insurance
The Atlantic Hurricane Database Reanalysis Project
 The Atlantic Hurricane Database Reanalysis Project 9 November, 2015 14 th International Workshop on Wave Hindcasting and Forecasting Chris Landsea, National Hurricane Center, Miami, USA Chris.Landsea@noaa.gov
PREDICTING TROPICAL CYCLONE FORERUNNER SURGE. Abstract
 PREDICTING TROPICAL CYCLONE FORERUNNER SURGE Yi Liu 1 and Jennifer L. Irish 1 Abstract In 2008 during Hurricane Ike, a 2-m forerunner surge, early surge arrival before tropical cyclone landfall, flooded
Flooding Performance Indicator Summary. Performance indicator: Flooding impacts on riparian property for Lake Ontario and the Upper St.
 Flooding Performance Indicator Summary Performance indicator: Flooding impacts on riparian property for Lake Ontario and the Upper St. Lawrence River Technical Workgroup: Coastal TWG Research by: Baird
(April 7, 2010, Wednesday) Tropical Storms & Hurricanes Part 2
 Tropical Storms & Hurricanes Part 2") Lecture #17 (April 7, 2010, Wednesday) Tropical Storms & Hurricanes Part 2 Hurricane Katrina August 2005 All tropical cyclone tracks (1945-2006). Hurricane Formation While moving westward, tropical disturbances
Lecture #17 (April 7, 2010, Wednesday) Tropical Storms & Hurricanes Part 2 Hurricane Katrina August 2005 All tropical cyclone tracks (1945-2006). Hurricane Formation While moving westward, tropical disturbances
The spatial contribution of translation speed to tropical cyclone wind structure
 The spatial contribution of translation speed to tropical cyclone wind structure Pat Fitzpatrick and Yee Lau Geosystems Research Institute at Stennis Mississippi State University Basic issue: the methodologies
Experimental Probabilistic Hurricane Inundation Surge Height (PHISH) Guidance
 Guidance") Experimental Probabilistic Hurricane Inundation Surge Height (PHISH) Guidance DRBC Flood Advisory Committee John Kuhn - NWS/OCWWS Anne Myckow (NWS/MDL), Arthur Taylor (NWS/MDL) SLOSH Sea, Lake and Overland
Experimental Probabilistic Hurricane Inundation Surge Height (PHISH) Guidance DRBC Flood Advisory Committee John Kuhn - NWS/OCWWS Anne Myckow (NWS/MDL), Arthur Taylor (NWS/MDL) SLOSH Sea, Lake and Overland
Sea Level Rise and Hurricane Florence storm surge research methodology
 Sea Level Rise and Hurricane Florence storm surge research methodology Hurricane Florence storm surge analysis was conducted using a variety of input sources. In order to determine the maximum storm surge
Chapter 3 East Timor (Timor-Leste)
") Chapter 3 East Timor (Timor-Leste) 49 3.1 Climate Summary 3.1.1 Current Climate Despite missing temperature records for Dili Airport, it is probable that over the past half century there has been a warming
Chapter 3 East Timor (Timor-Leste) 49 3.1 Climate Summary 3.1.1 Current Climate Despite missing temperature records for Dili Airport, it is probable that over the past half century there has been a warming
Tropical Cyclone Oswald Coastal Monitoring
 Tropical Cyclone Oswald Coastal Monitoring Kieran Harper and John Maher Coastal Impacts Unit, Queensland Department of Science, Information Technology, Innovation and the Arts (DSITIA). 27 Quinlan St Deagon,
A Climatology of Landfalling Hurricane Central Pressures Along the Gulf of Mexico Coast
 A Climatology of Landfalling Hurricane Central Pressures Along the Gulf of Mexico Coast David H. Levinson NOAA National Climatic Data Center Asheville, NC Peter J. Vickery Applied Research Associates,
The MSC Beaufort Wind and Wave Reanalysis
 The MSC Beaufort Wind and Wave Reanalysis Val Swail Environment Canada Vincent Cardone, Brian Callahan, Mike Ferguson, Dan Gummer and Andrew Cox Oceanweather Inc. Cos Cob, CT, USA Introduction: History
THC-T-2013 Conference & Exhibition
 Modeling of Shutter Coastal Protection against Storm Surge for Galveston Bay C. Vipulanandan, Ph.D., P.E., Y. Jeannot Ahossin Guezo and and B. Basirat Texas Hurricane Center for Innovative Technology (THC-IT)
Storm Summary for Hurricane Jose
 Storm Summary for Hurricane Jose Tuesday, September 19, 2017 at 11 AM EDT (Output from Hurrevac, based on National Hurricane Center Forecast Advisory #57) Jose is currently a Category 1 hurricane on the
HURRICANE IVAN CHARACTERISTICS and STORM TIDE EVALUATION
 HURRICANE IVAN CHARACTERISTICS and STORM TIDE EVALUATION By Robert Wang and Michael Manausa Sponsored by Florida Department of Environmental Protection, Bureau of Beaches and Coastal Systems Submitted
8.1.2 Climate Projections
 Chapter 8 Nauru 167 8.1 Climate Summary 8.1.1 Current Climate Over the past half century it is likely that there has been a warming air temperature trend at Nauru which is partly associated with warming
Savannah Harbor Expansion Project
 Savannah Harbor Expansion Project Evaluation of Hurricane Surge Impacts with Proposed Mitigation Plan December 2007 Introduction This report summarizes the results of hurricane surge impacts with implementation
1C.4 TROPICAL CYCLONE TORNADOES: SYNOPTIC SCALE INFLUENCES AND FORECASTING APPLICATIONS
 1C.4 TROPICAL CYCLONE TORNADOES: SYNOPTIC SCALE INFLUENCES AND FORECASTING APPLICATIONS Daniel J. Cecil and Lori A. Schultz University of Alabama in Huntsville, Huntsville, AL, 35805 1. INTRODUCTION Several
Upgrade of JMA s Typhoon Ensemble Prediction System
 Upgrade of JMA s Typhoon Ensemble Prediction System Masayuki Kyouda Numerical Prediction Division, Japan Meteorological Agency and Masakazu Higaki Office of Marine Prediction, Japan Meteorological Agency
Comments by William M. Gray (Colorado State University) on the recently published paper in Science by Webster, et al
 on the recently published paper in Science by Webster, et al") Comments by William M. Gray (Colorado State University) on the recently published paper in Science by Webster, et al., titled Changes in tropical cyclone number, duration, and intensity in a warming environment
Comments by William M. Gray (Colorado State University) on the recently published paper in Science by Webster, et al., titled Changes in tropical cyclone number, duration, and intensity in a warming environment
Improving global coastal inundation forecasting WMO Panel, UR2014, London, 2 July 2014
 Improving global coastal inundation forecasting WMO Panel, UR2014, London, 2 July 2014 Cyclone Sidr, November 2007 Hurricane Katrina, 2005 Prof. Kevin Horsburgh Head of marine physics, UK National Oceanography
Queensland Storm Surge Forecasting Model Design Using Sensitivity Analysis
 21st International Congress on Modelling and Simulation, Gold Coast, Australia, 29 Nov to 4 Dec 215 www.mssanz.org.au/modsim215 Queensland Storm Surge Forecasting Model Design Using Sensitivity Analysis
Major Hurricane Matthew Briefing Situation Overview
 Major Hurricane Matthew Briefing Situation Overview THIS IS NOW A WORST CASE STORM SURGE SCENARIO Catastrophic Damage is Anticipated for Coastal Areas. Major Hurricane Matthew is still expected to move
Climate Risk Profile for Samoa
 Climate Risk Profile for Samoa Report Prepared by Wairarapa J. Young Samoa Meteorology Division March, 27 Summary The likelihood (i.e. probability) components of climate-related risks in Samoa are evaluated
Frank Revitte National Weather Service. Weather Forecast Office New Orleans/Baton Rouge
 Frank Revitte National Weather Service Weather Forecast Office New Orleans/Baton Rouge Above normal activity 17 Total Named Storms 7 Tropical Storms 4 Hurricanes 6 Major Hurricanes Not the most active,
Modelling coastal flood risk in the data poor Bay of Bengal region
 Modelling coastal flood risk in the data poor Bay of Bengal region Matt Lewis*, Kevin Horsburgh (NOC), Paul Bates (Bristol) *m.j.lewis@bangor.ac.uk Funded by the EPSRC Flood Risk Management Research Consortium
HURRICANE FRANCES CHARACTERISTICS and STORM TIDE EVALUATION
 HURRICANE FRANCES CHARACTERISTICS and STORM TIDE EVALUATION ((DRAFT)) By Robert Wang and Michael Manausa Sponsored by Florida Department of Environmental Protection, Bureau of Beaches and Coastal Systems
Tropical Storm Harvey: SE Texas Impacts
 Tropical Storm Harvey: SE Texas Impacts 10 AM CDT UPDATE Thursday, August 24, 2017 Prepared by: Dan Reilly, Brian Kyle PLEASE MUTE YOUR LINES AND DON T PUT ON HOLD! Situation Overview Tropical Storm Harvey
Draft for Discussion 11/11/2016
 Coastal Risk Consulting (CRC) Climate Vulnerability Assessment for Village of Key Biscayne Deliverable 1.1 in Statement of Work. Preliminary Vulnerability Assessment Identifying Flood Hotspots Introduction...
A global slowdown of tropical-cyclone translation speed and implications for flooding
 A global slowdown of tropical-cyclone translation speed and implications for flooding Thomas Mortlock, Risk Frontiers As the Earth s atmosphere warms, the atmospheric circulation changes. These changes
Forced and internal variability of tropical cyclone track density in the western North Pacific
 Forced and internal variability of tropical cyclone track density in the western North Pacific Wei Mei 1 Shang-Ping Xie 1, Ming Zhao 2 & Yuqing Wang 3 Climate Variability and Change and Paleoclimate Working
Monthly Long Range Weather Commentary Issued: SEPTEMBER 19, 2016 Steven A. Root, CCM, Chief Analytics Officer, Sr. VP,
 Monthly Long Range Weather Commentary Issued: SEPTEMBER 19, 2016 Steven A. Root, CCM, Chief Analytics Officer, Sr. VP, sroot@weatherbank.com SEPTEMBER 2016 Climate Highlights The Month in Review The contiguous
SST and North American Tropical Cyclone Landfall: A Statistical Modeling Study
 SST and North American Tropical Cyclone Landfall: A Statistical Modeling Study arxiv:0801.1013v1 [physics.ao-ph] 7 Jan 2008 Timothy M. Hall NASA Goddard Institute for Space Studies, New York, NY Stephen
HURRICANE CHARLEY CHARACTERISTICS and STORM TIDE EVALUATION
 HURRICANE CHARLEY CHARACTERISTICS and STORM TIDE EVALUATION By Robert Wang, Michael Manausa And Jenny Cheng Sponsored by Florida Department of Environmental Protection, Bureau of Beaches and Coastal Systems
APPENDIX B PHYSICAL BASELINE STUDY: NORTHEAST BAFFIN BAY 1
 APPENDIX B PHYSICAL BASELINE STUDY: NORTHEAST BAFFIN BAY 1 1 By David B. Fissel, Mar Martínez de Saavedra Álvarez, and Randy C. Kerr, ASL Environmental Sciences Inc. (Feb. 2012) West Greenland Seismic
HAZUS th Annual Conference
 HAZUS 2014 7 th Annual Conference VALIDATING THE HAZUS COASTAL SURGE MODEL FOR SUPERSTORM SANDY Spiridon Katehis 1 Jordan T. Hastings 1 1 University of Southern California 1 Superstorm Sandy, Oct 12 2
April Forecast Update for North Atlantic Hurricane Activity in 2019
 April Forecast Update for North Atlantic Hurricane Activity in 2019 Issued: 5 th April 2019 by Professor Mark Saunders and Dr Adam Lea Dept. of Space and Climate Physics, UCL (University College London),
Natural Disasters. in Florida. Severe Thunderstorms
 Natural Disasters in Florida SC.6.E.7.7 Investigate how natural disasters have affected human life in Florida. Severe Thunderstorms While the typical afternoon thunderstorm in Florida may not appear to
Ellen L. Mecray NOAA Regional Climate Services Director, Eastern Region Taunton, MA
 Ellen L. Mecray NOAA Regional Climate Services Director, Eastern Region Taunton, MA Regions of the US National Climate Assessment What we Observe: Climate changes and impacts Increasing temperature Increasingly
Detailed modeling of recent severe storm tides in estuaries of the New York City region
 JOURNAL OF GEOPHYSICAL RESEARCH, VOL. 117,, doi:10.1029/2012jc008220, 2012 Detailed modeling of recent severe storm tides in estuaries of the New York City region Philip Orton, 1 Nickitas Georgas, 1 Alan
Navigating the Hurricane Highway Understanding Hurricanes With Google Earth
 Navigating the Hurricane Highway Understanding Hurricanes With Google Earth 2008 Amato Evan, Kelda Hutson, Steve Kluge, Lindsey Kropuenke, Margaret Mooney, and Joe Turk Images and data courtesy hurricanetracking.com,
Tropical Update. 5 PM EDT Thursday, September 7, 2017 Hurricane Irma, Hurricane Jose, and Hurricane Katia
 Tropical Update 5 PM EDT Thursday, September 7, 2017 Hurricane Irma, Hurricane Jose, and Hurricane Katia This update is intended for government and emergency response officials, and is provided for informational
Chapter 5: Weather Systems
 Chapter 5: Weather Systems Norwegian Cyclone Model: Polar Front Theory Mid Latitude Cyclones: extratropical cyclones, Nor easters Hurricanes Storm Surge Mid-latitude Cyclone: -primary weather producers
A Preliminary Climatology of Extratropical Transitions in the Southwest Indian Ocean
 A Preliminary Climatology of Extratropical Transitions in the Southwest Indian Ocean Kyle S. Griffin Department of Atmospheric and Environmental Sciences, University at Albany, State University of New
Chapter 16, Part Hurricane Paths. 2. Hurricane Paths. Hurricane Paths and Damage
 Chapter 16, Part 2 Hurricane Paths and Damage 1. Hurricane Paths Start over tropical water except South Atlantic and eastern South Atlantic, where water is too cold. Initially steered by easterly winds
Hurricane Wilma Post Storm Data Acquisition Estimated Peak Wind Analysis and Storm Tide Data. December 27, 2005
 Hurricane Wilma Post Storm Data Acquisition Estimated Peak Wind Analysis and Storm Tide Data December 27, 2005 Hurricane Wilma was the sixth major hurricane of the record-breaking 2005 Atlantic hurricane
Exploring the Use of Dynamical Weather and Climate Models for Risk Assessment
 Exploring the Use of Dynamical Weather and Climate Models for Risk Assessment James Done Willis Research Network Fellow National Center for Atmospheric Research Boulder CO, US Leverages resources in the
MODELLING CATASTROPHIC COASTAL FLOOD RISKS AROUND THE WORLD
 MODELLING CATASTROPHIC COASTAL FLOOD RISKS AROUND THE WORLD Nicola Howe Christopher Thomas Copyright 2016 Risk Management Solutions, Inc. All Rights Reserved. June 27, 2016 1 OUTLINE MOTIVATION What we
August Forecast Update for Atlantic Hurricane Activity in 2012
 August Forecast Update for Atlantic Hurricane Activity in 2012 Issued: 6 th August 2012 by Professor Mark Saunders and Dr Adam Lea Dept. of Space and Climate Physics, UCL (University College London), UK
Hurricane Recipe. Hurricanes
 Hurricanes A hurricane is a powerful, rotating storm that forms over warm oceans near the Equator. Hurricanes have strong, rotating winds (at least 74 miles per hour), a huge amount of rain, low air pressure,
Understanding Weather and Climate Risk. Matthew Perry Sharing an Uncertain World Conference The Geological Society, 13 July 2017
 Understanding Weather and Climate Risk Matthew Perry Sharing an Uncertain World Conference The Geological Society, 13 July 2017 What is risk in a weather and climate context? Hazard: something with the
2015 Hurricane Season Summary for Eastern Canada Impacts and Operational Notes
 2015 Hurricane Season Summary for Eastern Canada Impacts and Operational Notes John Parker Canadian Hurricane Centre, Meteorological Service of Canada April, 2016 Storms affecting Canadian territory in
Tropical Update. 5 PM EDT Sunday, October 7, 2018 Tropical Storm Michael, Tropical Storm Leslie, & Invest 92L (30%)
") Tropical Update 5 PM EDT Sunday, October 7, 2018 Tropical Storm Michael, Tropical Storm Leslie, & Invest 92L (30%) This update is intended for government and emergency response officials, and is provided
Tropical Update 5 PM EDT Sunday, October 7, 2018 Tropical Storm Michael, Tropical Storm Leslie, & Invest 92L (30%) This update is intended for government and emergency response officials, and is provided
Cause, Assessment & Management of Flood Hazards associated with Landfalling Tropical Cyclones & Heavy Rain
 Cause, Assessment & Management of Flood Hazards associated with Landfalling Tropical Cyclones & Heavy Rain by CHEN Charng Ning, Professor Emeritus Nanyang Technological University (NTU), Singapore Consultant,
HURRICANES AND CLIMATE
 HURRICANES AND CLIMATE CURRENT CHALLENGES Gabriel A. Vecchi NOAA/GFDL, Princeton, NJ Image: NASA. GOALS Document changes in hurricane statistics, with as little inhomogeneity as possible and quantified
Name Earth Science Pd. Hurricanes. Directions: Read the information, view diagrams and answer the questions in the worksheet.
 Hurricanes Directions: Read the information, view diagrams and answer the questions in the worksheet. Hurricane Basics The ingredients for a hurricane include a pre-existing weather disturbance, warm tropical
USACE-ERDC Coastal Storm Modeling System Updates Chris Massey, PhD
 USACE-ERDC Coastal Storm Modeling System Updates Chris Massey, PhD Research Mathematician USACE-ERDC Coastal & Hydraulics Lab Chris.Massey@usace.army.mil ERDC s Coastal Storm-Modeling System (ERDC CSTORM-MS)
A geological perspective on sea-level rise and its impacts
 A geological perspective on sea-level rise and its impacts K.G. Miller, R.E. Kopp, B.H. Horton, J.V. Browning, A.C. Kemp Front Pages November 1, 2012 kgm@rutgers.edu Ship Bottom, Long Beach Island, NJ
A Perfect Storm: The Collision of Hurricanes, Climate Change and Coastal Population Growth. Jeff Donnelly Woods Hole Oceanographic Institution
 A Perfect Storm: The Collision of Hurricanes, Climate Change and Coastal Population Growth Jeff Donnelly Woods Hole Oceanographic Institution Human caused climate change 1000 900 800 700 600 CO2 ppmv 500
Storms. 3. Storm types 4. Coastal Sectors 5. Sorm Location and Seasonality 6. Storm Severity 7. Storm Frequency and grouping 8. The design storm event
 1. Introduction Storms 2. The Impact of Storms on the coast 3. Storm types 4. Coastal Sectors 5. Sorm Location and Seasonality 6. Storm Severity 7. Storm Frequency and grouping 8. The design storm event
GC Briefing. Weather Sentinel Hurricane Florence. Status at 5 PM EDT (21 UTC) Today (NHC) Discussion. September 13, 2018
 Today (NHC) Discussion. September 13, 2018") GC Briefing September 13, 2018 Weather Sentinel Hurricane Florence Tropical storm conditions have been reported for areas of North Carolina and will continue to spread inland to the west and south. Hurricane
GC Briefing September 13, 2018 Weather Sentinel Hurricane Florence Tropical storm conditions have been reported for areas of North Carolina and will continue to spread inland to the west and south. Hurricane
Cape Verde. General Climate. Recent Climate. UNDP Climate Change Country Profiles. Temperature. Precipitation
 UNDP Climate Change Country Profiles C. McSweeney 1, M. New 1,2 and G. Lizcano 1 1. School of Geography and Environment, University of Oxford. 2. Tyndall Centre for Climate Change Research http://country-profiles.geog.ox.ac.uk
Agricultural Outlook Forum Presented: February 17, 2006 THE SCIENCE BEHIND THE ATLANTIC HURRICANES AND SEASONAL PREDICTIONS
 Agricultural Outlook Forum Presented: February 17, 2006 THE SCIENCE BEHIND THE ATLANTIC HURRICANES AND SEASONAL PREDICTIONS Gerald Bell Meteorologist, National Centers for Environmental Prediction NOAA,
Coastal Cities-Coastal Impacts: 'The Tides They Are A-Changin
 Coastal Cities-Coastal Impacts: 'The Tides They Are A-Changin Susan K. Avery Woods Hole Oceanographic Institution Thanks to: Jeff Donnelly, Chris Reddy, Porter Hoagland, Jim Price, Dennis McGillicuddy,
North Pacific Climate Overview N. Bond (UW/JISAO), J. Overland (NOAA/PMEL) Contact: Last updated: August 2009
, J. Overland (NOAA/PMEL) Contact: Last updated: August 2009") North Pacific Climate Overview N. Bond (UW/JISAO), J. Overland (NOAA/PMEL) Contact: Nicholas.Bond@noaa.gov Last updated: August 2009 Summary. The North Pacific atmosphere-ocean system from fall 2008 through
North Pacific Climate Overview N. Bond (UW/JISAO), J. Overland (NOAA/PMEL) Contact: Nicholas.Bond@noaa.gov Last updated: August 2009 Summary. The North Pacific atmosphere-ocean system from fall 2008 through
Flood and Sea Level Rise Mapping Methodologies: The Way Forward
 Flood and Sea Level Rise Mapping Methodologies: The Way Forward Malcolm L. Spaulding Professor Emeritus, Ocean Engineering University of Rhode Island spaulding@egr.uri.edu Interagency Coordination Meeting