Tropical Cyclone Oswald Coastal Monitoring
|
|
|
- Domenic Preston
- 5 years ago
- Views:
Transcription
1 Tropical Cyclone Oswald Coastal Monitoring Kieran Harper and John Maher Coastal Impacts Unit, Queensland Department of Science, Information Technology, Innovation and the Arts (DSITIA). 27 Quinlan St Deagon, Brisbane Introduction The Coastal Impacts Unit of the Queensland Department of Science, Information Technology, Innovation and the Arts (DSITIA) is responsible for measuring waves and storm tide levels along the Queensland coastline. This information is used for weather forecasting, and for monitoring and assessing storm erosion and peak storm surges. This paper summarises the coastal data collected during the passage of Ex-Tropical Cyclone Oswald through Queensland in January 2013, as presented in DSITIA (2013). Background The Bureau of Meteorology began tracking a low pressure weather system in the Gulf of Carpentaria on 17 January The system intensified and developed into a category 1 tropical cyclone and was officially named Tropical Cyclone Oswald on Monday 21 January TC Oswald then crossed Cape York Peninsula on 22 January and deteriorated into a low pressure system before tracking south inland of the coastline. The remnants of Ex-Tropical Cyclone Oswald remained significant as it moved down the coast due to the high rainfall, cyclonic winds, large waves and extreme sea levels it produced, impacting virtually the entire QLD coastline. The south east corner was particularly affected by flooding events when the system stalled over the region. For the Coastal Impacts Unit the event was especially interesting because it was one of the few occasions when a single weather system was seen to impact every monitoring site along the coast. Methods DSITIA operates a network of 14 wave monitoring sites along the Queensland coastline. Wave data from the network is collected by DSITIA to monitor wave conditions for coastal management and engineering; and for boating and shipping safety. Wave data is also routinely provided to the Bureau of Meteorology to assist in weather forecasting and severe weather warnings. Significant wave height (Hsig), maximum wave height (Hmax), peak energy direction, wave period information and other details are all determined from wave records spanning approximately 30 minutes each. DSITIA also operates a network of 25 storm tide gauges located in shallow water, waterways and harbours along the Queensland coastline. The storm tide network allows real-time access to sea level data during severe weather events to monitor the impacts of coastal flooding from storm surges. The sea level data includes three components that impact on flood and coastal inundation levels; the tide, wave setup and storm surge. Of particular interest is the measurement of tidal residual, which is the difference between observed sea level and predicted astronomical tide. All storm tide stations, with the exception of Cooktown are additionally fitted with barometers. The

2 information collected during storm events is used to monitor the severity of the event, and to help improve forecasts and modelling of future events. Figure 1 - DSITIA Wave and Tide site locations and the Ex-TC Oswald track Results Ex-Tropical Cyclone Oswald generated a number of record top 10 highest waves along the Queensland coast, including some sites with more than 30 years of data. The largest Hsig observed during the passing of Ex-Tropical Cyclone Oswald was 7.11m measured by the Brisbane buoy, located 10 km off-shore from point lookout, in a water depth of 70m. The peak Hsig was recorded at 7:30am on 28 January and ranked third in the record of 37 years in length. The maximum wave height measured during this period was 12.11m at Brisbane. By comparison the largest wave ever recorded by the Coastal Impacts Unit was the result of an east coast low in 2006 which produced a Hmax of 16.80m at the same location.
3 Table 1 - Peak significant and max wave heights (30+ years of data in bold) Site (start year) Peak Hsig (m) Time / Date Event Ranking Peak Hmax (m) Time / Date Event ranking Albatross Bay (2008) :00pm 22nd :00pm 22nd 1 Cairns (1975) :30pm 23rd :00pm 23rd 2 Townsville (1975) Abbot Point (2012) :30am 24th :30am 24th :00pm 24th :30pm 24th 1 Mackay (1975) :30am 23rd :00am 23rd 55 Hay Point (1977)* Emu Park (1996) Gladstone (2009) Mooloolaba (2000) Central Moreton (2011) North Moreton (2010) Brisbane (1976) Gold Coast (1987) Tweed Heads (1995) :00pm 24th :30pm 24th :00am 25th :30am 25th :00am 25th :00pm 25th :30am 28th :00am 28th :30am 28th :30am 27th :00pm 27th :30pm 27th :30am 28th :30am 28th :30am 28th :30am 28th :30am 28th :00am 28th 2 The majority of tide gauge sites observed sea levels within 0.50m of reaching Highest Astronomical Tide (HAT). With the exception of Karumba, all the maxima were within 35 minutes of the predicted high tide. At Karumba the maximum level was reached 5 hours after the high tide. From the 25 monitoring sites there were 3 sites with levels greater than HAT. The most extreme was recorded at Weipa where the peak level of 3.89m was 0.51m higher than HAT. The lowest barometric pressure recorded by the gauges was 988.8hPa at Clump Point. In order to best illustrate the influence of the event down the coast, Figure 2 shows the wave activity recorded over all sites, Figure 3 shows the tidal residuals between Townsville and Mooloolaba, and Figure 4 shows the barometric pressure recorded between Thursday Island and Townsville. The sites are ordered from north to south so that the movement of the storm position over time can be easily identified. The time where the storm was closest to the recording site is also shown as a black line, and labelled accordingly underneath the site name.


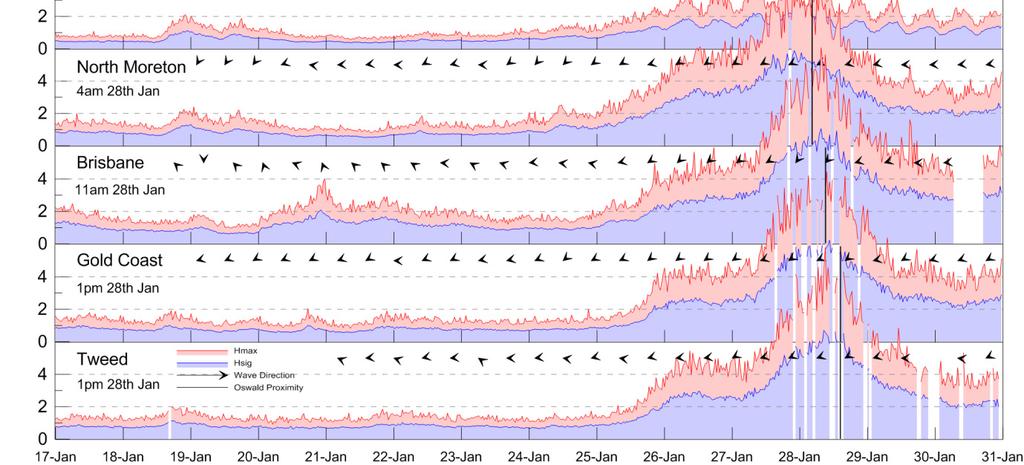
4 Figure 2 - Wave heights and peak wave directions


5 Figure 3 - Tidal residuals (Townsville - Mooloolaba)
")


6 Figure 4 - Barometric pressure (Thursday Island - Townsville) Discussion Immediately distinguishable from the recorded data is the progression of the weather system down the coast over roughly a 6 day period. Nearly all sites show a clear correlation between the time when the system was closest, and the peak recorded values.
7 The impact on south east Queensland is clear, with more dramatic differences between the observed conditions before and during the event. Wave conditions were more severe in this region compared to regions further north, likely due to a combination of the influence of the Great Barrier Reef limiting wave growth and the travel speed of the system. The tidal residuals at Burnett Heads (located near the mouth of the Burnett River at Bundaberg) indicate the point where the storm tide coincided with floodwater from the river systems, transforming the storm tide gauge into a flood gauge while the region was inundated for several days. Gaps in the data can be observed, either sporadic or spanning several hours, serving as an additional indicator of the extreme nature of the event being monitored. These gaps tend to occur during the peaks, and can either be attributed to exceeded instrument limitations, or issues with maintaining real-time data transmission during increasingly inclement weather. The larger gaps often correspond to power failure on the land, disabling the gauges or wave data receiver stations. All DSITIA storm tide monitoring sites showed noticeable tidal residuals when the storm was nearby. While only 3 sites exceeded HAT, and only by small amounts, the recorded tidal residuals show that although Ex-TC Oswald was travelling inland as a low pressure system, it still had considerable impact on the Queensland coastline. Take Home Messages The data collected during Ex-TC Oswald is interesting to analyse due to the widespread impact throughout Queensland. It is especially interesting to observe that the storm caused the most disruption when it was in the south east corner, despite having weakened into an Ex-Tropical Cyclone several days earlier. Clear time-correlation was found between the peaks from all three measured phenomenon (wave heights, tidal residuals, minimum barometric pressure) with respect to each other as well as the storm position tracking provided by BoM. This event highlights the value and importance of maintaining the DSITIA wave and tide monitoring networks. The ongoing collection and publication of actual extreme event conditions is significantly beneficial to emergency managers and the scientific community working to improve Queensland s resilience to extreme events. Acknowledgments 1. Cyclone Oswald tracking data and imagery courtesy of Bureau of Meteorology ( 2. Queensland mapping data provided by Maritime Safety Queensland ( 3. Queensland topography data from Geoscience Australia ( 4. Great Barrier Reef data courtesy of the Great Barrier Reef Marine Park Authority ( References Queensland Government, DSITIA (2013). Tropical Cyclone Oswald Coastal Monitoring Data Report. Coastal Impacts Unit. Publishing pending.
CASE STUDY: Tropical Cyclone Monica, April 2006
 CASE STUDY: Tropical Cyclone Monica, April 2006 By Mr Jeff Callaghan Retired Senior Severe Weather Forecaster, Bureau of Meteorology, Brisbane The track of tropical cyclone Monica (Figure 1) took it from
Queensland Storm Surge Forecasting Model Design Using Sensitivity Analysis
 21st International Congress on Modelling and Simulation, Gold Coast, Australia, 29 Nov to 4 Dec 215 www.mssanz.org.au/modsim215 Queensland Storm Surge Forecasting Model Design Using Sensitivity Analysis
Meeting the New Queensland Coastal Plan Storm Surge Requirements for Redland City Council. Queensland Coastal Conference 2011
 Meeting the New Queensland Coastal Plan Storm Surge Requirements for Redland City Council Ancient Knowledge Contemporary Innovation The Pullman Reef Hotel, Cairns Daniel Niven 1 and David Taylor 2 1 Cardno
TOWNSVILLE STORM SURGE HYPOTHETICAL: TECHNICAL SPECIFICATIONS
 TOWNSVILLE STORM SURGE HYPOTHETICAL: TECHNICAL SPECIFICATIONS Stuart Mead, Mahesh Prakash and Fletcher Woolard CSIRO Mathematics, Informatics and Statistics, Private Bag 33, Clayton South, VIC 3168, Australia
Tropical Storm Harvey: SE Texas Impacts
 Tropical Storm Harvey: SE Texas Impacts 10 AM CDT UPDATE Thursday, August 24, 2017 Prepared by: Dan Reilly, Brian Kyle PLEASE MUTE YOUR LINES AND DON T PUT ON HOLD! Situation Overview Tropical Storm Harvey
Gladstone Tide Tables 2018
 Gladstone Tide Tables Gladstone Tide Tables Page 1 Tidal notes and definitions Tidal datum epoch Australian tidal authorities have adopted the year Tidal Datum Epoch 92 to 11 (inclusive) as the basis for
P2.57 Cyclone Yasi Storm Surge in Australia Implications for Catastrophe Modeling
 P2.57 Cyclone Yasi Storm Surge in Australia Implications for Catastrophe Modeling Kevin A. Hill*, Peter Sousounis, and Jason Butke AIR Worldwide Corporation, Boston, Massachusetts 1. INTRODUCTION Storm
Modelling Coastal Environments Professional Consulting Services Coastal Inundation Tsunamis Coastal Hazard Adaptation Strategies Coastal Processes
 Modelling Coastal Environments Professional Consulting Services Coastal Inundation Tsunamis Coastal Hazard Adaptation Strategies Coastal Processes bmtwbm.com.au Coastal Inundation Risk Assessments Long-term
Tidal Reference Frame For Queensland
 Tidal Reference Frame For Queensland G. J (John) Broadbent Maritime Safety Queensland, Mineral House, George Street Brisbane 4001 Australia Tel: +61 7 3224 8802, Fax: +61 7 3404 3089, Email: tides@msq.qld.gov.au
Tropical Update. 5 AM EDT Tuesday, September 12, 2017 Post-Tropical Cyclone Irma, Hurricane Jose, & Tropical Wave (10%)
") Tropical Update 5 AM EDT Tuesday, September 12, 2017 Post-Tropical Cyclone Irma, Hurricane Jose, & Tropical Wave (10%) This update is intended for government and emergency response officials, and is provided
Tropical Update 5 AM EDT Tuesday, September 12, 2017 Post-Tropical Cyclone Irma, Hurricane Jose, & Tropical Wave (10%) This update is intended for government and emergency response officials, and is provided
Hurricane Harvey: SE Texas Impacts. 10 PM CDT UPDATE Friday, August 25, 2017 Prepared by: Lance Wood
 Hurricane Harvey: SE Texas Impacts 10 PM CDT UPDATE Friday, August 25, 2017 Prepared by: Lance Wood Latest Observations Hurricane Harvey making landfall this evening near Rockport as a category 4 hurricane.
NOAA s National Weather Service Philadelphia/Mt. Holly NJ
 Next Briefing Package: Thursday, October 1, 2015 no later than 300 PM Hazards and Impacts: Overview: A dangerous weather pattern is developing for our region. Threats include very heavy rainfall, inland
NOAA s National Weather Service Philadelphia/Mt. Holly NJ
 Next Briefing Package: Friday, October 2, 2015 no later than 300 PM Hazards and Impacts: Overview: A dangerous weather pattern still threatens our region. Threats include very heavy rainfall, inland river
Real-time numerical simulation of storm surge inundation using high-performance computing for disaster management, Queensland.
 Real-time numerical simulation of storm surge inundation using high-performance computing for disaster management, Queensland. Joanna Burston, Takehiko Nose and Rodger Tomlinson Griffith Centre for Coastal
WEDNESDAY 30 TH AUGUST, :57 p.m. Tropical Storm Irma forms in the Atlantic. Don t let your guard down, always #Be Ready.
 Chapter 1 - The Set Up In the days leading up to Irma a series of composed and sobering text messages, presented in truncated form below, from Department of Disaster Management warned us of the pending
HURRICANE FRANCES CHARACTERISTICS and STORM TIDE EVALUATION
 HURRICANE FRANCES CHARACTERISTICS and STORM TIDE EVALUATION ((DRAFT)) By Robert Wang and Michael Manausa Sponsored by Florida Department of Environmental Protection, Bureau of Beaches and Coastal Systems
Key Takeaways: - Rain: Coastal NC: ; isolated totals to 40 Central, Western, & Northeastern NC: 5-10 ; isolated totals to 20
 Key Takeaways: - Life-Threatening Impacts Will Extend Far From The Storm s Center: Despite the southward shift in track, widespread and extreme impacts from heavy rain, storm surge, and wind are still
GC Briefing. Weather Sentinel Hurricane Florence. Status at 5 PM EDT (21 UTC) Today (NHC) Discussion. September 13, 2018
 Today (NHC) Discussion. September 13, 2018") GC Briefing September 13, 2018 Weather Sentinel Hurricane Florence Tropical storm conditions have been reported for areas of North Carolina and will continue to spread inland to the west and south. Hurricane
GC Briefing September 13, 2018 Weather Sentinel Hurricane Florence Tropical storm conditions have been reported for areas of North Carolina and will continue to spread inland to the west and south. Hurricane
Case Study: Modeling the Bundaberg Floods. Sudesh Mudaliar, VP Asia Pacific Anthony Kuch, VP North America
 Case Study: Modeling the Bundaberg Floods Sudesh Mudaliar, VP Asia Pacific Anthony Kuch, VP North America Bundaberg Case Study Burnett River Flood Events Flood Damage Impacts Surveying & LiDAR Current
SLOSH New Orleans Basin 2012 Update
 SLOSH New Orleans Basin 2012 Update Michael Koziara Science and Operations Officer National Weather Service Slidell, LA The Basics What is storm surge? What is SLOSH? Details Assumptions Inundation = Storm
Tropical Cyclones Modelling For Natural Disaster Risk Management
 Tropical Cyclones Modelling For Natural Disaster Risk Management Juan Savioli a, M. Britton b, S. Szylkarski a and Claus Pederson a a DHI Water and Environment, 2 Elliott Street, Suite 1a, QLD 4217 Surfers
Integrating Hydrologic and Storm Surge Models for Improved Flood Warning
 Integ Hydrologic and Storm Surge Models for Improved Flood Warning Leahy, C.P, Entel, M, Sooriyakumaran, S, and Warren, G Flood Warning Program Office, Bureau of Meteorology, Docklands, Victoria National
Tropical Cyclone Dinah, 1967
 Tropical Cyclone Dinah, 1967 By Mr Jeff Callaghan Retired Senior Severe Weather Forecaster, Bureau of Meteorology, Brisbane Dinah 24-31 January 1967 probably generated the largest waves observed in Southern
Tropical Update. 11 AM EDT Wednesday, October 10, 2018 Hurricane Michael, Hurricane Leslie & Tropical Storm Nadine, Caribbean Low (40%)
") Tropical Update 11 AM EDT Wednesday, October 10, 2018 Hurricane Michael, Hurricane Leslie & Tropical Storm Nadine, Caribbean Low (40%) This update is intended for government and emergency response officials,
Tropical Update 11 AM EDT Wednesday, October 10, 2018 Hurricane Michael, Hurricane Leslie & Tropical Storm Nadine, Caribbean Low (40%) This update is intended for government and emergency response officials,
EFFECTIVE TROPICAL CYCLONE WARNING IN BANGLADESH
 Country Report of Bangladesh On EFFECTIVE TROPICAL CYCLONE WARNING IN BANGLADESH Presented At JMA/WMO WORKSHOP ON EFFECTIVE TROPICAL CYCLONE WARNING IN SOUTHEAST ASIA Tokyo, Japan,11-14 March 2014 By Sayeed
Estimation of extreme sea levels from altimetry and tide gauges at the coast
 Estimation of extreme sea levels from altimetry and tide gauges at the coast Xiaoli Deng (1), Ole B. Andersen (2), Yongcun Cheng (2), Mark G. Stewart (1) and Zahra Gharineiat (1) (1) School of Engineering,
Tropical Update. 5 PM EDT Sunday, October 7, 2018 Tropical Storm Michael, Tropical Storm Leslie, & Invest 92L (30%)
") Tropical Update 5 PM EDT Sunday, October 7, 2018 Tropical Storm Michael, Tropical Storm Leslie, & Invest 92L (30%) This update is intended for government and emergency response officials, and is provided
Tropical Update 5 PM EDT Sunday, October 7, 2018 Tropical Storm Michael, Tropical Storm Leslie, & Invest 92L (30%) This update is intended for government and emergency response officials, and is provided
Residents Emergency Response Checklist
 COMMUNITY RESILIENCE PLAN Residents Emergency Response Checklist A helpful guide in the event of extreme weather or bushfire events. < PREVIOUS I NEXT > 02 Purchasing an existing property or building a
June 2018 Sediments and Dredging at GBR Ports
 June 2018 Sediments and Dredging at GBR Ports Reef 2050 Long Term Sustainability Plan The Great Barrier Reef is over 2000 km long and covers an area of approximately 350,000 square kilometres. It is a
HURRICANE IRENE. CONFERENCE CALL BRIEFING SLIDES Saturday August 27, :30 AM
 HURRICANE IRENE CONFERENCE CALL BRIEFING SLIDES Saturday August 27, 2011 8:30 AM NHC TRACK AND CONE HURRICANE IRENE WATCHES/WARNINGS Hurricane Warning along south coast including all of Cape Cod and Islands
The National Hurricane Center
 The National Hurricane Center Where we are and where we hope to go Bill Read, Director National Hurricane Center U.S. HURRICANE FORECAST SERVICE HISTORY MODERN ERA HIGHLIGHTS 1935: Began 24 hour forecast
GC Briefing. Weather Sentinel Tropical Storm Michael. Status at 8 AM EDT (12 UTC) Today (NHC) Discussion. October 11, 2018
 Today (NHC) Discussion. October 11, 2018") GC Briefing Weather Sentinel Tropical Storm Michael October 11, 2018 After making landfall as a high-end category-4 hurricane on the Florida Panhandle, Michael weakened to tropical storm status early this
GC Briefing Weather Sentinel Tropical Storm Michael October 11, 2018 After making landfall as a high-end category-4 hurricane on the Florida Panhandle, Michael weakened to tropical storm status early this
Active Weather Threat Halloween Week Nor easter October 28 th 31 st 2012
 Active Weather Threat Halloween Week Nor easter October 28 th 31 st 2012 Prepared 1130 AM EDT Wednesday, October 24, 2012 Gary Szatkowski NOAA s NJ Forecast Office Weather.gov/phi Purpose of Briefing Briefing
Storms. 3. Storm types 4. Coastal Sectors 5. Sorm Location and Seasonality 6. Storm Severity 7. Storm Frequency and grouping 8. The design storm event
 1. Introduction Storms 2. The Impact of Storms on the coast 3. Storm types 4. Coastal Sectors 5. Sorm Location and Seasonality 6. Storm Severity 7. Storm Frequency and grouping 8. The design storm event
Modelling the effect of sea level rise on tropical cyclone storm surge impact
 21st International Congress on Modelling and Simulation, Gold Coast, Australia, 29 Nov to 4 Dec 2015 www.mssanz.org.au/modsim2015 Modelling the effect of sea level rise on tropical cyclone storm surge
Using Weather Pattern Analysis to Identify Periods of Heightened Coastal Flood Risk in the Medium to Long Range
 UEF 2017 - Storms Using Weather Pattern Analysis to Identify Periods of Heightened Coastal Flood Risk in the Medium to Long Range David Price (FFC) and Robert Neal (Met Office) Thursday 15 June The Flood
Hurricane Matthew. Life Threatening Flash Flooding Likely. National Weather Service Wilmington NC. Josh Weiss, Meteorologist
 Hurricane Matthew Life Threatening Flash Flooding Likely Threat Assessment for northeast South Carolina & southeast North Carolina National Weather Service Wilmington NC 630 PM EDT Friday October 7, 2016
Major Hurricane Matthew Briefing Situation Overview
 Major Hurricane Matthew Briefing Situation Overview At 5 p.m. Tuesday, Category 4 Hurricane Matthew was about 860 miles South-Southeast of Mayport, Florida, moving north around 10 mph. Maximum sustained
On the Frequency of the Great Floods of South East Queensland
 On the Frequency of the Great Floods of South East Queensland D.D.Hinde PhD, B.Eng., RPEQ dhinde@bigpond.com Key words: asset management, infrastructure, Brisbane floods, Gympie floods, Rockhampton floods,
Hurricane Matthew Life Threatening Flash Flooding Likely
 Hurricane Matthew Life Threatening Flash Flooding Likely Threat Assessment for northeast South Carolina & southeast North Carolina National Weather Service Wilmington NC 12 AM EDT Saturday October 8, 2016
8.1 Attachment 1: Ambient Weather Conditions at Jervoise Bay, Cockburn Sound
 8.1 Attachment 1: Ambient Weather Conditions at Jervoise Bay, Cockburn Sound Cockburn Sound is 20km south of the Perth-Fremantle area and has two features that are unique along Perth s metropolitan coast
HURRICANE HARVEY COE Navigation BRIEFING
 HURRICANE HARVEY COE Navigation BRIEFING 10:00 AM CDT Friday, August 25, 2017 NWSNewOrleans www.weather.gov/neworleans Situation Overview New Information Harvey continues to strengthen Max sustained winds
Hurricane Wilma Post Storm Data Acquisition Estimated Peak Wind Analysis and Storm Tide Data. December 27, 2005
 Hurricane Wilma Post Storm Data Acquisition Estimated Peak Wind Analysis and Storm Tide Data December 27, 2005 Hurricane Wilma was the sixth major hurricane of the record-breaking 2005 Atlantic hurricane
1.2 DEVELOPMENT OF THE NWS PROBABILISTIC EXTRA-TROPICAL STORM SURGE MODEL AND POST PROCESSING METHODOLOGY
 1.2 DEVELOPMENT OF THE NWS PROBABILISTIC EXTRA-TROPICAL STORM SURGE MODEL AND POST PROCESSING METHODOLOGY Huiqing Liu 1 and Arthur Taylor 2* 1. Ace Info Solutions, Reston, VA 2. NOAA / NWS / Science and
Real-time storm tide forecasting for emergency management in Queensland, Australia
 Real-time storm tide forecasting for emergency management in Queensland, Australia Dr Joanna M. Burston 1, Dr Andrew M. Symonds 1,2, and Prof Rodger Tomlinson 1 1 Griffith Centre for Coastal Management,
Tropical Update. 5 PM EDT Tuesday, September 5, 2017 Hurricane Irma, Tropical Storm Jose, and Tropical Depression Thirteen
 Tropical Update 5 PM EDT Tuesday, September 5, 2017 Hurricane Irma, Tropical Storm Jose, and Tropical Depression Thirteen This update is intended for government and emergency response officials, and is
Coastal Emergency Risks Assessment - CERA Real-Time Storm Surge and Wave Visualization Tool
 Coastal Emergency Risks Assessment - CERA Real-Time Storm Surge and Wave Visualization Tool Introduction This document provides guidance for using the Coastal Emergency Risks Assessment (CERA) visualization
SPATIAL CHARACTERISTICS OF THE SURFACE CIRCULATION AND WAVE CLIMATE USING HIGH-FREQUENCY RADAR
 SPATIAL CHARACTERISTICS OF THE SURFACE CIRCULATION AND WAVE CLIMATE USING HIGH-FREQUENCY RADAR Apisit Kongprom,Siriluk Prukpitikul, Varatip Buakaew, Watchara Kesdech, and Teerawat Suwanlertcharoen Geo-Informatics
Tropical Update. 5 AM EDT Wednesday, September 6, 2017 Hurricane Irma, Tropical Storm Jose, and Tropical Storm Katia
 Tropical Update 5 AM EDT Wednesday, September 6, 2017 Hurricane Irma, Tropical Storm Jose, and Tropical Storm Katia This update is intended for government and emergency response officials, and is provided
Hurricane Season 2010 & NOAA s Deepwater Response
 Hurricane Season 2010 & NOAA s Deepwater Response What s Happened? What Will 2010 Bring? Possible Shoreline Effects Darin Figurskey Meteorologist-in-Charge NOAA s NWS Raleigh, NC NOAA s National Weather
Tropical Update. 5 PM EDT Sunday, September 10, 2017 Hurricane Irma, Hurricane Jose, Tropical Wave (60%)
") Tropical Update 5 PM EDT Sunday, September 10, 2017 Hurricane Irma, Hurricane Jose, Tropical Wave (60%) This update is intended for government and emergency response officials, and is provided for informational
Tropical Update 5 PM EDT Sunday, September 10, 2017 Hurricane Irma, Hurricane Jose, Tropical Wave (60%) This update is intended for government and emergency response officials, and is provided for informational
HURRICANE JEANNE CHARACTERISTICS and STORM TIDE EVALUATION
 HURRICANE JEANNE CHARACTERISTICS and STORM TIDE EVALUATION ((DRAFT)) By Robert Wang and Michael Manausa Sponsored by Florida Department of Environmental Protection, Bureau of Beaches and Coastal Systems
Visualizing hurricanes
 Visualizing hurricanes NAME: DATE: Scientific visualization is an integral part of the process of simulating natural phenomena. In the computational sciences, the main goal is to understand the workings
West Florida Shelf and Tampa Bay Responses to Hurricane Irma: What Happened and Why
 West Florida Shelf and Tampa Bay Responses to Hurricane Irma: What Happened and Why R.H. Weisberg Y. Liu J. Chen College of Marine Science University of South Florida St. Petersburg, FL SECOORA Webinar
Rainfall declines over Queensland from and links to the Subtropical Ridge and the SAM
 Rainfall declines over Queensland from 1951-2007 and links to the Subtropical Ridge and the SAM D A Cottrill 1 and J Ribbe 2 1 Bureau of Meteorology, 700 Collins St, Docklands, Melbourne, Victoria, Australia.
Major Hurricane Matthew Briefing Situation Overview
 Major Hurricane Matthew Briefing Situation Overview THIS IS NOW A WORST CASE STORM SURGE SCENARIO Catastrophic Damage is Anticipated for Coastal Areas. Major Hurricane Matthew is still expected to move
Natural Disasters. in Florida. Severe Thunderstorms
 Natural Disasters in Florida SC.6.E.7.7 Investigate how natural disasters have affected human life in Florida. Severe Thunderstorms While the typical afternoon thunderstorm in Florida may not appear to
Hurricane Harvey: SE Texas Impacts. 10 AM CDT UPDATE Saturday, August 26, 2017 Prepared by: Dan Reilly, Brian Kyle
 Hurricane Harvey: SE Texas Impacts 10 AM CDT UPDATE Saturday, August 26, 2017 Prepared by: Dan Reilly, Brian Kyle Latest Observations and Radar Hurricane Harvey centered near Victoria and weakening Wind
Evacuation Alarm Using the Improved Magnitude Method to Damage Caused by Typhoon 9918
 ICHE 2014, Hamburg - Lehfeldt & Kopmann (eds) - 2014 Bundesanstalt für Wasserbau ISBN 978-3-939230-32-8 Evacuation Alarm Using the Improved Magnitude Method to Damage Caused by Typhoon 9918 R. Hashimura
Tropical Cyclone Megh
 Tropical Cyclone Megh 4-10 November 2015 NE Somalia and S Yemen Desert Locust Information Service FAO, Rome www.fao.org/ag/locusts Keith Cressman (Senior Locust Forecasting Officer) 04/11/2015 Tropical
Frank Revitte National Weather Service. Weather Forecast Office New Orleans/Baton Rouge
 Frank Revitte National Weather Service Weather Forecast Office New Orleans/Baton Rouge Above normal activity 17 Total Named Storms 7 Tropical Storms 4 Hurricanes 6 Major Hurricanes Not the most active,
TROPICAL STORM NATE BRIEFING
 TROPICAL STORM NATE BRIEFING 2:00 PM CDT Friday, October 06, 2017 Prepared by: NWS NWSNewOrleans www.weather.gov/neworleans Situation Overview Track forecast has not changed since the 10 am advisory. Hurricane
Tropical Update. 12 PM EDT Friday, October 7, 2016 Hurricane Matthew & Tropical Storm Nicole
 Tropical Update 12 PM EDT Friday, October 7, 2016 Hurricane Matthew & Tropical Storm Nicole This update is intended for government and emergency response officials, and is provided for informational and
Are You Ready For Hurricane Season? 2018 Hurricane Talk B Y : S T O R M T E A M 8 M E T E O R O L O G I S T J U L I E P H I L L I P S
 Are You Ready For Hurricane Season? 2018 Hurricane Talk B Y : S T O R M T E A M 8 M E T E O R O L O G I S T J U L I E P H I L L I P S About Me I am Currently a Weekday Meteorologist at WFLA Channel 8.
Navigating the Hurricane Highway Understanding Hurricanes With Google Earth
 Navigating the Hurricane Highway Understanding Hurricanes With Google Earth 2008 Amato Evan, Kelda Hutson, Steve Kluge, Lindsey Kropuenke, Margaret Mooney, and Joe Turk Images and data courtesy hurricanetracking.com,
Very Dangerous Coastal Storm Sandy October 28 th 31 st 2012
 Very Dangerous Coastal Storm Sandy October 28 th 31 st 2012 Prepared 600 PM EDT Monday October 29, 2012 Gary Szatkowski NOAA s NJ Forecast Office Weather.gov/phi Purpose of Briefing Briefing #11 for event
Promoting Resilience to Changing Weather
 Promoting Resilience to Changing Weather Harpswell Neck Harpswell Sound Orr s Island Basin Cove Pott s Point Harpswell Conservation Commission March 30, 2017 What Does This Mean for Harpswell? Topography
TROPICAL STORM NATE BRIEFING
 TROPICAL STORM NATE BRIEFING 10:30 AM CDT Friday, October 06, 2017 Prepared by: NWS NWSNewOrleans www.weather.gov/neworleans Situation Overview Track forecast has shifted slightly eastward. Hurricane Watch
Sea level variability: from surface gravity waves to mean sea level.
 Sea level variability: from surface gravity waves to mean sea level. Charitha Pattiaratchi, Sarath Wijeratne, Ivan Haigh +, Matt Eliot School of Civil, Environmental and Mining Engineering The UWA Oceans
Current Details from the National Hurricane Center (NHC)
") Current Watches and Warnings A Hurricane Warning is in effect from South Santee River, South Carolina (SC) to Duck, North Carolina (NC); Albemarle and Pamlico Sounds A Hurricane Watch is in effect from
Current Watches and Warnings A Hurricane Warning is in effect from South Santee River, South Carolina (SC) to Duck, North Carolina (NC); Albemarle and Pamlico Sounds A Hurricane Watch is in effect from
ERTH 365 Homework #2: Hurricane Harvey. 100 points
 ERTH 365 Homework #2: Hurricane Harvey 100 points Due by 6pm, Tuesday 30 October 2018, ELECTRONIC SUBMISSON BY EMAIL ONLY BY 6PM (send to klevey@sfsu.edu) (acceptable formats: MS Word, Google Doc, plain
Rising Sea Levels: Time for Proactive Action in Florida and the Caribbean?
 Rising Sea Levels: Time for Proactive Action in Florida and the Caribbean? Dr. Alan Fyall and Dr. Thomas Wahl National Center for Integrated Coastal Research, University of Central Florida Dr. Roberta
Tropical Update. 5 PM EDT Thursday, September 7, 2017 Hurricane Irma, Hurricane Jose, and Hurricane Katia
 Tropical Update 5 PM EDT Thursday, September 7, 2017 Hurricane Irma, Hurricane Jose, and Hurricane Katia This update is intended for government and emergency response officials, and is provided for informational
GLNG PROJECT - ENVIRONMENTAL IMPACT STATEMENT
 8 Management of Impacts J:\Jobs\42626220\07 Deliverables\EIS\FINAL for Public Release\8. Management of Impacts\8-2 Climate\08 02 Climate (Section 8.2) FINAL Public.doc GLNG Project - Environmental Impact
Australian Mean Sea Level Survey 2009 National Tidal Centre Bureau of Meteorology
 Australian Mean Sea Level Survey 2009 National Tidal Centre Bureau of Meteorology Summary There are 39 Australian locations where relative sea levels have been measured for at least 25 years. The average
ARCHIVE: Major Storm Surge Events, Eastern Gulf of Carpentaria,
 ARCHIVE: Major Storm Surge Events, Eastern Gulf of Carpentaria, 1964-1996 Tropical cyclones Dora (1964), Flora (1964), Fiona (1971), Dominic (1982), Felicity (1989) and Barry (1996) By Mr Jeff Callaghan
NOAA Inundation Dashboard
 NOAA Inundation Dashboard Audra Luscher & Paul Fanelli NOS Center for Operational Oceanographic Products & Services (CO-OPS) Hampton Roads Sea Level Rise/Flooding Adaptation Forum July 29, 2016 http://tidesandcurrents.noaa.gov/inundationdb/newyork.html
Experimental Probabilistic Hurricane Inundation Surge Height (PHISH) Guidance
 Guidance") Experimental Probabilistic Hurricane Inundation Surge Height (PHISH) Guidance DRBC Flood Advisory Committee John Kuhn - NWS/OCWWS Anne Myckow (NWS/MDL), Arthur Taylor (NWS/MDL) SLOSH Sea, Lake and Overland
Experimental Probabilistic Hurricane Inundation Surge Height (PHISH) Guidance DRBC Flood Advisory Committee John Kuhn - NWS/OCWWS Anne Myckow (NWS/MDL), Arthur Taylor (NWS/MDL) SLOSH Sea, Lake and Overland
RADAR Rainfall Calibration of Flood Models The Future for Catchment Hydrology? A Case Study of the Stanley River catchment in Moreton Bay, Qld
 RADAR Rainfall Calibration of Flood Models The Future for Catchment Hydrology? A Case Study of the Stanley River catchment in Moreton Bay, Qld A 1 Principal Engineer, Water Technology Pty Ltd, Brisbane,
LAND USE PLANNING AND RISK: LESSONS FROM THREE AUSTRALIAN PORT CITIES
 LAND USE PLANNING AND RISK: LESSONS FROM THREE AUSTRALIAN PORT CITIES Ken Granger Disaster Risk Scientist Slide No. 1 Land use planning is the single most important mitigation measure for limiting future
Coastal Storms of the New Jersey Shore
 Coastal Storms of the New Jersey Shore Dr. Steven G. Decker Dept. of Environmental Sciences School of Environmental and Biological Sciences Rutgers University May 25, 2011 Overview Threats Historical Examples
TROPICAL STORM HARVEY BRIEFING
 TROPICAL STORM HARVEY BRIEFING 10:00 AM CDT Sunday, August 27, 2017 Prepared by: NWS LIX NWSNewOrleans www.weather.gov/neworleans Situation Overview New Information Tropical Storm Winds 40mph Immediate
Using satellite altimetry and tide gauges for storm surge warning
 doi:10.5194/piahs-365-28-2015 28 Complex Interfaces Under Change: Sea River Groundwater Lake Proceedings of HP2/HP3, IAHS-IAPSO-IASPEI Assembly, Gothenburg, Sweden, July 2013 (IAHS Publ. 365, 2014). Using
Hurricane Sandy October 28 th 31 st 2012
 Hurricane Sandy October 28 th 31 st 2012 Prepared 530 PM EDT Saturday October 27, 2012 Gary Szatkowski NOAA s NJ Forecast Office Weather.gov/phi Purpose of Briefing Briefing #7 for event Promote situational
Responding to the 2016 and 2017 Mass Coral Bleaching events on the Great Barrier Reef: from Observations to Modelling
 Responding to the 2016 and 2017 Mass Coral Bleaching events on the Great Barrier Reef: from Observations to Modelling EMatson@aims Craig Steinberg & Claire Spillman N. Cantin, J. Benthuysen, H. Tonin,
Cause, Assessment & Management of Flood Hazards associated with Landfalling Tropical Cyclones & Heavy Rain
 Cause, Assessment & Management of Flood Hazards associated with Landfalling Tropical Cyclones & Heavy Rain by CHEN Charng Ning, Professor Emeritus Nanyang Technological University (NTU), Singapore Consultant,
Assessing Storm Tide Hazard for the North-West Coast of Australia using an Integrated High-Resolution Model System
 Assessing Storm Tide Hazard for the North-West Coast of Australia using an Integrated High-Resolution Model System J. Churchill, D. Taylor, J. Burston, J. Dent September 14, 2017, Presenter Jim Churchill
Improving global coastal inundation forecasting WMO Panel, UR2014, London, 2 July 2014
 Improving global coastal inundation forecasting WMO Panel, UR2014, London, 2 July 2014 Cyclone Sidr, November 2007 Hurricane Katrina, 2005 Prof. Kevin Horsburgh Head of marine physics, UK National Oceanography
Developed in Consultation with Florida Educators
 Developed in Consultation with Florida Educators Table of Contents Next Generation Sunshine State Standards Correlation Chart... 7 Benchmarks Chapter 1 The Practice of Science...................... 11
Tropical Update. 11 AM EDT Tuesday, October 9, 2018 Hurricane Michael, Tropical Storm Leslie, Tropical Storm Nadine
 Tropical Update 11 AM EDT Tuesday, October 9, 2018 Hurricane Michael, Tropical Storm Leslie, Tropical Storm Nadine This update is intended for government and emergency response officials, and is provided
Hurricane Matthew. National Weather Service Wilmington NC. Steven Pfaff, WCM.
 Hurricane Matthew Threat Assessment for northeast South Carolina & southeast North Carolina National Weather Service Wilmington NC 515 PM EDT Monday October 3, 2016 Steven Pfaff, WCM Steven.Pfaff@noaa.gov
Impact of Sea Level Rise on Future Storm-induced Coastal Inundation
 Impact of Sea Level Rise on Future Storm-induced Coastal Inundation Changsheng Chen School for Marine Science and Technology, University of Massachusetts-Dartmouth Email: c1chen@umassd.edu 04/14/2015 Outline
Coastal Storm Potential
 Coastal Storm Potential Event Date/Time: 11/12/2009-11/14/2009 Today through Saturday National Weather Service Newport/Morehead City, NC Date: 11/12/2009 1000 am Coastal Storm Remnants of Ida, coupled
HURRICANE IVAN CHARACTERISTICS and STORM TIDE EVALUATION
 HURRICANE IVAN CHARACTERISTICS and STORM TIDE EVALUATION By Robert Wang and Michael Manausa Sponsored by Florida Department of Environmental Protection, Bureau of Beaches and Coastal Systems Submitted
HURRICANES. Source:
 HURRICANES Source: http://www.dc.peachnet.edu/~pgore/students/w97/matheson/hpage.htm What is a hurricane? Violent cyclonic storm that develops in the tropical region Wind speeds are > 74 mph Source: http://www.google.com/imgres?hl=en&sa=x&biw=1920&bih=955&tbm=
Storm Summary for Hurricane Jose
 Storm Summary for Hurricane Jose Tuesday, September 19, 2017 at 11 AM EDT (Output from Hurrevac, based on National Hurricane Center Forecast Advisory #57) Jose is currently a Category 1 hurricane on the
What is a tsunami? Capital Regional District Tsunami Frequently Asked Questions (FAQ s) Tsunami (soo-nah-mee)
 Tsunami (soo-nah-mee)") Tsunami (soo-nah-mee) Tsunamis (Japanese translation harbour wave ) are waves with a great distance between crests, and are caused by any widespread, sudden movement of large volumes of water. The tsunami
Tsunami (soo-nah-mee) Tsunamis (Japanese translation harbour wave ) are waves with a great distance between crests, and are caused by any widespread, sudden movement of large volumes of water. The tsunami
Current Details from the National Hurricane Center (NHC)
") Current Watches and Warnings A Hurricane Warning is in effect from South Santee River, South Carolina (SC) to Duck, North Carolina (NC); Albemarle and Pamlico Sounds A Hurricane Watch is in effect from
Current Watches and Warnings A Hurricane Warning is in effect from South Santee River, South Carolina (SC) to Duck, North Carolina (NC); Albemarle and Pamlico Sounds A Hurricane Watch is in effect from
Hurricanes and Storm Surge : Before coming to lab, visit the following web site:
 Geol 108 Lab #7 Week of October 15-19, 2012 Coastal Studies Hurricanes and Storm Surge : Before coming to lab, visit the following web site: http://www.usatoday.com/graphics/weather/gra/gsurge/flash.htm
Storm Surge Forecast with Shifting Forecast Tracks
 Storm Surge Forecast with Shifting Forecast Tracks Storm Surge Findings in the Florida Keys Jon Rizzo Warning Coordination Meteorologist National Weather Service Florida Keys Florida Keys Life History