Submitted to Oxford University Press for publication ISBN
|
|
|
- Brianna Whitehead
- 5 years ago
- Views:
Transcription

1 Submitted to Oxford University Press for publication ISBN
2 3 Structure and Function of Chihuahuan Desert Ecosystem 1 Climate and Climatological Variations in the Jornada Basin John Wainwright The purpose of this chapter is to review the climatic data for the Jornada Basin over the period for which instrumental records exist. Over this time period, up to 83 years in the case of Jornada Experimental Range (JER), we can deduce both the long-term mean characteristics and variability on a range of different spatial and temporal scales. Shortterm variability is seen in individual rainstorms, whereas longer-term patterns are controlled spatially by factors such as large-scale circulation patterns and basin and regional orography and temporally by the large-scale fluctuations in atmospheric and oceanic circulation patterns. Variability can have significant impacts on the biogeography of a region (Neilson 1986) or its geomorphic processes (Cooke and Reeves 1976), which may set in motion a series of feedbacks, most important those referring to desertification (Schlesinger et al. 1990; Conley et al. 1992). Understanding the frequency and magnitude of such variability is therefore fundamental in explaining the observed landscape changes in areas such as the Jornada Basin. The Instrumental Climate Record of the Jornada Basin The patterns observed for different climatic variables within the available instrumental records for the Jornada Basin are defined in a hierarchical series of temporal scales, starting with the patterns that emerge from long-term average conditions and moving to seasonal and monthly, daily, and subdaily time scales. Two further analyses are made because of their potential importance to the hydrological and ecological characteristics of
3 2 the basin, namely, the occurrence of extreme rainfall events and of longer-term changes. The effects of El Niño events in controlling the rainfall over decadal time scales will be addressed in particular. Spatial variability is an additional important concern, especially when characterizing dryland areas such as the Jornada Basin, where spatial variability tends to be high. The overall climate of the basin can be defined according to the Köppen classification as being cool and arid, belonging to the midlatitude desert zone (BWk). However, interannual variability is important, and occasionally, the annual conditions are more characteristic of the semiarid steppe (BSk) zone. The higher rainfall rates in the higher altitudes of the basin are also more characteristic of semiarid conditions. Using the Thornthwaite approach, the basin is defined as arid (zone E) and only rarely crosses the threshold into semiarid in the higher altitudes. This spatial and temporal variability in classification probably explains the fact that previous overviews have placed the Jornada in both arid and semiarid zones. Description of Data Available for the Jornada Basin Instrumental climatic data for the Jornada Basin are available from these four sources: the Long-Term Ecological Research (LTER) project itself, the USDA JER, the New Mexico State University Chihuahuan Desert Rangeland Research Center (CDRRC), and the U.S. Geological Survey (USGS) (figure 3-1).
4 3 Fig Map of locations in the Jornada Basin at which climatic variables have been recorded. The LTER data principally derive from the recording area weather station and the rain gauge at the base of Summerford Mountain (lower left of figure 3-1), which started in 1983 and 1981, respectively. The USDA data set contains the largest series of records, and those extend back over the longest period of time. Rainfall and temperatures have been recorded at the JER headquarters continuously since June Monthly pan evaporation was also recorded between January 1953 and August Rainfall data have also been recorded as monthly totals collected at 33 rain gauges, as well as at the headquarters, of which 23 have a record longer than 50 years. Daily rainfall data have been recorded at 58 locations since 1976, although most of these data do not cover the
5 4 entire period since The CDRRC data are made up of monthly rainfall totals for 26 locations, the earliest being the CDRRC headquarters rain gauge, which was first operated in A number of these stations are discontinuous or have short records. The USGS data relate to the wind erosion project (described in chapter 9) in the central part of the basin and include daily records of temperature, precipitation, and wind speed since January Maximum rainfall intensities are recorded at a monthly level for durations of 15 minutes to 3 hours. This impressive quantity of data makes it possible to look at temporal changes for most of the 20 th century with a good temporal resolution for at least10 years. Spatial patterns are well represented over a50 year period in terms of monthly rainfall and over a 20 year period at a daily resolution. Comparisons of temperature and wind speed are much more restricted. Annual Patterns The long-term average rainfall for the Jornada headquarters between 1915 and 1995 is mm with a standard deviation of 85.0 mm (table 3-1). The coefficient of variation is 34.7%. The minimum recorded value for a complete year is 77.0 mm, which occurred in 1953, with the maximum of mm falling in The average annual temperature between 1915 and 1993 is C with a standard deviation of 0.58 C. The minimum average annual temperature was C in 1987, and the maximum average annual temperature of C occurred in As already noted, measurements of evaporation were made over a shorter time period, between 1953 and 1979, with values ranging from
6 5 Table 3-1. Long-term ( ) averages, minimums, and maximums for precipitation (P), ambient air temperature, potential evaporation (PE), and moisture balance (PE-P) as recorded at the instrumented station at the Jornada Experimental Range headquarters. Jan Feb Mar Apr May Jun Jul Aug Sep Oct Nov Dec Annual precipitation mm average std dev std err minimum median maximum average temperature C average std dev std err minimum median maximum minimum temperature C average std dev std err minimum median maximum maximum temperature C average std dev std err minimum median maximum Evaporation mm average std dev std err minimum median maximum moisture balance mm average std dev std err minimum median maximum
7 1,565.2 mm (1976) to 2,832.6 mm (1971) and with a mean value of 2,204.1 mm and a 6 standard deviation of mm. There is a high interannual variability, particularly of rainfall and potential evaporation. On the annual time scale, there is always a large moisture deficit (evaporation minus precipitation) averaging 1,960.3 mm. Comparisons with other sites in the basin are only possible with rainfall data. Because of the temporal variability, it is not possible to use all the available rain gauges to carry out this analysis. Thus, long series of data are derived from 37 sites for which there exist more than 30 years of data from the period since For those sites within this series that have longer sequences, there appear to be no significant differences between the total sequence and the sequence after Shorter sequences commencing after 1947 show an increasing divergence from the long-term values, and thus the sample cannot be assumed to be comparable. The average annual rainfall for these sites is mm, which is close to the Jornada headquarters value of mm since 1947 (compared to mm for ). However, this average is made up of values ranging from mm to mm. Similarly, the values of the coefficient of variation range from 24.8% to 43.1%, with a median value of 36.5% (compare with 34.7% for Jornada headquarters). The variability is largely due to the altitude of the rain gauge (figure 3-2a d). For example, the highest rainfall (348.9 mm) is recorded from the Rope Springs gauge (see figure 3-1 for gauge name and location) at an altitude of 1,725 m in the San Andres Mountains. Linear regression analysis shows that 77% of the variance in annual average rainfall is controlled by altitude. However, there is a great deal of scatter due to


8 7 Fig Monthly distributions of precipitation in the Jornada Basin: a. January-March; b. April- June; c. July-September; d. October-December.

9 8
10 two locational factors: (1) a general gradient of higher rainfall in the south of the basin, 9 and (2) an increase away from the central north south axis of the basin. Incorporating these two variables gives a general model for basin annual average rainfall since 1947 of <EQ>(3-1) r = 3, z y d m,</eq> where r is mean annual rainfall (mm), z is altitude (m), y is the UTM northing (m), and d m is the absolute distance from the medial N S axis of the basin (m) in which 4.5% of the variance is explained by y and 2.7% by d m. Similarly, there is a tendency for the variability of the annual average rainfall to increase with altitude, although this is countered by a decrease with distance from the north south axis of the basin. This relationship is described by <EQ>(3-2) sd r = z d m </EQ> in which sd r is the standard deviation of the annual average rainfall (mm). The total variance explained by this relationship is 47.3%, of which 39.4% is explained by variations in altitude. It is likely that these relationships reflect the orographic control of the San Andres Mountains (right side of figure 3-1) on rainfall and the distance from the source of the rainfall (i.e., from the Gulf of Mexico). It is possible that the decrease in rainfall and its variability reflects a vegetation feedback on precipitation with the bare central areas of the basin leading to more atmospheric uplift. Associated convective rainfall activity might then be reflected in the decreasing variability away from the center of the basin. Monthly and Seasonal Patterns Within the annual patterns described, there are important variations at the monthly and seasonal level. The Jornada headquarters data show a peak in rainfall between July and
11 October, the maximum being in August, with a much smaller secondary peak in 10 November to February (table 3-1). This seasonality is related to the different source of rainfall. In the summer months, rainfall is monsoonal in origin with moisture derived from the Gulf of Mexico. These months are characterized by thunderstorm activity, which frequently leads to relatively large precipitation events in the basin. The rainfall in the winter months tends to be more frontal in character, and moisture largely comes from the Pacific coast. Therefore, both because of the lower intensity rainfall and the greater rain shadow effect, rainfall tends to be lower in total. There is important variability in the monthly totals with minimum values of zero in all but July and August. Maximum monthly rainfalls exceeding 100 mm have been recorded in July, August, September, and December. The maximum recorded monthly rainfall was mm, which occurred in August Average temperatures are at their lowest in January with a mean value of 3.78 C. The lowest recorded value of 0.61 C occurred in January 1919, whereas the following January the average temperature reached its maximum of 8.33 C. Apart from the month of March, the first six months of the year tend to show greater variability, which is seen not in the standard deviation but in the recorded extremes. Peak average monthly temperatures occur in July when the average is C, with a minimum recorded value of C (1962) and a maximum of C (1951). Minimum and maximum temperatures follow the same cycle. Average January minimum temperatures are 5.99 C, the lowest recorded value being C in Indeed, on only one occasion since 1915 has the January minimum temperature averaged above freezing. That was in 1916 when the value of 0.08 C was recorded. Maximum daytime temperatures average
12 13.5 C in January with a range from 6.61 C (1919) to C (1920) and rise to an 11 average of C in July. The coldest July on record was in 1916, when the maximum daytime temperature only reached C, and the warmest July saw mean daytime temperatures of C in Minimum temperatures peak at C in July, although the observed range of values is from C (1963) to C (1935). The onset of frosts starts on average on October 22, although dates as early as September 14 (1959) and as late as December 1 (1932) have been recorded. There is a similar variability in the last frost of the year. The average date is April 29, the earliest date is March 20 (1990), and the latest is June 10 (1963). The average period with frosts (i.e., the length of time between the first frost in one year and the last frost the next) is 188 days, although the range of values recorded varies from 145 ( ) to 244 ( ). The actual number of days with frost per year is again somewhat shorter, averaging 128 days, but again with a wide range from 97 ( ) to 186 days ( ). There is a weak linear correlation between the length of the period with frosts and the actual number of days with frost (r = 0.49). Measured evaporation rates range from a minimum average of mm in December (with a range from zero in 1975 and 1977) to a maximum of mm in Evaporation rises rapidly in the first half of the year, peaking at average figure of mm in June, before falling more slowly in the second half of the year. Evaporation thus peaks before either temperature or rainfall. June values range from a minimum of mm recorded in 1976 to a maximum of mm two years previously in However the maximum recorded value is mm, which occurred in May Patterns of moisture balance generally follow the trend in
13 evaporation because this variable dominates over precipitation. On the other hand, the 12 decrease in the deficit in July to August is more marked than the decrease in evaporation because of the high summer rainfall. Only the months of November to February have recorded positive moisture balances, the maximum being 40.9 mm in December A positive water balance only occurred for seven months in the recording period from January 1953 to August Wind patterns have only been recorded over much shorter periods. At the USGS site (5.9 km southwest of Jornada headquarters), daily records have been analyzed for the period from January 1990 to August 1996 to give monthly summaries. Average monthly wind speeds are highest in April with a value of 12.4 km/h, declining to a value of 7.9 km/h in August (figure 3-3). There is a second maximum of 8.8 km/h in November. The least windy month is December, when the average velocity is 7.6 km/h. In terms of the average peak gust, there is a less well-defined annual pattern, although peaks occur in April (78.6 km/h) and July (78.8 km/h). Thus the summer months have lower average wind speeds, but they have important gusts, usually relating to local atmospheric convection in the afternoons, leading to the characteristic dust devils, which can commonly be seen tracking along the center of the basin. The dominant direction of the
14 13 Fig Comparison of average wind speed as recorded at the Long Term Ecological Research (LTER) weather station ( ) and the US Geological Service (USGS) weather station ( ). peaks gusts is from the WSW, which occurs in seven months from the end of October through May. January and April have similar directions with peaks arriving from the west and southwest, respectively. In the summer months the direction shifts distinctly so there is no dominant wind direction throughout the month of July. These shifts are due to the onset of monsoonal activity derived from the Gulf of Mexico.
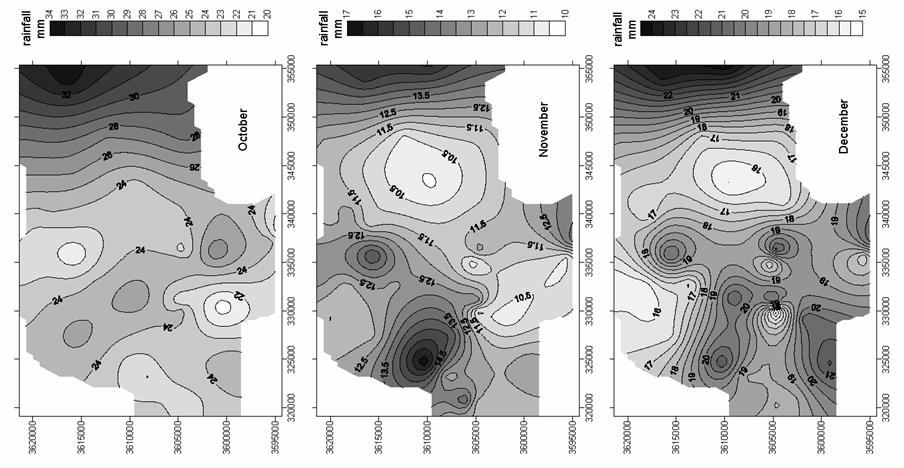
15 14 For the shorter time period between 1983 and 1997, the LTER weather station on the Summerford Mountain bajada presented a more detailed record of climate (see data sets available online at Temperature patterns illustrate that dew temperatures are rarely reached, and the soil temperature at a depth of 5 cm lies midway between the average and maximum air temperature. Wind velocities show a major peak between March and June and a smaller peak in November. Relative humidity decreases during the early part of the year to a minimum in June, when the average minimum is 13.5% and the average maximum 45.6%. Relative humidity then increases rapidly during the onset of the monsoonal season, reaching a peak in August. The minimum values stay relatively constant until reaching a peak with the winter rainfall season in December (average 35.9%). The maximum values decline over the same period but again rise in December (average 75.7%). Solar radiation is asymmetrically distributed through the year, rising rapidly to a peak value in May (671.1 MJ/m 2 ) and then declining more slowly to a minimum in December (244.5 MJ/m 2 ). The average annual solar radiation received at the LTER weather station is 6,250.1 MJ/m 2. Spatial Patterns Spatial patterns of monthly rainfall can be reconstructed for the Jornada Basin using 37 gauges. At the monthly time scale, most months show spatial patterns similar to those described for the annual time scale. However, there are some notable variations (figure 3-2a d). There are greater altitudinal gradients in the months of July and August compared to the other months. Higher rainfall occurs locally in the west and central parts of the basin in November and December, whereas in May, June, and October there are central
16 bands of higher rainfall trending either north south or northwest southeast. There is a 15 localized peak in rainfall to the north of Summerford Mountain in February, May, and December. These different patterns probably reflect the different orographic effects of the different mountain ranges surrounding the basin, as they affect moisture arriving in the basin from difference sources. Semivariograms of the monthly and seasonal patterns follow a Gaussian pattern with semivariance generally increasing rapidly beyond a lag distance of around 20 km. The spatial variability of temperatures can be seen with reference to the LTER, Jornada headquarters, and USGS weather station data (figure 3-4). There is a consistent ordering of the average monthly temperatures, with the highest values at the LTER weather station, followed by the USGS, and the lowest values at Jornada headquarters. Temperatures at the LTER site are between 0.4 C and 2.8 C warmer than at the USGS site, which is in turn between 0.3 C and 1.5 C warmer than at Jornada headquarters. These patterns relate to the fact that minimum monthly temperatures are much higher at the LTER site than the other two ( C warmer than USGS and C warmer than JER headquarters). The LTER weather station has the lowest maximum temperatures of the three locations in every month except May ( C cooler than USGS and 1.1 C cooler to 0.1 C warmer than Jornada headquarters), and there tends to be less diurnal variability at the LTER site. Wind data can be compared between the LTER and USGS weather stations, although due to differences in the way these data are recorded, the comparison is limited to average wind speeds. The average wind speed
17 16 Fig Comparisons of temperature records at the Long Term Ecological Research (LTER), US Geological Service (USGS) and Jornada Experimental Range (JER) headquarters weather stations: a. average monthly temperature; b. minimum monthly temperature; and c. maximum monthly temperature.
18 17 tends to be higher at the LTER weather station between the months of June and January (figure 3-3). The change in June coincides with the change from the modal direction at the LTER weather station from SSW to S, although the modal direction reverts to SSW in October. In a number of climate variables, but most dominantly precipitation, there is a major shift in the climatic character of the basin for June through September, associated with the onset and development of the summer monsoonal system. For example, at the JER headquarters, on average, 61% of the annual rainfall occurs in these summer months. Precipitation increases and a change in the dominant wind direction are associated with changes in the other variables observed. Thus, a bipartite division of the Jornada climate has been made, with summer conditions relating to the June through September period and winter conditions referring to the October through May period. The difference in rainfall between these periods is clearly marked in terms of quantity of rainfall and, to a lesser extent, in terms of rainfall variability (figures 3-5a and 3-5b). This division contrasts with that of Conley et al. (1992) who used a tripartite division of winter (November March), spring (April June), and summer (July October). Although this allows more detail for the winter period, it is thought that this is of little significance in terms of application to understanding plant growth patterns (Reynolds et al. 1999b). Daily Patterns Specific daily climatic patterns of interest include distributions of rainfall events, diurnal ranges of temperature, and relative humidity. The occurrence of extreme rainfall events

19 18 Fig Seasonal patterns of precipitation in the Jornada Basin: a. summer (June-September); and b. winter (October- May).
20 and their spatial and temporal distributions will be considered separately in the next 19 section. The mean number of rain days recorded at Jornada Experimental Range headquarters is 42.6, and at the LTER weather station the value is These values are predominantly composed of rain days in July and August during the peak of the monsoon. The winter peak in rainfall is dominated by the three to five rain days in December and January, with a steady decline until the minimum in April. Across the basin, the number of rain days ranges from a minimum of 41.6 to a maximum of 51.1 (median 45.2). The spatial pattern of the number of rain days is different from that of the annual average rainfall, with higher values occurring on the higher ground to the north, northeast, and southwest and the lowest values in the north-central and southeastern parts of the basin. The seasonal number of rain days does not differ substantially between summer with a minimum if 21.3, median of 23.4, and maximum of 29.1 across the basin and winter minimum 19.7, median 21.2, maximum This pattern reflects the typically much lower intensity event in the winter months. An important parameter of rainfall is its persistence (table 3-2). Where runoff production, sediment transport, or plant growth are involved, the occurrence of repeated rainfall events can be significant. Conversely, the persistence of days without rain can signal drought conditions. One way of observing such persistence is to calculate Markov transition probabilities for the occurrence of days with rain followed by a second day of rain, and similarly for days without rain followed by a second day without rain. Higher orders of persistence can be observed by repeating the calculation for three successive days, and so on.
21 20 Table 3-2. Measured and predicted probabilities for the Jornada Experimental Range (JER) headquarters and the Jornada Basin Long-Term Ecological Research (LTER) weather station locations for persistence (successive days) of 2, 3, or 4 successive dry days (dd, ddd, or dddd, respectively) or 2, 3, or 4 successive days with precipitation (ww, www, or wwww, respectively). Measured probabilities Predicted probabilities annual summer winter annual summer winter Location p dd p ww p dd p ww p dd p ww JER HQ LTER p ddd p www p ddd p www p ddd p www p ddd p www p ddd p www p ddd p www JER HQ LTER p dddd p wwww p dddd p wwww p dddd p wwww p dddd p wwww p dddd p wwww p dddd p wwww JER HQ LTER The probability for two successive wet days at the annual level is 0.04 at the Jornada headquarters and 0.05 at the LTER weather station, whereas the respective probabilities for two successive dry days are 0.76 and At the seasonal level, the wet-wet probability increases in the summer months to 0.06 at the Jornada headquarters and 0.08 at the LTER weather station. In other words, as might be expected, there is much greater persistence of dry than wet periods. The annual probability of three successive wet days is at the Jornada headquarters and at the LTER weather station. Based on the probabilities for two successive dry days, we can calculate the probability of having three successive events by chance, assuming independence of events. This probability is simply the square of the first probability. The calculated probabilities are for the Jornada headquarters and at the LTER weather station. The fact that these are lower than the measured transition probabilities suggests much stronger persistence of wet episodes. Extending this analysis to four successive wet days gives predicted probabilities of for the Jornada headquarters and at the LTER weather
22 21 station compared to measured transition probabilities of and , respectively. Repeating this analysis for sequences of dry periods and for both wet and dry periods according to season shows a similar result, except for the sequences of dry periods in winter. Thus persistence is a feature of both dry and wet periods. This conclusion contrasts with the results of Chin (1977) who suggested that rainfall at El Paso, Texas, 80 km to the south, was only first-order dependent in summer and second-order dependent in winter. An additional difference is seen in comparing persistence at different temporal scales. Whereas persistence seems to be an important feature at the daily scale, it has already been seen to be far less significant at an interannual scale. The intensity of rainfall is significant in producing runoff and therefore in its role in distributing water through the basin catchment. Relative to soil infiltration rates, the rainfall intensity determines the extent of runoff during rainfall events of the same magnitude. Because most rainfall events at Jornada last for much less than one day due to their convective nature, daily rainfall data do not give good estimates of rainfall intensities. Data that can provide a better indication occur at the LTER weather station, where hourly intensities have been recorded since 1992, and at several tipping-bucket rain gauges employed within the LTER project. Peak intensities for time periods between 5 and 180 minutes are also included in the USGS summaries on a monthly basis. The majority of events (55%) recorded at the LTER weather station last for an hour or less, with an exponential decline in the length of event. The mean event is 2 hours long. The longest event took place in 1994, when 19.8 mm of rain fell in 19 hours between 1000 on December 5 and 0500 on December 6. The median hourly rainfall intensity is 0.76 mm/h, with an average of 1.7 mm/h. The maximum value of 25.2 mm/h
23 fell at 1900 on July 24, 1992, although this may be an underestimate of the true peak 22 intensity as this whole event took place within a single hour. Data from three tipping-bucket rain gauges also show an exponential decline in intensities (figure 3-6). Fig Rainfall intensities recorded at three tipping-bucket raingauges (Termite plots, S flume, and N flume) on Long Term Ecological Research (LTER) sites on the Summerford Mountain bajada, compared with hourly intensities as recorded at the LTER Weather Station (LTER WS). Maximum intensities recording by the tipping-bucket gauges are mm/h, although this intensity was only maintained for 1 minute (on two occasions, June 26 and September 14, 1996). During the June 26 event, the peak 5-minute intensity was mm/h; the peak 10-minute intensity, 75.3 mm/h; the peak 30-minute intensity, 48.2 mm/h; and the peak hourly intensity, 36.3 mm/h. The September 14 event had corresponding 5-, 10-, 30-minute, and hourly values of 82.3 mm/h, 50.6 mm/h, 40.3 mm/h, and 38.6 mm/h, respectively. These values compare with the maximum recorded hourly rainfall at LTER weather station, which is 25.2 mm/h. Diurnal temperature ranges have been calculated for the long sequence at the Jornada headquarters ( ), as well as for the shorter LTER weather station (1983
24 23 97) and USGS ( ) sites. On average, the LTER weather station diurnal range is 14.6 C, which is significantly lower than either the Jornada headquarters (20.0 C) or the USGS (20.1 C) sites. A similar difference is also noted for monthly averages. The most likely explanation for this difference is the more exposed location of the Jornada and USGS sites toward the central part of the basin. In all cases, there is a seasonal pattern with low values in December and January, an increase to May or June, followed by a decrease to the annual minimum in August, with a second cycle peaking in October. The diurnal range of relative humidity at the LTER weather station shows a single oscillation through the year, with a rapid rise to a peak corresponding to the onset of the monsoonal rains, followed by a more gradual decrease. Low ranges are typically recorded for the months of April to June after the end of the main winter rains, although in certain years, such as 1992, high values have been recorded in May. Occurrence of Extreme Events Maximum daily rainfall shows significant variation through the basin (figure 3-7). For those sites with data for 10 years or more, the maximum recorded values range from 47 mm to 105 mm. There is no significant relationship between the maximum daily rainfall and the mean average rainfall (r = 0.19, p = 0.29), or with the altitude of the rain gauge (r = 0.17, p = 0.35). The larger recorded events seem to cluster around the central, northwestern, and southeastern part of the basin. Intensity-duration-frequency values demonstrate the importance of relatively frequent high-intensity rainfalls, albeit lasting for relatively short periods (table 3-3).
 of precipitation events observed for different storm durations over different time intervals (years).")
25 24 Fig Patterns of daily rainfall throughout the Jornada Basin. Patterns are displayed within the UTM grid. Table 3-3. Intensity (mm/h) of precipitation events observed for different storm durations over different time intervals (years). storm rainfall intensity in mm/h for given return interval duration 2 year 5 year 10 year 25 year 50 year 100 year 5 min min min min min hr hr Values based directly on Miller et al. (1973) and should be considered as underestimates. Values derived from Jornada Basin LTER weather station data using Chen (1983) method, but may still be underestimates due to the length of available record. Because of the convective character of the rainfall, these high intensities are rarely sustained for more than 30 minutes. Because only hourly data were available for
26 25 short time periods from the LTER weather station, it was not possible to carry out a more detailed analysis for the Jornada Basin itself, beyond that proposed by the National Oceanographic and Atmospheric Administration (NOAA) (Miller et al. 1973). A comparison for short return periods using the method of Chen (1983 a ) showed a correspondence with the figures given in Miller et al. (1973) for return periods of less than 10 years, so in these cases the LTER figures are presented. However, because of extrapolation from a short data set, the intensity of the lower frequency events was lower, and other means were used to estimate these values. Return periods for daily rainfall have also been calculated, using standard Gumbel analysis, for each of the daily rain gauges in the basin to explore spatial patterns of large events. Daily rainfall within the basin varies between 27.5 and 38.5 mm for a 2-year return period, between 35.8 and 57.6 mm for a 5-year return period, between 41.3 and 70.2 mm for a 10-year return period, between 47.2 and 87.4 mm for a 25-year return period, between 51.5 and mm for a 50-year return period, and between 55.8 and mm for a 100-year return period. Three peaks of generally higher rainfall tend to appear in these calculations in the northwest, southwest, and southeast of the basin area studied. There is a relatively complex pattern in the central part of the basin, which varies according to the length of the return period, although this may, in part, be due to the generally shorter record lengths (albeit > 10 years) of the gauges in this part of the basin. A sample of extreme events was selected by examining the rainfall across the basin for the largest recorded event at each rain gauge. The spatial pattern of these events can be divided into three broad groups. First, there are a small number of events that have a Chen 1983 not found in References. Please add it. (Added)
27 a single center but may be more or less continuous across the basin. The maximum 26 rainfall at the center of these events may still be large, for example the event of July 4, 1988, when mm of rain was recorded at the Middle Well and Red Lake gauges. Only 3 out of 32 of the sampled events fell into this category. Second, there are 11 events that have multiple centers but that have a discontinuous cover over the basin. The third type contains multiple cells that cover the entire basin and makes up the majority of the sampled storm events (17 out of 32). There appears to be no correlation with the type of extreme event and the time within the monsoonal season at which it occurred in the chosen sample. There are, on the other hand, a significant number of events where the third pattern occurred outside the main monsoonal season (e.g., May 3, 1980; April 29, 1981; December 9, 1982; November 2, 1983; November 2, 1986; and, May 22, 1992), producing significant rainfalls. Longer Term Changes and the Effects of El Niño and Other Large-Scale Atmospheric Phenomena The analysis of the longer term records from the Jornada Basin to observe any significant trends through time is composed of two parts. First, the records are assessed for any statistically significant patterns that may relate to climatic variability or change at moderate to long time scales. Second, the records are subdivided to allow the impact of El Niño events to be assessed. For the most part, these analyses have been carried out at the annual and seasonal level. Conley et al. (1992) used regression and autocorrelation analysis to examine trends in the rainfall and temperature at the Jornada headquarters station as well as nearby sites in Las Cruces. They found no significant linear or quadratic trends for the annual
28 precipitation data ( ) but a significant quadratic relationship for mean 27 temperature. Analyses for trends have been carried out in the same way here, except that the sequence of data are now extended to cover the period until 1996; the minimum, maximum, and average annual temperatures have been analyzed separately; and the evaporation data from have also been analyzed (table 3-4). Outliers have not been ignored, as in the analysis of Conley et al. (1992), but years for which data are incomplete (which is often the cause of major outliers) have been excluded from the analysis. The average temperature data at the Jornada headquarters station show significant linear, quadratic, and quartic trends; however, the implications of the different models are important. The linear model describes a general decrease of the average temperature of C per year, whereas the quadratic model shows a slight increase of temperature from 1914 to around 1940, when a more rapid decrease takes place. On the other hand, the third-order polynomial model shows a similar but more rapid increase in the earlier time period followed by a more gradual decrease until the mid-1980s when the trend starts to reverse A similar general pattern is observable with the average minimum temperature, albeit with a much stronger upturn since the mid-1970s. In the case of average maximum temperatures, only the quadratic and third-order models are significant, both of which suggest a general increase in the first half of the century followed by a subsequent marked decrease. Annual average precipitation seems to increase slightly over the period (figure 3-8a).
29 28 Table 3-4. Results of regression analyses of long-term records from the Jornada Experimental Range headquarters for temperature, precipitation, evaporation, and frost days. Results are graphed in Fig. 3-8, 3-9, and Variable constant year year 2 year 3 year 4 r 2 p Average Annual temperature average minimum temperature average maximum temperature average Annual precipitation average summer precipitation average Winter precipitation average Annual evaporation first frost day last frost day number of frost days
30 29 Figure 3-8. Trends in temperature data from Jornada (headquarters): (a) average annual; (b) average summer (June-September); and (c) average winter (October-May).
31 30 Subdivision into summer and winter precipitation suggests that both summer and, more recently, winter precipitation have contributed to this increase (figure 3-8b and 3-8c). The results of these analyses suggest that the period of drought experienced in the 1930s was a result of higher temperatures, but the drought of the 1950s was in response to lower precipitation levels. Evaporation shows a strong oscillation and thus only shows significant trends with third- and fourth-order polynomials (figure 3-9). Figure 3-9. Trends in evaporation data from JER headquarters The monthly trends in evaporation show the oscillation occurred in all months, albeit more markedly in April to June and September to December. It is likely that the oscillation is a function of two factors, the generally lower minimum temperatures in the years just before and after 1960 and followed by an increase around 1970 and, to a lesser extent, the slight increase in maximum temperatures during the latter period. There is no significant trend in the day of the occurrence of the first frost, but both the date of the last frost and the total number of frost days show similar patterns. Linear models suggest continuous increases in frost occurrence (i.e., longer periods with frost with more frost
32 days), but higher order models suggest an increase until the mid-1960s followed by a 31 subsequent decrease (figure 3-10a c). Fig Trends in frost-day data from (JER) headquarters (a) Julian day of first frost; (b) Julian day of last frost; and (c) number of days with frost.
33 32 Removing the linear trend from each of these sequences allows analysis of higher frequency changes using Fourier analysis. The average temperature shows spectral peaks at periods greater than 40 years (supporting the existence of the longer term oscillations shown by the regression analysis), as well as between 11 and 20 years. There are a number of strong peaks at periods of between two and five years. The minimum and maximum temperature signals are similar, except that both have a relatively stronger long-term cyclicity compared to the year peaks. The minimum temperature signal shows no two-year cyclicity but has an extra peak at seven years, whereas the maximum temperature has an extra peak at around nine years. The annual precipitation has a strong spectral response through its range, although decomposition into the summer and winter rainfall suggests this is due to the interplay of seasonal factors that occur at difference frequencies. The summer rainfall shows stronger peaks at frequencies of around 3, 6, 12, and 30 years. As well as the 3- and 6-year signals, the winter rainfall has a stronger response at 7, 9, and 18 years, as well as over periods of more than 40 years (again supporting the regression analysis). The three- and six-year cycles may relate to the El Niño phenomenon (see further analysis to follow). Persistence in these sequences was also tested by means of runs tests, but only the strong oscillation in the evaporation data showed any significant persistence at the 95% confidence level. It is also interesting to compare long-term trends in the precipitation at other sites in the basin for which there are long data records. A total of 28 gauges, including the Jornada headquarters, were selected for this analysis on the basis of having data series starting before 1940, with more than 40 years of total records. Of these sites, 14 had
34 significant linear trends, 19 significant quadratic trends, and 21 significant third-order 33 polynomial trends at a 95% confidence level (table 3-5).
35 Table 3-5. Long-term (>40 years) trends in annual precipitation for 28 permanent recording stations in the Jornada Basin. constant year year2 year3 r 2 p Antelope Aristida Ash Canyon Brown Tank Co-op Well Dona Ana Headquarters Mesquite Middle Well New Well Rabbit Ragged Tank Red Lake Restoration Road Tank Rope Springs Sand Hill South Well Stuart Well Taylor Well West Well Yucca Pasture 15N Pasture 15S Exclosure Camp Well
36 constant year year2 year3 r 2 p College Ranch Headquarters Parker Heights Exclosure Selden Well The linear trend is always positive. Only the areas in the southern, north-central, and eastern portions of the basin show significant linear trends, although there is no clear spatial pattern. Quadratic trends reinforce the pattern from Jornada headquarters, suggesting an increase in the rate of change in recent years. Third-order polynomial trends suggest a different pattern, in that only the Rope Springs gauge follows the same trend as Jornada headquarters, whereas all of the other gauges suggest an oscillation, with rainfall decreasing until the mid-1950s, increasing until the mid-1980s, and decreasing again thereafter. These results suggest that although there are general patterns of longterm variability in the rainfall data, the trends have a complex spatial pattern. Again, the linear trend was removed from these rainfall sequences to observe whether any shorter term oscillations are present. The results obtained show strong spatial variability in these data. Oscillations on a 3-year cycle are the most common, followed by the 64-year cycle, then the 16, the 6, the 9, and the 32. The 2-, 11-, and 13- year cycles are the least well represented. Only 7 out of the 26 available gauges showed a significant persistence in annual rainfall using a runs test. Although these gauges are located for the main part on the edge of the central part of the basin, again there is no definite spatial pattern. Observation of these series suggests that the main pattern of persistence is the period starting about 1943 or, more usually, 1945 and continuing until
Chiang Rai Province CC Threat overview AAS1109 Mekong ARCC
 Chiang Rai Province CC Threat overview AAS1109 Mekong ARCC This threat overview relies on projections of future climate change in the Mekong Basin for the period 2045-2069 compared to a baseline of 1980-2005.
The Climate of Bryan County
 The Climate of Bryan County Bryan County is part of the Crosstimbers throughout most of the county. The extreme eastern portions of Bryan County are part of the Cypress Swamp and Forest. Average annual
The Climate of Murray County
 The Climate of Murray County Murray County is part of the Crosstimbers. This region is a transition between prairies and the mountains of southeastern Oklahoma. Average annual precipitation ranges from
The Climate of Marshall County
 The Climate of Marshall County Marshall County is part of the Crosstimbers. This region is a transition region from the Central Great Plains to the more irregular terrain of southeastern Oklahoma. Average
Presentation Overview. Southwestern Climate: Past, present and future. Global Energy Balance. What is climate?
 Southwestern Climate: Past, present and future Mike Crimmins Climate Science Extension Specialist Dept. of Soil, Water, & Env. Science & Arizona Cooperative Extension The University of Arizona Presentation
The Climate of Seminole County
 The Climate of Seminole County Seminole County is part of the Crosstimbers. This region is a transition region from the Central Great Plains to the more irregular terrain of southeastern Oklahoma. Average
The Climate of Payne County
 The Climate of Payne County Payne County is part of the Central Great Plains in the west, encompassing some of the best agricultural land in Oklahoma. Payne County is also part of the Crosstimbers in the
The Climate of Haskell County
 The Climate of Haskell County Haskell County is part of the Hardwood Forest. The Hardwood Forest is characterized by its irregular landscape and the largest lake in Oklahoma, Lake Eufaula. Average annual
The Climate of Texas County
 The Climate of Texas County Texas County is part of the Western High Plains in the north and west and the Southwestern Tablelands in the east. The Western High Plains are characterized by abundant cropland
The Climate of Kiowa County
 The Climate of Kiowa County Kiowa County is part of the Central Great Plains, encompassing some of the best agricultural land in Oklahoma. Average annual precipitation ranges from about 24 inches in northwestern
Monthly Long Range Weather Commentary Issued: February 15, 2015 Steven A. Root, CCM, President/CEO
 Monthly Long Range Weather Commentary Issued: February 15, 2015 Steven A. Root, CCM, President/CEO sroot@weatherbank.com JANUARY 2015 Climate Highlights The Month in Review During January, the average
The Climate of Pontotoc County
 The Climate of Pontotoc County Pontotoc County is part of the Crosstimbers. This region is a transition region from the Central Great Plains to the more irregular terrain of southeast Oklahoma. Average
Champaign-Urbana 2000 Annual Weather Summary
 Champaign-Urbana 2000 Annual Weather Summary ILLINOIS STATE WATER SURVEY 2204 Griffith Dr. Champaign, IL 61820 wxobsrvr@sws.uiuc.edu Maria Peters, Weather Observer January: January started on a mild note,
Table of Contents. Page
 Eighteen Years (1990 2007) of Climatological Data on NMSU s Corona Range and Livestock Research Center Research Report 761 L. Allen Torell, Kirk C. McDaniel, Shad Cox, Suman Majumdar 1 Agricultural Experiment
Chapter outline. Reference 12/13/2016
 Chapter 2. observation CC EST 5103 Climate Change Science Rezaul Karim Environmental Science & Technology Jessore University of science & Technology Chapter outline Temperature in the instrumental record
Champaign-Urbana 2001 Annual Weather Summary
 Champaign-Urbana 2001 Annual Weather Summary ILLINOIS STATE WATER SURVEY 2204 Griffith Dr. Champaign, IL 61820 wxobsrvr@sws.uiuc.edu Maria Peters, Weather Observer January: After a cold and snowy December,
National Wildland Significant Fire Potential Outlook
 National Wildland Significant Fire Potential Outlook National Interagency Fire Center Predictive Services Issued: September, 2007 Wildland Fire Outlook September through December 2007 Significant fire
Weather and Climate Summary and Forecast Summer 2017
 Weather and Climate Summary and Forecast Summer 2017 Gregory V. Jones Southern Oregon University August 4, 2017 July largely held true to forecast, although it ended with the start of one of the most extreme
Summary report for Ruamāhanga Whaitua Committee The climate of the Ruamāhanga catchment
 Summary report for Ruamāhanga Whaitua Committee The climate of the Ruamāhanga catchment The Tararua and Rimutaka ranges have a large influence on the climate of the Ruamāhanga catchment. The ranges shelter
The Climate of Grady County
 The Climate of Grady County Grady County is part of the Central Great Plains, encompassing some of the best agricultural land in Oklahoma. Average annual precipitation ranges from about 33 inches in northern
Drought in Southeast Colorado
 Drought in Southeast Colorado Nolan Doesken and Roger Pielke, Sr. Colorado Climate Center Prepared by Tara Green and Odie Bliss http://climate.atmos.colostate.edu 1 Historical Perspective on Drought Tourism
A summary of the weather year based on data from the Zumwalt weather station
 ZUMWALT PRAIRIE WEATHER 2016 A summary of the weather year based on data from the Zumwalt weather station Figure 1. An unusual summer storm on July 10, 2016 brought the second-largest precipitation day
DEPARTMENT OF EARTH & CLIMATE SCIENCES Name SAN FRANCISCO STATE UNIVERSITY Nov 29, ERTH 360 Test #2 200 pts
 DEPARTMENT OF EARTH & CLIMATE SCIENCES Name SAN FRANCISCO STATE UNIVERSITY Nov 29, 2018 ERTH 360 Test #2 200 pts Each question is worth 4 points. Indicate your BEST CHOICE for each question on the Scantron
Analysis of meteorological measurements made over three rainy seasons in Sinazongwe District, Zambia.
 Analysis of meteorological measurements made over three rainy seasons in Sinazongwe District, Zambia. 1 Hiromitsu Kanno, 2 Hiroyuki Shimono, 3 Takeshi Sakurai, and 4 Taro Yamauchi 1 National Agricultural
UPPLEMENT A COMPARISON OF THE EARLY TWENTY-FIRST CENTURY DROUGHT IN THE UNITED STATES TO THE 1930S AND 1950S DROUGHT EPISODES
 UPPLEMENT A COMPARISON OF THE EARLY TWENTY-FIRST CENTURY DROUGHT IN THE UNITED STATES TO THE 1930S AND 1950S DROUGHT EPISODES Richard R. Heim Jr. This document is a supplement to A Comparison of the Early
Weather and Climate of the Rogue Valley By Gregory V. Jones, Ph.D., Southern Oregon University
 Weather and Climate of the Rogue Valley By Gregory V. Jones, Ph.D., Southern Oregon University The Rogue Valley region is one of many intermountain valley areas along the west coast of the United States.
CHAPTER-11 CLIMATE AND RAINFALL
 CHAPTER-11 CLIMATE AND RAINFALL 2.1 Climate Climate in a narrow sense is usually defined as the "average weather", or more rigorously, as the statistical description in terms of the mean and variability
Monthly Long Range Weather Commentary Issued: SEPTEMBER 19, 2016 Steven A. Root, CCM, Chief Analytics Officer, Sr. VP,
 Monthly Long Range Weather Commentary Issued: SEPTEMBER 19, 2016 Steven A. Root, CCM, Chief Analytics Officer, Sr. VP, sroot@weatherbank.com SEPTEMBER 2016 Climate Highlights The Month in Review The contiguous
Weather and Climate Summary and Forecast February 2018 Report
 Weather and Climate Summary and Forecast February 2018 Report Gregory V. Jones Linfield College February 5, 2018 Summary: For the majority of the month of January the persistent ridge of high pressure
Colorado s 2003 Moisture Outlook
 Colorado s 2003 Moisture Outlook Nolan Doesken and Roger Pielke, Sr. Colorado Climate Center Prepared by Tara Green and Odie Bliss http://climate.atmos.colostate.edu How we got into this drought! Fort
January 25, Summary
 January 25, 2013 Summary Precipitation since the December 17, 2012, Drought Update has been slightly below average in parts of central and northern Illinois and above average in southern Illinois. Soil
Energy Systems, Structures and Processes Essential Standard: Analyze patterns of global climate change over time Learning Objective: Differentiate
 Energy Systems, Structures and Processes Essential Standard: Analyze patterns of global climate change over time Learning Objective: Differentiate between weather and climate Global Climate Focus Question
Champaign-Urbana 1999 Annual Weather Summary
 Champaign-Urbana 1999 Annual Weather Summary ILLINOIS STATE WATER SURVEY 2204 Griffith Dr. Champaign, IL 61820 wxobsrvr@sws.uiuc.edu Maria Peters, Weather Observer A major snowstorm kicked off the new
Will a warmer world change Queensland s rainfall?
 Will a warmer world change Queensland s rainfall? Nicholas P. Klingaman National Centre for Atmospheric Science-Climate Walker Institute for Climate System Research University of Reading The Walker-QCCCE
Range Cattle Research and Education Center January CLIMATOLOGICAL REPORT 2016 Range Cattle Research and Education Center.
 1 Range Cattle Research and Education Center January 2017 Research Report RC-2017-1 CLIMATOLOGICAL REPORT 2016 Range Cattle Research and Education Center Brent Sellers Weather conditions strongly influence
A Report on a Statistical Model to Forecast Seasonal Inflows to Cowichan Lake
 A Report on a Statistical Model to Forecast Seasonal Inflows to Cowichan Lake Prepared by: Allan Chapman, MSc, PGeo Hydrologist, Chapman Geoscience Ltd., and Former Head, BC River Forecast Centre Victoria
Analysis of Rainfall and Other Weather Parameters under Climatic Variability of Parbhani ( )
") International Journal of Current Microbiology and Applied Sciences ISSN: 2319-7706 Volume 7 Number 06 (2018) Journal homepage: http://www.ijcmas.com Original Research Article https://doi.org/10.20546/ijcmas.2018.706.295
International Journal of Current Microbiology and Applied Sciences ISSN: 2319-7706 Volume 7 Number 06 (2018) Journal homepage: http://www.ijcmas.com Original Research Article https://doi.org/10.20546/ijcmas.2018.706.295
Monthly Long Range Weather Commentary Issued: APRIL 1, 2015 Steven A. Root, CCM, President/CEO
 Monthly Long Range Weather Commentary Issued: APRIL 1, 2015 Steven A. Root, CCM, President/CEO sroot@weatherbank.com FEBRUARY 2015 Climate Highlights The Month in Review The February contiguous U.S. temperature
Weather and Climate Summary and Forecast Winter
 Weather and Climate Summary and Forecast Winter 2016-17 Gregory V. Jones Southern Oregon University February 7, 2017 What a difference from last year at this time. Temperatures in January and February
UPDATE OF REGIONAL WEATHER AND SMOKE HAZE (December 2017)
") UPDATE OF REGIONAL WEATHER AND SMOKE HAZE (December 2017) 1. Review of Regional Weather Conditions for November 2017 1.1 In November 2017, Southeast Asia experienced inter-monsoon conditions in the first
UPDATE OF REGIONAL WEATHER AND SMOKE HAZE (December 2017) 1. Review of Regional Weather Conditions for November 2017 1.1 In November 2017, Southeast Asia experienced inter-monsoon conditions in the first
Weather & Climate of Virginia
 Weather & Climate of Virginia Robert E. Davis Professor of Climatology Dept. of Environmental Sciences University of Virginia Email: red3u@virginia.edu Rivanna Master Naturalists March 14, 2017 Arctic
Local Ctimatotogical Data Summary White Hall, Illinois
 SWS Miscellaneous Publication 98-5 STATE OF ILLINOIS DEPARTMENT OF ENERGY AND NATURAL RESOURCES Local Ctimatotogical Data Summary White Hall, Illinois 1901-1990 by Audrey A. Bryan and Wayne Armstrong Illinois
Climate Change Impact on Air Temperature, Daily Temperature Range, Growing Degree Days, and Spring and Fall Frost Dates In Nebraska
 EXTENSION Know how. Know now. Climate Change Impact on Air Temperature, Daily Temperature Range, Growing Degree Days, and Spring and Fall Frost Dates In Nebraska EC715 Kari E. Skaggs, Research Associate
SEPTEMBER 2013 REVIEW
 Monthly Long Range Weather Commentary Issued: October 21, 2013 Steven A. Root, CCM, President/CEO sroot@weatherbank.com SEPTEMBER 2013 REVIEW Climate Highlights The Month in Review The average temperature
Weather and Climate Summary and Forecast August 2018 Report
 Weather and Climate Summary and Forecast August 2018 Report Gregory V. Jones Linfield College August 5, 2018 Summary: July 2018 will likely go down as one of the top five warmest July s on record for many
What is happening to the Jamaican climate?
 What is happening to the Jamaican climate? Climate Change and Jamaica: Why worry? Climate Studies Group, Mona (CSGM) Department of Physics University of the West Indies, Mona Part 1 RAIN A FALL, BUT DUTTY
ZUMWALT WEATHER AND CLIMATE ANNUAL REPORT ( )
") ZUMWALT WEATHER AND CLIMATE ANNUAL REPORT (26-29) FINAL DRAFT (9 AUGUST 21) J.D. HANSEN 1, R.V. TAYLOR 2, AND V.S. JANSEN 3 INTRODUCTION The Zumwalt Prairie in northeastern Oregon is a unique grassland
ZUMWALT WEATHER AND CLIMATE ANNUAL REPORT (26-29) FINAL DRAFT (9 AUGUST 21) J.D. HANSEN 1, R.V. TAYLOR 2, AND V.S. JANSEN 3 INTRODUCTION The Zumwalt Prairie in northeastern Oregon is a unique grassland
2003 Moisture Outlook
 2003 Moisture Outlook Nolan Doesken and Roger Pielke, Sr. Colorado Climate Center Prepared by Tara Green and Odie Bliss http://climate.atmos.colostate.edu Through 1999 Through 1999 Fort Collins Total Water
Climate Outlook through 2100 South Florida Ecological Services Office Vero Beach, FL January 13, 2015
 Climate Outlook through 2100 South Florida Ecological Services Office Vero Beach, FL January 13, 2015 Short Term Drought Map: Short-term (
Current Climate Trends and Implications
 Current Climate Trends and Implications Dr. Mark Seeley Professor emeritus Department of Soil, Water, and Climate University of Minnesota St Paul, MN 55108 Crop Insurance Conference September 12, 2018
Three main areas of work:
 Task 2: Climate Information 1 Task 2: Climate Information Three main areas of work: Collect historical and projected weather and climate data Conduct storm surge and wave modeling, sea-level rise (SLR)
Weather and Climate Summary and Forecast March 2018 Report
 Weather and Climate Summary and Forecast March 2018 Report Gregory V. Jones Linfield College March 7, 2018 Summary: The ridge pattern that brought drier and warmer conditions from December through most
Climate Outlook through 2100 South Florida Ecological Services Office Vero Beach, FL September 9, 2014
 Climate Outlook through 2100 South Florida Ecological Services Office Vero Beach, FL September 9, 2014 Short Term Drought Map: Short-term (
PHYSICAL PROPERTIES TAHOE.UCDAVIS.EDU 8
 PHYSICAL PROPERTIES 8 Lake surface level Daily since 1900 Lake surface level varies throughout the year. Lake level rises due to high stream inflow, groundwater inflow, and precipitation directly onto
Climate Classification Chapter 7
 Climate Classification Chapter 7 Climate Systems Earth is extremely diverse No two places exactly the same Similarities between places allow grouping into regions Climates influence ecosystems Why do we
Monthly Long Range Weather Commentary Issued: APRIL 18, 2017 Steven A. Root, CCM, Chief Analytics Officer, Sr. VP,
 Monthly Long Range Weather Commentary Issued: APRIL 18, 2017 Steven A. Root, CCM, Chief Analytics Officer, Sr. VP, sroot@weatherbank.com MARCH 2017 Climate Highlights The Month in Review The average contiguous
The Global Scope of Climate. The Global Scope of Climate. Keys to Climate. Chapter 8
 The Global Scope of Climate Chapter 8 The Global Scope of Climate In its most general sense, climate is the average weather of a region, but except where conditions change very little during the course
Minnesota s Climatic Conditions, Outlook, and Impacts on Agriculture. Today. 1. The weather and climate of 2017 to date
 Minnesota s Climatic Conditions, Outlook, and Impacts on Agriculture Kenny Blumenfeld, State Climatology Office Crop Insurance Conference, Sep 13, 2017 Today 1. The weather and climate of 2017 to date
Champaign-Urbana 1998 Annual Weather Summary
 Champaign-Urbana 1998 Annual Weather Summary ILLINOIS STATE WATER SURVEY Audrey Bryan, Weather Observer 2204 Griffith Dr. Champaign, IL 61820 wxobsrvr@sparc.sws.uiuc.edu The development of the El Nìno
Climate Variability. Eric Salathé. Climate Impacts Group & Department of Atmospheric Sciences University of Washington. Thanks to Nathan Mantua
 Climate Variability Eric Salathé Climate Impacts Group & Department of Atmospheric Sciences University of Washington Thanks to Nathan Mantua Northwest Climate: the mean Factors that influence local/regional
2011 National Seasonal Assessment Workshop for the Eastern, Southern, & Southwest Geographic Areas
 2011 National Seasonal Assessment Workshop for the Eastern, Southern, & Southwest Geographic Areas On January 11-13, 2011, wildland fire, weather, and climate met virtually for the ninth annual National
Study of Hydrometeorology in a Hard Rock Terrain, Kadirischist Belt Area, Anantapur District, Andhra Pradesh
 Open Journal of Geology, 2012, 2, 294-300 http://dx.doi.org/10.4236/ojg.2012.24028 Published Online October 2012 (http://www.scirp.org/journal/ojg) Study of Hydrometeorology in a Hard Rock Terrain, Kadirischist
Climate briefing. Wellington region, May Alex Pezza and Mike Thompson Environmental Science Department
 Climate briefing Wellington region, May 2016 Alex Pezza and Mike Thompson Environmental Science Department For more information, contact the Greater Wellington Regional Council: Wellington PO Box 11646
Weather and Climate Summary and Forecast March 2019 Report
 Weather and Climate Summary and Forecast March 2019 Report Gregory V. Jones Linfield College March 2, 2019 Summary: Dramatic flip from a mild winter to a top five coldest February on record in many locations
8.1 Attachment 1: Ambient Weather Conditions at Jervoise Bay, Cockburn Sound
 8.1 Attachment 1: Ambient Weather Conditions at Jervoise Bay, Cockburn Sound Cockburn Sound is 20km south of the Perth-Fremantle area and has two features that are unique along Perth s metropolitan coast
Weather and Climate Summary and Forecast April 2018 Report
 Weather and Climate Summary and Forecast April 2018 Report Gregory V. Jones Linfield College April 4, 2018 Summary: A near Miracle March played out bringing cooler and wetter conditions to the majority
YACT (Yet Another Climate Tool)? The SPI Explorer
? The SPI Explorer") YACT (Yet Another Climate Tool)? The SPI Explorer Mike Crimmins Assoc. Professor/Extension Specialist Dept. of Soil, Water, & Environmental Science The University of Arizona Yes, another climate tool for
YACT (Yet Another Climate Tool)? The SPI Explorer Mike Crimmins Assoc. Professor/Extension Specialist Dept. of Soil, Water, & Environmental Science The University of Arizona Yes, another climate tool for
Mozambique. General Climate. UNDP Climate Change Country Profiles. C. McSweeney 1, M. New 1,2 and G. Lizcano 1
 UNDP Climate Change Country Profiles Mozambique C. McSweeney 1, M. New 1,2 and G. Lizcano 1 1. School of Geography and Environment, University of Oxford. 2.Tyndall Centre for Climate Change Research http://country-profiles.geog.ox.ac.uk
PRMS WHITE PAPER 2014 NORTH ATLANTIC HURRICANE SEASON OUTLOOK. June RMS Event Response
 PRMS WHITE PAPER 2014 NORTH ATLANTIC HURRICANE SEASON OUTLOOK June 2014 - RMS Event Response 2014 SEASON OUTLOOK The 2013 North Atlantic hurricane season saw the fewest hurricanes in the Atlantic Basin
but 2012 was dry Most farmers pulled in a crop
 After a winter that wasn t, conditions late in the year pointed to a return to normal snow and cold conditions Most farmers pulled in a crop but 2012 was dry b y M i k e Wr o b l e w s k i, w e a t h e
Weather and Climate Summary and Forecast December 2017 Report
 Weather and Climate Summary and Forecast December 2017 Report Gregory V. Jones Linfield College December 5, 2017 Summary: November was relatively cool and wet from central California throughout most of
The Weather Wire. Contents: Summer 2018 Outlook. Summer 2018 Outlook Drought Monitor May Summary/Statistics June Preview Rainfall Totals
 The Weather Wire June 2018 Volume 25 Number 6 Contents: Summer 2018 Outlook Drought Monitor May Summary/Statistics June Preview Rainfall Totals Summer 2018 Outlook June 1 st marked the first day of meteorological
Monthly Long Range Weather Commentary Issued: APRIL 25, 2016 Steven A. Root, CCM, Chief Analytics Officer, Sr. VP, sales
 Monthly Long Range Weather Commentary Issued: APRIL 25, 2016 Steven A. Root, CCM, Chief Analytics Officer, Sr. VP, sales sroot@weatherbank.com MARCH 2016 Climate Highlights The Month in Review The March
The South Eastern Australian Climate Initiative
 The South Eastern Australian Climate Initiative Phase 2 of the South Eastern Australian Climate Initiative (SEACI) is a three-year (2009 2012), $9 million research program investigating the causes and
Daily Rainfall Disaggregation Using HYETOS Model for Peninsular Malaysia
 Daily Rainfall Disaggregation Using HYETOS Model for Peninsular Malaysia Ibrahim Suliman Hanaish, Kamarulzaman Ibrahim, Abdul Aziz Jemain Abstract In this paper, we have examined the applicability of single
Rainfall Observations in the Loxahatchee River Watershed
 Rainfall Observations in the Loxahatchee River Watershed Richard C. Dent Loxahatchee River District September 1997 Introduction Rain is a common occurrence in south Florida, yet its presence or absence
Monthly Long Range Weather Commentary Issued: NOVEMBER 16, 2015 Steven A. Root, CCM, Chief Analytics Officer, Sr. VP, sales
 Monthly Long Range Weather Commentary Issued: NOVEMBER 16, 2015 Steven A. Root, CCM, Chief Analytics Officer, Sr. VP, sales sroot@weatherbank.com OCTOBER 2015 Climate Highlights The Month in Review The
Sierra Weather and Climate Update
 Sierra Weather and Climate Update 2014-15 Kelly Redmond Western Regional Climate Center Desert Research Institute Reno Nevada Yosemite Hydroclimate Workshop Yosemite Valley, 2015 October 8-9 Percent of
PH YSIC A L PROPERT IE S TERC.UCDAVIS.EDU
 PH YSIC A L PROPERT IE S 8 Lake surface level Daily since 1900 Lake surface level varies throughout the year. Lake level rises due to high stream inflow, groundwater inflow and precipitation directly onto
2. PHYSICAL SETTING FINAL GROUNDWATER MANAGEMENT PLAN. 2.1 Topography. 2.2 Climate
 FINAL GROUNDWATER MANAGEMENT PLAN 2. PHYSICAL SETTING Lassen County is a topographically diverse area at the confluence of the Cascade Range, Modoc Plateau, Sierra Nevada and Basin and Range geologic provinces.
Atmospheric Moisture, Precipitation, and Weather Systems
 Atmospheric Moisture, Precipitation, and Weather Systems 6 Chapter Overview The atmosphere is a complex system, sometimes described as chaotic in nature. In this chapter we examine one of the principal
2011 Year in Review TORNADOES
 2011 Year in Review The year 2011 had weather events that will be remembered for a long time. Two significant tornado outbreaks in April, widespread damage and power outages from Hurricane Irene in August
HAIDA GWAII CLIMATE ASSESSMENT 2010 Special Report for MIEDS Franc Pridoehl
 HAIDA GWAII CLIMATE ASSESSMENT 2010 Special Report for MIEDS Franc Pridoehl INTRODUCTION Climatic conditions have varied considerably on Haida Gwaii over the past centuries and millennia (Hebda 2007).
ARUBA CLIMATOLOGICAL SUMMARY 2017 PRECIPITATION
 ARUBA CLIMATOLOGICAL SUMMARY 2017 PRECIPITATION The total amount of rainfall recorded at Reina Beatrix International Airport for the year 2017 was 391.0 mm. This is 17.1 % below normal ( Figure 1 ). During
Range Cattle Research and Education Center January CLIMATOLOGICAL REPORT 2012 Range Cattle Research and Education Center.
 1 Range Cattle Research and Education Center January 2013 Research Report RC-2013-1 CLIMATOLOGICAL REPORT 2012 Range Cattle Research and Education Center Brent Sellers Weather conditions strongly influence
Seasonal Climate Outlook for South Asia (June to September) Issued in May 2014
 Issued in May 2014") Ministry of Earth Sciences Earth System Science Organization India Meteorological Department WMO Regional Climate Centre (Demonstration Phase) Pune, India Seasonal Climate Outlook for South Asia (June
Ministry of Earth Sciences Earth System Science Organization India Meteorological Department WMO Regional Climate Centre (Demonstration Phase) Pune, India Seasonal Climate Outlook for South Asia (June
UPDATE OF REGIONAL WEATHER AND SMOKE HAZE (February 2018)
") UPDATE OF REGIONAL WEATHER AND SMOKE HAZE (February 2018) 1. Review of Regional Weather Conditions for January 2018 1.1 The prevailing Northeast monsoon conditions over Southeast Asia strengthened in January
UPDATE OF REGIONAL WEATHER AND SMOKE HAZE (February 2018) 1. Review of Regional Weather Conditions for January 2018 1.1 The prevailing Northeast monsoon conditions over Southeast Asia strengthened in January
Weather and Climate Summary and Forecast January 2018 Report
 Weather and Climate Summary and Forecast January 2018 Report Gregory V. Jones Linfield College January 5, 2018 Summary: A persistent ridge of high pressure over the west in December produced strong inversions
An ENSO-Neutral Winter
 An ENSO-Neutral Winter This issue of the Blue Water Outlook newsletter is devoted towards my thoughts on the long range outlook for winter. You will see that I take a comprehensive approach to this outlook
ENSO UPDATE By Joseph D Aleo, CCM
 ENSO UPDATE By Joseph D Aleo, CCM El Nino is still hanging on but likely not for very long. Warmer than normal water can still be seen along the equator in the tropical Pacific. It is even warmer in the
2015: A YEAR IN REVIEW F.S. ANSLOW
 2015: A YEAR IN REVIEW F.S. ANSLOW 1 INTRODUCTION Recently, three of the major centres for global climate monitoring determined with high confidence that 2015 was the warmest year on record, globally.
UWM Field Station meteorological data
 University of Wisconsin Milwaukee UWM Digital Commons Field Station Bulletins UWM Field Station Spring 992 UWM Field Station meteorological data James W. Popp University of Wisconsin - Milwaukee Follow
5.0 WHAT IS THE FUTURE ( ) WEATHER EXPECTED TO BE?
 WEATHER EXPECTED TO BE?") 5.0 WHAT IS THE FUTURE (2040-2049) WEATHER EXPECTED TO BE? This chapter presents some illustrative results for one station, Pearson Airport, extracted from the hour-by-hour simulations of the future period
5.0 WHAT IS THE FUTURE (2040-2049) WEATHER EXPECTED TO BE? This chapter presents some illustrative results for one station, Pearson Airport, extracted from the hour-by-hour simulations of the future period
Climate Change or Climate Variability?
 Climate Change or Climate Variability? Key Concepts: Greenhouse Gas Climate Climate change Climate variability Climate zones Precipitation Temperature Water cycle Weather WHAT YOU WILL LEARN 1. You will
November 2018 Weather Summary West Central Research and Outreach Center Morris, MN
 November 2018 Weather Summary Lower than normal temperatures occurred for the second month. The mean temperature for November was 22.7 F, which is 7.2 F below the average of 29.9 F (1886-2017). This November
CLIMATOLOGICAL REPORT 2002
 Range Cattle Research and Education Center Research Report RC-2003-1 February 2003 CLIMATOLOGICAL REPORT 2002 Range Cattle Research and Education Center R. S. Kalmbacher Professor, IFAS, Range Cattle Research
Changing Hydrology under a Changing Climate for a Coastal Plain Watershed
 Changing Hydrology under a Changing Climate for a Coastal Plain Watershed David Bosch USDA-ARS, Tifton, GA Jeff Arnold ARS Temple, TX and Peter Allen Baylor University, TX SEWRU Objectives 1. Project changes
Outline. Precipitation. How would you describe precipitation patterns in your area? Bottom line: one-page summary
 Outline Precipitation June 13, 2013 Phoenix, AZ Measuring rainfall Patterns of precipitation in time and space Predicting precipitation Patterns related to extreme events (floods & drought) Paleo-climate
Analysis of Historical Pattern of Rainfall in the Western Region of Bangladesh
 24 25 April 214, Asian University for Women, Bangladesh Analysis of Historical Pattern of Rainfall in the Western Region of Bangladesh Md. Tanvir Alam 1*, Tanni Sarker 2 1,2 Department of Civil Engineering,
Memo. I. Executive Summary. II. ALERT Data Source. III. General System-Wide Reporting Summary. Date: January 26, 2009 To: From: Subject:
 Memo Date: January 26, 2009 To: From: Subject: Kevin Stewart Markus Ritsch 2010 Annual Legacy ALERT Data Analysis Summary Report I. Executive Summary The Urban Drainage and Flood Control District (District)