HIGH RESOLUTION CMAQ APPLICATION FOR THE REGIONAL MUNICIPALITY OF PEEL, ONTARIO, CANADA
|
|
|
- Eustacia Lynch
- 5 years ago
- Views:
Transcription

 has a population of more than one million people and is adjacent to the City of Toronto, in the province of Ontario, Canada.")

1 HIGH RESOLUTION CMAQ APPLICATION FOR THE REGIONAL MUNICIPALITY OF PEEL, ONTARIO, CANADA Jeff Lundgren*, Wayne Boulton, Greg Conley, Martin Gauthier, Akhila Wolfe, Carol McClellan RWDI, Guelph, Ontario, Canada Zac Adelman, Mohamed Omary Institute for the Environment, The University of North Carolina, Chapel Hill, NC, USA Louise Aubin, Kim McAdam Regional Municipality of Peel Public Health Department, Mississauga, Ontario, Canada 1. INTRODUCTION The Regional Municipality of Peel (Peel Region) has a population of more than one million people and is adjacent to the City of Toronto, in the province of Ontario, Canada. The Region of Peel Public Health Department commissioned a multi-year project to develop a flexible and comprehensive air quality modelling and monitoring system. The purpose is to provide data to hhelp understand and address sources of poor air quality and to assist in the assessment of land-use planning and transportation decisions. the US and Canada are described in Table 1. High resolution spatial surrogates were developed to more effectively and accurately allocate emissions within the innermost model Plume rise calculations for point sources were processed by CMAQ. 2. MODELLING AND MONITORING OVERVIEW A passive monitoring program was implemented to complement existing monitoring programs in the region, support the evaluation of model performance and inform potential areas of interest for future modelling scenarios. Results from the monitoring program are under review and hence not described here. The modelling system is based on year-long model simulations using WRF/SMOKE/CMAQ. The system is configured with nested 36km, 12km, 4km and 1km resolution model grids. The parent 36km resolution domain covers most of northeastern North America. The inner-most 1km-resolution domain covers Peel Region along with the heavily urbanized areas along the western portion of Lake Ontario, referred to locally as the Golden Horseshoe. Major urban centres within the 1km model domain include Toronto, Mississauga, Oakville, Burlington, Hamilton, and St. Catharines (Figure 1). Hourly meteorological inputs were generated for the complete 2012 year using WRF v Emissions processing was performed using SMOKE v.3.1. Regional emissions inventories for Fig. 1. Extent of nested CMAQ modelling domains being used for the Peel Region modelling system. Jurisdiction Canada U.S. Biogenic Emissions Inventories 2010 pre-speciated point sources (NPRI) 2006 mobile (on-road and nonroad), and area sources 2011 NAESI Agriculture emissions 2008 US EPA NEI (point, area, on-road, non-road) 2012 fire emissions Megan (v. 2.1) updated for Canadian land cover Table 1. Emissions Inventory inputs. 1


 spatial allocation of emissions at the 1km domain resolution.")

.")


.")


2 th Presented at the 13 Annual CMAS Conference, Chapel Hill, NC, October 27-29, SPATIAL SURROGATES 4. EMISSIONS MODELLING High-resolution spatial surrogates were generated for the 1km model domain using ArcGIS v New activity layers and data were sourced and further developed or created. Collecting and creating new activity data was deemed necessary as data used historically for more coarse model resolution applications resulted in poor (overly smoothed) spatial allocation of emissions at the 1km domain resolution. Figures 2 and 3 depict examples of improvements made to key surrogates for the 1km domain within the Peel modelling system. Additional details on the spatial surrogate development process are described in McClellan et al. (2013). Emissions modelling were performed using SMOKE to generate the emission inputs for CMAQ. The SMOKE modelling process incorporated emissions inventory data from Canada, the USA and Peel Region to account for anthropogenic sources and MEGAN outputs for biogenic sources. Specific focus was applied to develop realistic spatial and temporal representations of emissions within the 1km Examples of the processed NOx emissions output from SMOKE for the 1km and 4 km model runs are shown in Figures 4 and 5, respectively (the 4km results are cropped to the 1 km domain extents). This comparison demonstrates the improved spatial representation of major NOx emission sources, namely transportation and urban areas at 1 km resolution. Fig. 2. Comparison of surrogates used to represent emissions from rail marshaling yards before and after improvements completed using GIS techniques. Fig. 4. NOx emissions (g/s) from SMOKE for the 1km domain for July 13, 2012, 1800 GMT (13:00 EST). Fig. 3. Comparison of surrogate used to represent emissions from marine commercial vessels before and after improvements completed using GIS techniques. Fig. 5. NOx emissions (g/s) from SMOKE for the 4km model domain, cropped to the 1km domain extents, for July 13, GMT (13:00 EST). 2
3 5. CMAQ MODEL RESULTS Results for the first full year of model simulations showing both the positive and negative impacts of adopting a 1km grid resolution are presented, demonstrating the complexity involved in a modeling exercise of this scope and magnitude. The results for the 4km grid resolution are also presented to provide a side-by-side comparison of how the 1km results differ from the 4km to facilitate an understanding of the benefits and disbenefits of applying WRF/SMOKE/CMAQ at high spatial resolutions. Figures 6 through 11 are displayed as side-byside panels covering a three-hour progression (time series) of CMAQ model results for ground level ozone (O 3 ) from July 13, GMT (12:00 EST) through 1900 GMT (14:00 EST), inclusive. Images on the left are from the 1km resolution CMAQ results; images on the right are from the 4km resolution domain but trimmed to the 1 km domain extent to facilitate a more direct comparison. The same colour legend and scale is used in all figures. As can be seen from each set of images, the 1km grid resolution produces a more spatially refined representation of local air quality and also emissions sources. This is evidenced by the local, road-side titration of ozone by NOx emissions along major highways and within urban centres. This same phenomenon is less evident in the 4km results due to the inherent spatial averaging of the coarser resolution. A more detailed assessment of the spatial patterns of both emissions and modeled concentrations is ongoing. A review of how these factors play out for different pollutants and at different times of the year is also being assessed. 6. MODEL PERFORMANCE The Atmospheric Model Evaluation Tool (AMET) is being leveraged to pair and analyze the results of both WRF/MCIP and CMAQ model outputs to measured values collected by in situ monitoring programs. 6.1 WRF and MCIP Model Performance biases that are undergoing further examination, the representativeness of the meteorological model outputs is believed to be adequate to support the air quality modeling without having a major impact on the CMAQ model performance. As a result, no further discussion of the meteorological model performance is presented. 6.1 CMAQ Model Performance Ambient monitoring data from the Canadian National Air Pollution Surveillance (NAPS) network and U.S. AQS, for the 2012 calendar year, are being used to evaluate the CMAQ model performance. This work had just begun at the time of writing and hence only preliminary results for ozone for the month of July are presented. Further evaluations for other periods and pollutants are ongoing. Time series of hourly O 3 concentrations (in ppbv) for July 10 th to 25 th, 2012 for the 1km and 4km resolution domains are presented in Figures 12 and 13, respectively. These time series are for the respective domain-wide observed averages, not any one specific station. Figure 12 demonstrates that for the 1km domain, the model captures the peaks and troughs well with modest overestimates of daytime peaks and slight underestimates at night. Specific signatures in the times series such as higher overnight levels on July14 th, 22 nd,23 rd and 26 th are also captured well, as are the subtle steps observed in evening ozone levels. Figure 13 demonstrates similar results but for the entire 4km domain (note missing observations for July 16 th manifest as a straightline anomaly in the graph). The model performance is very similar or slightly better than for the 1km results. Arguably, these simple time series might suggest that the model performance is the same or better at the 4km resolution as the line of modelled values is generally a tighter fit with the observed values. However, our previous review of modeled spatial patterns over the 1km domain indicate that model evaluations must take into account not just domain-wide statistics but also the location and timing. Model performance statistics generated for the WRF and MCIP outputs demonstrate good agreement with observations from MADIS stations. Although there are some slight seasonal 3


. Fig. 9.")
. Fig. 7.")
. Fig. 10. EST). Fig. 8.")
. Fig. 11. EST). 4")
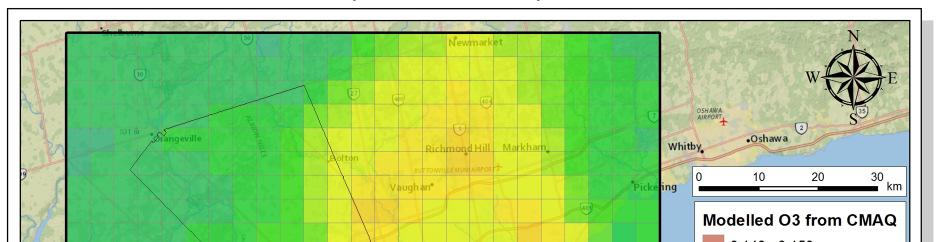
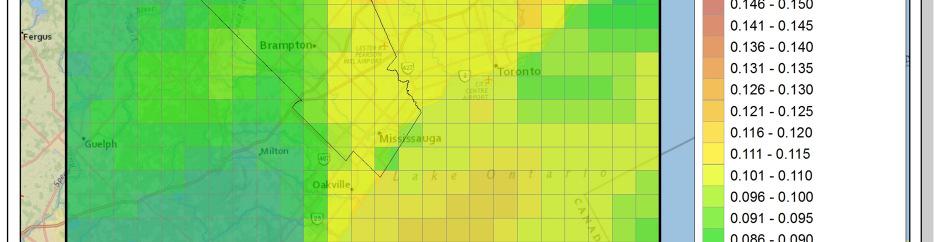
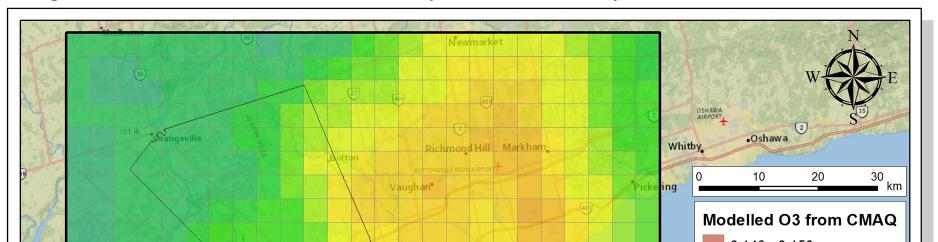
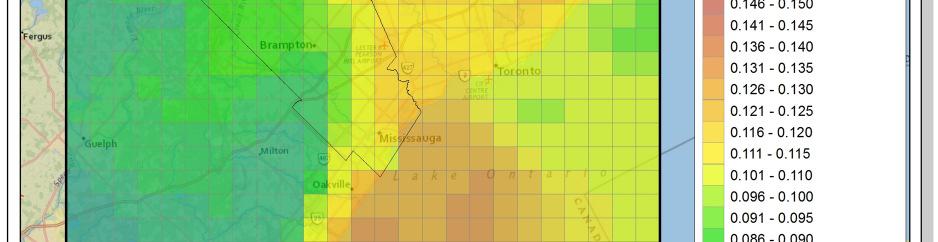

4 th Presented at the 13 Annual CMAS Conference, Chapel Hill, NC, October 27-29, 2014 Fig. 6. 1km modelled O3 (ppmv) concentrations for July 13, GMT (12:00 EST). Fig. 9. 4km modelled O3 (ppmv) concentrations for July 13, GMT (12:00 EST). Fig. 7. 1km modelled O3 (ppmv) concentrations for July 13, GMT (13:00 EST). Fig km modelled O3 (ppmv) concentrations for July 13, GMT (13:00 EST). Fig. 8. 1km modelled O3 (ppmv) concentrations for July 13, GMT (14:00 EST). Fig km modelled O3 (ppmv) concentrations for July 13, GMT (14:00 EST). 4


5 exercise is to support policy assessments and decision making concerning urban growth and planning activities, the effort involved in generating high resolution model results appears to be a worthwhile investment. Future efforts will focus on more rigorous model performance evaluations and the assessment of various emission change scenarios designed to assess potential air quality health management strategies and to inform policy and development within Peel Region. 7. REFERENCES Fig. 12. Time series generated in AMET comparing NAPS air quality monitoring program recorded O 3 values in ppb to CMAQ modelled values for the 1km model McClellan, C., J. W. Boulton, M. Gauthier, S. Hajaghassi, J. Lundgren, G. Conley, M. Moran, J. Zhang, Q. Zheng, L. Aubin, K. McAdam, (2013), Developing Spatial Surrogates for High-Resolution Modeling Domains (Poster), 12th Annual CMAS Conference, UNC Chapel Hill, North Carolina, October, ACKNOWLEDGEMENTS The authors would like to acknowledge the technical support provided by Environment Canada, the Ontario Ministry of the Environment, and the US EPA. Financial support for this project is provided by the Region of Peel. Fig. 13. Time series generated in AMET comparing NAPS air quality monitoring program recorded O 3 values in ppb to CMAQ modelled values for the 4km model 7. CONCLUSIONS Photochemical modelling over a relatively large domain, at high spatial resolution, and for an entire year is highly resource intensive. In addition to the large computing requirements, significant additional effort is required to prepare and preprocess emissions data and spatial surrogates. Without this effort the full advantage of modelling at high resolution would not be recognized (i.e., spatial data used to create surrogates at 4km or coarser resolutions may not be adequate for preparing surrogates at 1 km resolution). An initial review of the CMAQ results indicates that there is value in assessing impacts at high spatial resolution if interested in knowing some of the subtle differences in exposure of populations to air quality. As the underlying purpose of this 5
Ongoing EPA efforts to evaluate modeled NO y budgets. Heather Simon, Barron Henderson, Deborah Luecken, Kristen Foley
 Ongoing EPA efforts to evaluate modeled NO y budgets Heather Simon, Barron Henderson, Deborah Luecken, Kristen Foley Literature consistent regarding reported high bias Mobile NO x over (2x) Mobile NO x
Wen Xu* Alberta Environment and Sustainable Resource Development, Edmonton, Alberta, Canada
 Air Quality and Acid Deposition Simulation of South Athabasca Oil Sands Area Applying WRF, CMAQ and CALPUFF Models, and Model Performance Evaluations of WRF and CMAQ Models Wen Xu* Alberta Environment
AIRQUEST Annual Report and State of the Model
 AIRQUEST Annual Report and State of the Model Brian Lamb 1, Serena Chung 1, Farren Herron-Thorpe 2 and Joseph Vaughan 1 1 Laboratory for Atmospheric Research, Washington State University, Pullman, W, USA
Greater Toronto Area/ Clean Air Council. Air Quality Modeling Pilot Project
 Greater Toronto Area/ Clean Air Council Air Quality Modeling Pilot Project Liveable Peel Conference February 10th, 2006 Anthony Ciccone, Ph.D., P.Eng. Principal Golder Associates Limited 2390 Argentia
REGIONAL AIR POLLUTION MODELLING
 5th International Congress of Croatian Society of Mechanics September, 21-23, 2006 Trogir/Split, Croatia REGIONAL AIR POLLUTION MODELLING M. Čavrak, Z. Mrša and G. Štimac Keywords: air pollution, atmospheric
J2.20 URBAN AND REGIONAL AIR QUALITY MODELLING IN THE PACIFIC NORTHWEST
 J2.20 URBAN AND REGIONAL AIR QUALITY MODELLING IN THE PACIFIC NORTHWEST Xin Qiu*, Mike Lepage, J. Wayne Boulton, and Martin Gauthier RWDI West Inc. 650 Woodlawn Rd. West Guelph, Ontario, Canada, N1K 1B8
Supplement of Photochemical grid model implementation and application of VOC, NO x, and O 3 source apportionment
 Supplement of Geosci. Model Dev., 8, 99 114, 2015 http://www.geosci-model-dev.net/8/99/2015/ doi:10.5194/gmd-8-99-2015-supplement Author(s) 2015. CC Attribution 3.0 License. Supplement of Photochemical
SIMMER WORKSHOP (Science, Policy & Heat-Health Decision Making) Toronto
 Toronto") SIMMER WORKSHOP (Science, Policy & Heat-Health Decision Making) Toronto Weather & Climate Modelling in Toronto & The Significant Results for Public Health October 24, 2013 Christopher Ll. Morgan, PhD Program
SIMMER WORKSHOP (Science, Policy & Heat-Health Decision Making) Toronto Weather & Climate Modelling in Toronto & The Significant Results for Public Health October 24, 2013 Christopher Ll. Morgan, PhD Program
Current and Future Impacts of Wildfires on PM 2.5, Health, and Policy in the Rocky Mountains
 Current and Future Impacts of Wildfires on PM 2.5, Health, and Policy in the Rocky Mountains Yang Liu, Ph.D. STAR Grants Kick-off Meeting Research Triangle Park, NC April 5, 2017 Motivation The Rocky Mountains
Utilization of Geostationary Satellite Observations for Air Quality Modeling During 2013 Discover-AQ Texas Campaign
 Utilization of Geostationary Satellite Observations for Air Quality Modeling During 2013 Discover-AQ Texas Campaign Arastoo Pour Biazar 1, Andrew White 1, Daniel Cohan 2, Rui Zhang 2, Maudood Khan 1, Bright
Influence of 3D Model Grid Resolution on Tropospheric Ozone Levels
 Influence of 3D Model Grid Resolution on Tropospheric Ozone Levels Pedro Jiménez nez, Oriol Jorba and José M. Baldasano Laboratory of Environmental Modeling Technical University of Catalonia-UPC (Barcelona,
Creating Meteorology for CMAQ
 Creating Meteorology for CMAQ Tanya L. Otte* Atmospheric Sciences Modeling Division NOAA Air Resources Laboratory Research Triangle Park, NC * On assignment to the National Exposure Research Laboratory,
Comprehensive Analysis of Annual 2005/2008 Simulation of WRF/CMAQ over Southeast of England
 Comprehensive Analysis of Annual 2005/2008 Simulation of WRF/CMAQ over Southeast of England The 13 th International Conference on Harmonization within Atmospheric Dispersion Modelling for Regulatory Purposes
High-Resolution Air Quality Modelling in the Oil Sands
 High-Resolution Air Quality Modelling in the Oil Sands Paul Makar, Ayodeji Akingunola, Philip Cheung, Balbir Pabla, Junhua Zhang, Qiong Zheng, Mike Moran, George Marson, Craig Stroud and Heather Morrison
Air Quality Modeling from the Offshore Energy Sector in the Gulf of Mexico: An Overview for the Oil and Gas Industry
 Air Quality Modeling from the Offshore Energy Sector in the Gulf of Mexico: An Overview for the Oil and Gas Industry Jose L. Hernandez Bureau of Ocean Energy Management New Orleans, LA Presented at American
The Air Quality Model Evaluation International Initiative (AQMEII)
") The Air Quality Model Evaluation International Initiative (AQMEII) Christian Hogrefe 1, Stefano Galmarini 2, Efisio Solazzo 2, Ulas Im 3, Marta Garcia Vivanco 4,5, Augustin Colette 4, and AQMEII modeling
The Air Quality Model Evaluation International Initiative (AQMEII) Christian Hogrefe 1, Stefano Galmarini 2, Efisio Solazzo 2, Ulas Im 3, Marta Garcia Vivanco 4,5, Augustin Colette 4, and AQMEII modeling
The climate change penalty on US air quality: New perspectives from statistical models
 The climate change penalty on US air quality: New perspectives from statistical models Charles River Path, Boston, July 2010 Salt Lake City, January 2013 Loretta J. Mickley, Lu Shen, Xu Yue Harvard University
MULTI-MODEL AIR QUALITY FORECASTING OVER NEW YORK STATE FOR SUMMER 2008
 MULTI-MODEL AIR QUALITY FORECASTING OVER NEW YORK STATE FOR SUMMER 2008 Christian Hogrefe 1,2,*, Prakash Doraiswamy 2, Winston Hao 1, Brian Colle 3, Mark Beauharnois 2, Ken Demerjian 2, Jia-Yeong Ku 1,
NOAA s Air Quality Forecasting Activities. Steve Fine NOAA Air Quality Program
 NOAA s Air Quality Forecasting Activities Steve Fine NOAA Air Quality Program Introduction Planned Capabilities Initial: 1-day 1 forecast guidance for ozone Develop and validate in Northeastern US September,
Using Global and Regional Models to Represent Background Ozone Entering Texas
 Using Global and Regional Models to Represent Background Ozone Entering Texas AQRP Project 12-011 Chris Emery, Ed Tai, Greg Yarwood ENVIRON International Corporation Meiyun Lin Princeton University/NOAA
Date: March 31, 2014 PATE; fyril 2.3,2 >H
 aj BRAMPTON fifs Rower City XH-l-f r.t "»* City Council The Corporation of the City of Brampton SRAMPTON CITY COUNCIL Date: March 31, 2014 PATE; fyril 2.3,2 >H File: POO GR VisWhtoJed ^t'th-meeh'^a Subject:
NOAA-EPA s s U.S. National Air Quality Forecast Capability
 NOAA-EPA s s U.S. National Air Quality Forecast Capability May 10, 2006 Paula M. Davidson 1, Nelson Seaman 1, Jeff McQueen 1, Rohit Mathur 1,2, Chet Wayland 2 1 National Oceanic and Atmospheric Administration
Impacts of Aerosol Direct/Indirect Effect Feedbacks and Forest Shading/Turbulence on Urban Air Quality Forecasts
 Impacts of Aerosol Direct/Indirect Effect Feedbacks and Forest Shading/Turbulence on Urban Air Quality Forecasts Paul A. Makar, Ayodeji Akingunola, Craig Stroud, Junhua Zhang, Wanmin Gong, Michael D. Moran,
PRELIMINARY EXPERIENCES WITH THE MULTI-MODEL AIR QUALITY FORECASTING SYSTEM FOR NEW YORK STATE
 PRELIMINARY EXPERIENCES WITH THE MULTI-MODEL AIR QUALITY FORECASTING SYSTEM FOR NEW YORK STATE Prakash Doraiswamy 1,,*, Christian Hogrefe 1,2, Winston Hao 2, Brian Colle 3, Mark Beauharnois 1, Ken Demerjian
Source apportionment of fine particulate matter over the Eastern U.S. Part I. Source sensitivity simulations using CMAQ with the Brute Force method
 S1 SUPPORTING MATERIAL Source apportionment of fine particulate matter over the Eastern U.S. Part I. Source sensitivity simulations using CMAQ with the Brute Force method Michael Burr and Yang Zhang Department
ASSESSMENT OF PM2.5 RETRIEVALS USING A COMBINATION OF SATELLITE AOD AND WRF PBL HEIGHTS IN COMPARISON TO WRF/CMAQ BIAS CORRECTED OUTPUTS
 Presented at the 2 th Annual CMAS Conference, Chapel Hill, NC, October 28-3, 23 ASSESSMENT OF PM2.5 RETRIEVALS USING A COMBINATION OF SATELLITE AOD AND WRF PBL HEIGHTS IN COMPARISON TO WRF/CMAQ BIAS CORRECTED
Responsibilities of Harvard Atmospheric Chemistry Modeling Group
 Responsibilities of Harvard Atmospheric Chemistry Modeling Group Loretta Mickley, Lu Shen, Daniel Jacob, and Rachel Silvern 2.1 Objective 1: Compile comprehensive air pollution, weather, emissions, and
Improvement of Meteorological Inputs for Air Quality Study
 July 21, 2008 NCAR GEO Turbulance Improvement of Meteorological Inputs for Air Quality Study Fong (Fantine) Ngan Daewon W. Byun DaeGyun Lee, Soontae Kim, XiangShang Li and Peter Percell Institute for Multidimensional
A Method for Mapping Settlement Area Boundaries in the Greater Golden Horseshoe
 A Method for Mapping Settlement Area Boundaries in the Greater Golden Horseshoe Purpose This paper describes a method for mapping and measuring the lands designated for growth and urban expansion in the
Air Quality Simulation of Traffic Related Emissions: Application of Fine-Scaled Dispersion Modelling
 Air Quality Simulation of Traffic Related Emissions: Application of Fine-Scaled Dispersion Modelling M. Shekarrizfard, M. Hatzopoulou Dep. of Civil Engineering and Applied Mechanics, McGill University
APPLICATION OF CMAQ ON HEMISPHERIC SCALES
 APPLICATION OF CMAQ ON HEMISPHERIC SCALES O. Russell Bullock, Jr.* and Rohit Mathur US Environmental Protection Agency, Research Triangle Park, NC, USA Francis S. Binkowski and Neil N. Davis Carolina Environmental
Predicting Long-term Exposures for Health Effect Studies
 Predicting Long-term Exposures for Health Effect Studies Lianne Sheppard Adam A. Szpiro, Johan Lindström, Paul D. Sampson and the MESA Air team University of Washington CMAS Special Session, October 13,
FRAPPÉ/DISCOVER-AQ (July/August 2014) in perspective of multi-year ozone analysis
 in perspective of multi-year ozone analysis") FRAPPÉ/DISCOVER-AQ (July/August 2014) in perspective of multi-year ozone analysis Project Report #2: Monitoring network assessment for the City of Fort Collins Prepared by: Lisa Kaser kaser@ucar.edu ph:
FRAPPÉ/DISCOVER-AQ (July/August 2014) in perspective of multi-year ozone analysis Project Report #2: Monitoring network assessment for the City of Fort Collins Prepared by: Lisa Kaser kaser@ucar.edu ph:
Edward R. Sajecki Commissioner of Planning and Building. Conservation Authority Regulations and Mapping
 Corporate Report Clerk s Files Originator s Files EC.19.CON DATE: TO: FROM: SUBJECT: Chair and Members of Planning and Development Committee Meeting Date: April 3, 2006 Edward R. Sajecki Commissioner of
Presented at: 11 th Annual CMAS Conference Friday Center, UNC-Chapel Hill, Chapel Hill, NC October 15-17, 2012
 Yun-Hee Park 1, Arastoo Pour Biazar 1, Richard T. McNider 1, Bright Dornblaser 3, Maudood Khan 2, Kevin Doty 1 1. University of Alabama in Huntsville 2. University Space Research Association (USRA) 3.
REGIONAL AIR QUALITY FORECASTING OVER GREECE WITHIN PROMOTE
 REGIONAL AIR QUALITY FORECASTING OVER GREECE WITHIN PROMOTE Poupkou A. (1), D. Melas (1), I. Kioutsioukis (2), I. Lisaridis (1), P. Symeonidis (1), D. Balis (1), S. Karathanasis (3) and S. Kazadzis (1)
The Challenge of. Guy Brasseur
 The Challenge of Monitoring and Predicting Chemical Weather Guy Brasseur Introduction: What is Chemical Weather? What is Chemical Weather? Local, regional, and global distributions of important trace gases
An aromatic hydrocarbon study with an extended SAPRC99 mechanism of the CMAQ system: Application for the Houston-Galveston area
 An aromatic hydrocarbon study with an extended SAPRC99 mechanism of the CMAQ system: Application for the Houston-Galveston area Violeta F. Coarfa, Daewon W. Byun Institute for Multidimensional Air Quality
Conceptual Model for Ozone in the Austin-Round Rock Metropolitan Statistical Area
 CAPCOG FY14-15 PGA FY14-1 Deliverable 5.1.2 Amendment 1 Conceptual Model for Ozone in the Austin-Round Rock Metropolitan Statistical Area Prepared by the Capital Area Council of Governments October 8,
WRAP 2002 Visibility Modeling: Emission, Meteorology Inputs and CMAQ Performance Evaluation
 WRAP 2002 Visibility Modeling: Emission, Meteorology Inputs and CMAQ Performance Evaluation Gail Tonnesen, Bo Wang, Chao-Jung Chien, Zion Wang, Mohammad Omary University of California, Riverside Zac Adelman,
 Contributors: Arlene Fiore 1, Lee Murray 1, Luke Valin 1, Olivia Clifton 1, Jean Guo 1 Author: Melissa Seto 1 Analysis of Wisconsin 2007 High-Ozone event Section 1A: Can satellite NO 2 columns inform us
A Canadian OSSE Data Assimilation facility for Atmospheric Composition satellite missions (CODAAC)
") A Canadian OSSE Data Assimilation facility for Atmospheric Composition satellite missions (CODAAC) 14th Meeting of the CEOS Atmospheric Composition Virtual Constellation (AC-VC-14) NOAA Center for Weather
A Canadian OSSE Data Assimilation facility for Atmospheric Composition satellite missions (CODAAC) 14th Meeting of the CEOS Atmospheric Composition Virtual Constellation (AC-VC-14) NOAA Center for Weather
Greater Toronto Area Cordon Count Summary Analysis of Traffic Trends 1985 to 2011
 Greater Toronto Area Cordon Count Summary Analysis of Traffic Trends 1985 to 2011 Prepared by: Data Management Group Department of Civil Engineering University of Toronto Telephone: (416) 978-3916 Table
Overview of U.S. Forecasting/Outreach Methods
 Overview of U.S. Forecasting/Outreach Methods John E. White, US EPA white.johne@epa.gov NCAR/ASP 2016 Summer Colloquium on Air Quality Outline Air Quality Forecasting in the U.S. How it is done Challenges
J1.7 IMPACT OF THE ON-ROAD AND MOBILE SOURCES ON THE BENZENE AND TOLUENE EMISSIONS AND CONCENTRATIONS IN THE HOUSTON-GALVESTON AREA
 J. IMPACT OF THE ON-ROAD AND MOBILE SOURCES ON THE BENZENE AND TOLUENE EMISSIONS AND CONCENTRATIONS IN THE HOUSTON-GALVESTON AREA Violeta F. Coarfa*, Daewon W. Byun Institute for Multidimensional Air Quality
Know and Respond AQ Alert Service. Paul Willis SCOTTISH AIR QUALITY DATABASE AND WEBSITE ANNUAL SEMINAR Stirling 30 th March 2011
 Know and Respond AQ Alert Service Paul Willis SCOTTISH AIR QUALITY DATABASE AND WEBSITE ANNUAL SEMINAR Stirling 30 th March 2011 Outline: Know and Respond AQ Alert Service Introduction. The Website. How
THE CANADIAN CENTRE FOR CLIMATE MODELLING AND ANALYSIS
 THE CANADIAN CENTRE FOR CLIMATE MODELLING AND ANALYSIS As Canada s climate changes, and weather patterns shift, Canadian climate models provide guidance in an uncertain future. CANADA S CLIMATE IS CHANGING
Canadian TEMPO-related Activities
 Canadian TEMPO-related Activities Chris McLinden Air Quality Research Division, Environment Canada 3 rd TEMPO Science Team Meeting Huntsville, AL 27-28 May 2015 Themes Chemical Data Assimilation Strat-trop
Global Change and Air Pollution (EPA-STAR GCAP) Daniel J. Jacob
 Daniel J. Jacob") Global Change and Air Pollution (EPA-STAR GCAP) and some more recent work on climate-aq interactions Daniel J. Jacob (djacob@fas.harvard.edu) with Eric M. Leibensperger, Shiliang Wu, Amos Tai, and Loretta
Global Change and Air Pollution (EPA-STAR GCAP) and some more recent work on climate-aq interactions Daniel J. Jacob (djacob@fas.harvard.edu) with Eric M. Leibensperger, Shiliang Wu, Amos Tai, and Loretta
Growth Management: Analysis of Comments Received and Responses Comments received as of October 16, 2017
 Growth Management: Analysis of Comments Received and s Comments received as of October 16, Comments informing the Region of Peel s growth management work have been summarized with responses below. These
Central Ohio Air Quality End of Season Report. 111 Liberty Street, Suite 100 Columbus, OH Mid-Ohio Regional Planning Commission
 217 218 Central Ohio Air Quality End of Season Report 111 Liberty Street, Suite 1 9189-2834 1 Highest AQI Days 122 Nov. 217 Oct. 218 July 13 Columbus- Maple Canyon Dr. 11 July 14 London 11 May 25 New Albany
GIS and Cartography at the University of Toronto Technical Paper Series - Paper no. 2
 GCUT - GIS and Cartography at the University of Toronto Technical Paper Series University of Toronto, Department of Geography and Program in Planning This series is published as a technical complement
The North American Drought Monitor - The Canadian Perspective -
 The North American Drought Monitor - The Canadian Perspective - Trevor Hadwen National Agroclimate Information Service AAFC-PFRA, Regina Canmore, Alberta March 16-18, 2008 Background The NADM is a cooperative
Monitoring Survey in the Vicinity of St. Marys Cement: Interim Report
 Technical Memorandum 2017-2018 Monitoring Survey in the Vicinity of St. Marys Cement: Interim Report Ontario Ministry of the Environment & Climate Change Report Prepared by: Terrestrial Assessment and
Regional Growth Strategy Work Session Growth Management Policy Board
 Regional Growth Strategy Work Session Growth Management Policy Board September 6, 2018 1 Overview Recap June GMPB work session Objectives and outcomes Regional geographies Growth scenarios Breakout Discussion:
The Demokritos web-based air quality forecasting system for the Greater Athens Area
 iemss 2008: International Congress on Environmental Modelling and Software Integrating Sciences and Information Technology for Environmental Assessment and Decision Making 4 th Biennial Meeting of iemss,
AERMOD Sensitivity to AERSURFACE Moisture Conditions and Temporal Resolution. Paper No Prepared By:
 AERMOD Sensitivity to AERSURFACE Moisture Conditions and Temporal Resolution Paper No. 33252 Prepared By: Anthony J Schroeder, CCM Managing Consultant TRINITY CONSULTANTS 7330 Woodland Drive Suite 225
Indicator: Proportion of the rural population who live within 2 km of an all-season road
 Goal: 9 Build resilient infrastructure, promote inclusive and sustainable industrialization and foster innovation Target: 9.1 Develop quality, reliable, sustainable and resilient infrastructure, including
Air Quality Modelling under a Future Climate
 Air Quality Modelling under a Future Climate Rachel McInnes Met Office Hadley Centre Quantifying the impact of air pollution on health - Fri 12th Sep 2014 Crown copyright Met Office Rachel.McInnes@metoffice.gov.uk
Atmospheric composition modeling over the Arabian Peninsula for Solar Energy applications
 Atmospheric composition modeling over the Arabian Peninsula for Solar Energy applications S Naseema Beegum, Imen Gherboudj, Naira Chaouch, and Hosni Ghedira Research Center for Renewable Energy Mapping
Estimation of Speciated and Total Mercury Dry Deposition. Leiming Zhang. Pierrette Blanchard, David Gay, and many others
 Estimation of Speciated and Total Mercury Dry Deposition Leiming Zhang Air Quality Research Division, Science and Technology Branch Environment Canada, Toronto. leiming.zhang@ec.gc.ca Contributors: Pierrette
The influence of scale on modelled ground level O3 concentrations
 EMEP /MSC-W Note 2/01 Date July 2001 DET NORSKE METEOROLOGISKE INSTITUTT Norwegian Meteorological Institute Research Report no. 57 The influence of scale on modelled ground level O3 concentrations Philippe
NO X emissions, isoprene oxidation pathways, and implications for surface ozone in the Southeast United States
 NO X emissions, isoprene oxidation pathways, and implications for surface ozone in the Southeast United States Katherine (Katie) Travis CMAS 216: 1/26/16 Co-authors: D. J. Jacob, J. A. Fisher, P. S. Kim,
1.21 SENSITIVITY OF LONG-TERM CTM SIMULATIONS TO METEOROLOGICAL INPUT
 1.21 SENSITIVITY OF LONG-TERM CTM SIMULATIONS TO METEOROLOGICAL INPUT Enrico Minguzzi 1 Marco Bedogni 2, Claudio Carnevale 3, and Guido Pirovano 4 1 Hydrometeorological Service of Emilia Romagna (SIM),
Preliminary Experiences with the Multi Model Air Quality Forecasting System for New York State
 Preliminary Experiences with the Multi Model Air Quality Forecasting System for New York State Prakash Doraiswamy 1, Christian Hogrefe 1,2, Winston Hao 2, Brian Colle 3, Mark Beauharnois 1, Ken Demerjian
Heat Alert and Response Systems in Canada
 Heat Alert and Response Systems in Canada Development of Climate Information Systems for Heat Health Early Warning Workshop Chicago, Illinois July 28-30 Sharon Jeffers Meteorological Service of Canada
Use of climate reanalysis for EEA climate change assessment. Blaz Kurnik. European Environment Agency (EEA)
") Use of climate reanalysis for EEA climate change assessment Blaz Kurnik European Environment Agency (EEA) 2016: EEA content priorities Circular economy Climate and Energy Sustainable Development Goals
Use of climate reanalysis for EEA climate change assessment Blaz Kurnik European Environment Agency (EEA) 2016: EEA content priorities Circular economy Climate and Energy Sustainable Development Goals
CAUL Project 1: Milestone 16: Annual Report on Air Quality Modelling
 CAUL Project 1: Milestone 16: Annual Report on Air Quality Modelling Introduction There have been substantial efforts in the past five years to better characterise the sources of particulate pollution
MCIPv3: Using WRF-EM Output with CMAQ
 MCIPv3: Using WRF-EM Output with CMAQ Tanya L. Otte* and Jonathan E. Pleim* EPA/ORD/NERL/Atmospheric Modeling Division Research Triangle Park, NC *On assignment from NOAA Air Resources Laboratory Disclaimer:
Appendix O. Sediment Transport Modelling Technical Memorandum
 Appendix O Sediment Transport Modelling Technical Memorandum w w w. b a i r d. c o m Baird o c e a n s engineering l a k e s design r i v e r s science w a t e r s h e d s construction Final Report Don
CLIMATE EXTREMES AND GLOBAL WARMING: A STATISTICIAN S PERSPECTIVE
 CLIMATE EXTREMES AND GLOBAL WARMING: A STATISTICIAN S PERSPECTIVE Richard L. Smith Department of Statistics and Operations Research University of North Carolina, Chapel Hill rls@email.unc.edu Statistics
MODELING CHEMICALLY REACTIVE AIR TOXICS IN THE SAN FRANCISCO BAY AREA USING CAMx
 MODELING CHEMICALLY REACTIVE AIR TOXICS IN THE SAN FRANCISCO BAY AREA USING CAMx Chris Emery*, Ed Tai, and Greg Yarwood ENVIRON International Corporation, Novato, CA, United States Phil Martien and Saffet
TORONTO'S FUTURE WEATHER & CLIMATE DRIVER STUDY: OUTCOMES REPORT
 TORONTO'S FUTURE WEATHER & CLIMATE DRIVER STUDY: OUTCOMES REPORT Summary of the SENES Consultants Ltd Study by Toronto Environment Office October 30, 2012 Less Snowfall Expected in 2040-2049 (in centimetres)
Regional methane emissions estimates in northern Pennsylvania gas fields using a mesoscale atmospheric inversion system
 Regional methane emissions estimates in northern Pennsylvania gas fields using a mesoscale atmospheric inversion system Thomas Lauvaux1, A. Deng1, B. Gaudet1, S. J. Richardson1, N. L. Miles1, J. N. Ciccarelli1,2,
Statistical integration of disparate information for spatially-resolved PM exposure estimation
 Statistical integration of disparate information for spatially-resolved PM exposure estimation Chris Paciorek Department of Biostatistics May 4, 2006 www.biostat.harvard.edu/~paciorek L Y X - FoilT E X
EBA Engineering Consultants Ltd. Creating and Delivering Better Solutions
 EBA Engineering Consultants Ltd. Creating and Delivering Better Solutions ENHANCING THE CAPABILITY OF ECOSYSTEM MAPPING TO SUPPORT ADAPTIVE FOREST MANAGEMENT Prepared by: EBA ENGINEERING CONSULTANTS LTD.
Getting Biodiversity Data
 Getting Biodiversity Data NatureServe Canada Douglas Hyde Executive Director Value of biodiversity data to business? Reasons vary depending on the business Reduce development uncertainty Integrated views
Scientific Insight from CAMx & OSAT Modeling. Presented by: Dan Goldberg Thursday April 23 rd, 2015 Spring OTC Meeting
 Scientific Insight from CAMx & OSAT Modeling Presented by: Dan Goldberg Thursday April 23 rd, 2015 Spring OTC Meeting Description of model used: CAMx v6.10 (12 km OTC model domain) EPA-approved regulatory
NOAA Surface Weather Program
 NOAA Surface Weather Program Maintenance Decision Support System Stakeholder Meeting #9 Jim O Sullivan NOAA Surface Weather Program Manager NWS Office of Climate, Water, and Weather Services September
Multivariate Regression Model Results
 Updated: August, 0 Page of Multivariate Regression Model Results 4 5 6 7 8 This exhibit provides the results of the load model forecast discussed in Schedule. Included is the forecast of short term system
Seasonality of Arctic Black Carbon Processes in the AMAP Multi-Model Ensemble
 Seasonality of Arctic Black Carbon Processes in the AMAP Multi-Model Ensemble R. Mahmood 1,2, K. von Salzen 3, M.G. Flanner 4, M. Sand 5, J. Langner 6, H. Wang 7, and L. Huang 8 1 School of Earth and Ocean
Project Summary. Sanford Sillman. is a way to evaluate the sensitivity to its two main precursors, nitrogen oxides (NO x
 United States National Exposure Environmental Protection Research Laboratory Agency Research Triangle Park, NC 27711 Research and Development EPA/600/SR98/022 May 1998 Project Summary Evaluating the Relation
Investigating the urban climate characteristics of two Hungarian cities with SURFEX/TEB land surface model
 Investigating the urban climate characteristics of two Hungarian cities with SURFEX/TEB land surface model Gabriella Zsebeházi Gabriella Zsebeházi and Gabriella Szépszó Hungarian Meteorological Service,
P1.10 AN EXAMPLE OF THE INFLUENCE OF METEOROLOGICAL CONDITIONS ON GROUND-LEVEL OZONE CONCENTRATIONS IN SOUTHERN ONTARIO
 P1.1 AN EXAMPLE OF THE INFLUENCE OF METEOROLOGICAL CONDITIONS ON GROUND-LEVEL OZONE CONCENTRATIONS IN SOUTHERN ONTARIO Frank S. Dempsey* Member of American Meteorological Society, Pickering, Ontario, Canada
INDUSTRIAL MARKET OVERVIEW
 INDUSTRIAL MARKET OVERVIEW Presented to: Metro Vancouver Planning Committee Presented by: Curtis Scott Manager, Market Intelligence Western Roy Pat Industrial Sales & Leasing Canada Vancouver PRESENTATION
Regional groundwater mapping and model
 Regional groundwater mapping and model Boyd, Dwight 1, Steve Holysh 2, and Jeff Pitcher 1 1 Grand River Conservation Authority, Canada; 2 Regional Municipality of Halton, Canada The Grand River forms one
Analysing Australian Temperature Trends
 Analysing Australian Temperature Trends By Andrew Barnham The article Australian warming trend adjusted up by 40% was published on Jo Nova's blog on 29th July 2010. This work by Ken really caught my attention
Recent Performance of the NOAA Air Quality Forecasting Capability and the Impact of Driving Meteorology
 Recent Performance of the NOAA Air Quality Forecasting Capability and the Impact of Driving Meteorology http://www.emc.ncep.noaa.gov/mmb/aq Jeff McQueen, Jianping Huang, Ho-Chun Huang, Perry Shafran NCEP/EMC
Recent Ozone Modeling Results
 Recent Ozone Modeling Results Presentation by: Dan Goldberg, Ph.D. Candidate Co-authors: Tim Canty, Tim Vinciguerra, Ross Salawitch & Russ Dickerson Presented at the MARAMA Science Meeting Wednesday July
Developments in ADMS-Airport and its Applications to Heathrow Airport. IAE (Institute of Aviation and the Environment) Cambridge, June
 Cambridge, June") Developments in ADMS-Airport and its Applications to Heathrow Airport David Carruthers Cambridge Environmental Research Consultants IAE (Institute of Aviation and the Environment) Cambridge, June 23 28
Developments in ADMS-Airport and its Applications to Heathrow Airport David Carruthers Cambridge Environmental Research Consultants IAE (Institute of Aviation and the Environment) Cambridge, June 23 28
Modeling Study of Atmospheric Boundary Layer Characteristics in Industrial City by the Example of Chelyabinsk
 Modeling Study of Atmospheric Boundary Layer Characteristics in Industrial City by the Example of Chelyabinsk 1. Introduction Lenskaya Olga Yu.*, Sanjar M. Abdullaev* *South Ural State University Urbanization
BIG IDEAS. Area of Learning: SOCIAL STUDIES Urban Studies Grade 12. Learning Standards. Curricular Competencies
 Area of Learning: SOCIAL STUDIES Urban Studies Grade 12 BIG IDEAS Urbanization is a critical force that shapes both human life and the planet. The historical development of cities has been shaped by geographic,
NDIA System Engineering Conference 26 October Benjie Spencer Chief Engineer, NOAA/National Weather Service
 NDIA System Engineering Conference 26 October 2015 Benjie Spencer Chief Engineer, NOAA/National Weather Service The National Weather Service of the Future: Building a Weather-Ready Nation Previous NWS
Economic Activity Economic A ctivity
 5 Economic Economic Activity Activity ECONOMIC ACTIVITY 5.1 EMPLOYMENT... 5-7 5.1.1 OBJECTIVE... 5-7 5.1.2 POLICIES... 5-7 5.2 PROTECTING THE AREA OF EMPLOYMENT... 5-9 5.2.1 OBJECTIVE... 5-9 5.2.2 POLICIES...
Prediction of Climate Change Impacts in Tanzania using Mathematical Models: The Case of Dar es Salaam City
 Prediction of Climate Change Impacts in Tanzania using Mathematical Models: The Case of Dar es Salaam City By Guido Uhinga PhD Student (Climate Change) Ardhi University Local Climate Solutions for Africa
SCICHEM: A Puff Model with Chemistry. Part 2: Ozone and Particulate Matter
 SCICHEM: A Puff Model with Chemistry Part 2: Ozone and Particulate Matter Eladio Knipping, Naresh Kumar Environment Sector Electric Power Research Institute Presentation at EPA Regional, State and Local
Chemical Transport of Atmospheric Mercury over the Pacific
 Chemical Transport of Atmospheric Mercury over the Pacific C. Jerry Lin 1, Li Pan 1, David G. Streets 2, Carey Jang 3, and Terry Keating 4 1 College of Engineering, Lamar University, Beaumont, TX 2 ANL
DCHC MPO. Socioeconomic Data (SE Data) Guide Totals. Purpose. Actions. Use of Guide Totals. Partial Counties and Map. Population Guide Totals
 Guide Totals. Purpose. Actions. Use of Guide Totals. Partial Counties and Map. Population Guide Totals") DCHC MPO Socioeconomic Data (SE Data) Guide Totals Purpose This document presents: Information on how guide totals are used; Population and employment guide totals for counties in the Triangle Regional
DCHC MPO Socioeconomic Data (SE Data) Guide Totals Purpose This document presents: Information on how guide totals are used; Population and employment guide totals for counties in the Triangle Regional
Climate Change in the Northeast: Past, Present, and Future
 Climate Change in the Northeast: Past, Present, and Future Dr. Cameron Wake Institute for the Study of Earth, Oceans, and Space (EOS) University of New Hampshire 62nd Annual Meeting of the Northeastern
INSPIRE in the context of EC Directive 2002/49/EC on Environmental Noise
 INSPIRE in the context of EC Directive 2002/49/EC on Environmental Noise Simon Shilton Acustica Ltd, United Kingdom Nigel Jones Extrium Ltd, United Kingdom About the Authors www.acustica.co.uk Acoustics