|
|
|
- Shanon Woods
- 6 years ago
- Views:
Transcription
1 Contributors: Arlene Fiore 1, Lee Murray 1, Luke Valin 1, Olivia Clifton 1, Jean Guo 1 Author: Melissa Seto 1 Analysis of Wisconsin 2007 High-Ozone event Section 1A: Can satellite NO 2 columns inform us about the spatial scale and regional transport of ozone pollution episodes such as the one identified by the Wisconsin Department of Natural Resources from June 10-18, 2007? Nitrogen dioxide (NO 2 ) is relevant to understanding ozone pollution because nitrogen oxides (NO x NO + NO 2 ) are precursors to ozone. That is, the photolysis of NO 2 leads to the production of ozone. Consequently, high NO 2 concentrations may lead to high ozone concentrations. While NO 2 stays in the polluted boundary layer for less than a day, ozone typically remains for a few days in the Eastern U.S. boundary layer during summer. Consequently, ozone regional transport can be inferred from ground-based data. However, it remains unclear whether NO 2 stays in the air long enough to use the NO 2 columns retrieved from satellite data as a proxy for regional transport. Below, we explore whether satellite NO 2 data can inform us about the spatial scale of ozone pollution episodes. For each day of the WI episode, we have included (1) a map of Environmental Protection Agency (EPA) Air Quality System (AQS) maximum daily 8-hour average (MDA8) surface ozone 2 in parts per billion (ppb), (2) a map of NO 2 anomalies in units of molecules/cm 2, and (3) a National Oceanographic and Atmospheric Association (NOAA) weather map 3. Before we analyze the maps in detail, we provide a brief overview of the information provided by these maps and the data collection techniques. Ozone concentrations in parts per million are sampled every hour and the EPA AQS MDA8 metric is calculated by computing twenty-four over-lapping 8-hour averages (i.e., 12-7am, 1-8am) and taking the highest 8-hour average per day. The NO 2 anomalies are calculated by subtracting mean NO 2 during May, June, July and August (MJJA) from the daily NO 2 at each location. Therefore, the more positive (red) the anomaly, the greater it exceeds the summer average. The instrument that measures NO 2 is called the Ozone Monitoring Instrument (OMI), which flies aboard National Aeronautics and Space Administration s Aura satellite. The OMI has a spatial sampling resolution as fine as 13 km x 24 km. The satellite overpass time (i.e. when the satellite passes over the location on the map) is 1:30 PM. While the current NO 2 anomaly plots do not differentiate lack of observations from zero anomaly, we will update this by plotting zero anomalies in grey in future maps. 1 Columbia University/ Lamont-Doherty Earth Observatory 2 We provide animations of AQS MDA8 ozone data for each year from 2006 to 2013 at: 3 Downloaded from 1
2 The NOAA weather maps help us visualize the meteorological conditions that may contribute to the regional movement of high ozone concentrations across the eastern U.S. The weather maps used in this report are taken from 7 AM of each particular day. In general, high pressure systems (labeled with High and red lines) are associated with fewer clouds and higher ambient air pollution concentrations. Low pressure systems are associated with more clouds and precipitation and lower ambient air pollution concentrations. Section 2A: GEOS-Chem simulations for source attribution during the June eastern U.S. ozone event We are interested in answering five questions with the GEOS-Chem simulations: (1) To what extent is the model capturing the AQS observations? (2) How does the North American Background (NAB) simulation compare with the Base and Observed (AQS)? (3) How is the NAB contributing to the observed pollution event? (4) What is the Wisconsin contribution to the event? (5) How much are other states, Canada, and Mexico contributing to the observed event? GEOS-Chem is a three-dimensional, global model of atmospheric composition. The version we use is driven by meteorology from the Goddard Earth Observation System (GEOS) of the National Aeronautics and Space Administration s (NASA) Global Modeling Assimilation Office. Emissions are from the global EDGAR and RETRO (for anthropogenic VOC) inventories, but replaced over the USA by NEI95 except for biofuels which use NEI99. (Other regional replacements include: Canada by CAC; Mexico by BRAVO; Europe by EMEP; East Asia by Streets et al. (2006)). Different scaling factors are applied for weekday versus weekend, month, and year. We use this model at 2º latitude x 2.5º longitude horizontal resolution to generate simulations of the Wisconsin 2007 event, including: (1) Base, (2) North American Background (NAB), and (3) No WI contribution (No-WI). The base case simulation includes all relevant processes to try to match the observed ozone concentrations during the nine-day event. The better the base GEOS-Chem simulation matches the EPA AQS data, the more reliable the model. We note that GEOS-Chem has been extensively evaluated in numerous prior publications ( The NAB simulation represents ozone levels that would exist if anthropogenic emissions from North American countries such as Canada, U.S. and Mexico were set to zero. Thus, the NAB simulation includes natural sources of ozone, ozone produced by countries outside of North America, and ozone transported from the stratosphere (EPA, 2006). The No-WI simulation sets the Wisconsin anthropogenic emissions to zero 4. By subtracting the No-WI simulation from the base case, we can deduce the WI ozone contribution to the 2007 episode: Base case (No-WI) = WI contribution. 4 We could run these zero-out simulations relatively quickly for a first look for air quality agencies if it would be useful before they run their high resolution regional models with their preferred emissions inventories. 2
3 Section 1B: Day-by-day explanations of observed ozone, NO 2 anomalies, and weather maps The following pages are detailed explanations of the ozone, NO 2, and weather maps for each day in the Wisconsin 2007 episode. Please note that our section on source attribution during the June Eastern U.S. ozone event using GEOS-Chem simulations begins on page 13. 3


4 June 10, Sunday Since this day is during the weekend, there is relatively low diesel truck and automobile activity. Therefore, the NO 2 and ozone concentrations are on the low side as shown by the mostly yellow, green or blue dots in Figures 1 and 2. Figure 1 suggests that the ozone pollution event in Wisconsin started locally around the coast of Lake Michigan. The weather map in Figure 3 shows that there is a high pressure system centered over Lake Erie. Figure 2: NO2 anomalies (molecules/cm 2 ) Figure 1: EPA AQS MDA8 Ozone Figure 3: NOAA Weather Map 4

 seem to spread west as the high pressure system moves in the same direction (Fig. 6).")
5 June 11, 2007: Monday On Monday, a business day, NO 2 emissions are higher. The regional extent of the high pressure system, now centered over eastern Michigan, extends southward and westward. As a result, we see a band of orange and red dots indicating higher concentrations in the NO 2 map in Figure 5. The NO 2 positive anomalies (Fig. 5) seem to spread west as the high pressure system moves in the same direction (Fig. 6). Furthermore, the local ozone event has now spread to include most of Mid-western U.S. Figure 5 Figure 4 Figure 6 5

6 June 12, 2007: Tuesday The high pressure system continues to move west and is now centered over northern Michigan (Fig. 9). The system seems to transport high concentrations of both ozone and NO 2 westward to states including Ohio, Kentucky, Indiana, Wisconsin, Minnesota, and Iowa. Both Figures 7 and 8 support the regional nature of this pollution event. Figure 8 Figure 7 Figure 9 6
. Yet, parts of the plumes also move north into northernmost Minnesota (Figures 10 and 11).")
7 June 13, 2007: Wednesday As the high pressure system progresses in the southwest direction (Figure 12), both ozone and NO 2 high concentration plumes move southward and westward (Figures 10 and 11). Yet, parts of the plumes also move north into northernmost Minnesota (Figures 10 and 11). Figure 11 Figure 10 Figure 12 7
. Both ozone concentrations and NO 2 anomalies move westward and are highest from approximately 88-95ºW (Figs. 13 and 14). This marks the westernmost extent of the regional ozone episode.")
8 June 14, 2007: Thursday The high pressure influence over the Midwest decreases (Figure 15). A cold front moving southeastward leads to low ozone along the Eastern seaboard (Fig. 15). Pollution accumulates along the stationary front located at approximately 100ºW (Figs. 13 and 14). Both ozone concentrations and NO 2 anomalies move westward and are highest from approximately 88-95ºW (Figs. 13 and 14). This marks the westernmost extent of the regional ozone episode. The high pressure system centered over Colorado (Fig. 15) likely contributes to the accumulation of ozone over Colorado and New Mexico as shown in Figure 13. The ozone enhancements are also associated with positive NO 2 anomalies over that region (Figure 14). Figure 13 Figure 14 Figure 15 8
.")

9 June 15, 2007: Friday The high pressure system contributing to the eastern U.S. ozone episode is now centered over Pennsylvania (Fig 18). Consequently, the ozone plume is pushed eastward (Fig 16). The direction of movement of the NO 2 plume is unclear here, but we see enhancements over the Ohio River Valley source region (Fig 17). Figure 17 Figure 16 Figure 18 9


10 June 16, 2007: Saturday The high pressure system moves southeast (Fig 21). While the ozone plume generally moves southeast with a narrow band extending into the Central U.S., Michigan now shows higher ozone concentrations (Fig 19). Similarly, the plume of NO 2 enhancements appears to progress in the same direction (Fig 20). gure 19 Figure 20 Figure 21 10
. As the high pressure system moves eastward and the cold front sweeps southward of the Great Lakes, the ozone plume moves eastward (Fig 22 and 24).")
11 June 17, 2007: Sunday On Sunday, the decrease in diesel truck and automobile activity during the weekend leads to more blue dots in the NO 2 plot, indicating negative anomalies (Fig 23) but the ozone concentrations remain high (Fig 24). As the high pressure system moves eastward and the cold front sweeps southward of the Great Lakes, the ozone plume moves eastward (Fig 22 and 24). Figure 42 Figure 33 Figure 24 11
 between the advancing cold fronts (Figs.")
12 June 18, 2007: Monday The cold front has led to cleaner air over the New England states (Figures 25 and 27). Ozone and NO 2 anomalies are now confined to a narrow band (i.e. Michigan, Ohio, western Pennsylvania, West Virginia, Virginia, and North Carolina) between the advancing cold fronts (Figs ). gure 25 Figure 26 Figure 27 12
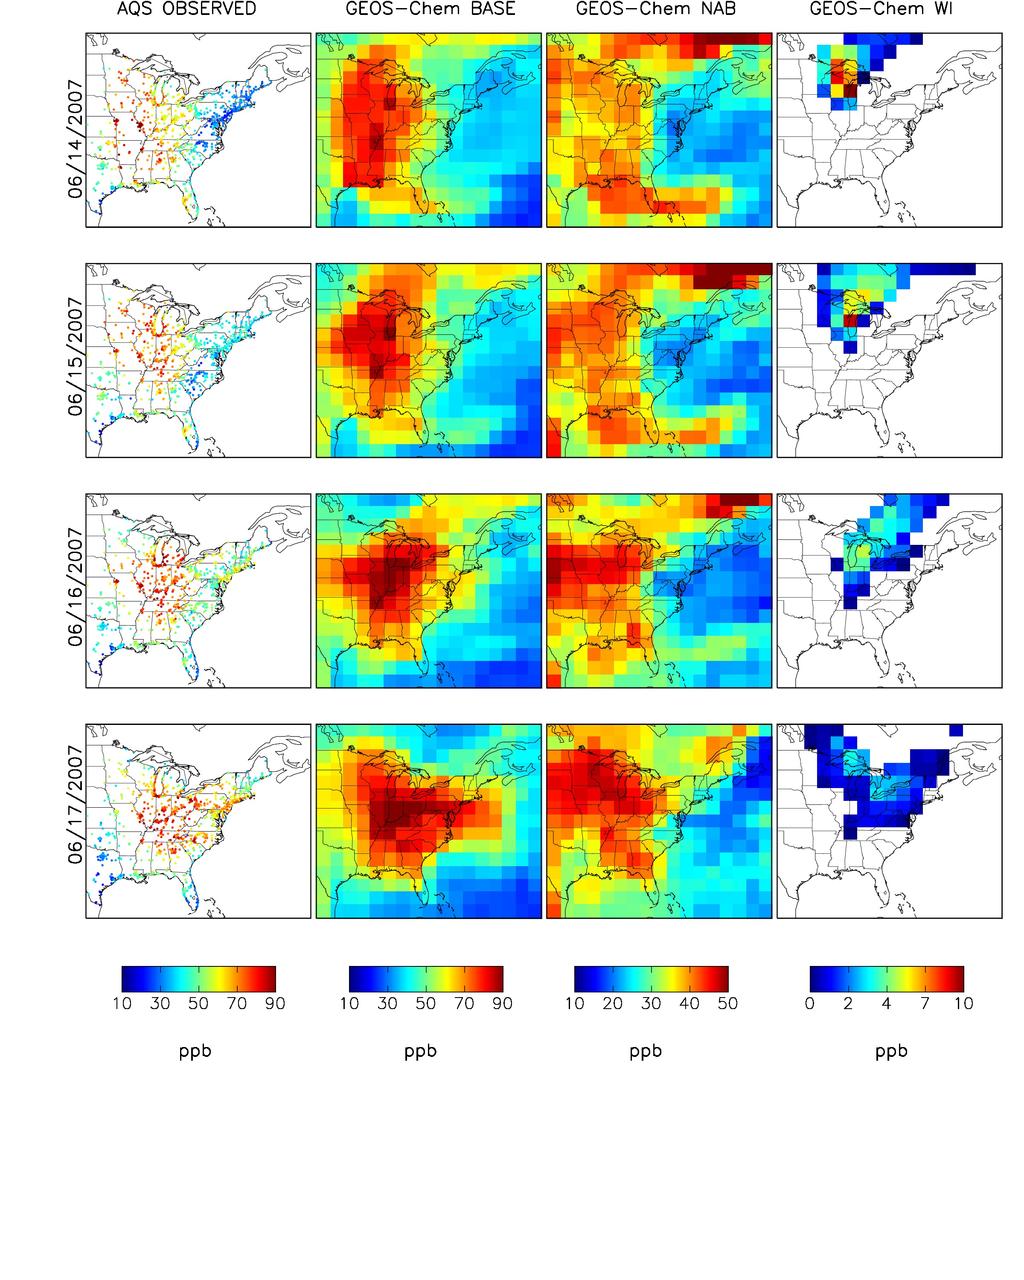
13 Section 2B: Analysis of Source Attribution with AQS Observations and GEOS-Chem Simulation Plots (1) To what extent is the model capturing the AQS observations? When we directly compare the AQS maximum daily 8-hour average (MDA8) ozone maps with the GEOS-Chem Base simulations, we find that the model approximately captures the observed ozone concentrations. For example, on Sunday, June 10, both the Base and AQS maps show relatively low ozone concentrations (blue and green) along the east coast with some medium concentrations (yellow and orange) in southeastern states, such as Mississippi and Alabama, and Midwestern states around Lake Michigan including Wisconsin. On Monday June 11, the AQS observations show an increase in ozone concentrations around Lake Michigan as indicated by the red dots; similarly, the Base simulation displays higher concentrations (red) around Lake Michigan. Between June 10 and 15, both AQS and Base show a progression of high ozone concentrations (orange and red) that eventually covers Wisconsin. Between June 16 and 18, the high concentration plume moves back east, as discussed in the context of weather patterns in the Figures in Section 1. (2) How does the North American Background (NAB) compare with the Base and Observed (AQS)? Whereas the Base and Observed maps show a regional high concentration (red) ozone plume around the Great Lakes and the Southeast region on June 10-11, the NAB maps suggest that NAB is highest over states to the west of where the highest total surface ozone concentration occur (including over Minnesota, Iowa, North Dakota, South Dakota, and Nebraska). NAB levels are also higher over northeastern Canada, possibly associated with wildfires (Figure 29). A smaller, medium concentration (yellow and orange) NAB plume occurs over the Southeastern states (Florida, Georgia, Alabama, Mississippi), possibly from lightning activity associated with the frontal systems over that region on these days (Figures 3 and 6). (3) How is the NAB contributing to the observed pollution event? During the event, the NAB levels range from about ppb (yellow, orange, and red) over the state of Wisconsin. The highest NAB ozone during the event occurs on June 16-17, which is when total surface ozone over WI is not particularly high. The highest values over WI are thus not driven by NAB, but rather by ozone produced from anthropogenic emissions. On the days when observed surface ozone is highest over WI (June 14-15), the NAB contribution is generally below ppb. (4) What is the Wisconsin contribution to the event? The GEOS-Chem WI maps indicate the Wisconsin contribution to the event is small. June 13 to 15 are the only days in the event when the concentrations directly above or near Wisconsin exceed 4 ppb (yellow, orange, or red), and these are also days when total ozone is 13
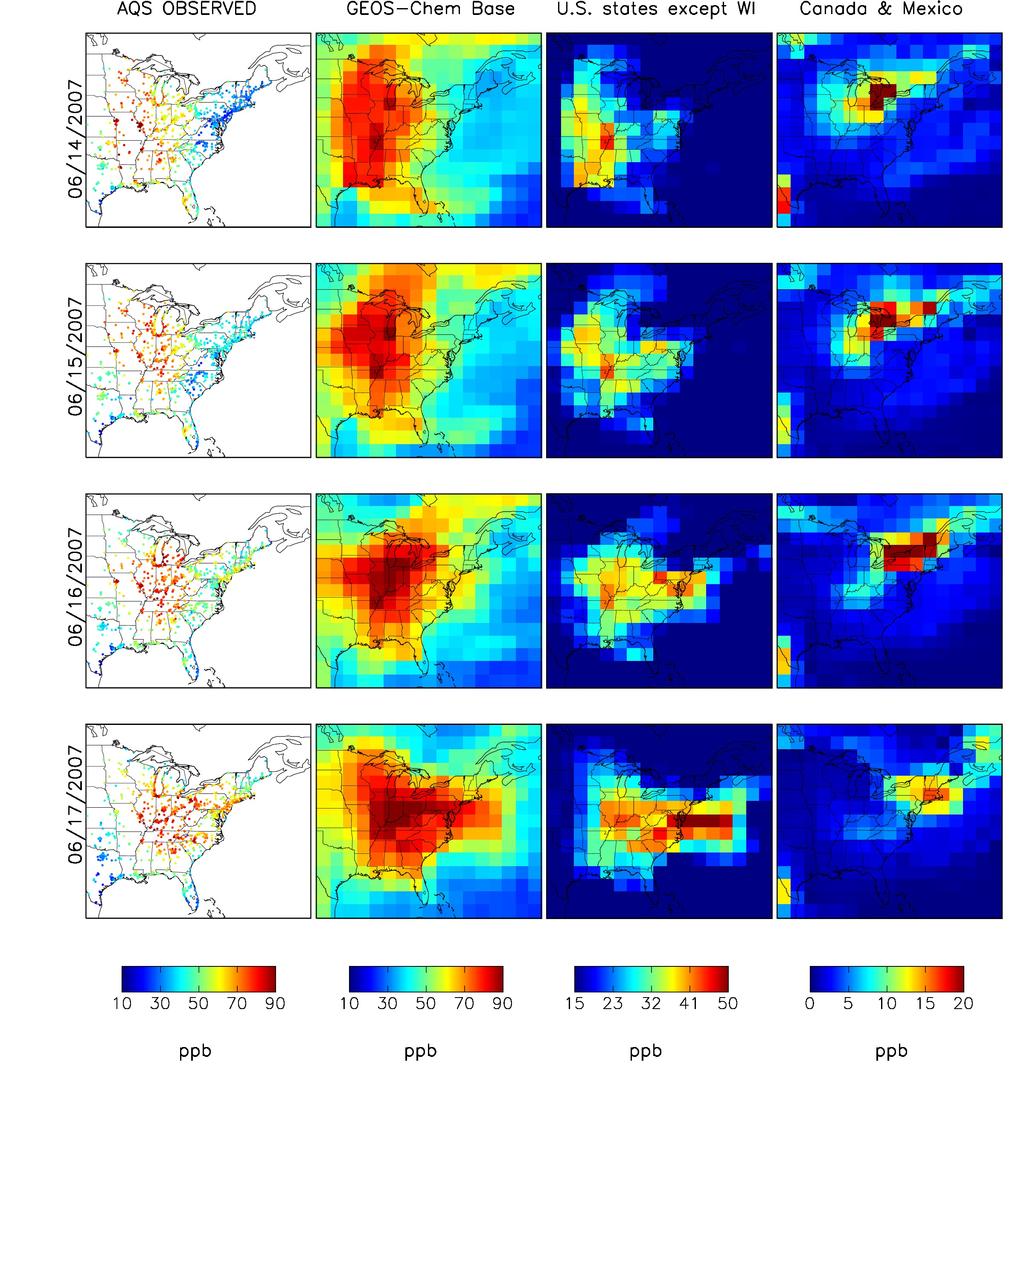
14 highest. On these days, the maximum contribution of WI emissions over WI is 10 ppb. On June 11 and 12 when total surface ozone is similarly high over WI, the WI contribution does not exceed 6-7 ppb (yellow). (5) How much are other states, Canada, and Mexico contributing to the observed event? The spatial patterns of high anthropogenic ozone contribution from U.S. states except WI (third column, Figure 30) correspond with high observed ozone (first column, Fig. 30). For example, during June 16-18, there is a band of medium to high ozone (yellow, orange, and red) extending from the East coast into the Midwest (third column, Figure 30) and a band of medium to high ozone over a similar region on the observed maps (first column, Figure 30). Because the model and observed spatial and temporal variability agree, we infer that other states add about ppb to the regional ozone event and ppb over WI specifically during June The combined Canadian and Mexican anthropogenic contribution (fourth column, Figure 30) shows the greatest influence in northeastern U.S, adding approximately ppb of ozone (green, yellow, orange, and red) to the northeastern U.S. (fourth column, Fig. 30). In contrast, Canada and Mexico contribute close to zero ppb (blue) to Wisconsin specifically, except for June when they add approximately 5-10 ppb to WI (fourth column, Fig. 30). We infer that Canadian rather than Mexican sources are contributing to ozone concentrations over New England and upper Midwest states. 14

15 Figure 28: Source attribution for ozone during WI 2007 event. This plot extends from pages WI contribution was calculated by: GEOS-Chem Base No WI contribution = WI contribution. In order to enhance readability, the color bars of the four columns of maps have different ranges. The AQS observed and GEOS-Chem Base maps have the same color bar range (10-90 ppb) because we wanted to evaluate the accuracy of GEOS-Chem. 15
16 16
17 17

18 Figure 29: Northeastern Canada wildfire map. Obtained from 18
 was calculated by subtracting the NAB from the US background.")
19 Figure 30: Source attribution for WI 2007 high-ozone event using GEOS-Chem simulations. This plot continues from page 19 to page 21. The anthropogenic contribution from all U.S. states except WI (third column from left) was calculated by subtracting US background from the No-WI contribution. The Canadian and Mexican contribution (rightmost column) was calculated by subtracting the NAB from the US background. In order to enhance readability, the color bars of the four columns of maps have different ranges. The AQS observed and GEOS-Chem Base maps have the same color bar range (10-90 ppb) because we wanted to evaluate the accuracy of GEOS-Chem. 19
20 20
21 21
Central Ohio Air Quality End of Season Report. 111 Liberty Street, Suite 100 Columbus, OH Mid-Ohio Regional Planning Commission
 217 218 Central Ohio Air Quality End of Season Report 111 Liberty Street, Suite 1 9189-2834 1 Highest AQI Days 122 Nov. 217 Oct. 218 July 13 Columbus- Maple Canyon Dr. 11 July 14 London 11 May 25 New Albany
The climate change penalty on US air quality: New perspectives from statistical models
 The climate change penalty on US air quality: New perspectives from statistical models Charles River Path, Boston, July 2010 Salt Lake City, January 2013 Loretta J. Mickley, Lu Shen, Xu Yue Harvard University
Erik Kabela and Greg Carbone, Department of Geography, University of South Carolina
 Downscaling climate change information for water resources Erik Kabela and Greg Carbone, Department of Geography, University of South Carolina As decision makers evaluate future water resources, they often
William Battye * EC/R Incorporated, Chapel Hill, NC. William Warren-Hicks, Ph.D. EcoStat, Inc., Mebane, NC
 MODULATING EMISSIONS FROM ELECTRIC GENERATING UNITS AS A FUNCTION OF METEOROLOGICAL VARIABLES William Battye * EC/R Incorporated, Chapel Hill, NC William Warren-Hicks, Ph.D. EcoStat, Inc., Mebane, NC Steve
Standard Indicator That s the Latitude! Students will use latitude and longitude to locate places in Indiana and other parts of the world.
 Standard Indicator 4.3.1 That s the Latitude! Purpose Students will use latitude and longitude to locate places in Indiana and other parts of the world. Materials For the teacher: graph paper, globe showing
Global Change and Air Pollution (EPA-STAR GCAP) Daniel J. Jacob
 Daniel J. Jacob") Global Change and Air Pollution (EPA-STAR GCAP) and some more recent work on climate-aq interactions Daniel J. Jacob (djacob@fas.harvard.edu) with Eric M. Leibensperger, Shiliang Wu, Amos Tai, and Loretta
Global Change and Air Pollution (EPA-STAR GCAP) and some more recent work on climate-aq interactions Daniel J. Jacob (djacob@fas.harvard.edu) with Eric M. Leibensperger, Shiliang Wu, Amos Tai, and Loretta
Application of Aura/OMI PBL SO 2 product for estimating SO 2 emissions and future enhancements from new satellite missions
 Application of Aura/OMI PBL SO 2 product for estimating SO 2 emissions and future enhancements from new satellite missions 1 N. Krotkov, 2 V. Fioletov, 3,1 K. Yang, 4,1 Can Li, 3 R. Dickerson & Aura/OMI
CropCast Daily Agri-Highlights Don Keeney Monday, July 25, 2016
 VHI Image Date: July 15, 2016 USA Corn Soybeans Vegetative Health Index Map and Crop Condition Tendency EUROPE Corn BLACK SEA INDIA Soybeans Groundnuts CHINA Corn Soybeans ARGENTINA BRAZIL Safrinha Corn
Correction to Spatial and temporal distributions of U.S. winds and wind power at 80 m derived from measurements
 JOURNAL OF GEOPHYSICAL RESEARCH, VOL. 109,, doi:10.1029/2004jd005099, 2004 Correction to Spatial and temporal distributions of U.S. winds and wind power at 80 m derived from measurements Cristina L. Archer
End of Ozone Season Report
 End of Ozone Season Report Central Ohio: April 1 through October 31, 2016 The Mid-Ohio Regional Planning Commission (MORPC) is part of a network of agencies across the country that issues daily air quality
Impacts of the April 2013 Mean trough over central North America
 Impacts of the April 2013 Mean trough over central North America By Richard H. Grumm National Weather Service State College, PA Abstract: The mean 500 hpa flow over North America featured a trough over
CropCast Corn and Soybean Report Kenny Miller Tuesday, March 14, 2017
 Accumulated Rainfall (inches) Accumulated GDDs Temperature ( F)/Wind Speed (mph) Precipitation (inches) CropCast Corn and Soybean Report Kenny Miller Tuesday, March 14, 2017 Peoria, IL Regional Forecast
Weather and Climate Summary and Forecast October 2017 Report
 Weather and Climate Summary and Forecast October 2017 Report Gregory V. Jones Linfield College October 4, 2017 Summary: Typical variability in September temperatures with the onset of fall conditions evident
High School World History Cycle 2 Week 2 Lifework
 Name: Advisory: Period: High School World History Cycle 2 Week 2 Lifework This packet is due Monday, November 7 Complete and turn in on Friday for 10 points of EXTRA CREDIT! Lifework Assignment Complete
Monthly Long Range Weather Commentary Issued: SEPTEMBER 19, 2016 Steven A. Root, CCM, Chief Analytics Officer, Sr. VP,
 Monthly Long Range Weather Commentary Issued: SEPTEMBER 19, 2016 Steven A. Root, CCM, Chief Analytics Officer, Sr. VP, sroot@weatherbank.com SEPTEMBER 2016 Climate Highlights The Month in Review The contiguous
Crop / Weather Update
 Crop / Weather Update Corn Crop Condition Percent of Acreage Rated Good or Excellent 85 80 75 70 65 60 55 50 45 As of September 9, USDA rates the crop at 68% good to excellent. The rating is up one point
CropCast Corn and Soybean Report Kenny Miller Monday, March 13, 2017
 Accumulated Rainfall (inches) Accumulated GDDs Temperature ( F)/Wind Speed (mph) Precipitation (inches) CropCast Corn and Soybean Report Kenny Miller Monday, March 13, 2017 Peoria, IL Regional Forecast
Activity: A Satellite Puzzle
 Activity: A Satellite Puzzle Introduction Satellites provide unique views of Earth. The imagery acquired by these space platforms reveal weather systems and broad-scale circulation patterns that can be
Custom Weather Forecast
 1 of 23 Custom Weather Forecast 2018 Chicago Yacht Club s Race To Mackinac- Cruising Division Disclaimer: The user assumes all risk related to the use of this Custom Weather Forecast. The crew of the participating
Weather and Climate Summary and Forecast March 2018 Report
 Weather and Climate Summary and Forecast March 2018 Report Gregory V. Jones Linfield College March 7, 2018 Summary: The ridge pattern that brought drier and warmer conditions from December through most
Weather Report 05 January 2018
 Weather Report 05 January 2018 South Africa - Weather Crop conditions will remain generally favorable across eastern South Africa during the next two weeks. Net drying will gradually reduce soil moisture,
CropCast Corn and Soybean Report Kyle Tapley Monday, March 20, 2017
 Accumulated Rainfall (inches) Accumulated GDDs Temperature ( F)/Wind Speed (mph) Precipitation (inches) CropCast Corn and Soybean Report Kyle Tapley Monday, March 20, 2017 Peoria, IL Regional Forecast
National Wildland Significant Fire Potential Outlook
 National Wildland Significant Fire Potential Outlook National Interagency Fire Center Predictive Services Issued: April 1, 2008 Next Issue: May 1, 2008 Wildland Fire Outlook April 2008 through July 2008
Monthly Long Range Weather Commentary Issued: APRIL 18, 2017 Steven A. Root, CCM, Chief Analytics Officer, Sr. VP,
 Monthly Long Range Weather Commentary Issued: APRIL 18, 2017 Steven A. Root, CCM, Chief Analytics Officer, Sr. VP, sroot@weatherbank.com MARCH 2017 Climate Highlights The Month in Review The average contiguous
Chapter. Organizing and Summarizing Data. Copyright 2013, 2010 and 2007 Pearson Education, Inc.
 Chapter 2 Organizing and Summarizing Data Section 2.1 Organizing Qualitative Data Objectives 1. Organize Qualitative Data in Tables 2. Construct Bar Graphs 3. Construct Pie Charts When data is collected
National Wildland Significant Fire Potential Outlook
 National Wildland Significant Fire Potential Outlook National Interagency Fire Center Predictive Services Issued: September, 2007 Wildland Fire Outlook September through December 2007 Significant fire
Weather and Climate Summary and Forecast March 2019 Report
 Weather and Climate Summary and Forecast March 2019 Report Gregory V. Jones Linfield College March 2, 2019 Summary: Dramatic flip from a mild winter to a top five coldest February on record in many locations
Preview: Making a Mental Map of the Region
 Preview: Making a Mental Map of the Region Draw an outline map of Canada and the United States on the next page or on a separate sheet of paper. Add a compass rose to your map, showing where north, south,
Regional Haze Metrics Trends and HYSPLIT Trajectory Analyses. May 2017
 Regional Haze Metrics Trends and HYSPLIT Trajectory Analyses May 2017 Principal Contributors: Tom Downs, CCM, ME DEP Project manager Martha Webster, ME DEP Trajectory analyses and GIS mapping Rich Greves,
3. As warm, moist air moves into a region, barometric pressure readings in the region will generally 1. decrease 2. increase 3.
 Teacher: Mr. Prizzi Castle Learning Review 1 1. Which process most directly results in cloud formation? 1. condensation 3. precipitation 2. transpiration 4. radiation 2. An air mass originating over north
TROPICAL STORM HARVEY BRIEFING
 TROPICAL STORM HARVEY BRIEFING 10:00 AM CDT Sunday, August 27, 2017 Prepared by: NWS LIX NWSNewOrleans www.weather.gov/neworleans Situation Overview New Information Tropical Storm Winds 40mph Immediate
Cooperative Program Allocation Budget Receipts Southern Baptist Convention Executive Committee May 2018
 Cooperative Program Allocation Budget Receipts May 2018 Cooperative Program Allocation Budget Current Current $ Change % Change Month Month from from Contribution Sources 2017-2018 2016-2017 Prior Year
Cooperative Program Allocation Budget Receipts Southern Baptist Convention Executive Committee October 2017
 Cooperative Program Allocation Budget Receipts October 2017 Cooperative Program Allocation Budget Current Current $ Change % Change Month Month from from Contribution Sources 2017-2018 2016-2017 Prior
Cooperative Program Allocation Budget Receipts Southern Baptist Convention Executive Committee October 2018
 Cooperative Program Allocation Budget Receipts October 2018 Cooperative Program Allocation Budget Current Current $ Change % Change Month Month from from Contribution Sources 2018-2019 2017-2018 Prior
CropCast Corn and Soybean Report Kenny Miller Friday, March 17, 2017
 Accumulated Rainfall (inches) Accumulated GDDs Temperature ( F)/Wind Speed (mph) Precipitation (inches) CropCast Corn and Soybean Report Kenny Miller Friday, March 17, 2017 Peoria, IL Regional Forecast
Weather and Climate Summary and Forecast November 2017 Report
 Weather and Climate Summary and Forecast November 2017 Report Gregory V. Jones Linfield College November 7, 2017 Summary: October was relatively cool and wet north, while warm and very dry south. Dry conditions
Estimating the contribution of strong daily export events to total pollutant export from the United States in summer
 Click Here for Full Article JOURNAL OF GEOPHYSICAL RESEARCH, VOL. 114,, doi:10.1029/2008jd010946, 2009 Estimating the contribution of strong daily export events to total pollutant export from the United
DISCUSSION --1/ 4 /19
 ISSUED: 4 JNURY 1715 EST WXRISK VIDEO WINTER FORECST short version WXRISK VIDEO WINTER FORECST Long version DISCUSSION --1/ 4 /19 *** STRONG SIGNS OF RETURN TYPICL JNURY TEMPS... DEVELOPING FTER JN 9 ***
WeatherManager Weekly
 Issue 288 July 14, 2016 WeatherManager Weekly Industries We Serve Agriculture Energy/Utilities Construction Transportation Retail Our Weather Protection Products Standard Temperature Products Lowest Daily
CHAPTER 1. Geo Challenges 1A to 1D. & World Map Activity
 CHAPTER 1 Geo Challenges 1A to 1D & World Map Activity SELECT YOUR CHALLENGE World Map Activity Challenge 1A Challenge 1B Challenge 1C Challenge 1D Challenge 1A WS PG. 2 STEP #1 Label the largest continent
Weather and Climate Summary and Forecast Summer 2017
 Weather and Climate Summary and Forecast Summer 2017 Gregory V. Jones Southern Oregon University August 4, 2017 July largely held true to forecast, although it ended with the start of one of the most extreme
Responsibilities of Harvard Atmospheric Chemistry Modeling Group
 Responsibilities of Harvard Atmospheric Chemistry Modeling Group Loretta Mickley, Lu Shen, Daniel Jacob, and Rachel Silvern 2.1 Objective 1: Compile comprehensive air pollution, weather, emissions, and
NatGasWeather.com Daily Report
 NatGasWeather.com Daily Report Issue Time: 5:15 pm EST Sunday, February 28 th, 2016 for Monday, Feb 29 th 7-Day Weather Summary (February 28 th March 5 th ): High pressure will dominate much of the US
2015 Summer Forecast
 2015 Summer Forecast Inside This Forecast Summer 2014 Recap 2 Implications of El Niño and the PDO on the Upcoming Summer Summary of Global Indices & Oscillations Analog Year: The Midwest a battleground
The Pennsylvania Observer
 The Pennsylvania Observer September 3, 2008 Summer 2008 Weather Summary Written by: Brian Thompson The opening days of June started dry, but a warm front brought a widespread rain a couple of days into
Hourly Precipitation Data Documentation (text and csv version) February 2016
 February 2016") I. Description Hourly Precipitation Data Documentation (text and csv version) February 2016 Hourly Precipitation Data (labeled Precipitation Hourly in Climate Data Online system) is a database that gives
I. Description Hourly Precipitation Data Documentation (text and csv version) February 2016 Hourly Precipitation Data (labeled Precipitation Hourly in Climate Data Online system) is a database that gives
Weather and Climate Summary and Forecast Fall/Winter 2016
 Weather and Climate Summary and Forecast Fall/Winter 2016 Gregory V. Jones Southern Oregon University November 5, 2016 After a year where we were seemingly off by a month in terms of temperatures (March
Module 11: Meteorology Topic 5 Content: Weather Maps Notes
 Introduction A variety of weather maps are produced by the National Weather Service and National Oceanographic Atmospheric Administration. These maps are used to help meteorologists accurately predict
CropCast Daily Agro-Highlights Don Keeney Monday, April 25, 2016
 VHI Image Date: Apr 21, 2016 USA Wheat Corn Soybeans Vegetative Health Index Map and Crop Condition Tendency EUROPE Wheat Rapeseed FSU Wheat CHINA Wheat Rapeseed ARGENTINA Corn Soybeans BRAZIL Corn Soybeans
Unit 1: Geography. For additional information, refer to this website: 1 G e o g r a p h y
 Unit 1: Geography For additional information, refer to this website: http://mryoungtms.weebly.com/ 1 G e o g r a p h y Continents and Oceans SOL USI. 2a Essential Understanding: Continents are large land
Conceptual Model for Ozone in the Austin-Round Rock Metropolitan Statistical Area
 CAPCOG FY14-15 PGA FY14-1 Deliverable 5.1.2 Amendment 1 Conceptual Model for Ozone in the Austin-Round Rock Metropolitan Statistical Area Prepared by the Capital Area Council of Governments October 8,
THE WEATHER AND CIRCULATION OF OCTOBER 1966
 January 1967 L. P. Stark 49 THE WEATHER AND CIRCULATION OF OCTOBER 1966 Cool Weather With Strong Polar Blocking L. P. STARK Weather Bureau, Environmental Science Services Administration, Washington, D.C.
Life East of the Mississippi
 Life East of the Mississippi Physical Features ESSENTIAL QUESTION: How does geography influence the way people live? ~The United States can be divided into regions based on physical characteristics. Learning
Summary of Natural Hazard Statistics for 2008 in the United States
 Summary of Natural Hazard Statistics for 2008 in the United States This National Weather Service (NWS) report summarizes fatalities, injuries and damages caused by severe weather in 2008. The NWS Office
OUT-OF-STATE 965 SUBTOTAL OUT-OF-STATE U.S. TERRITORIES FOREIGN COUNTRIES UNKNOWN GRAND TOTAL
 Report ID: USSR8072-V3 Page No. 1 Jurisdiction: ON-CAMPUS IL Southern Illinois University - Carb 1 0 0 0 Black Hawk College Quad-Cities 0 0 1 0 John A Logan College 1 0 0 0 Rend Lake College 1 0 0 0 Aurora
4/29/2011. Mid-latitude cyclones form along a
 Chapter 10: Cyclones: East of the Rocky Mountain Extratropical Cyclones Environment prior to the development of the Cyclone Initial Development of the Extratropical Cyclone Early Weather Along the Fronts
CropCast Daily Agro-Highlights Don Keeney Friday, April 22, 2016
 VHI Image Date: Apr 14, 2016 USA Wheat Corn Soybeans Vegetative Health Index Map and Crop Condition Tendency EUROPE Wheat Rapeseed FSU Wheat CHINA Wheat Rapeseed ARGENTINA Corn Soybeans BRAZIL Corn Soybeans
Weather Report 04 April 2018
 Weather Report 04 April 2018 South Africa - Weather Alternating periods of rain and sunshine will evolve across South Africa during the coming week. Moisture totals through next Tuesday morning will range
2 Georgia: Its Heritage and Its Promise
 TERMS region, erosion, fault, elevation, Fall Line, aquifer, marsh, climate, weather, precipitation, drought, tornado, hurricane, wetland, estuary, barrier island, swamp PLACES Appalachian Mountains, Appalachian
1. Which weather map symbol is associated with extremely low air pressure? A) B) C) D) 2. The diagram below represents a weather instrument.
 B) C) D) 2. The diagram below represents a weather instrument.") 1. Which weather map symbol is associated with extremely low air pressure? 2. The diagram below represents a weather instrument. Which weather variable was this instrument designed to measure? A) air pressure
1. Which weather map symbol is associated with extremely low air pressure? 2. The diagram below represents a weather instrument. Which weather variable was this instrument designed to measure? A) air pressure
Weather and Climate Summary and Forecast October 2018 Report
 Weather and Climate Summary and Forecast October 2018 Report Gregory V. Jones Linfield College October 4, 2018 Summary: Much of Washington, Oregon, coastal California and the Bay Area and delta region
Another 100-Year Storm. October 26, 2016 Mark Dennis, PE, CFM
 Another 100-Year Storm October 26, 2016 Mark Dennis, PE, CFM Agenda Are severe rainfall events becoming more frequent? Is there confusion about the 100-year storm that makes it seem like they happen all
Weather and Climate Summary and Forecast January 2019 Report
 Weather and Climate Summary and Forecast January 2019 Report Gregory V. Jones Linfield College January 4, 2019 Summary: December was mild and dry over much of the west, while the east was much warmer than
Challenge 1: Learning About the Physical Geography of Canada and the United States
 60ºN S T U D E N T H A N D O U T Challenge 1: Learning About the Physical Geography of Canada and the United States 170ºE 10ºW 180º 20ºW 60ºN 30ºW 1 40ºW 160ºW 50ºW 150ºW 60ºW 140ºW N W S E 0 500 1,000
Ocean Boundary Currents Guiding Question: How do western boundary currents influence climate and ocean productivity?
 Name: Date: TEACHER VERSION: Suggested Student Responses Included Ocean Boundary Currents Guiding Question: How do western boundary currents influence climate and ocean productivity? Introduction The circulation
HEADLINES ** 2 ND FROST POSSIBLE FOR THE SHEANANDOAH VALLEY THURSDAY MORNING 4/17??***
 HEADLINES DATA SHOWS CLOUDS WINDS VERY LOW DEW POINTS OVER NIGHT WHICH MAY SAVE THE DAY AND PREVENT MAJOR FROST FREEZE IN SOME AREAS WEDNESDAY MORNING ** 2 ND FROST POSSIBLE FOR THE SHEANANDOAH VALLEY
IDEA. from research to routine
 IDEA. from research to routine A collaboration between NASA, EPA, NOAA and CIMSS Cooperative Institute for Meteorological Satellite Studies Infusing satellite Data in Environmental Applications (IDEA)
Weather and Climate Summary and Forecast August 2018 Report
 Weather and Climate Summary and Forecast August 2018 Report Gregory V. Jones Linfield College August 5, 2018 Summary: July 2018 will likely go down as one of the top five warmest July s on record for many
Inter State Large Navigable Rivers of the United States
 Inter State Large Navigable Rivers of the United States REVIEW OF NORTH AMERICAN BASINS: GREAT LAKES AND MISSISSIPPI RIVER HELEN A. BROHL, EXECUTIVE DIRECTOR US COMMITTEE ON THE MARINE TRANSPORTATION SYSTEM
WEATHER NOTIFICATION STATEMENT
 WEATHER NOTIFICATION STATEMENT NEW DATA SHOWS SNOWSTORM THREAT FOR JAN 13-14 LOOKS MUCH HEAVIER BIGGER COVERAGE northwest NC (ice) ALL OF VA (Except Hampton Roads) all of MD/ DEL eastern southern PA southern
Mesoscale Convective System and heat episode July 2005 by Richard H. Grumm and Mathew Steinbugl
 Mesoscale Convective System and heat episode 25-27 July 2005 by Richard H. Grumm and Mathew Steinbugl 1. INTRODUCTION A strong upper-level ridge brought unseasonably high temperatures to the Midwest and
National Council for Geographic Education Curriculum & Instruction Committee Geography Club Submitted by: Steve Pierce
 National Council for Geographic Education Curriculum & Instruction Committee Geography Club Submitted by: Steve Pierce stevepierce@charter.net Ninth Month Activities Geography for Life: National Geography
OCTOBER 24-26,1982, ATLANTIC COAST STORM: A CHRONOLOGY AND INSIGHT
 Severe Weather Volume 9 Number 1 OCTOBER 24-26,1982, ATLANTIC COAST STORM: A CHRONOLOGY AND INSIGHT David B. Caldwell (1) National Weather Service Forecast Office 5200 Aulh Road Washlnglon, D.C. 20233
FRAPPÉ/DISCOVER-AQ (July/August 2014) in perspective of multi-year ozone analysis
 in perspective of multi-year ozone analysis") FRAPPÉ/DISCOVER-AQ (July/August 2014) in perspective of multi-year ozone analysis Project Report #2: Monitoring network assessment for the City of Fort Collins Prepared by: Lisa Kaser kaser@ucar.edu ph:
FRAPPÉ/DISCOVER-AQ (July/August 2014) in perspective of multi-year ozone analysis Project Report #2: Monitoring network assessment for the City of Fort Collins Prepared by: Lisa Kaser kaser@ucar.edu ph:
Current Weather Studies 4 TEMPERATURE AND AIR MASS ADVECTION
 CWS 4-1 SP19 Current Weather Studies 4 TEMPERATURE AND AIR MASS ADVECTION Reference: Chapter 4 in the Weather Studies textbook. Complete the introductory and other appropriate sections of Investigations
CALIOPE EU: Air Quality
 CALIOPE EU: Air Quality CALIOPE EU air quality forecast application User Guide caliope@bsc.es Version 30/09/2015 TABLE OF CONTENTS 1. Description... 1 2. Installation... 1 3. User Guide... 2 3.1 Air quality
Figures and tables Table 1 Annual CO emissions 1 : a priori and a posteriori estimates for selected regions, Tg a -1. Figure 1. Seasonal a priori CO
 Figures and tables Table 1 Annual CO emissions 1 : a priori and a posteriori estimates for selected regions, Tg a -1. Figure 1. Seasonal a priori CO emissions from fossil fuel, biofuel, and biomass burning
A. Geography Students know the location of places, geographic features, and patterns of the environment.
 Learning Targets Elementary Social Studies Grade 5 2014-2015 A. Geography Students know the location of places, geographic features, and patterns of the environment. A.5.1. A.5.2. A.5.3. A.5.4. Label North
NWS SERFC Hydrologic Vulnerability Assessment. Monday, March 9 th, 2015 NOAA, National Weather Service Southeast River Forecast Center
 NWS SERFC Hydrologic Vulnerability Assessment Monday, March 9 th, 2015 NOAA, National Weather Service Southeast River Forecast Center Current Weather Map Today s weather map shows a blossoming system in
Monthly Long Range Weather Commentary Issued: July 18, 2014 Steven A. Root, CCM, President/CEO
 Monthly Long Range Weather Commentary Issued: July 18, 2014 Steven A. Root, CCM, President/CEO sroot@weatherbank.com JUNE 2014 REVIEW Climate Highlights The Month in Review The average temperature for
The Spring Storm of April 2007 By Richard H. Grumm National Weather Service Office State College PA 16803
 The Spring Storm of 13-16 April 2007 By Richard H. Grumm National Weather Service Office State College PA 16803 1. INTRODUCTION A major spring storm struck the eastern United States from 13 through 16
The Pennsylvania Observer
 The Pennsylvania Observer October 1, 2015 September 2015 - Pennsylvania Weather Recap By: Quinn Lease The month of September will be remembered for its above normal temperatures and dry conditions that
Page 1. Name:
 Name: 1) As the difference between the dewpoint temperature and the air temperature decreases, the probability of precipitation increases remains the same decreases 2) Which statement best explains why
Weather and Climate Summary and Forecast Summer into Harvest 2016
 Weather and Climate Summary and Forecast Summer into Harvest 2016 Gregory V. Jones Southern Oregon University September 3, 2016 With school and football season starting a hint of fall is right on time
Potentially Wet Wed-Fri
 Potentially Wet Wed-Fri August 18, 2014 Last Week s Lightning Trends TUE 8/12 WED 8/13 THU 8/14 FRI 8/15 t SAT 8/16 SUN 8/17 August 1-16 Precipitation Anomaly: 2013 VS. 2014 AUG 1-16, 2013 AUG 1-16, 2014
URBAN HEAT ISLAND IN SEOUL
 URBAN HEAT ISLAND IN SEOUL Jong-Jin Baik *, Yeon-Hee Kim ** *Seoul National University; ** Meteorological Research Institute/KMA, Korea Abstract The spatial and temporal structure of the urban heat island
Heavy rains and precipitable water anomalies August 2010 By Richard H. Grumm And Jason Krekeler National Weather Service State College, PA 16803
 Heavy rains and precipitable water anomalies 17-19 August 2010 By Richard H. Grumm And Jason Krekeler National Weather Service State College, PA 16803 1. INTRODUCTION Heavy rain fell over the Gulf States,
Climates of NYS. Definitions. Climate Regions of NYS. Storm Tracks. Climate Controls 10/13/2011. Characteristics of NYS s Climates
 Definitions Climates of NYS Prof. Anthony Grande 2011 Weather and Climate Weather the state of the atmosphere at one point in time. The elements of weather are temperature, air pressure, wind and moisture.
Recent Ozone Modeling Results
 Recent Ozone Modeling Results Presentation by: Dan Goldberg, Ph.D. Candidate Co-authors: Tim Canty, Tim Vinciguerra, Ross Salawitch & Russ Dickerson Presented at the MARAMA Science Meeting Wednesday July
Weather and Climate Summary and Forecast January 2018 Report
 Weather and Climate Summary and Forecast January 2018 Report Gregory V. Jones Linfield College January 5, 2018 Summary: A persistent ridge of high pressure over the west in December produced strong inversions
Weather and Climate Summary and Forecast February 2018 Report
 Weather and Climate Summary and Forecast February 2018 Report Gregory V. Jones Linfield College February 5, 2018 Summary: For the majority of the month of January the persistent ridge of high pressure
Tropical Update. 5 PM EDT Tuesday, September 5, 2017 Hurricane Irma, Tropical Storm Jose, and Tropical Depression Thirteen
 Tropical Update 5 PM EDT Tuesday, September 5, 2017 Hurricane Irma, Tropical Storm Jose, and Tropical Depression Thirteen This update is intended for government and emergency response officials, and is
Crop / Weather Update
 Crop / Weather Update Corn Crop Condition Percent of Acreage Rated Good or Excellent 85 80 75 70 65 60 55 50 45 The U.S. corn crop was rated 69% good-to-excellent on September 23, up 1% from week-ago,
Recent Ozone Modeling Results
 Recent Ozone Modeling Results Presentation by: Dan Goldberg, Ph.D. Candidate Co-authors: Tim Canty, Tim Vinciguerra, Ross Salawitch & Russ Dickerson Presented at the MARAMA Science Meeting Wednesday July
Crop / Weather Update
 Crop / Weather Update Corn Crop Condition Percent of Acreage Rated Good or Excellent 85 80 75 70 65 60 55 50 45 In its weekly Crop Progress Report for September 16, the USDA stated the 18-state average
Refer to Figure 1 and what you have learned so far in this course when responding to the following:
 Refer to Figure 1 and what you have learned so far in this course when responding to the following: 1.Looking down on a Northern Hemisphere extratropical cyclone, surface winds blow [(clockwise and outward)(counterclockwise
Influence of the Western Pacific Subtropical High on summertime ozone variability in East China
 Influence of the Western Pacific Subtropical High on summertime ozone variability in East China Zijian Zhao 1 and Yuxuan Wang 1,2 1 Dept. Earth System Sciences, Tsinghua University, China 2 Dept. Earth
Weather Report 30 November 2017
 Weather Report 30 November 2017 South Africa - Weather The frequent precipitation pattern will continue for portions of eastern and central South Africa during the coming week. Moisture totals through
Jakarta International School 6 th Grade Formative Assessment Graphing and Statistics -Black
 Jakarta International School 6 th Grade Formative Assessment Graphing and Statistics -Black Name: Date: Score : 42 Data collection, presentation and application Frequency tables. (Answer question 1 on
Thanksgiving Snow and Arctic Front 25 November 2005 By Richard H. Grumm National Weather Service State College, PA 16801
 Thanksgiving Snow and Arctic Front 25 November 2005 By Richard H. Grumm National Weather Service State College, PA 16801 1. INTRODUCTION An approaching arctic front brought light snow to most of western