Signatures of Monsoon Overshooting Convection in MLS Water Vapor
|
|
|
- Randall Hicks
- 5 years ago
- Views:
Transcription

1 Jet Propulsion Laboratory California Institute of Technology Signatures of Monsoon Overshooting Convection in MLS Water Vapor Michael J. Schwartz, Nathaniel J. Livesey, Michelle L. Santee, Tao Wang Workshop on Dynamics, Transport and Chemistry of the UTLS Asian Monsoon NCAR, Boulder March 7--10, 2016 Copyright All rights reserved.

2 High Monsoon H 2 0 in the 11+Year MLS Record High mean (colors) and outliers (contours) are associated with the North American Monsoon upper-level Anticyclone NAMA and the Asian Monsoon Anticyclone AMA QUESTION: Do we see signatures of overshooting convection in MLS H2O that can be distinguished from monsoon LS H2O morphology reproduced in modeling studies by slow ascent through the TTL?

3 MLS 100-hPa H 2 O wet extremes (all seasons) Study boxes chosen to enclose regions of extreme values, both in terms of occurrence frequencies and maximum values in the record. The systematic clustering of outliers in these study boxes confirms the high quality of the MLS record. The wettest 100-hPa points in the record are in the northeast of NAMA. The AMA has a larger fraction of global 100-hPa H 2 O measurements between 8 and 10 ppmv, but fewer extreme outliers above 11 ppmv. The SA box (in Jan Feb) contains some of the highest extreme H 2 O values in the record, although SA 100-hPa mean values are <4 ppmv. Many of the highest outliers outside of the study box regions can be associated with volcanic plumes. Statistics shown throughout this talk are based on these study boxes.

4 July August joint H2O-T pdfs and implications for posited chlorine activation

5 MLS H 2 O Monthly Histogram Time Series Monthly histograms represent every profile in the two study boxes from 9/2004 9/2014. Colors are logarithmic PDFs that integrate over mixing ratio to unity for each month. The seasonal cycle in mean values has slightly larger amplitude in AMA than in NAMA. Dark blue outliers are individual MLS profiles indicative of convective injection of H 2 O; they occur preferentially in July August (shaded background), as well as May June in AMA. The highest observed values occur in NAMA. Interannual variability can be seen both in the means and in the extreme values had the highest outlier values in NAMA in the 7+ years shown in the GRL paper, but did not continue that trend. NAMA AMA
6 100-hPa H2O NAMA Histograms Histograms (left) are an estimate of the underlying PDFs the high outlier tail is noisy and saturates to a single value, at which point the sparseness of points rather than their value provides the information. Cumulative sums (right) of the histograms from the high side estimate the integrated histograms. Tails are easier to see Values tell the fraction of observations above a given mixing ratio
7 Cumulative H 2 O Histograms North American Monsoon Study Box PDFs, integrated from the high side, show the fraction of NAMA profiles with mixing ratios exceeding a given value in a given month. Y-scale is logarithmic; the floor is due to one point of ~10,000 in NAMA of a given month, and steps are additional points. Dashed lines (identical on all plots) are a reference Gaussian. Question: Are Summer non-gaussian, high outliers convective injection?
8 Cumulative H2O Histograms (Asian Monsoon Anticyclone) AMA has a larger fraction of 100 hpa values >8 ppmv than NAMA in July (red curve), but a smaller fraction in August (pink curve). AMA high outliers are evident beginning in April (yellow curve), much earlier than in NAMA. The highest July- August (red and pink curves) extremes are lower in AMA than those in NAMA.

 and IR + analysis theta NAMA Midwest/South of Continental US stands out in these")
9 Numerous inventories of convective overshooting of the tropopause are being developed using a variety of observations K. Bedka Geostationary imager-based Automation of manual identification by texture in Vis/IR imagery C. Liu, N. Liu: TRMM & GPM RADAR GPM has coverage to 60N but, as yet, only 1+ year of data NA Midwest has largest global feature L. Pfister: 3-hourly from combined TRMM rain rate (to reject anvils) and IR + analysis theta NAMA Midwest/South of Continental US stands out in these inventories. NAMA overshoots result from deep convection combined with a lower tropopause than in tropics or AMA

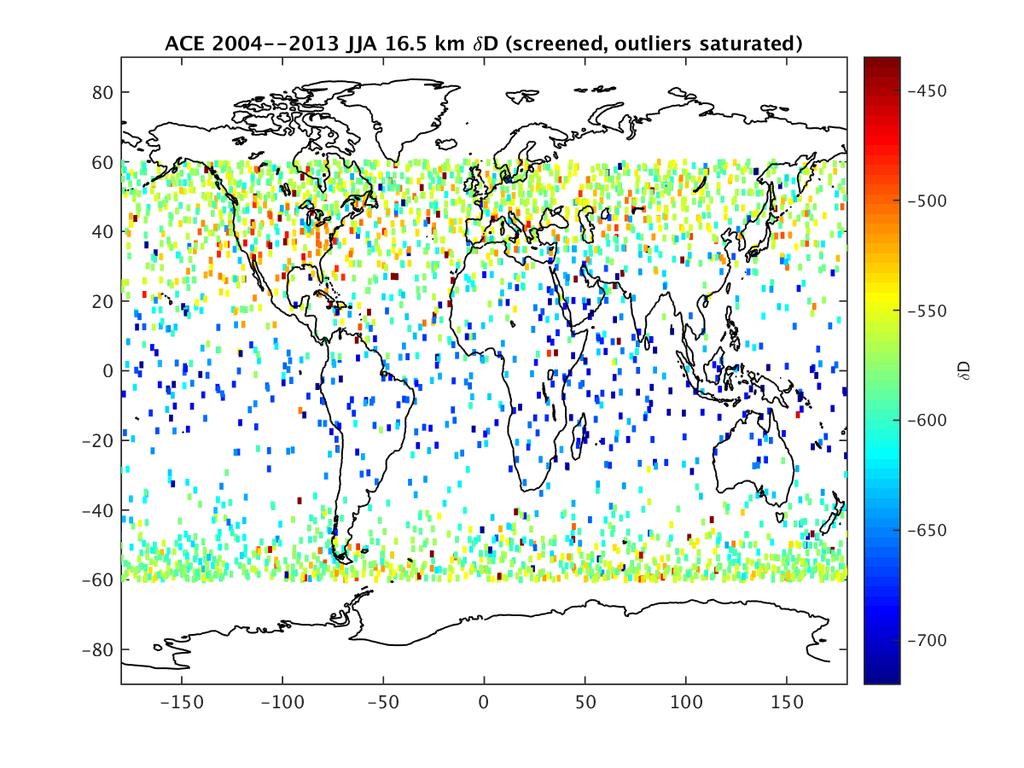
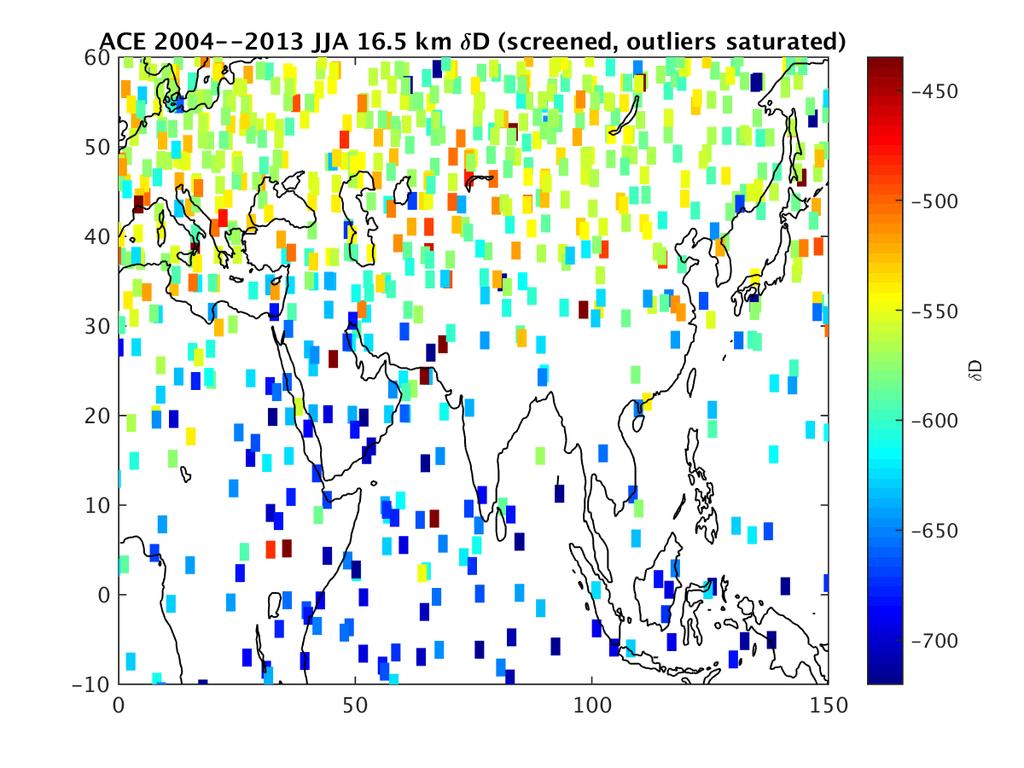
10 Randel, et al., 2012 show Convective influence in NAMA from ACE-FTS HDO/H2O NAMA has the largest global enhanced δd feature, both spatially and seasonally, while AMA enhanced H2O is not associated with enhanced δd. AMA 100hPa-83hPa levels are 5-8K colder than NAMA, so overshooting ice does not sublimate as efficiently. 10 years of ACE-FTS midlatitude JJA sampling is still very sparse, particularly for India/BoB, where the δd map is based upon only a handful of points. Global variations of HDO and HDO/H2O ratios in the upper troposphere and lower stratosphere derived from ACE-FTS satellite measurements Randel, et al Journal of Geophysical Research: Atmospheres Volume 117, Issue D6, D06303, 22 MAR 2012 DOI: /2011JD

11
12 Modeling Studies Many modeling studies (e.g. Ploeger et al., Wright et al., Schoeberl et al., Randel, et al.) have shown that lower stratospheric H20 (including the monsoons) can be reproduced with a fair degree of fidelity by slow ascent through the TTL without direct convective injection. Here we consider Schoeberl, Dessler, Wang (SDW) Domain-filling Lagrangian Trajectory model Parcels are launched daily, 60S 60N, in the lower TTL (370K) wherever this surface is above the level of positive net heating and below the tropopause (both cold point, WMO lapse rate and 380K) Lagrangian model is driven by analysis (here, MERRA) winds, heating rates, theta and dehydrated instantaneously and irreversibly when Murphy Koop RHI exceeds 100% After several years of spin-up, parcels fill the stratosphere. They are removed if they reenter the troposphere (P>250 hpa) There is no mechanism for mixing in the model so parcels are permanently imprinted with 100% RHI of the coldest point in their history. Their only subsequent change is a gradual increase from methane oxidation. Distributions do not relax to Gaussians, but may still provide some insight into variability of young air parcels.

13 Schoeberl Dessler Wang (SDW) Comparison with MLS Mean H2O Maps Models with parcel humidity fixed by cold points on trajectories during slow ascent through TTL can do a good job of reproducing mean 100 hpa H2O. Here we compare MLS map with SDW model with latitudinally dependent, ppmvdry bias removed. SDW does a remarkable job reproducing zonal variability of MLS mean H2O maps. Ascent through TTL, confined by monsoon anticyclones, can avoid global cold traps Question: How well does SDW do in reproducing observed high outliers?
14 MLS NAMA H2O Histograms SDW Model NAMA H2O Histograms 82.5 hpa 100 hpa
15 MLS NAMA H2O Cumulative histograms SDW Model NAMA H2O Cumulative histograms 82.5 hpa 100 hpa
16 MLS AMA H2O Cumulative histograms SDW Model AMA H2O Cumulative histograms 82.5 hpa 100 hpa


17 MLS NAMA H2O SDW Model NAMA H2O 82.5 hpa 100 hpa SDW H2O has many more outliers above 7ppmv at 82.5 hpa and above 9ppmv at 100 hpa But lacks outliers in northern part of NAMA box


18 MLS July-August AMA H2O SDW Model July-August AMA H2O 82.5 hpa 100 hpa
19 Diurnal Variability Indicating Recent Convection MLS AMA Day & Night H2O MLS NAMA Day & Night H2O 82.5 hpa 100 hpa
20 Diurnal Variability of cumhist tails indicates recent NAMA convective injection MLS AMA Day & Night H2O MLS NAMA Day & Night H2O 82.5 hpa 100 hpa
21 Diurnal Variation in Cumulative Histograms (MLS 2AM vs 2PM observations) Diurnal variation in H2O is almost certainly due to convection that is local in space and in time. Assessing impact of an, at most, ~1% observed daily tail wag on the H2O budget is not straightforward Evaporation in 12 hrs before ~2AM observation disperses in the next 12 hours to length scales that are a poorer match to the (3km x 7km x 210km) ==(vertical, across-track, along-track) of AVKs. Lack of signal in AMA could be due to less overshooting and/or a colder/higher AMA tropopause (less sublimation.) Differences in the diurnal cycle of convection in the two regions also may factor.
 are over convection (121-hPa IWC > 0.")
22 Higher IWC (convective core) regimes have fractionally more high outliers Unnormalized Cumulative histograms of 100 hpa H2O are shown for different IWC regimes Wet parcels are more likely to be above convective cores 3% of dry parcels and half of wet parcels (H2O>10 ppmv) are over convection (121-hPa IWC > 0.1mg/m 3 ) There is a much higher incidence of high IWC in AMA and warm pool than in NAMA, but not higher 100 hpa H2O 100 hpa H2O for different 121 hpa IWC regimes 30x ~same 100 hpa H2O for different 121 hpa IWC regimes
23 Conclusions MLS provides a high-quality, 11-year record of global daily water vapor profiles including the UTLS, with high mean values and high outlier values that are spatially and temporally correlated with the monsoon anticyclones. Models (example being SDW model minus a zonal mean bias) do a good job of reproducing MLS mean maps. SDW model does a surprisingly good job of qualitatively reproducing much of the AMA and NAMA monthy high-outlier tails observed by MLS, suggesting that high outliers can result from slow ascent confined to monsoon-region TTL that avoids cold traps. The model always has more high and low outliers because it has no mixing (no relaxation mechanism). SDW does not reproduce high outliers the northern part of the NAMA box The high-h2o pdf tail in the NAMA has diurnal variability that is a signature of local convection. Significant diurnal variability of high-h2o probabilities is not seen in the AMA. Quantitative interpretation MLS IWC-H2O correlation in the NAMA also suggest that local convection is important in producing H2O high outliers
24 BACK UP SLIDES
25 Higher IWC (convective core) regimes have fractionally more high outliers Unnormalized Cumulative histograms of 100 hpa H2O are shown for different IWC regimes Wet parcels are more likely to be above convective cores 3% of dry parcels and half of wet parcels (H2O>10 ppmv) are over convection (121-hPa IWC > 0.1mg/m 3 ) There is a much higher incidence of high IWC in AMA and warm pool than in NAMA, but not higher 100 hpa H2O 100 hpa H2O for different 121 hpa IWC regimes 30x ~same 100 hpa H2O for different 121 hpa IWC regimes
 aerosol conditions. Dashed curves apply within an unresolved 1-km enhanced H 2 O layer embedded in a 5-ppmv background.")
26 North American July-August Joint H 2 O-Temperature PDFs 82.5 hpa Solid curves show chlorine activation thresholds from Anderson et al. [2012]: Black = nominal sulfate aerosol; Gray = enhanced (volcanic) aerosol conditions. Dashed curves apply within an unresolved 1-km enhanced H 2 O layer embedded in a 5-ppmv background. MLS Water vapor 100 hpa Most of the highest July August NAMA H 2 O values occur at temperatures too high for activation in the current climate. Temperature
 aerosol conditions. Dashed curves apply within an unresolved 1-km enhanced H 2 O layer embedded in a 5-ppmv background.")
27 Asian Monsoon July-August Joint H 2 O-Temperature PDFs Solid curves show chlorine activation thresholds from Anderson et al. [2012]: Black = nominal sulfate aerosol; Gray = enhanced (volcanic) aerosol conditions. Dashed curves apply within an unresolved 1-km enhanced H 2 O layer embedded in a 5-ppmv background. The July August AMA is, on average, slightly wetter but significantly (~5 K) colder than the July August NAMA. The peak in the July August AMA H 2 O PDF is within Anderson et al. s activation regime for binary sulfate aerosol growth in the current climate. MLS Water vapor 82.5 hpa 100 hpa Temperature
28 We need to keep the Averaging Kernels in mind August NAMA mean unconvolved and convolved profiles are shown Retrieval is on 12-per-decade (~1.1 km) but ~50% is from adjacent levels There are high outliers in 82.5 hpa not in 100 hpa H2O, but also a great deal of correlation, originating both in the atmosphere and in the retrieval. Aug NAMA V3 H2O AVK Impact of AVK 82.5 hpa 100 hpa Unconvolved Convolved
29 MLS also produces Ice Water Content (IWC) profiles Insensitive to small (cirrus) ice particles Sees convective cores along limb line of sight near tangent point
30 MLS Pacific Box H2O Cumhists SDW Model Pacific Box H2O Cumhists 82.5 hpa 100 hpa
Quantifying convective influence on Asian Monsoon UTLS composition using Lagrangian trajectories and Aura MLS observations
 Quantifying convective influence on Asian Monsoon UTLS composition using Lagrangian trajectories and Aura MLS observations Nathaniel Livesey 1, Leonhard Pfister 2, Michelle Santee 1, William Read 1, Michael
Water Vapor in the Stratospheric Overworld
 Water Vapor in the Stratospheric Overworld Jonathon S. Wright Tsinghua University Center for Earth System Science March 12, 2012 Overview 1 What is the stratospheric overworld? 2 The importance of stratospheric
Variability and trends in stratospheric water vapor
 Variability and trends in stratospheric water vapor Bill Randel Atmospheric Chemistry Division NCAR, Boulder, CO Photo: Liz Moyer Climatology - Seasonal cycle (by far the largest variability) - summer
Clouds and water vapor in the Northern Hemisphere summertime stratosphere
 JOURNAL OF GEOPHYSICAL RESEARCH, VOL. 114,, doi:10.1029/2009jd012075, 2009 Clouds and water vapor in the Northern Hemisphere summertime stratosphere A. E. Dessler 1 Received 16 March 2009; revised 18 August
Atmospheric humidity and clouds - what can we learn from stratospheric water? Stephan Fueglistaler
 Atmospheric humidity and clouds - what can we learn from stratospheric water? Stephan Fueglistaler The stratosphere is the driest place in the atmosphere as we know it. This workshop is about "Convection,
Relationships between the North Atlantic Oscillation and isentropic water vapor transport into the lower stratosphere
 1/18 Relationships between the North Atlantic Oscillation and isentropic water vapor transport into the lower stratosphere Jonathon Wright and Seok-Woo Son Department of Applied Physics & Applied Mathematics
Influence of convection on the water isotopic composition of the tropical tropopause layer and tropical stratosphere
 See discussions, stats, and author profiles for this publication at: https://www.researchgate.net/publication/251438067 Influence of convection on the water isotopic composition of the tropical tropopause
Role of the Asian Monsoon in stratosphere troposphere exchange
 Role of the Asian Monsoon in stratosphere troposphere exchange Martin Riese Forschungszentrum Jülich, Germany May 1, 2013 C4 Workshop Pune Content Importance of Upper Troposphere / Lower Stratosphere (UTLS)
Horizontal water vapor transport in the lower stratosphere from subtropics to high latitudes during boreal summer
 JOURNAL OF GEOPHYSICAL RESEARCH: ATMOSPHERES, VOL. 11, 111 127, doi:.2/jgrd.53, 213 Horizontal water vapor transport in the lower stratosphere from subtropics to high latitudes during boreal summer F.
Lecture 8. Monsoons and the seasonal variation of tropical circulation and rainfall
 Lecture 8 Monsoons and the seasonal variation of tropical circulation and rainfall According to the second hypothesis, the monsoon is a manifestation of the seasonal variation of the tropical circulation
Advection condensation paradigm for stratospheric water vapor
 JOURNAL OF GEOPHYSICAL RESEARCH, VOL. 115,, doi:10.1029/2010jd014352, 2010 Advection condensation paradigm for stratospheric water vapor Y. S. Liu, 1,2 S. Fueglistaler, 1,3 and P. H. Haynes 1 Received
Estimating the influence of summertime deep convection over the Tibetan Plateau on water vapor transport into the tropical lower stratosphere
 Estimating the influence of summertime deep convection over the Tibetan Plateau on water vapor transport into the tropical lower stratosphere Jonathon S. Wright Tsinghua University Center for Earth System
Dynamical. regions during sudden stratospheric warming event (Case study of 2009 and 2013 event)
") Dynamical Coupling between high and low latitude regions during sudden stratospheric warming event (Case study of 2009 and 2013 event) Vinay Kumar 1,S. K. Dhaka 1,R. K. Choudhary 2,Shu-Peng Ho 3,M. Takahashi
Dynamical Coupling between high and low latitude regions during sudden stratospheric warming event (Case study of 2009 and 2013 event) Vinay Kumar 1,S. K. Dhaka 1,R. K. Choudhary 2,Shu-Peng Ho 3,M. Takahashi
COBALD measurements of aerosol backscatter in the ASM: , and outlook on the StratoClim WP2 field campaign (2016)
") COBALD measurements of aerosol backscatter in the ASM: 2013-2015, and outlook on the StratoClim WP2 field campaign (2016) S. Brunamonti, F.G. Wienhold, B. Luo and T. Peter Institute for Atmospheric and
COBALD measurements of aerosol backscatter in the ASM: 2013-2015, and outlook on the StratoClim WP2 field campaign (2016) S. Brunamonti, F.G. Wienhold, B. Luo and T. Peter Institute for Atmospheric and
Aura Microwave Limb Sounder (MLS) ozone profile data record characteristics, quality and applications
 ozone profile data record characteristics, quality and applications") Aura Microwave Limb Sounder (MLS) ozone profile data record characteristics, quality and applications A presentation for the 2016 meeting of the Committee on Earth Observation Satellites (COES) Atmospheric
Aura Microwave Limb Sounder (MLS) ozone profile data record characteristics, quality and applications A presentation for the 2016 meeting of the Committee on Earth Observation Satellites (COES) Atmospheric
TTL & H 2 O Brewer-Dobson Circulation (~years) Waves. Waves T T TEMPERATURE. Tropical Tropopause Layer (TTL) Equator. Stratosphere Ozone Layer QBO
 Waves. Waves T T TEMPERATURE. Tropical Tropopause Layer (TTL) Equator. Stratosphere Ozone Layer QBO") H 2 O in Strato. - Radiative Balance (IR cooling) - Source of HOx Ozone Layer H 2 O Distribution in Strato. - Dehydration/cold trap in TTL (microphysics of cirrus clouds matter!) - Brewer-Dobson Circ.
H 2 O in Strato. - Radiative Balance (IR cooling) - Source of HOx Ozone Layer H 2 O Distribution in Strato. - Dehydration/cold trap in TTL (microphysics of cirrus clouds matter!) - Brewer-Dobson Circ.
Comparison of Convection Characteristics at the Tropical Western Pacific Darwin Site Between Observation and Global Climate Models Simulations
 Comparison of Convection Characteristics at the Tropical Western Pacific Darwin Site Between Observation and Global Climate Models Simulations G.J. Zhang Center for Atmospheric Sciences Scripps Institution
ACE-FTS observations of short-lived reactive species in the UTLS
 ACE-FTS observations of short-lived reactive species in the UTLS Mijeong Park 1, Bill Randel 1, Louisa Emmons 1, Shawn Honomichl 1, Peter Bernath 2, Kaley Walker 2, and Chris Boone 2 1 ACOM/NCAR and 2
AMV height retrievals from stereo and IR techniques
 AMV height retrievals from stereo and IR techniques Dong L. Wu 1, Kevin J. Mueller 2, David Liu 3, and Jie Gong 4 1. NASA/Goddard Space Flight Center (GSFC) 2. Jet Propulsion Lab (JPL), California Institute
Primary Factors Contributing to Japan's Extremely Hot Summer of 2010
 temperature anomalies by its standard deviation for JJA 2010 Primary Factors Contributing to Japan's Extremely Hot Summer of 2010 Nobuyuki Kayaba Climate Prediction Division,Japan Meteorological Agancy
Chapter 6. Characteristics of Multiple Tropopauses in the Tropics
 Chapter 6 Characteristics of Multiple Tropopauses in the Tropics 6.1. Introduction The tropopause separates troposphere and stratosphere which are very distinct in their physical, chemical and thermal
Tropical cyclones and seasonal means in high-resolution CAM 5 runs.
 Tropical cyclones and seasonal means in high-resolution CAM 5 runs. Julio Bacmeister ( NESL ) NCAR Earth System Laboratory Collaborators/contributors: Peter Lauritzen, Jerry Olson, John Truesdale +CAM-5
Diagnosis of Relative Humidity Changes in a Warmer Climate Using Tracers of Last Saturation
 Diagnosis of Relative Humidity Changes in a Warmer Climate Using Tracers of Last Saturation 8 March, 2011 Jonathon Wright Department of Applied Mathematics & Theoretical Physics University of Cambridge
Correspondence between short and long timescale systematic errors in CAM4/CAM5 explored by YOTC data
 Correspondence between short and long timescale systematic errors in CAM4/CAM5 explored by YOTC data Hsi-Yen Ma In collaboration with Shaocheng Xie, James Boyle, Stephen Klein, and Yuying Zhang Program
Introduction to Climate ~ Part I ~
 2015/11/16 TCC Seminar JMA Introduction to Climate ~ Part I ~ Shuhei MAEDA (MRI/JMA) Climate Research Department Meteorological Research Institute (MRI/JMA) 1 Outline of the lecture 1. Climate System (
Linkages between Arctic sea ice loss and midlatitude
 Linkages between Arctic sea ice loss and midlatitude weather patterns Response of the wintertime atmospheric circulation to current and projected Arctic sea ice decline Gudrun Magnusdottir and Yannick
Science Results Based on Aura OMI-MLS Measurements of Tropospheric Ozone and Other Trace Gases
 Science Results Based on Aura OMI-MLS Measurements of Tropospheric Ozone and Other Trace Gases J. R. Ziemke Main Contributors: P. K. Bhartia, S. Chandra, B. N. Duncan, L. Froidevaux, J. Joiner, J. Kar,
Monsoon Activities in China Tianjun ZHOU
 Monsoon Activities in China Tianjun ZHOU Email: zhoutj@lasg.iap.ac.cn CLIVAR AAMP10, Busan,, Korea 18-19 19 June 2010 Outline Variability of EASM -- Interdecadal variability -- Interannual variability
Towards a more physically based approach to Extreme Value Analysis in the climate system
 N O A A E S R L P H Y S IC A L S C IE N C E S D IV IS IO N C IR E S Towards a more physically based approach to Extreme Value Analysis in the climate system Prashant Sardeshmukh Gil Compo Cecile Penland
An Upper Boundary Condition for Chemical Species
 An Upper Boundary Condition for Chemical Species Mary Barth Gabriele Pfister, Jean-Francois Lamarque, Jeff Lee NCAR Earth System Laboratory National Center for Atmospheric Research Boulder, Colorado NCAR
Overview and quality of global observations of middle atmospheric water vapour by the Odin satellite
 Overview and quality of global observations of middle atmospheric water vapour by the Odin satellite J. Urban*, D.P. Murtagh*, M. Ekström,, P. Eriksson*, C. Sanchez*, A. Jones,* S. Lossow **, Y. Kasai
The water vapour channels of SEVIRI (Meteosat). An introduction
. An introduction") The water vapour channels of SEVIRI (Meteosat). An introduction jose.prieto@eumetsat.int Cachoeira P. July 2006 Formats 1.5 1 Objectives 2 Describe the characteristics of WV channels on board of SEVIRI
The water vapour channels of SEVIRI (Meteosat). An introduction jose.prieto@eumetsat.int Cachoeira P. July 2006 Formats 1.5 1 Objectives 2 Describe the characteristics of WV channels on board of SEVIRI
Natural and anthropogenic aerosols in the UTLS: Sources and role of Asian monsoon transport
 Natural and anthropogenic aerosols in the UTLS: Sources and role of Asian monsoon transport Mian Chin, NASA Goddard Space Flight Center + Tom Kucsera, Thomas Diehl, Huisheng Bian, Valentina Aquila, Qian
Fluid Circulation Review. Vocabulary. - Dark colored surfaces absorb more energy.
 Fluid Circulation Review Vocabulary Absorption - taking in energy as in radiation. For example, the ground will absorb the sun s radiation faster than the ocean water. Air pressure Albedo - Dark colored
Mesoscale and High Impact Weather in the South American Monsoon Leila M. V. Carvalho 1 and Maria A. F. Silva Dias 2 1
 Mesoscale and High Impact Weather in the South American Monsoon Leila M. V. Carvalho 1 and Maria A. F. Silva Dias 2 1 University of California, Santa Barbara 2 University of Sao Paulo, Brazil Objectives
Energy Systems, Structures and Processes Essential Standard: Analyze patterns of global climate change over time Learning Objective: Differentiate
 Energy Systems, Structures and Processes Essential Standard: Analyze patterns of global climate change over time Learning Objective: Differentiate between weather and climate Global Climate Focus Question
The Rainfall System Classification over the Korean Peninsula Using TRMM TMI and Ground Measurement Data
 6 th International Precipitation Working Group Workshop-São José dos Campos- October 15~19, 2012 The Rainfall System Classification over the Korean Peninsula Using TRMM TMI and Ground Measurement Data
Lecture 19: Operational Remote Sensing in Visible, IR, and Microwave Channels
 MET 4994 Remote Sensing: Radar and Satellite Meteorology MET 5994 Remote Sensing in Meteorology Lecture 19: Operational Remote Sensing in Visible, IR, and Microwave Channels Before you use data from any
Interpretation of Polar-orbiting Satellite Observations. Atmospheric Instrumentation
 Interpretation of Polar-orbiting Satellite Observations Outline Polar-Orbiting Observations: Review of Polar-Orbiting Satellite Systems Overview of Currently Active Satellites / Sensors Overview of Sensor
Development of a Coupled Atmosphere-Ocean-Land General Circulation Model (GCM) at the Frontier Research Center for Global Change
 at the Frontier Research Center for Global Change") Chapter 1 Atmospheric and Oceanic Simulation Development of a Coupled Atmosphere-Ocean-Land General Circulation Model (GCM) at the Frontier Research Center for Global Change Project Representative Tatsushi
Chapter 1 Atmospheric and Oceanic Simulation Development of a Coupled Atmosphere-Ocean-Land General Circulation Model (GCM) at the Frontier Research Center for Global Change Project Representative Tatsushi
Impact of the 2002 stratospheric warming in the southern hemisphere on the tropical cirrus clouds and convective activity
 The Third International SOWER meeting,, Lake Shikotsu,, July 18-20, 2006 1 Impact of the 2002 stratospheric warming in the southern hemisphere on the tropical cirrus clouds and convective activity Eguchi,
Observed Increase of TTL Temperature and Water Vapor in Polluted Clouds Over Asia
 University of Wyoming Wyoming Scholars Repository Atmospheric Science Faculty Publications Atmospheric Science 6-1-2011 Observed Increase of TTL Temperature and Water Vapor in Polluted Clouds Over Asia
Satellites, Weather and Climate Module??: Polar Vortex
 Satellites, Weather and Climate Module??: Polar Vortex SWAC Jan 2014 AKA Circumpolar Vortex Science or Hype? Will there be one this year? Today s objectives Pre and Post exams What is the Polar Vortex
On Improving Precipitation Diurnal Cycle and Frequency in Global Climate Models
 On Improving Precipitation Diurnal Cycle and Frequency in Global Climate Models Xiaoqing Wu Department of Geological and Atmospheric Sciences Iowa State University (ISU) The YOTC International Science
The influence of summertime convection over Southeast Asia on water vapor in the tropical stratosphere
 JOURNAL OF GEOPHYSICAL RESEARCH, VOL. 116,, doi:10.1029/2010jd015416, 2011 The influence of summertime convection over Southeast Asia on water vapor in the tropical stratosphere J. S. Wright, 1 R. Fu,
Interannual variability of top-ofatmosphere. CERES instruments
 Interannual variability of top-ofatmosphere albedo observed by CERES instruments Seiji Kato NASA Langley Research Center Hampton, VA SORCE Science team meeting, Sedona, Arizona, Sep. 13-16, 2011 TOA irradiance
Climate Monitoring with GPS RO Achievements and Challenges
 Climate Monitoring with GPS RO Achievements and Challenges A.K. Steiner Wegener Center for Climate and Global Change (WEGC) and IGAM/Inst. of Physics, University of Graz, Austria andi.steiner@uni-graz.at
Where does precipitation water come from?
 Chapter II Climate and Meteorology Where does precipitation water come from? Introduction The source of water vapor existing over Mongolia has been considered to consist of evapotranspiration at several
Upper Tropospheric Cloud Systems. what can be achieved? A GEWEX Perspective
 Upper Tropospheric Cloud Systems from Satellite Observations: what can be achieved? A GEWEX Perspective Global Energy & Water EXchanges Claudia Stubenrauch, Graeme Stephens IPSL LMD, Paris, France, NASA
Recent Trends in Northern and Southern Hemispheric Cold and Warm Pockets
 Recent Trends in Northern and Southern Hemispheric Cold and Warm Pockets Abstract: Richard Grumm National Weather Service Office, State College, Pennsylvania and Anne Balogh The Pennsylvania State University
Will a warmer world change Queensland s rainfall?
 Will a warmer world change Queensland s rainfall? Nicholas P. Klingaman National Centre for Atmospheric Science-Climate Walker Institute for Climate System Research University of Reading The Walker-QCCCE
High-Resolution MPAS Simulations for Analysis of Climate Change Effects on Weather Extremes
 High-Resolution MPAS Simulations for Analysis of Climate Change Effects on Weather Extremes ALLISON MICHAELIS, GARY LACKMANN, & WALT ROBINSON Department of Marine, Earth, and Atmospheric Sciences, North
Decrease of light rain events in summer associated with a warming environment in China during
 GEOPHYSICAL RESEARCH LETTERS, VOL. 34, L11705, doi:10.1029/2007gl029631, 2007 Decrease of light rain events in summer associated with a warming environment in China during 1961 2005 Weihong Qian, 1 Jiaolan
Aiguo Dai * and Kevin E. Trenberth National Center for Atmospheric Research (NCAR) $, Boulder, CO. Abstract
 $, Boulder, CO. Abstract") 9.2 AMS 14 th Symposium on Global Change and Climate Variations, 9-13 Feb. 2003, Long Beach, CA. Diurnal Variations in the Community Climate System Model Aiguo Dai * and Kevin E. Trenberth National Center
9.2 AMS 14 th Symposium on Global Change and Climate Variations, 9-13 Feb. 2003, Long Beach, CA. Diurnal Variations in the Community Climate System Model Aiguo Dai * and Kevin E. Trenberth National Center
Influence of condensate evaporation on water vapor and its stable isotopes in a GCM
 Click Here for Full Article GEOPHYSICAL RESEARCH LETTERS, VOL. 36, L12804, doi:10.1029/2009gl038091, 2009 Influence of condensate evaporation on water vapor and its stable isotopes in a GCM Jonathon S.
A trajectory study to diagnose T S transport via the TTL
 A trajectory study to diagnose T S transport via the TTL Michiel van Weele, Rinus Scheele Peter van Velthoven, Peter Siegmund KNMI SPARC Data Assimilation Workshop Overview Method; Definition of Tropical
MESO-NH cloud forecast verification with satellite observation
 MESO-NH cloud forecast verification with satellite observation Jean-Pierre CHABOUREAU Laboratoire d Aérologie, University of Toulouse and CNRS, France http://mesonh.aero.obs-mip.fr/chaboureau/ DTC Verification
Temperature Pressure Wind Moisture
 Chapter 1: Properties of Atmosphere Temperature Pressure Wind Moisture Thickness of the Atmosphere (from Meteorology Today) 90% 70% The thickness of the atmosphere is only about 2% of Earth s thickness
Characteristics of cirrus clouds from ICESat/GLAS observations
 GEOPHYSICAL RESEARCH LETTERS, VOL. 34, L09810, doi:10.1029/2007gl029529, 2007 Characteristics of cirrus clouds from ICESat/GLAS observations Nawo Eguchi, 1 Tatsuya Yokota, 1 and Gen Inoue 2 Received 30
The Interdecadal Variation of the Western Pacific Subtropical High as Measured by 500 hpa Eddy Geopotential Height
 ATMOSPHERIC AND OCEANIC SCIENCE LETTERS, 2015, VOL. 8, NO. 6, 371 375 The Interdecadal Variation of the Western Pacific Subtropical High as Measured by 500 hpa Eddy Geopotential Height HUANG Yan-Yan and
Introduction of Seasonal Forecast Guidance. TCC Training Seminar on Seasonal Prediction Products November 2013
 Introduction of Seasonal Forecast Guidance TCC Training Seminar on Seasonal Prediction Products 11-15 November 2013 1 Outline 1. Introduction 2. Regression method Single/Multi regression model Selection
11D.6 DIURNAL CYCLE OF TROPICAL DEEP CONVECTION AND ANVIL CLOUDS: GLOBAL DISTRIBUTION USING 6 YEARS OF TRMM RADAR AND IR DATA
 11D.6 DIURNAL CYCLE OF TROPICAL DEEP CONVECTION AND ANVIL CLOUDS: GLOBAL DISTRIBUTION USING 6 YEARS OF TRMM RADAR AND IR DATA 1. INTRODUCTION Before the launch of the TRMM satellite in late 1997, most
Influence of the Western Pacific Subtropical High on summertime ozone variability in East China
 Influence of the Western Pacific Subtropical High on summertime ozone variability in East China Zijian Zhao 1 and Yuxuan Wang 1,2 1 Dept. Earth System Sciences, Tsinghua University, China 2 Dept. Earth
Dynamics of the Atmosphere. General circulation of the atmosphere
 12.810 Dynamics of the Atmosphere General circulation of the atmosphere 1 Spinup of the general circulation in an idealized model Fig. 1 Schneider, General circulation of the atmosphere, 2006 2 Sigma 0.2
Spaceborne Hyperspectral Infrared Observations of the Cloudy Boundary Layer
 Spaceborne Hyperspectral Infrared Observations of the Cloudy Boundary Layer Eric J. Fetzer With contributions by Alex Guillaume, Tom Pagano, John Worden and Qing Yue Jet Propulsion Laboratory, JPL KISS
CESM2 (WACCM6): Stratospheric Evaluation
: Stratospheric Evaluation") CESM2 (WACCM6): Stratospheric Evaluation D. Kinnison, M. Mills, R. Garcia, D. Marsh, A. Gettelman, F. Vitt, S. Glanville, C. Bardeen, S. Tilmes, A. Smith, J-F. Lamarque, L. Emmons, A. Conley, J. Richter,
CESM2 (WACCM6): Stratospheric Evaluation D. Kinnison, M. Mills, R. Garcia, D. Marsh, A. Gettelman, F. Vitt, S. Glanville, C. Bardeen, S. Tilmes, A. Smith, J-F. Lamarque, L. Emmons, A. Conley, J. Richter,
Predictability of Sudden Stratospheric Warmings in sub-seasonal forecast models
 Predictability of Sudden Stratospheric Warmings in sub-seasonal forecast models Alexey Karpechko Finnish Meteorological Institute with contributions from A. Charlton-Perez, N. Tyrrell, M. Balmaseda, F.
Pathway from the boundary layer to the UTLS
 Pathway from the boundary layer to the UTLS over the Asian summer monsoon region Outline 1. TP ASM (E to W) 2. O 3 H 2 O, cirrus & aerosol Jianchun Bian LAGEO Institute of Atmospheric Physics Chinese Academy
Insights into Tropical Tropopause Layer processes using global models
 Click Here for Full Article JOURNAL OF GEOPHYSICAL RESEARCH, VOL. 112,, doi:10.1029/2007jd008945, 2007 Insights into Tropical Tropopause Layer processes using global models A. Gettelman 1 and T. Birner
Science Overview Asian Summer Monsoon Chemical and Climate Impact Project (ACCLIP)
") Co-Principal Investigators: Co-Investigators: Science Overview Asian Summer Monsoon Chemical and Climate Impact Project (ACCLIP) Laura Pan (NCAR), Paul Newman (NASA) Elliot Atlas (Univ. Miami), William
Co-Principal Investigators: Co-Investigators: Science Overview Asian Summer Monsoon Chemical and Climate Impact Project (ACCLIP) Laura Pan (NCAR), Paul Newman (NASA) Elliot Atlas (Univ. Miami), William
particular regional weather extremes
 SUPPLEMENTARY INFORMATION DOI: 1.138/NCLIMATE2271 Amplified mid-latitude planetary waves favour particular regional weather extremes particular regional weather extremes James A Screen and Ian Simmonds
A 2-d modeling approach for studying the formation, maintenance, and decay of Tropical Tropopause Layer (TTL) cirrus associated with Deep Convection
 cirrus associated with Deep Convection") A 2-d modeling approach for studying the formation, maintenance, and decay of Tropical Tropopause Layer (TTL) cirrus associated with Deep Convection Presenting: Daniel R. Henz Masters Student Atmospheric,
A 2-d modeling approach for studying the formation, maintenance, and decay of Tropical Tropopause Layer (TTL) cirrus associated with Deep Convection Presenting: Daniel R. Henz Masters Student Atmospheric,
7 December 2016 Tokyo Climate Center, Japan Meteorological Agency
 Summary of the 2016 Asian Summer Monsoon 7 December 2016 Tokyo Climate Center, Japan Meteorological Agency This report summarizes the characteristics of the surface climate and atmospheric/oceanographic
General Circulation of the Atmosphere. René Garreaud
 General Circulation of the Atmosphere René Garreaud www.dgf.uchile.cl/rene General circulation of the Atmosphere Low latitude areas receive more solar energy than high latitudes (because of earth sphericity).
Vertical Structure of Atmosphere
 ATMOS 3110 Introduction to Atmospheric Sciences Distribution of atmospheric mass and gaseous constituents Because of the earth s gravitational field, the atmosphere exerts a downward forces on the earth
GOMOS Level 2 evolution studies (ALGOM) Aerosol-insensitive ozone retrievals in the UTLS
 Aerosol-insensitive ozone retrievals in the UTLS") GOMOS Level 2 evolution studies (ALGOM) Aerosol-insensitive ozone retrievals in the UTLS FMI-ALGOM-TN-TWOSTEP-201 March 2016 V.F. Sofieva. E. Kyrölä, J. Tamminen, J.Hakkarainen Finnish Meteorological Institute,
GOMOS Level 2 evolution studies (ALGOM) Aerosol-insensitive ozone retrievals in the UTLS FMI-ALGOM-TN-TWOSTEP-201 March 2016 V.F. Sofieva. E. Kyrölä, J. Tamminen, J.Hakkarainen Finnish Meteorological Institute,
UPPLEMENT A COMPARISON OF THE EARLY TWENTY-FIRST CENTURY DROUGHT IN THE UNITED STATES TO THE 1930S AND 1950S DROUGHT EPISODES
 UPPLEMENT A COMPARISON OF THE EARLY TWENTY-FIRST CENTURY DROUGHT IN THE UNITED STATES TO THE 1930S AND 1950S DROUGHT EPISODES Richard R. Heim Jr. This document is a supplement to A Comparison of the Early
Crux of AGW s Flawed Science (Wrong water-vapor feedback and missing ocean influence)
") 1 Crux of AGW s Flawed Science (Wrong water-vapor feedback and missing ocean influence) William M. Gray Professor Emeritus Colorado State University There are many flaws in the global climate models. But
1 Crux of AGW s Flawed Science (Wrong water-vapor feedback and missing ocean influence) William M. Gray Professor Emeritus Colorado State University There are many flaws in the global climate models. But
Comparing QBO and ENSO impacts on stratospheric transport in WACCM-SD and -FR
 Comparing QBO and ENSO impacts on stratospheric transport in WACCM-SD and -FR Multivariate ENSO Index + QBO shear index based on Singapore wind U50-U25 CESM Chemistry WG Meeting Boulder, CO February 10,
CLIMATE AND CLIMATE CHANGE MIDTERM EXAM ATM S 211 FEB 9TH 2012 V1
 CLIMATE AND CLIMATE CHANGE MIDTERM EXAM ATM S 211 FEB 9TH 2012 V1 Name: Student ID: Please answer the following questions on your Scantron Multiple Choice [1 point each] (1) The gases that contribute to
El Niño, South American Monsoon, and Atlantic Niño links as detected by a. TOPEX/Jason Observations
 El Niño, South American Monsoon, and Atlantic Niño links as detected by a decade of QuikSCAT, TRMM and TOPEX/Jason Observations Rong Fu 1, Lei Huang 1, Hui Wang 2, Paola Arias 1 1 Jackson School of Geosciences,
BMKG Research on Air sea interaction modeling for YMC
 BMKG Research on Air sea interaction modeling for YMC Prof. Edvin Aldrian Director for Research and Development - BMKG First Scientific and Planning Workshop on Year of Maritime Continent, Singapore 27-3
WATER VAPOR FLUXES OVER EQUATORIAL CENTRAL AFRICA
 WATER VAPOR FLUXES OVER EQUATORIAL CENTRAL AFRICA INTRODUCTION A good understanding of the causes of climate variability depend, to the large extend, on the precise knowledge of the functioning of the
Weather Studies Introduction to Atmospheric Science
 Weather Studies Introduction to Atmospheric Science American Meteorological Society Chapter 1 Monitoring The Weather Credit: This presentation was prepared for AMS by Michael Leach, Professor of Geography
Saharan Dust Induced Radiation-Cloud-Precipitation-Dynamics Interactions
 Saharan Dust Induced Radiation-Cloud-Precipitation-Dynamics Interactions William K. M. Lau NASA/GSFC Co-authors: K. M. Kim, M. Chin, P. Colarco, A. DaSilva Atmospheric loading of Saharan dust Annual emission
A Novel Cirrus Cloud Retrieval Method For GCM High Cloud Validations
 A Novel Cirrus Cloud Retrieval Method For GCM High Cloud Validations David Mitchell Anne Garnier Melody Avery Desert Research Institute Science Systems & Applications, Inc. NASA Langley Reno, Nevada Hampton,
Name the surface winds that blow between 0 and 30. GEO 101, February 25, 2014 Monsoon Global circulation aloft El Niño Atmospheric water
 GEO 101, February 25, 2014 Monsoon Global circulation aloft El Niño Atmospheric water Name the surface winds that blow between 0 and 30 What is the atmospheric pressure at 0? What is the atmospheric pressure
The Australian Summer Monsoon
 The Australian Summer Monsoon Aurel Moise, Josephine Brown, Huqiang Zhang, Matt Wheeler and Rob Colman Australian Bureau of Meteorology Presentation to WMO IWM-IV, Singapore, November 2017 Outline Australian
Supplementary Figure 1. Summer mesoscale convective systems rainfall climatology and trends. Mesoscale convective system (MCS) (a) mean total
 (a) mean total") Supplementary Figure 1. Summer mesoscale convective systems rainfall climatology and trends. Mesoscale convective system (MCS) (a) mean total rainfall and (b) total rainfall trend from 1979-2014. Total
Supplementary Figure 1. Summer mesoscale convective systems rainfall climatology and trends. Mesoscale convective system (MCS) (a) mean total rainfall and (b) total rainfall trend from 1979-2014. Total
High initial time sensitivity of medium range forecasting observed for a stratospheric sudden warming
 GEOPHYSICAL RESEARCH LETTERS, VOL. 37,, doi:10.1029/2010gl044119, 2010 High initial time sensitivity of medium range forecasting observed for a stratospheric sudden warming Yuhji Kuroda 1 Received 27 May
TRMM Multi-satellite Precipitation Analysis (TMPA)
") TRMM Multi-satellite Precipitation Analysis (TMPA) (sometimes known as 3B42/43, TRMM product numbers) R. Adler, G. Huffman, D. Bolvin, E. Nelkin, D. Wolff NASA/Goddard Laboratory for Atmospheres with key
TRMM Multi-satellite Precipitation Analysis (TMPA) (sometimes known as 3B42/43, TRMM product numbers) R. Adler, G. Huffman, D. Bolvin, E. Nelkin, D. Wolff NASA/Goddard Laboratory for Atmospheres with key
Synoptic Meteorology I: Skew-T Diagrams and Thermodynamic Properties
 Synoptic Meteorology I: Skew-T Diagrams and Thermodynamic Properties For Further Reading Most information contained within these lecture notes is drawn from Chapters 1, 2, 4, and 6 of The Use of the Skew
Diurnal cycles of precipitation, clouds, and lightning in the tropics from 9 years of TRMM observations
 GEOPHYSICAL RESEARCH LETTERS, VOL. 35, L04819, doi:10.1029/2007gl032437, 2008 Diurnal cycles of precipitation, clouds, and lightning in the tropics from 9 years of TRMM observations Chuntao Liu 1 and Edward
NOTES AND CORRESPONDENCE. Seasonal Variation of the Diurnal Cycle of Rainfall in Southern Contiguous China
 6036 J O U R N A L O F C L I M A T E VOLUME 21 NOTES AND CORRESPONDENCE Seasonal Variation of the Diurnal Cycle of Rainfall in Southern Contiguous China JIAN LI LaSW, Chinese Academy of Meteorological
1. INTRODUCTION. investigating the differences in actual cloud microphysics.
 MICROPHYSICAL PROPERTIES OF DEVELOPING VERSUS NON-DEVELOPING CLOUD CLUSTERS DURING TROPICAL CYCLOGENESIS 4B.5 Nathan D. Johnson,* William C. Conant, and Elizabeth A. Ritchie Department of Atmospheric Sciences,
Supporting Online Material for
 www.sciencemag.org/cgi/content/full/1153966/dc1 Supporting Online Material for The Sensitivity of Polar Ozone Depletion to Proposed Geoengineering Schemes Simone Tilmes,* Rolf Müller, Ross Salawitch *To
On the remarkable Arctic winter in 2008/2009
 JOURNAL OF GEOPHYSICAL RESEARCH, VOL. 114,, doi:10.1029/2009jd012273, 2009 On the remarkable Arctic winter in 2008/2009 K. Labitzke 1 and M. Kunze 1 Received 17 April 2009; revised 11 June 2009; accepted
Chapter 9 External Energy Fuels Weather and Climate
 Natural Disasters Tenth Edition Chapter 9 External Energy Fuels Weather and Climate Copyright The McGraw-Hill Companies, Inc. Permission required for reproduction or display. 9-1 Weather Versus Climate
What you need to know in Ch. 12. Lecture Ch. 12. Atmospheric Heat Engine
 Lecture Ch. 12 Review of simplified climate model Revisiting: Kiehl and Trenberth Overview of atmospheric heat engine Current research on clouds-climate Curry and Webster, Ch. 12 For Wednesday: Read Ch.
ENSO and April SAT in MSA. This link is critical for our regression analysis where ENSO and
 Supplementary Discussion The Link between El Niño and MSA April SATs: Our study finds a robust relationship between ENSO and April SAT in MSA. This link is critical for our regression analysis where ENSO