Climate Change Impacts on Great Lakes Water Levels. Andrew Gronewold, Ph.D., P.E.
|
|
|
- Gwenda Reed
- 5 years ago
- Views:
Transcription
1 Climate Change Impacts on Great Lakes Water Levels Andrew Gronewold, Ph.D., P.E. Great Lakes Environmental Research Laboratory National Oceanic and Atmospheric Administration The Ohio State University Changing Climate Seminar Series May 10, 2011
2 Outline Introduction 1 Introduction
3 Outline Introduction 1 Introduction 2 Water level observations
4 Outline Introduction 1 Introduction 2 Water level observations 3 Water level models
5 Outline Introduction 1 Introduction 2 Water level observations 3 Water level models 4 Water Level forecasts
6 Outline Introduction 1 Introduction 2 Water level observations 3 Water level models 4 Water Level forecasts
7
8
9
10
11
12
13
14 Rank Port State Total cargo volume (million tons)
15 Rank Port State Total cargo volume (million tons) 1 South Louisiana LA 213
16 Rank Port State Total cargo volume (million tons) 1 South Louisiana LA Houston TX New York and New Jersey NY/NJ Long Beach CA 73 5 Corpus Christi TX 68 6 New Orleans LA 68 7 Beaumont TX 68 8 Huntington-Tristate OH/KY/WV 59 9 Los Angeles CA Hampton Roads VA 58
17 Rank Port State Total cargo volume (million tons) 1 South Louisiana LA Houston TX New York and New Jersey NY/NJ Long Beach CA 73 5 Corpus Christi TX 68 6 New Orleans LA 68 7 Beaumont TX 68 8 Huntington-Tristate OH/KY/WV 59 9 Los Angeles CA Hampton Roads VA Duluth/Superior MN/WI 30
18 Rank Port State Total cargo volume (million tons) 1 South Louisiana LA Houston TX New York and New Jersey NY/NJ Long Beach CA 73 5 Corpus Christi TX 68 6 New Orleans LA 68 7 Beaumont TX 68 8 Huntington-Tristate OH/KY/WV 59 9 Los Angeles CA Hampton Roads VA Duluth/Superior MN/WI Chicago IL 19 Table: United States busiest ports ranked by gross tonnage for the calendar year 2009.
19
20
21 Name Country Surface area Volume (km 2 ) (mi 2 ) (km 3 ) (mi 3 ) Caspian Sea Multiple 371, ,000 78,200 18,800 Michigan Huron U.S. and Canada 117,702 45,445 8,458 2,029 Superior U.S. and Canada 82,414 31,820 12,100 2,900 Victoria Multiple 69,485 26,828 2, Tanganyika Multiple 32,893 12,700 18,900 4,500 Baikal Russia 31,500 12,200 23, 5,700 Great Bear Lake Canada 31,080 12,000 2, Malawi Multiple 30,044 11, 8,400 2,000 Great Slave Lake Canada 28,930 11,170 2, Erie U.S. and Canada 25,719 9, Winnipeg Canada 23,553 9, Ontario U.S. and Canada 19,477 7,520 1, Table: Water volume and surface areas of the earth s twelve highest surface area continental water bodies.
22 Name Country Surface area Volume (km 2 ) (mi 2 ) (km 3 ) (mi 3 ) Caspian Sea Multiple 371, ,000 78,200 18,800 Michigan Huron U.S. and Canada 117,702 45,445 8,458 2,029 Superior U.S. and Canada 82,414 31,820 12,100 2,900 Victoria Multiple 69,485 26,828 2, Tanganyika Multiple 32,893 12,700 18,900 4,500 Baikal Russia 31,500 12,200 23, 5,700 Great Bear Lake Canada 31,080 12,000 2, Malawi Multiple 30,044 11, 8,400 2,000 Great Slave Lake Canada 28,930 11,170 2, Erie U.S. and Canada 25,719 9, Winnipeg Canada 23,553 9, Ontario U.S. and Canada 19,477 7,520 1, Table: Water volume and surface areas of the earth s twelve highest surface area continental water bodies.
23 : take home messages Introduction
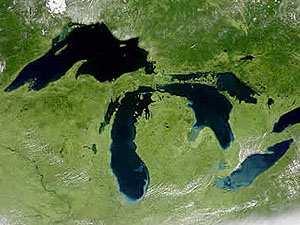
24 Introduction: take home messages Great lakes - largest freshwater resource system in the world
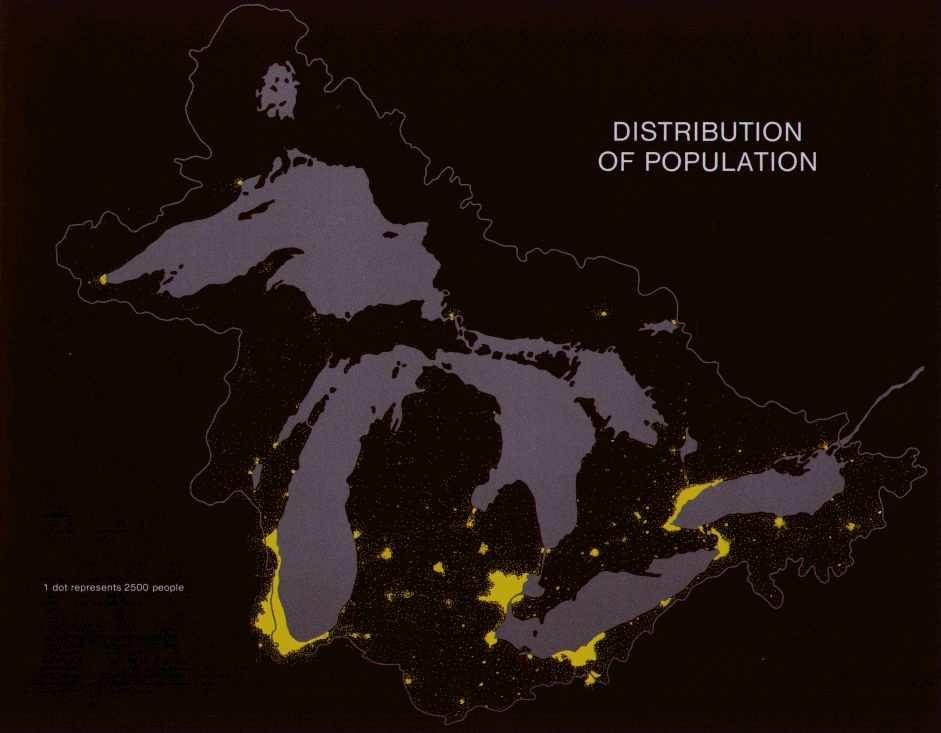
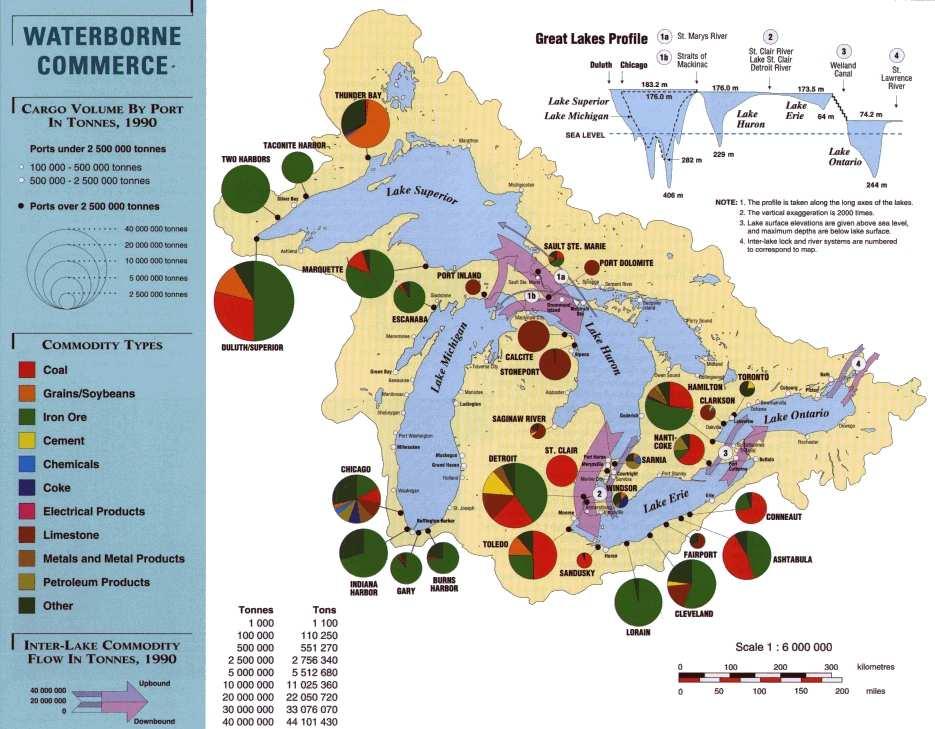
25 Introduction: take home messages Great lakes - largest freshwater resource system in the world Supports significant population and economy
26 Introduction: take home messages Great lakes - largest freshwater resource system in the world Supports significant population and economy Collectively managed and utilized by two nations
27 Introduction: take home messages Great lakes - largest freshwater resource system in the world Supports significant population and economy Collectively managed and utilized by two nations Benchmark for adaptive management and hydroclimate research
28 Outline Introduction Water level observations Climate and meteorological variables 1 Introduction 2 Water level observations 3 Water level models 4 Water Level forecasts

29 Water level observations Climate and meteorological variables

30 Water level observations Climate and meteorological variables

31 Water level observations Climate and meteorological variables

32 Water level observations Climate and meteorological variables

33 Water level observations Climate and meteorological variables
34 Water level observations Climate and meteorological variables Water levels: observations (long-term) 185 Water level (meters, IGLD85) Water level (feet, IGLD85) Year
35 Water level observations Climate and meteorological variables Water levels: observations (long-term) Water level (meters, IGLD85) Lake Superior Water level (feet, IGLD85) Year
36 Water level observations Climate and meteorological variables Water levels: observations (long-term) Water level (meters, IGLD85) Lake Superior Water level (feet, IGLD85) Year
37 Water level observations Climate and meteorological variables Water levels: observations (long-term) Water level (meters, IGLD85) Lake Superior Lake Michigan and Huron Lake Erie Lake Ontario Water level (feet, IGLD85) Year
38 Water level observations Climate and meteorological variables Water levels: observations (long-term) Water level (meters, IGLD85) Lake Superior Lake Michigan and Huron Lake Erie Lake Ontario Water level (feet, IGLD85) Year
39 Water level observations Climate and meteorological variables Water levels: observations (long-term) Water level (meters, IGLD85) Lake Superior Lake Michigan and Huron Lake Erie Lake Ontario Water level (feet, IGLD85) Year

40 Water level observations Climate and meteorological variables Water Levels: observations (short-term)

41 Water level observations Climate and meteorological variables Water Levels: observations (short-term)
42 Water level observations Climate and meteorological variables : take home messages
43 Water level observations Climate and meteorological variables : take home messages Great lakes water levels spatial and temporal scales
44 Water level observations Climate and meteorological variables : take home messages Great lakes water levels spatial and temporal scales Multiple sources of uncertainty and variability
45 Water level observations Climate and meteorological variables : take home messages Great lakes water levels spatial and temporal scales Multiple sources of uncertainty and variability No single factor (natural or non-natural) explains it all
46 Water level observations Climate and meteorological variables : take home messages Great lakes water levels spatial and temporal scales Multiple sources of uncertainty and variability No single factor (natural or non-natural) explains it all Can we relate, reproduce, and predict using models?
47 Water level observations Climate and meteorological variables Great Lakes hydrologic cycle

48 Water level observations Climate and meteorological variables Great Lakes hydrologic cycle
49 Water level observations Climate and meteorological variables Precipitation 185 Water level (meters, IGLD85) Water level (feet, IGLD85) Year
50 Water level observations Climate and meteorological variables Precipitation Water level (meters, IGLD85) Water level (feet, IGLD85) Basin precipitation (mm) Year
51 Water level observations Climate and meteorological variables Precipitation Lake Superior Water level (meters, IGLD85) Lake Michigan and Huron Lake Erie Water level (feet, IGLD85) Basin precipitation (mm) Lake Ontario Year
52 Water level observations Climate and meteorological variables Precipitation Lake Superior Water level (meters, IGLD85) Lake Michigan and Huron Lake Erie Water level (feet, IGLD85) Basin precipitation (mm) Lake Ontario Year
53 Water level observations Climate and meteorological variables Evaporation 185 Water level (meters, IGLD85) Water level (feet, IGLD85) Year
54 Water level observations Climate and meteorological variables Evaporation Lake Superior Water level (meters, IGLD85) Lake Michigan and Huron Lake Erie Water level (feet, IGLD85) Average annual over lake evaporation (mm) Lake Ontario Year
55 Water level observations Climate and meteorological variables Evaporation Lake Superior Water level (meters, IGLD85) Lake Michigan and Huron Lake Erie Water level (feet, IGLD85) Average annual over lake evaporation (mm) Lake Ontario Year
56 Outline Introduction 1 Introduction 2 Water level observations 3 Water level models 4 Water Level forecasts
57 Great Lakes Advanced Hydrologic Prediction System (AHPS) Daily Meteorological Data Daily precipitation, air temperature for over-land stations. Evapotranspiration model input: dew point, wind speed, cloud cover. Thiessen Polygon Software Computes spatial averages of meteorological data for subbasins and over-lakes Over-lake and Subbasin Averages Over-lake averages (air temp, dew point, wind speed, cloud cover). Subbasin and over-lake averages for air temperature and precipitation. Lake Thermodynamics Model Heat storage, water temperature, and evaporation calculated. Large Basin Runoff Model Daily moisture storage and runoff calculated. Over-lake Average Heat storage, water temperature, evaporation. Subbasin Average Daily moisture storage, runoff. Net Basin Supply Calculations NBS = Runoff + Precipitation - Evaporation Lake Routing and Regulation Model Translates net basin supplies to lake levels and connecting channel fl ows. Predicted Water Levels
58 Great Lakes Advanced Hydrologic Prediction System (AHPS) Daily Meteorological Data Daily precipitation, air temperature for over-land stations. Evapotranspiration model input: dew point, wind speed, cloud cover. Thiessen Polygon Software Computes spatial averages of meteorological data for subbasins and over-lakes Over-lake and Subbasin Averages Over-lake averages (air temp, dew point, wind speed, cloud cover). Subbasin and over-lake averages for air temperature and precipitation. Lake Thermodynamics Model Heat storage, water temperature, and evaporation calculated. Large Basin Runoff Model Daily moisture storage and runoff calculated. Over-lake Average Heat storage, water temperature, evaporation. Subbasin Average Daily moisture storage, runoff. Net Basin Supply Calculations NBS = Runoff + Precipitation - Evaporation Lake Routing and Regulation Model Translates net basin supplies to lake levels and connecting channel fl ows. Predicted Water Levels
59 Great Lakes Advanced Hydrologic Prediction System (AHPS) Daily Meteorological Data Daily precipitation, air temperature for over-land stations. Evapotranspiration model input: dew point, wind speed, cloud cover. Thiessen Polygon Software Computes spatial averages of meteorological data for subbasins and over-lakes Over-lake and Subbasin Averages Over-lake averages (air temp, dew point, wind speed, cloud cover). Subbasin and over-lake averages for air temperature and precipitation. Lake Thermodynamics Model Heat storage, water temperature, and evaporation calculated. Large Basin Runoff Model Daily moisture storage and runoff calculated. Over-lake Average Heat storage, water temperature, evaporation. Subbasin Average Daily moisture storage, runoff. Net Basin Supply Calculations NBS = Runoff + Precipitation - Evaporation Lake Routing and Regulation Model Translates net basin supplies to lake levels and connecting channel fl ows. Predicted Water Levels
60 Great Lakes Advanced Hydrologic Prediction System (AHPS) Daily Meteorological Data Daily precipitation, air temperature for over-land stations. Evapotranspiration model input: dew point, wind speed, cloud cover. Thiessen Polygon Software Computes spatial averages of meteorological data for subbasins and over-lakes Over-lake and Subbasin Averages Over-lake averages (air temp, dew point, wind speed, cloud cover). Subbasin and over-lake averages for air temperature and precipitation. Lake Thermodynamics Model Heat storage, water temperature, and evaporation calculated. Large Basin Runoff Model Daily moisture storage and runoff calculated. Over-lake Average Heat storage, water temperature, evaporation. Subbasin Average Daily moisture storage, runoff. Net Basin Supply Calculations NBS = Runoff + Precipitation - Evaporation Lake Routing and Regulation Model Translates net basin supplies to lake levels and connecting channel fl ows. Predicted Water Levels
61 Water level (meters, IGLD85) month forecast 90% prediction interval 3 month forecast 90% prediction interval Observed monthly average water level Lake Superior Lakes Michigan Huron Lake St. Clair Lake Erie
62 Water level (meters, IGLD85) month forecast 90% prediction interval 3 month forecast 90% prediction interval Observed monthly average water level Lake Superior Lakes Michigan Huron Lake St. Clair Lake Erie
63 Water level (meters, IGLD85) month forecast 90% prediction interval 3 month forecast 90% prediction interval Observed monthly average water level Lake Superior Lakes Michigan Huron Lake St. Clair Lake Erie
64 Water level (meters, IGLD85) month forecast 90% prediction interval 3 month forecast 90% prediction interval Observed monthly average water level Lake Superior Lakes Michigan Huron Lake St. Clair Lake Erie

65

66
67 Outline Introduction 1 Introduction 2 Water level observations 3 Water level models 4 Water Level forecasts
68 Climate forecasts Water level (meters, IGLD85) Water level (feet, IGLD85) Basin precipitation (mm) Year
69 Climate forecasts Lake Superior Water level (meters, IGLD85) Lake Michigan and Huron Lake Erie Water level (feet, IGLD85) Basin precipitation (mm) Lake Ontario Year
70 Climate forecasts Lake Superior Water level (meters, IGLD85) Lake Michigan and Huron Lake Erie (from P. Chao, 1999) Geophysical Fluid Dynamics Laboratory Transient Hadley Center Transient Max Planck Institute Transient Canadian Climate Centre Transient Water level (feet, IGLD85) Basin precipitation (mm) Lake Ontario Year
71 Climate forecasts Lake Superior Water level (meters, IGLD85) Lake Michigan and Huron Lake Erie (from P. Chao, 1999) Geophysical Fluid Dynamics Laboratory Transient Hadley Center Transient Max Planck Institute Transient Canadian Climate Centre Transient Water level (feet, IGLD85) Basin precipitation (mm) Lake Ontario Year
72 Climate forecasts Lake Superior Water level (meters, IGLD85) Lake Michigan and Huron Lake Erie (from P. Chao, 1999) Geophysical Fluid Dynamics Laboratory Transient Hadley Center Transient Max Planck Institute Transient Canadian Climate Centre Transient Water level (feet, IGLD85) Basin precipitation (mm) Lake Ontario Year
73 Climate forecasts Lake Superior Water level (meters, IGLD85) Lake Michigan and Huron Lake Erie (from P. Chao, 1999) Geophysical Fluid Dynamics Laboratory Transient Hadley Center Transient Max Planck Institute Transient Canadian Climate Centre Transient Water level (feet, IGLD85) Basin precipitation (mm) Lake Ontario Year
74 Water level forecasts From: Hayhoe, et al., (2010)
75 Water level forecasts Lake Superior (from Hayhoe, et al., 2010) SRES B1 low emissions SRES A1fi high emissions Water level (meters, IGLD85) Lake Michigan and Huron Lake Erie Water level (feet, IGLD85) Lake Ontario Year
76 Water level forecasts Lake Superior (from Hayhoe, et al., 2010) SRES B1 low emissions SRES A1fi high emissions Water level (meters, IGLD85) Lake Michigan and Huron Lake Erie Water level (feet, IGLD85) Lake Ontario Year
77 Water level forecasts Lake Superior (from Hayhoe, et al., 2010) SRES B1 low emissions SRES A1fi high emissions Water level (meters, IGLD85) Lake Michigan and Huron Lake Erie Water level (feet, IGLD85) Lake Ontario Year
78 Water level forecasts From: Angel and Kunkel (2010)
79 Conclusions Introduction
80 Conclusions Properly acknowledge variability and uncertainty in models and put them within the context of short and long term patterns
81 Conclusions Properly acknowledge variability and uncertainty in models and put them within the context of short and long term patterns
82 Conclusions Properly acknowledge variability and uncertainty in models and put them within the context of short and long term patterns others
83 Acknowledgements Introduction
84 Acknowledgements Tim Hunter, Anne Clites, Cathy Darnell, Brent Lofgren and Craig Stow (NOAA GLERL)
85 Acknowledgements Tim Hunter, Anne Clites, Cathy Darnell, Brent Lofgren and Craig Stow (NOAA GLERL) Frank Quinn, Tom Croley
86 Acknowledgements Tim Hunter, Anne Clites, Cathy Darnell, Brent Lofgren and Craig Stow (NOAA GLERL) Frank Quinn, Tom Croley
87 Acknowledgements Tim Hunter, Anne Clites, Cathy Darnell, Brent Lofgren and Craig Stow (NOAA GLERL) Frank Quinn, Tom Croley NOAA, USEPA, and Duke University
88 Climate Change Impacts on Great Lakes Water Levels Andrew Gronewold, Ph.D., P.E. Great Lakes Environmental Research Laboratory National Oceanic and Atmospheric Administration The Ohio State University Changing Climate Seminar Series May 10, 2011
Future Great Lakes climatology and water levels simulated using Regional Climate Models
 Future Great Lakes climatology and water levels simulated using Regional Climate Models Frank Seglenieks Environment Canada The St. Clair River Symposium Port Huron, MI 2014-09-18 Summary Great Lakes hydroclimatology
Great Lakes Update. Volume 191: 2014 January through June Summary. Vol. 191 Great Lakes Update August 2014
 Great Lakes Update Volume 191: 2014 January through June Summary The U.S. Army Corps of Engineers (USACE) monitors the water levels of each of the Great Lakes. This report provides a summary of the Great
Great Lakes Update. Great Lakes Winter and Spring Summary January June Vol. 187 Great Lakes Update August 2012
 Great Lakes Update Great Lakes Winter and Spring Summary January June 2012 The US Army Corps of Engineers (USACE) Detroit District monitors hydraulic and hydrologic conditions of the Great Lakes. This
Great Lakes Update. Volume 188: 2012 Annual Summary
 Great Lakes Update Volume 188: 2012 Annual Summary Background The U.S. Army Corps of Engineers (USACE) tracks the water levels of each of the Great Lakes. This report highlights hydrologic conditions of
Great Lakes Update. Volume 193: 2015 January through June Summary. Vol. 193 Great Lakes Update August 2015
 Great Lakes Update Volume 193: 2015 January through June Summary The U.S. Army Corps of Engineers (USACE) monitors the water levels of each of the Great Lakes. This report provides a summary of the Great
Decline of Lake Michigan-Huron Levels Caused by Erosion of the St. Clair River
 Decline of Lake Michigan-Huron Levels Caused by Erosion of the St. Clair River W.F. & Associates Coastal Engineers (in association with Frank Quinn) April 13, 2005 Outline Problem Definition Understanding
Great Lakes Update. Volume 199: 2017 Annual Summary. Background
 Great Lakes Update Volume 199: 2017 Annual Summary Background The U.S. Army Corps of Engineers (USACE) tracks and forecasts the water levels of each of the Great Lakes. This report is primarily focused
Great Lakes Update. Volume 194: 2015 Annual Summary
 Great Lakes Update Volume 194: 2015 Annual Summary Background The U.S. Army Corps of Engineers (USACE) tracks and forecasts the water levels of each of the Great Lakes. This report summarizes the hydrologic
Historical and Projected Future Climatic Trends in the Great Lakes Region
 Historical and Projected Future Climatic Trends in the Great Lakes Region Jeffrey A. Andresen Dept. of Geography, Environment, and Spatial Sciences Michigan State University Flooding along I-696 Warren,
Improving historical precipitation estimates over the Lake Superior basin
 GEOPHYSICAL RESEARCH LETTERS, VOL. 39,, doi:10.1029/2011gl050468, 2012 Improving historical precipitation estimates over the Lake Superior basin K. D. Holman, 1,2 A. Gronewold, 3 M. Notaro, 2 and A. Zarrin
A WATER CYCLE PREDICTION SYSTEM
 A WATER CYCLE PREDICTION SYSTEM FOR THE GREAT LAKES AND ST. LAWRENCE RIVER V. Fortin 1, D. Durnford 2, G. Smith 1, P. Matte 1, M. Mackay 1, N. Bernier 1... and many others 1 Meteorological Research Division,
4840 South State Rd Cell:
 DR. REBECCA A. BOLINGER NOAA GLERL Work: 734-741- 2248 4840 South State Rd Cell: 850-766- 6520 Ann Arbor, MI 48108 becky.bolinger@noaa.gov RESEARCH INTERESTS Hydroclimate variability, hydrologic cycle,
Physical Geography of the United States and Canada Chapter 5 A Land of Contrasts
 Physical Geography of the United States and Canada Chapter 5 A Land of Contrasts Land Area Together the U.S. and Canada cover more than 7 million square miles. In total area, Canada ranks 2 nd and the
PUBLICATIONS. Water Resources Research. Hydrological drivers of record-setting water level rise on Earth s largest lake system
 PUBLICATIONS Water Resources Research RESEARCH ARTICLE Key Points: Between January 2013 and December 2014, the two largest lakes on Earth rose at a record-setting rate We developed a Bayesian MCMC routine
Module 11: Meteorology Topic 5 Content: Weather Maps Notes
 Introduction A variety of weather maps are produced by the National Weather Service and National Oceanographic Atmospheric Administration. These maps are used to help meteorologists accurately predict
Darren Wright Maritime Services Program Manager Center for Operational Oceanographic Products and Services (CO-OPS)
") Darren Wright Maritime Services Program Manager Center for Operational Oceanographic Products and Services (CO-OPS) Center for Operational Oceanographic Products and Services (CO-OPS) National Water Level
Darren Wright Maritime Services Program Manager Center for Operational Oceanographic Products and Services (CO-OPS) Center for Operational Oceanographic Products and Services (CO-OPS) National Water Level
Impact of climate change on freshwater resources in the Changjiang river basin
 Impact of climate change on freshwater resources in the Changjiang river basin Wenfa Yang, Yan Huang Bureau of Hydrology, Changjiang Water Resources Commission, MWR, China April,2009 Objective To identify
CLIMATE CHANGE AND REGIONAL HYDROLOGY ACROSS THE NORTHEAST US: Evidence of Changes, Model Projections, and Remote Sensing Approaches
 CLIMATE CHANGE AND REGIONAL HYDROLOGY ACROSS THE NORTHEAST US: Evidence of Changes, Model Projections, and Remote Sensing Approaches Michael A. Rawlins Dept of Geosciences University of Massachusetts OUTLINE
Name the surface winds that blow between 0 and 30. GEO 101, February 25, 2014 Monsoon Global circulation aloft El Niño Atmospheric water
 GEO 101, February 25, 2014 Monsoon Global circulation aloft El Niño Atmospheric water Name the surface winds that blow between 0 and 30 What is the atmospheric pressure at 0? What is the atmospheric pressure
Great Lakes Update. Background
 Great Lakes Update Background The U.S. Army Corps of Engineers, Detroit District, monitors and forecasts the water levels of the Great Lakes. This report summarizes the hydrologic conditions of the Great
Downscaled Climate Change Projection for the Department of Energy s Savannah River Site
 Downscaled Climate Change Projection for the Department of Energy s Savannah River Site Carolinas Climate Resilience Conference Charlotte, North Carolina: April 29 th, 2014 David Werth Atmospheric Technologies
Using Meteorology Probability Forecasts in Operational Hydrology
 Using Meteorology Probability Forecasts in Operational Hydrology THOMAS E. CROLEY II Great Lakes Environmental Research Laboratory National Oceanic and Atmospheric Administration United States Department
APPENDIX A LAKE EVAPORATION
 APPENDICES APPENDIX A LAKE EVAPORATION 457 APPENDIX A LAKE EVAPORATION A.1 INTRODUCTION The net historic monthly inflows to Okanagan Lake as determined by change in lake storage and outflow corrected for
A NEMO-based hydrodynamic/hydraulic system for the Great Lakes. F. Dupont, P. Chittibabu, A. Huang, R. Yerubandi, V. Fortin, Y. Lu
 A NEMO-based hydrodynamic/hydraulic system for the Great Lakes F. Dupont, P. Chittibabu, A. Huang, R. Yerubandi, V. Fortin, Y. Lu Objectives: Development of a coupled hydrological forecasting system for
Lake-Level Variability and Water Availability in the Great Lakes
 National Water Availability and Use Program Lake-Level Variability and Water Availability in the Great Lakes Circular 1311 U.S. Department of the Interior U.S. Geological Survey Front-cover photo: Drowned-river-mouth
APPLICATIONS OF DOWNSCALING: HYDROLOGY AND WATER RESOURCES EXAMPLES
 APPLICATIONS OF DOWNSCALING: HYDROLOGY AND WATER RESOURCES EXAMPLES Dennis P. Lettenmaier Department of Civil and Environmental Engineering For presentation at Workshop on Regional Climate Research NCAR
ESTIMATION OF THE HYDRAULIC ROUGHNESS OF RIVER ICE USING DATA ASSIMILATION
 ESTIMATION OF THE HYDRAULIC ROUGHNESS OF RIVER ICE USING DATA ASSIMILATION Steven F. Daly 1 and Carrie Vuyovich 1 1 ERDC Cold Regions Research and Engineering Laboratory Hanover, NH 03755 ABSTRACT Ice
UNDERSTANDING AND FORECASTING METEOTSUNAMI IN THE GREAT LAKES
 UNDERSTANDING AND FORECASTING METEOTSUNAMI IN THE GREAT LAKES Fellow: Adam Bechle Principal Investigators: Allen Burton (UM-CILER), Chin Wu (UM-CILER) NOAA Technical Contacts: Eric Anderson (NOAA-GLERL)
A Report on a Statistical Model to Forecast Seasonal Inflows to Cowichan Lake
 A Report on a Statistical Model to Forecast Seasonal Inflows to Cowichan Lake Prepared by: Allan Chapman, MSc, PGeo Hydrologist, Chapman Geoscience Ltd., and Former Head, BC River Forecast Centre Victoria
The Great Lakes. Beyond the Book. FOCUS Book
 Build a model to show how the Great s formed. Use soil and large pieces of ice to model the role of ice sheets as they carved out the Great s Basin and then filled it with water. How will you make the
Model Calibration and Forecast Error for NFIE-Hydro
 Corey Van Dyk C E 397 Flood Forecasting 5/8/15 Model Calibration and Forecast Error for NFIE-Hydro Introduction The forecasting component of the National Flood Interoperability Experiment (NFIE), like
DENDROCHRONOLOGY AND WATER LEVELS AS INDICATORS OF RECENT CLIMATE CHANGE: GEORGIAN BAY, LAKE HURON (ONTARIO, CANADA)
") Published by Keck Geology Consortium Short Contributions 30th Annual Symposium Volume 29th April, 2017 ISBN: 1528-7491 DENDROCHRONOLOGY AND WATER LEVELS AS INDICATORS OF RECENT CLIMATE CHANGE: GEORGIAN
Published by Keck Geology Consortium Short Contributions 30th Annual Symposium Volume 29th April, 2017 ISBN: 1528-7491 DENDROCHRONOLOGY AND WATER LEVELS AS INDICATORS OF RECENT CLIMATE CHANGE: GEORGIAN
Status report on the Great Lakes Runoff Inter-comparison Project for Lake Erie (GRIP-E)
") Status report on the Great Lakes Runoff Inter-comparison Project for Lake Erie (GRIP-E) Juliane Mai, Bryan A. Tolson, Hongren Shen, E tienne Gaborit, Nicolas Gasset, Vincent Fortin, Maria Abrahamowicz,
Status report on the Great Lakes Runoff Inter-comparison Project for Lake Erie (GRIP-E) Juliane Mai, Bryan A. Tolson, Hongren Shen, E tienne Gaborit, Nicolas Gasset, Vincent Fortin, Maria Abrahamowicz,
Historical and Projected Future Climatic Trends in the Great Lakes Region
 Historical and Projected Future Climatic Trends in the Great Lakes Region Jeffrey A. Andresen Dept. of Geography, Environment, and Spatial Sciences Michigan State University Outline Historical Trends Climatic
UNCERTAINTY ANALYSIS OF LAKE ERIE NET BASIN SUPPLIES AS COMPUTED USING THE RESIDUAL METHOD
 UNCERTAINTY ANALYSIS OF LAKE ERIE NET BASIN SUPPLIES AS COMPUTED USING THE RESIDUAL METHOD By JACOB BRUXER, B.ENG., P.ENG. Abstract The Lake Erie net basin supply (NBS) is defined as the net volume of
FREEZING- RAIN IN THE GREAT LAKES
 About this Work GLISA participated in a winter climate adaptation project focused on Chicago, IL (http://glisaclimate.org/project/indicator-suite-and-winter-adaptation-measures-for-thechicago-climate-action-plan).
Training: Climate Change Scenarios for PEI. Training Session April Neil Comer Research Climatologist
 Training: Climate Change Scenarios for PEI Training Session April 16 2012 Neil Comer Research Climatologist Considerations: Which Models? Which Scenarios?? How do I get information for my location? Uncertainty
Regional offline land surface simulations over eastern Canada using CLASS. Diana Verseghy Climate Research Division Environment Canada
 Regional offline land surface simulations over eastern Canada using CLASS Diana Verseghy Climate Research Division Environment Canada The Canadian Land Surface Scheme (CLASS) Originally developed for the
Regional Climate Change Modeling: An Application Over The Caspian Sea Basin. N. Elguindi and F. Giorgi The Abdus Salam ICTP, Trieste Italy
 Regional Climate Change Modeling: An Application Over The Caspian Sea Basin N. Elguindi and F. Giorgi The Abdus Salam ICTP, Trieste Italy Outline I. Background and historical information on the Caspian
Climate Change and Stormwater. Daniel Brown, Research Associate, GLISA
 Climate Change and Stormwater Daniel Brown, Research Associate, GLISA Global Trends and Regional Trends Global trends are more certain than regional trends. Natural variability plays a larger role at the
CLIMATE MODEL DOWNSCALING: HOW DOES IT WORK AND WHAT DOES IT TELL YOU?
 rhgfdjhngngfmhgmghmghjmghfmf CLIMATE MODEL DOWNSCALING: HOW DOES IT WORK AND WHAT DOES IT TELL YOU? YAN FENG, PH.D. Atmospheric and Climate Scientist Environmental Sciences Division Argonne National Laboratory
A COMPUTERIZED ICE CONCENTRATION DATA BASE FOR THE GREAT LAKES
 NATIONAL OCEANIC AND ATMOSPHERIC ADMINISTRATION NOAA Data Report ERL GLERL-24 A COMPUTERIZED ICE CONCENTRATION DATA BASE FOR THE GREAT LAKES Raymond A. Assel NOAA, Great Lakes Environmental Research Laboratory,
Watershed simulation and forecasting system with a GIS-oriented user interface
 HydroGIS 96: Application of Geographic Information Systems in Hydrology and Water Resources Management (Proceedings of the Vienna Conference, April 1996). IAHS Publ. no. 235, 1996. 493 Watershed simulation
Appendix D. Model Setup, Calibration, and Validation
 . Model Setup, Calibration, and Validation Lower Grand River Watershed TMDL January 1 1. Model Selection and Setup The Loading Simulation Program in C++ (LSPC) was selected to address the modeling needs
GRACE Measurement of Total Water Storage Variations Over Texas
 GRACE Measurement of Total Water Storage Variations Over Texas Byron Tapley, Srinivas Bettadpur Himanshu Save, Tatyana Pekker University of Texas Center for Space Research First Texas Water Forum - Drought
DEVELOPMENT OF A LARGE-SCALE HYDROLOGIC PREDICTION SYSTEM
 JP3.18 DEVELOPMENT OF A LARGE-SCALE HYDROLOGIC PREDICTION SYSTEM Ji Chen and John Roads University of California, San Diego, California ABSTRACT The Scripps ECPC (Experimental Climate Prediction Center)
The PRECIS Regional Climate Model
 The PRECIS Regional Climate Model General overview (1) The regional climate model (RCM) within PRECIS is a model of the atmosphere and land surface, of limited area and high resolution and locatable over
Climates of NYS. Definitions. Climate Regions of NYS. Storm Tracks. Climate Controls 10/13/2011. Characteristics of NYS s Climates
 Definitions Climates of NYS Prof. Anthony Grande 2011 Weather and Climate Weather the state of the atmosphere at one point in time. The elements of weather are temperature, air pressure, wind and moisture.
EQ: Discuss main geographic landforms of the U.S. & Canada and examine varied landforms in relation to their lifestyles.
 EQ: Discuss main geographic landforms of the U.S. & Canada and examine varied landforms in relation to their lifestyles. Places & Terms for Discussion Appalachian Mountains Great Plains Canadian Shield
MxVision WeatherSentry Web Services Content Guide
 MxVision WeatherSentry Web Services Content Guide July 2014 DTN 11400 Rupp Drive Minneapolis, MN 55337 00.1.952.890.0609 This document and the software it describes are copyrighted with all rights reserved.
Sanjeev Kumar Jha Assistant Professor Earth and Environmental Sciences Indian Institute of Science Education and Research Bhopal
 Sanjeev Kumar Jha Assistant Professor Earth and Environmental Sciences Indian Institute of Science Education and Research Bhopal Email: sanjeevj@iiserb.ac.in 1 Outline 1. Motivation FloodNet Project in
The Coastal Field Data Collection Program (CFDC) Waves & Coastal Observations for the Corps and the Nation
 Waves & Coastal Observations for the Corps and the Nation") The Coastal Field Data Collection Program (CFDC) Waves & Coastal Observations for the Corps and the Nation Bill Birkemeier Program Manager William.Birkemeier@usace.army.mil 10 August 2010 US Army Corps
The Coastal Field Data Collection Program (CFDC) Waves & Coastal Observations for the Corps and the Nation Bill Birkemeier Program Manager William.Birkemeier@usace.army.mil 10 August 2010 US Army Corps
Estimation of Wave Heights during Extreme Events in Lake St. Clair
 Abstract Estimation of Wave Heights during Extreme Events in Lake St. Clair T. J. Hesser and R. E. Jensen Lake St. Clair is the smallest lake in the Great Lakes system, with a maximum depth of about 6
Hydrologic Overview & Quantities
 Hydrologic Overview & Quantities It is important to understand the big picture when attempting to forecast. This includes the interactive components and hydrologic quantities. Hydrologic Cycle The complexity
Climate Change Models: The Cyprus Case
 Climate Change Models: The Cyprus Case M. Petrakis, C. Giannakopoulos, G. Lemesios National Observatory of Athens AdaptToClimate 2014, Nicosia Cyprus Climate Research (1) Climate is one of the most challenging
Seasonality of Arctic Black Carbon Processes in the AMAP Multi-Model Ensemble
 Seasonality of Arctic Black Carbon Processes in the AMAP Multi-Model Ensemble R. Mahmood 1,2, K. von Salzen 3, M.G. Flanner 4, M. Sand 5, J. Langner 6, H. Wang 7, and L. Huang 8 1 School of Earth and Ocean
NOAA Great Lakes CoastWatch Program
 Great Lakes Workshop Series on Remote Sensing of Water Quality May 7-8, 2014 NOAA GLERL, 4840 South State Rd, Ann Arbor, MI NOAA Great Lakes CoastWatch Program CoastWatch is a nationwide National Oceanic
THE CANADIAN CENTRE FOR CLIMATE MODELLING AND ANALYSIS
 THE CANADIAN CENTRE FOR CLIMATE MODELLING AND ANALYSIS As Canada s climate changes, and weather patterns shift, Canadian climate models provide guidance in an uncertain future. CANADA S CLIMATE IS CHANGING
Annex I to Target Area Assessments
 Baltic Challenges and Chances for local and regional development generated by Climate Change Annex I to Target Area Assessments Climate Change Support Material (Climate Change Scenarios) SWEDEN September
What are the issues?
 Water Quality along Lake Huron What are the issues? Lake Huron Water Quality Algal fouling Irregular, less frequent, less widespread, but some significant local events Influences Tributaries contribute;
Meteorology 110. Lab 1. Geography and Map Skills
 Meteorology 110 Name Lab 1 Geography and Map Skills 1. Geography Weather involves maps. There s no getting around it. You must know where places are so when they are mentioned in the course it won t be
Development of the Hydrologic Model
 Kick-off meeting on enhancing hydrological data management and exchange procedures Water and Climate Adaptation Plan (WATCAP) for Sava River Basin Development of the Hydrologic Model David Heywood Team
Simulations of Lake Processes within a Regional Climate Model
 Simulations of Lake Processes within a Regional Climate Model Jiming Jin Departments of Watershed Sciences and Plants, Soils, and Climate Utah State University, Logan, Utah Utah State University 850 Faculty
Definitions Weather and Climate Climates of NYS Weather Climate 2012 Characteristics of Climate Regions of NYS NYS s Climates 1.
 Definitions Climates of NYS Prof. Anthony Grande 2012 Weather and Climate Weather the state of the atmosphere at one point in time. The elements of weather are temperature, t air pressure, wind and moisture.
Lake Tahoe Watershed Model. Lessons Learned through the Model Development Process
 Lake Tahoe Watershed Model Lessons Learned through the Model Development Process Presentation Outline Discussion of Project Objectives Model Configuration/Special Considerations Data and Research Integration
Supplementary Material: Characterizing Changes in Drought Risk for the United States from Climate Change [1] October 12, 2010
![Supplementary Material: Characterizing Changes in Drought Risk for the United States from Climate Change [1] October 12, 2010](/thumbs/78/77629162.jpg "Supplementary Material: Characterizing Changes in Drought Risk for the United States from Climate Change [1] October 12, 2010") Supplementary Material: Characterizing Changes in Drought Risk for the United States from Climate Change [1] Kenneth Strzepek a, Gary Yohe b, James Neumann c, Brent Boehlert d October 12, 2010 a Visiting
Supplementary Material: Characterizing Changes in Drought Risk for the United States from Climate Change [1] Kenneth Strzepek a, Gary Yohe b, James Neumann c, Brent Boehlert d October 12, 2010 a Visiting
Prepared by the North American Ice Service. 4 December Seasonal Outlook Great Lakes Winter
 Prepared by the North American Ice Service A collaboration of the Canadian Ice Service and the National/Naval Ice Center 4 December 2008 Seasonal Outlook Great Lakes Winter 2008-2009 - 1 - Table of contents
Basins-Level Heavy Rainfall and Flood Analyses
 Basins-Level Heavy Rainfall and Flood Analyses Peng Gao, Greg Carbone, and Junyu Lu Department of Geography, University of South Carolina (gaop@mailbox.sc.edu, carbone@mailbox.sc.edu, jlu@email.sc.edu)
CLIMATE CHANGE DATA PROJECTIONS FOR ONTARIO AND THE GREAT LAKES BASIN
 CLIMATE CHANGE DATA PROJECTIONS FOR ONTARIO AND THE GREAT LAKES BASIN ECO Climate Data Roundtable, January 8, 2014 Richard Peltier, Physics, U Toronto Regional Data Sets of Climate Change Projections 2
Appendix E: Over-land Meteorology
 Appendix E: Over-land Meteorology Measurement Converter Table U.S. to Metric Length feet x 0.305 = meters miles x 1.6 = kilometers Volume cubic feet x 0.03 = cubic meters gallons x 3.8 = liters Area square
Great Lakes Information Network GIS (Queryable by topic, geography, organization, and upload date 73 layers as of October, 2009)
") Google Earth Files for the Great Lakes and Beyond GLOS Mapping Workshop Alpena, Michigan November 9, 2009 David Hart GIS Specialist University of Wisconsin Sea Grant Institute GREAT LAKES Great Lakes Information
Google Earth Files for the Great Lakes and Beyond GLOS Mapping Workshop Alpena, Michigan November 9, 2009 David Hart GIS Specialist University of Wisconsin Sea Grant Institute GREAT LAKES Great Lakes Information
The Hydrologic Cycle
 The Hydrologic Cycle Monthly precipitation for the central Arctic Ocean based on data from the Russian North Pole manned camps with daily bias adjustments. Raw precipitation totals are shown along with
Atmospheric Processes
 Atmospheric Processes Atmospheric prognostic variables Wind Temperature Humidity Cloud Water/Ice Atmospheric processes Mixing Radiation Condensation/ Evaporation Precipitation Surface exchanges Friction
Climate Change or Climate Variability?
 Climate Change or Climate Variability? Key Concepts: Greenhouse Gas Climate Climate change Climate variability Climate zones Precipitation Temperature Water cycle Weather WHAT YOU WILL LEARN 1. You will
Activity 2.2: Recognizing Change (Observation vs. Inference)
") Activity 2.2: Recognizing Change (Observation vs. Inference) Teacher Notes: Evidence for Climate Change PowerPoint Slide 1 Slide 2 Introduction Image 1 (Namib Desert, Namibia) The sun is on the horizon
Activity 2.2: Recognizing Change (Observation vs. Inference) Teacher Notes: Evidence for Climate Change PowerPoint Slide 1 Slide 2 Introduction Image 1 (Namib Desert, Namibia) The sun is on the horizon
Torben Königk Rossby Centre/ SMHI
 Fundamentals of Climate Modelling Torben Königk Rossby Centre/ SMHI Outline Introduction Why do we need models? Basic processes Radiation Atmospheric/Oceanic circulation Model basics Resolution Parameterizations
Lake and Climate Models Linkage: A 3D Hydrodynamic Contribution
 Lake and Climate Models Linkage: A 3D Hydrodynamic Contribution Luis F. Leon 1a,b, David Lam 2, William Schertzer 2 and David Swayne 1b 1a University of Waterloo, Waterloo, Ontario, N2G3L1 (lfleonvi@uwaterloo.ca)
Arctic Climate Change. Glen Lesins Department of Physics and Atmospheric Science Dalhousie University Create Summer School, Alliston, July 2013
 Arctic Climate Change Glen Lesins Department of Physics and Atmospheric Science Dalhousie University Create Summer School, Alliston, July 2013 When was this published? Observational Evidence for Arctic
Climate Projections and Energy Security
 NOAA Research Earth System Research Laboratory Physical Sciences Division Climate Projections and Energy Security Andy Hoell and Jim Wilczak Research Meteorologists, Physical Sciences Division 7 June 2016
Investigation 11.3 Weather Maps
 Name: Date: Investigation 11.3 Weather Maps What can you identify weather patterns based on information read on a weather map? There have been some amazing technological advancements in the gathering and
INTRODUCTION TO HEC-HMS
 INTRODUCTION TO HEC-HMS Hydrologic Engineering Center- Hydrologic Modeling System US Army Corps of Engineers Hydrologic Engineering Center HEC-HMS Uses Schematics Enter properties: watershed, rivers (reaches),
Sierra Weather and Climate Update
 Sierra Weather and Climate Update 2014-15 Kelly Redmond Western Regional Climate Center Desert Research Institute Reno Nevada Yosemite Hydroclimate Workshop Yosemite Valley, 2015 October 8-9 Percent of
Assessing Spatial and Temporal Distribution of Sediment, Nitrogen and Phosphorous Loading in the Missouri River Basin (MORB)
") Assessing Spatial and Temporal Distribution of Sediment, Nitrogen and Phosphorous Loading in the Missouri River Basin (MORB) Zhonglong Zhang, PhD, PE, May Wu, PhD LimnoTech, Environmental Laboratory, ERDC,
Assessing Spatial and Temporal Distribution of Sediment, Nitrogen and Phosphorous Loading in the Missouri River Basin (MORB) Zhonglong Zhang, PhD, PE, May Wu, PhD LimnoTech, Environmental Laboratory, ERDC,
Three main areas of work:
 Task 2: Climate Information 1 Task 2: Climate Information Three main areas of work: Collect historical and projected weather and climate data Conduct storm surge and wave modeling, sea-level rise (SLR)
Modeling Climate Change in the Red River Basin: Results and Discussion
 Modeling Climate Change in the Red River Basin: Results and Discussion A Presentation To: 2016 RiverWare Users Group Presented By: Cody Hudson, P.E. August 23 rd, 2016 1 Background Funding South Central
Supplementary Figure S1: Uncertainty of runoff changes Assessments of. R [mm/yr/k] for each model and the ensemble mean.
![Supplementary Figure S1: Uncertainty of runoff changes Assessments of. R [mm/yr/k] for each model and the ensemble mean.](/thumbs/91/104794017.jpg "Supplementary Figure S1: Uncertainty of runoff changes Assessments of. R [mm/yr/k] for each model and the ensemble mean.") Supplementary Figure S1: Uncertainty of runoff changes Assessments of R [mm/yr/k] for each model and the ensemble mean. 1 Supplementary Figure S2: Schematic diagrams of methods The top panels show uncertainty
Supplementary Figure S1: Uncertainty of runoff changes Assessments of R [mm/yr/k] for each model and the ensemble mean. 1 Supplementary Figure S2: Schematic diagrams of methods The top panels show uncertainty
The role of soil moisture in influencing climate and terrestrial ecosystem processes
 1of 18 The role of soil moisture in influencing climate and terrestrial ecosystem processes Vivek Arora Canadian Centre for Climate Modelling and Analysis Meteorological Service of Canada Outline 2of 18
The South Eastern Australian Climate Initiative
 The South Eastern Australian Climate Initiative Phase 2 of the South Eastern Australian Climate Initiative (SEACI) is a three-year (2009 2012), $9 million research program investigating the causes and
Midwest/Great Plains Climate-Drought Outlook September 20, 2018
 Midwest/Great Plains Climate-Drought Outlook September 20, 2018 Brian Fuchs National Drought Mitigation Center University of Nebraska-Lincoln School of Natural Resources September 20, 2018 General Information
CGE TRAINING MATERIALS ON VULNERABILITY AND ADAPTATION ASSESSMENT. Climate change scenarios
 CGE TRAINING MATERIALS ON VULNERABILITY AND ADAPTATION ASSESSMENT Climate change scenarios Outline Climate change overview Observed climate data Why we use scenarios? Approach to scenario development Climate
Temporal and Spatial Variability of Great Lakes Ice Cover, *
 1318 J O U R N A L O F C L I M A T E VOLUME 25 Temporal and Spatial Variability of Great Lakes Ice Cover, 1973 2010* JIA WANG NOAA/Great Lakes Environmental Research Laboratory, Ann Arbor, Michigan XUEZHI
Climate Dataset: Aitik Closure Project. November 28 th & 29 th, 2018
 1 Climate Dataset: Aitik Closure Project November 28 th & 29 th, 2018 Climate Dataset: Aitik Closure Project 2 Early in the Closure Project, consensus was reached to assemble a long-term daily climate
A PARAMETER ESTIMATE FOR THE LAND SURFACE MODEL VIC WITH HORTON AND DUNNE RUNOFF MECHANISM FOR RIVER BASINS IN CHINA
 A PARAMETER ESTIMATE FOR THE LAND SURFACE MODEL VIC WITH HORTON AND DUNNE RUNOFF MECHANISM FOR RIVER BASINS IN CHINA ZHENGHUI XIE Institute of Atmospheric Physics, Chinese Academy of Sciences Beijing,
Using a library of downscaled climate projections to teach climate change analysis
 Using a library of downscaled climate projections to teach climate change analysis Eugene Cordero, Department of Meteorology San Jose State University Overview of Dataset Climate change activity Applications
SAMPLE. SITE SPECIFIC WEATHER ANALYSIS Wind Report. Robinson, Smith & Walsh. John Smith REFERENCE:
 SAMPLE SITE SPECIFIC WEATHER ANALYSIS Wind Report PREPARED FOR: Robinson, Smith & Walsh John Smith REFERENCE: JACK HIGGINS / 4151559-01 CompuWeather Sample Report Please note that this report contains
Appendix 2: Hydrometeorology and Hydroclimatology of Baseflow. Page 1 of 19
 Appendix 2: Hydrometeorology and Hydroclimatology of Baseflow Page 1 of 19 A time series of end of month soil moisture data was developed for each climate division in the United States from 1931 to present
Chiang Rai Province CC Threat overview AAS1109 Mekong ARCC
 Chiang Rai Province CC Threat overview AAS1109 Mekong ARCC This threat overview relies on projections of future climate change in the Mekong Basin for the period 2045-2069 compared to a baseline of 1980-2005.
Earth Science. Lab 21: Weather Patterns
 Name: Lab 21: Weather Patterns Earth Science Date: Introduction: A basic principle in Earth Science is that energy is constantly bringing about changes. In order to understand the changing Earth, we must
REPORT OF THE CBS-LC-NOAA/NCEI FOR GCOS
 WORLD METEOROLOGICAL ORGANIZATION CBS LEAD CENTRES FOR GCOS (31.08.2016) Original: ENGLISH REPORT OF THE CBS-LC-NOAA/NCEI FOR GCOS (Submitted by Jay Lawrimore, Bryant Korzeniewski, and Matt Menne NOAA/National
5. General Circulation Models
 5. General Circulation Models I. 3-D Climate Models (General Circulation Models) To include the full three-dimensional aspect of climate, including the calculation of the dynamical transports, requires