A NEMO-based hydrodynamic/hydraulic system for the Great Lakes. F. Dupont, P. Chittibabu, A. Huang, R. Yerubandi, V. Fortin, Y. Lu
|
|
|
- Miles Cox
- 5 years ago
- Views:
Transcription
1 A NEMO-based hydrodynamic/hydraulic system for the Great Lakes F. Dupont, P. Chittibabu, A. Huang, R. Yerubandi, V. Fortin, Y. Lu
2 Objectives: Development of a coupled hydrological forecasting system for the Great Lakes: Improved weather forecast, lake conditions (ice, temperature, currents, lake level, storm surge, waves), hydraulic conditions through the connecting channels, water quality (to come).

3 Figure, courtesy of G. Reffray, NEATL36 domain, Mercator-Ocean NEMO: OPA ocean component+lim2 ocean component
4 Features: originally designed for climate studies now used for operational oceanography ( C-grid FD z level model with partial steps (soon z*) Energy-enstrophy conservative scheme TVD tracer advection tides included +VVL option 2-way nesting (AGRIF) LIM2: 3 layer ice-snow model + VP dynamics (upcoming LIM3 is multi-category and EVP based) Is now the workhorse at EC-DFO, collaboration with Mercator-Ocean, implementation of their data-assimilation system.
, MESH (GEMsurf and")

5 Presentation of the proposed forecasting system for lake level, river flows, temperature and currents 2km grid NEMO is forced by GEM and CAPA (full coupling in progress), MESH (GEMsurf and river router) and follows the regulation rules for the connecting channels. Compact grid of 355x435x35. Expecting coupling to a 2D barotropic FE river model for SaintLawrence river/upper estuary

6 Example of output from MESH
7 Based on the river head position, a river forcing is derived from MESH for NEMO

8 Example, SST on July 1, 2005 from model (with fluxsurf)
9 Intercomparison of 4 hydrodynamic models for Lake Ontario and some ice season results


10 Experimental program in 2006 to provide forcings for Hydrodynamic & Water Quality Modeling in Lake Ontario 3 met buoys & land station with solar radiation measurements, used for forcing models ADCPs: 1266, 1269, 1270 Water levels at 4 stations All: thermistor chains Water Survey of Canada inflows & water levels
11 Model short description Models CANDIE ELCOM POM NEMO Z-coordinate Z Z sigma Z, partial steps KPP Mixed layer Imberger MY2.5 GASPAR1.5 Vertical levels Thickness 1st level 1m 1m 2-20 cm 1m Rad. heat flux net net net descending Turbulent heat flux Bulk Bulk Bulk Schertzer CORE Bulk Turbulence scheme
12 Temperature at station 403 No model captured very well the deeper mixed layer and the very sharp thermocline

13 Temperature at station 586 ELCOM and CANDIE show the least amount of diffusion below the thermocline in June-July

14 Temperature at station 1263 No model captured the 2 cold water penetrations (upwelling?)
15 Temperature at station 1269 NEMO shows the best restratification in early fall, captures also well the 3 episodic upwellings during summer. It is also the deepest there.

16 Temperature at station 752 Strong downwelling event in late August-early September. ELCOM got it best.
 CANDIE is usually the best model for surface error and NEMO is usually better at")
17 RMS Error plot at each station in function of depth All models missed a cold water penetration event in mid-summer (bottom) CANDIE is usually the best model for surface error and NEMO is usually better at depth
18 RMS Error tabulated for all temperature stations, averaged for at most the 50m upper meter Stations CANDIE ELCOM POM NEMO CCIW Mean

19 ADCP measurement Station 1266 CANDIE did not well capture the intense event of early September, although all models show an equivalent signal in temperature
20 ADCP measurement Station 1270 A lot of small events. NEMO and CANDIE captured the reduced penetration of an intense slap at the end of September. All models captured the associated restratification.

21 RMS Error at each velocity station in function of depth
22 RMS Error vertically averaged at each velocity station over at most 50m Stations CANDIE ELCOM POM NEMO Mean
23 Last year intercomparison with more common features Models Z-coordinate Turbulence scheme CANDIE POM NEMO Z sigma Z, partial steps KPP MY2.5 GASPAR1.5 Vertical levels Thickness 1st level 1m 2-20 cm 1m Forcing GEM 40m GEM 40m GEM 40m Turbulent heat flux Bulk Schertzer Bulk Schertzer Bulk Schertzer The forcing and bulk parametrization pair is not ideal presently working on fixing this. Candie was not started similarly to the 2 other models Effect of different vertical grid in CANDIE and NEMO (60 versus 35 zlevels) was tested in NEMO but did not draw any clear winner
24 RMS Error tabulated for all temperature stations, averaged for at most the 50m upper meter Stations CANDIE POM NEMO CCIW Mean In red the best scores

25 AVHRR satellite comparison with model SST Ontario + Erie 2006 Init problem in CANDIE? Spring warming not coinciding with obs.

26 AVHRR satellite comparison with model SST Ontario + Erie 2005


27 Example of problem in Central Lake Erie with thermocline representation The thermocline is very sharp and survives until the end of September. Impact of oxygen depletion Candie has the longest surviving deep layer
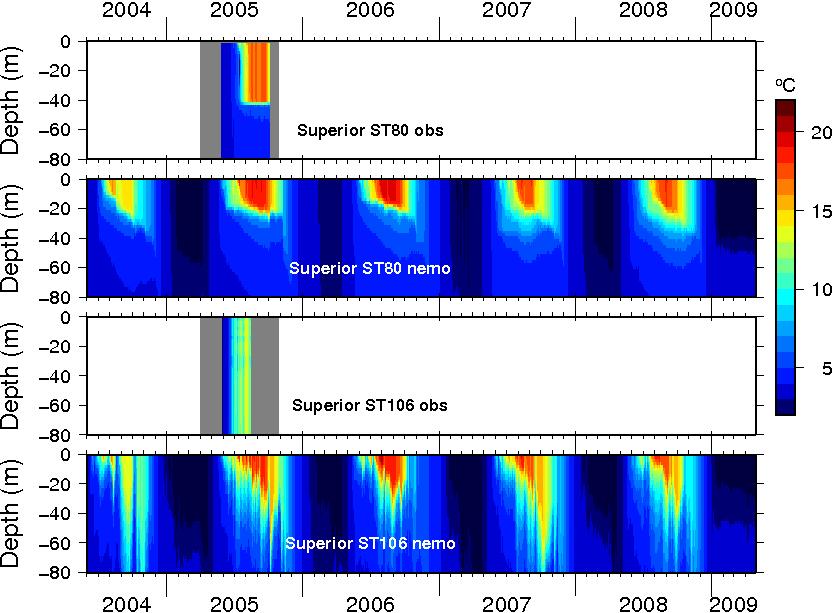

28 Thermocline in Lake Superior
29 Validation of the hydraulic and hydrology in NEMO 2 experiments: NEMO with CORE bulk formulae NEMO with RPN bulk formulae + Deacu et al.'s (2011, submitted) corrections

30 Validation of NEMOregulation model against offline calculation and observations. Black: obs., blue:expected levels based on NEMO evaporation and river routing, red modelled by NEMO. There are no defined regulation rules for Lake Ontario, so an adhoc equation for the outflow is used there instead. One remaining problem: NEMO evaporation is too strong in the upper lakes and leads to weaker than observed connecting flows. Corrections implemented in GEM bulk formulae to fix the same problem have been ported to NEMO but do not completely solve the problem

31 Validation of NEMOregulation model against offline calculation and observations for the flow through the connecting channels. Evaporation again leads to the flow at St-Marys reaching the minimum limit.

32 Monthly Net Basin Supply (i.e. Runoff+P-E; mm/month) for each lake, NEMO in blue, red from MESH, residual obs.nbs in black. MESH NBS was compared advantageously to weather tower measurements and GLERL estimates

33 Monthly evaporation (mm/month) for each lake, NEMO in blue, red from MESH. NEMO seems to overestimate evaporation in most lakes, but not by a large factor!

34 The cumulated evaporation from MESH and NEMO indicates that NEMO evaporation agrees well in Ontario, Michigan and Huron but less elsewhere

35 Comparison of lake-averaged temperature timeseries for GLSEA, CMC analysis, NEMO with CORE or fluxsuf bulk formula: NEMO with CORE bulk has a bit of a positive bias, but with fluxsurf, the bias can increased to 2 degc. Question: why GLSEA and CMC analysis disagree in spring in Lake Superior?


36 Comparison of lake-averaged temperature timeseries for GLSEA, CMC analysis, NEMO with CORE or fluxsuf bulk formula: NEMO with CORE bulk has a bit of a positive bias, but with fluxsurf, the bias can increased to 2 degc. Question: why GLSEA and CMC analysis disagree in spring in Lake Superior?

37 NEMOCORE-BLK Ice Season Results not as nice, but still reasonable
38 NEMO-RPNBLK Ice Season NEMO does a fair job at reproducing the mean ice concentration of each lake, even though Huron and Erie are slightly underestimated
39 Week Ice Season

40 Week Ice Season

41 Week Ice Season
42 Week Ice Season

43 Week Ice Season

44 Week Ice Season
45 Week Ice Season
46 Week Ice Season

47 Week Ice Season

48 Week Ice Season
49 Coupling: GEM LAM 15km collocated with regional GEM. Grid of 150x150 Same timestep for both models.

50 NEMO-GEM coupling after 24 hours

51 GEM driven by fixed analysis after 24 hours
52 Data assimilation: Global CMC SST analysis too coarse but could be used to adjust the lakeaveraged temperature in the mixed layer sea ice concentration can be inserted lake level can be inserted
53 A bright future: GEM with even more resolution: Example of GEM2.5 in Lake Superior for one case

54
55


56 Wind field as seen by 15km and 2.5km GEM model as the frontal system is passing over Stannard Rock GEM 15 km GEM 2.5 km
57 Conclusions: NEMO has been validated in an intercomparison project with positive results Main remaining problem: surface mixed layer physics: fetch issue over lake? Lack of salinity? Lack of mixing by internal waves? => impact SST and heat fluxes => lake level Coupling under progress, hindcast over expected Coupling to St-Lawrence FE model to come, Lake Champlain, water quality? Possible coupling with 2.5 km GEM LAM?
A WATER CYCLE PREDICTION SYSTEM
 A WATER CYCLE PREDICTION SYSTEM FOR THE GREAT LAKES AND ST. LAWRENCE RIVER V. Fortin 1, D. Durnford 2, G. Smith 1, P. Matte 1, M. Mackay 1, N. Bernier 1... and many others 1 Meteorological Research Division,
Great Lakes Update. Volume 199: 2017 Annual Summary. Background
 Great Lakes Update Volume 199: 2017 Annual Summary Background The U.S. Army Corps of Engineers (USACE) tracks and forecasts the water levels of each of the Great Lakes. This report is primarily focused
Great Lakes Update. Volume 191: 2014 January through June Summary. Vol. 191 Great Lakes Update August 2014
 Great Lakes Update Volume 191: 2014 January through June Summary The U.S. Army Corps of Engineers (USACE) monitors the water levels of each of the Great Lakes. This report provides a summary of the Great
Great Lakes Update. Volume 193: 2015 January through June Summary. Vol. 193 Great Lakes Update August 2015
 Great Lakes Update Volume 193: 2015 January through June Summary The U.S. Army Corps of Engineers (USACE) monitors the water levels of each of the Great Lakes. This report provides a summary of the Great
A 3D Hydrodynamic Lake Model: Simulation on Great Slave Lake
 A 3D Hydrodynamic Lake Model: Simulation on Great Slave Lake Luis F. León 1, David C.L. Lam 2, William M. Schertzer 2 and David A. Swayne 3 1 University of Waterloo, Waterloo, ON, Canada: lfleonvi@uwaterloo.ca
Simulations of Lake Processes within a Regional Climate Model
 Simulations of Lake Processes within a Regional Climate Model Jiming Jin Departments of Watershed Sciences and Plants, Soils, and Climate Utah State University, Logan, Utah Utah State University 850 Faculty
Circulation, Temperature and Dissolved Oxygen in Lake Erie
 Circulation, Temperature and Dissolved Oxygen in Lake Erie Ram Yerubandi Environment Canada/ National Water Research Institute Burlington, Canada Nathan Hawley NOAA-Great Lakes Environmental Laboratory
Great Lakes Update. Volume 188: 2012 Annual Summary
 Great Lakes Update Volume 188: 2012 Annual Summary Background The U.S. Army Corps of Engineers (USACE) tracks the water levels of each of the Great Lakes. This report highlights hydrologic conditions of
Great Lakes Update. Volume 194: 2015 Annual Summary
 Great Lakes Update Volume 194: 2015 Annual Summary Background The U.S. Army Corps of Engineers (USACE) tracks and forecasts the water levels of each of the Great Lakes. This report summarizes the hydrologic
Storm surge forecasting and other Met Office ocean modelling
 Storm surge forecasting and other Met Office ocean modelling EMODnet stakeholder meeting Clare O Neill + many others Outline Ocean modelling at the Met Office Storm surge forecasting Current operational
Canadian contribution to the Year of Polar Prediction: deterministic and ensemble coupled atmosphere-ice-ocean forecasts
 Canadian contribution to the Year of Polar Prediction: deterministic and ensemble coupled atmosphere-ice-ocean forecasts G.C. Smith, F. Roy, J.-F. Lemieux, F. Dupont, J-M Belanger and the CONCEPTS team
Update on Coupled Air-Sea-Ice Modelling
 Update on Coupled Air-Sea-Ice Modelling H. Ritchie 1,4, G. Smith 1, J.-M. Belanger 1, J-F Lemieux 1, C. Beaudoin 1, P. Pellerin 1, M. Buehner 1, A. Caya 1, L. Fillion 1, F. Roy 2, F. Dupont 2, M. Faucher
ECCC/CCMEP variable resolution modelling of the Hudson Bay watershed
 ECCC/CCMEP variable resolution modelling of the Hudson Bay watershed Vincent Fortin (and many collaborators) Division de la recherche en météorologie Environnement en Changement climatique Canada GEM-based
Climatology of the Arctic Ocean based on NEMO results
 Climatology of the Arctic Ocean based on NEMO results SU Jie (sujie@ouc.edu.cn), LI Xiang, ZHANG Yang Key Lab of Polar Oceanography and Global Ocean Change Ocean University of China, Qingdao, China Cooperator:
HYCOM Caspian Sea Modeling. Part I: An Overview of the Model and Coastal Upwelling. Naval Research Laboratory, Stennis Space Center, USA
 HYCOM Caspian Sea Modeling. Part I: An Overview of the Model and Coastal Upwelling By BIROL KARA, ALAN WALLCRAFT AND JOE METZGER Naval Research Laboratory, Stennis Space Center, USA MURAT GUNDUZ Institute
Current status of lake modelling and initialisation at ECMWF
 Current status of lake modelling and initialisation at ECMWF G Balsamo, A Manrique Suñen, E Dutra, D. Mironov, P. Miranda, V Stepanenko, P Viterbo, A Nordbo, R Salgado, I Mammarella, A Beljaars, H Hersbach
The CONCEPTS Global Ice-Ocean Prediction System Establishing an Environmental Prediction Capability in Canada
 The CONCEPTS Global Ice-Ocean Prediction System Establishing an Environmental Prediction Capability in Canada WWOSC 2014 Montreal, Quebec, Canada Dorina Surcel Colan 1, Gregory C. Smith 2, Francois Roy
CLIMATE CHANGE DATA PROJECTIONS FOR ONTARIO AND THE GREAT LAKES BASIN
 CLIMATE CHANGE DATA PROJECTIONS FOR ONTARIO AND THE GREAT LAKES BASIN ECO Climate Data Roundtable, January 8, 2014 Richard Peltier, Physics, U Toronto Regional Data Sets of Climate Change Projections 2
Great Lakes Update. Great Lakes Winter and Spring Summary January June Vol. 187 Great Lakes Update August 2012
 Great Lakes Update Great Lakes Winter and Spring Summary January June 2012 The US Army Corps of Engineers (USACE) Detroit District monitors hydraulic and hydrologic conditions of the Great Lakes. This
Lake and Climate Models Linkage: A 3D Hydrodynamic Contribution
 Lake and Climate Models Linkage: A 3D Hydrodynamic Contribution Luis F. Leon 1a,b, David Lam 2, William Schertzer 2 and David Swayne 1b 1a University of Waterloo, Waterloo, Ontario, N2G3L1 (lfleonvi@uwaterloo.ca)
Interactive Lakes in the Canadian Regional Climate Model, versions 4 and 5
 2nd Workshop on Parameterization of Lakes in Numerical Weather Prediction and Climate Modelling Norrköping, Sweden, September 15-17 21 Interactive Lakes in the Canadian Regional Climate Model, versions
PHYSICAL PROPERTIES TAHOE.UCDAVIS.EDU 8
 PHYSICAL PROPERTIES 8 Lake surface level Daily since 1900 Lake surface level varies throughout the year. Lake level rises due to high stream inflow, groundwater inflow, and precipitation directly onto
Project of Strategic Interest NEXTDATA. Deliverables D1.3.B and 1.3.C. Final Report on the quality of Reconstruction/Reanalysis products
 Project of Strategic Interest NEXTDATA Deliverables D1.3.B and 1.3.C Final Report on the quality of Reconstruction/Reanalysis products WP Coordinator: Nadia Pinardi INGV, Bologna Deliverable authors Claudia
Seasonal variations of vertical structure in the deep waters of the Southern Caspian Sea
 278 Research in Marine Sciences Volume 3, Issue 1, 2018 Pages 278-286 Seasonal variations of vertical structure in the deep waters of the Southern Caspian Sea Somayeh Nahavandian 1,*, and Alireza Vasel
Water Stratification under Wave Influence in the Gulf of Thailand
 Water Stratification under Wave Influence in the Gulf of Thailand Pongdanai Pithayamaythakul and Pramot Sojisuporn Department of Marine Science, Faculty of Science, Chulalongkorn University, Bangkok, Thailand
Water Cycle Prediction on the Prairies
 Water Cycle Prediction on the Prairies A. Pietroniro, S. Marin, A. Liu, B. Davison, B. Toth, D. Shaw(AAFC), L. Martz Hydrometerology and Arctic Lab, Environment Canada, NHRC and Centre for Hydrology, University
Climate Change Impacts on Great Lakes Water Levels. Andrew Gronewold, Ph.D., P.E.
 Climate Change Impacts on Great Lakes Water Levels Andrew Gronewold, Ph.D., P.E. drew.gronewold@noaa.gov Great Lakes Environmental Research Laboratory National Oceanic and Atmospheric Administration The
Delineation of Intake Protection Zones in the CRCA jurisdiction Modeling Approach
 Delineation of Intake Protection Zones in the CRCA jurisdiction Modeling Approach April 27, 29 Prepared by: Shastri Paturi and Leon Boegman Centre for Water and the Environment Department of Civil Engineering
SIO 210 Introduction to Physical Oceanography Mid-term examination November 3, 2014; 1 hour 20 minutes
 NAME: SIO 210 Introduction to Physical Oceanography Mid-term examination November 3, 2014; 1 hour 20 minutes Closed book; one sheet of your own notes is allowed. A calculator is allowed. (100 total points.)
Evolution of the Mercator Océan system, main components for reanalysis and forecast
 Evolution of the Mercator Océan system, main components for reanalysis and forecast Y. Drillet, J.M. Lellouche, O. Le Galloudec, M. Drévillon, G. Garric, R. Bourdallé- Badie, C. Bricaud, J. Chanut, G.
Coupling of the Canadian Regional Climate Model with lake models
 Workshop on Parametrization of Lakes in Numerical Weather Prediction and Climate Modelling 18-2 September 28, St. Petersburg (Zelenogorsk), Russia Coupling of the Canadian Regional Climate Model with lake
A Modeling Study on Flows in the Strait of Hormuz (SOH)
") A Modeling Study on Flows in the Strait of Hormuz (SOH) Peter C Chu & Travis Clem Naval Postgraduate School Monterey, CA 93943, USA IUGG 2007: PS005 Flows and Waves in Straits. July 5-6, Perugia, Italy
A Modeling Study on Flows in the Strait of Hormuz (SOH) Peter C Chu & Travis Clem Naval Postgraduate School Monterey, CA 93943, USA IUGG 2007: PS005 Flows and Waves in Straits. July 5-6, Perugia, Italy
HWRF Ocean: MPIPOM-TC
 HWRF v3.7a Tutorial Nanjing, China, December 2, 2015 HWRF Ocean: MPIPOM-TC Ligia Bernardet NOAA SRL Global Systems Division, Boulder CO University of Colorado CIRS, Boulder CO Acknowledgement Richard Yablonsky
PH YSIC A L PROPERT IE S TERC.UCDAVIS.EDU
 PH YSIC A L PROPERT IE S 8 Lake surface level Daily since 1900 Lake surface level varies throughout the year. Lake level rises due to high stream inflow, groundwater inflow and precipitation directly onto
Great Lakes Update. Background
 Great Lakes Update Background The U.S. Army Corps of Engineers, Detroit District, monitors and forecasts the water levels of the Great Lakes. This report summarizes the hydrologic conditions of the Great
Sea Ice Forecast Verification in the Canadian Global Ice Ocean Prediction System
 Sea Ice Forecast Verification in the Canadian Global Ice Ocean Prediction System G Smith 1, F Roy 2, M Reszka 2, D Surcel Colan, Z He 1, J-M Belanger 1, S Skachko 3, Y Liu 3, F Dupont 2, J-F Lemieux 1,
S e a s o n a l F o r e c a s t i n g f o r t h e E u r o p e a n e n e r g y s e c t o r
 S e a s o n a l F o r e c a s t i n g f o r t h e E u r o p e a n e n e r g y s e c t o r C3S European Climatic Energy Mixes (ECEM) Webinar 18 th Oct 2017 Philip Bett, Met Office Hadley Centre S e a s
Modeling the Columbia River Plume on the Oregon Shelf during Summer Upwelling. 2 Model
 Modeling the Columbia River Plume on the Oregon Shelf during Summer Upwelling D. P. Fulton August 15, 2007 Abstract The effects of the Columbia River plume on circulation on the Oregon shelf are analyzed
Decline of Lake Michigan-Huron Levels Caused by Erosion of the St. Clair River
 Decline of Lake Michigan-Huron Levels Caused by Erosion of the St. Clair River W.F. & Associates Coastal Engineers (in association with Frank Quinn) April 13, 2005 Outline Problem Definition Understanding
The Forecasting Ocean Assimilation Model System
 The Forecasting Ocean Assimilation Model System Mike Bell 25 Sept 2004 mike.bell@metoffice.gov.uk Crown copyright 2004 Page 1 Content Summary of capability and formulation Trouble shooting Assessments
Air-Sea Interaction and the MJO
 Air-Sea Interaction and the MJO Julia Slingo with thanks to Dan Bernie, Eric Guilyardi, Pete Inness, Hilary Spencer and Steve Woolnough NCAS Centre for Global Atmospheric Modelling University of Reading
Modelling the Channel and the Bay of Biscay using the MARS model. Contributions: Dyneco Physed / Pelagos / Benthos EMH
 Modelling the Channel and the Bay of Biscay using the MARS model Contributions: Dyneco Physed / Pelagos / Benthos EMH Overview 1. The MANGA Configuration 2. Model validation: Sea Surface Temperature 3.
ATOC 5051 INTRODUCTION TO PHYSICAL OCEANOGRAPHY. Lecture 19. Learning objectives: develop a physical understanding of ocean thermodynamic processes
 ATOC 5051 INTRODUCTION TO PHYSICAL OCEANOGRAPHY Lecture 19 Learning objectives: develop a physical understanding of ocean thermodynamic processes 1. Ocean surface heat fluxes; 2. Mixed layer temperature
Assimilation Impact of Physical Data on the California Coastal Ocean Circulation and Biogeochemistry
 Assimilation Impact of Physical Data on the California Coastal Ocean Circulation and Biogeochemistry Yi Chao, Remote Sensing Solutions (RSS)/UCLA; John D. Farrara, RSS; Fei Chai, University of Maine; Hongchun
GFDL, NCEP, & SODA Upper Ocean Assimilation Systems
 GFDL, NCEP, & SODA Upper Ocean Assimilation Systems Jim Carton (UMD) With help from Gennady Chepurin, Ben Giese (TAMU), David Behringer (NCEP), Matt Harrison & Tony Rosati (GFDL) Description Goals Products
psio 210 Introduction to Physical Oceanography Mid-term examination November 3, 2014; 1 hour 20 minutes Answer key
 NAME: psio 210 Introduction to Physical Oceanography Mid-term examination November 3, 2014; 1 hour 20 minutes Answer key Closed book; one sheet of your own notes is allowed. A calculator is allowed. (100
Provide dynamic understanding of physical environment for ecosystem science and offshore operations and planning.
 ENHANCING THE CANADIAN METAREAS OPERATIONAL COUPLED OCEAN-ICE- ATMOSPHERE ANALYSIS AND FORECASTING SYSTEM FOR FINE-SCALE APPLICATIONS IN THE BEAUFORT SEA by Fraser Davidson, Greg Smith, Youyu Lu, Jean-Francois
Extreme Weather and Climate Change: the big picture Alan K. Betts Atmospheric Research Pittsford, VT NESC, Saratoga, NY
 Extreme Weather and Climate Change: the big picture Alan K. Betts Atmospheric Research Pittsford, VT http://alanbetts.com NESC, Saratoga, NY March 10, 2018 Increases in Extreme Weather Last decade: lack
Recent Developments in the Navy Coastal Ocean Model and its application as the ocean component in regional coupled forecast models
 Recent Developments in the Navy Coastal Ocean Model and its application as the ocean component in regional coupled forecast models Tommy Jensen, Paul Martin, Clark Rowley, Tim Campbell, Richard Allard,
HYCOM Caspian Sea Modeling. Part I: An Overview of the Model and Coastal Upwelling. Naval Research Laboratory, Stennis Space Center, USA
 HYCOM Caspian Sea Modeling. Part I: An Overview of the Model and Coastal Upwelling By BIROL KARA, ALAN WALLCRAFT AND JOE METZGER Naval Research Laboratory, Stennis Space Center, USA MURAT GUNDUZ Institute
Land Surface: Snow Emanuel Dutra
 Land Surface: Snow Emanuel Dutra emanuel.dutra@ecmwf.int Slide 1 Parameterizations training course 2015, Land-surface: Snow ECMWF Outline Snow in the climate system, an overview: Observations; Modeling;
John Kindle. Sergio derada Igor Shulman Ole Martin Smedstad Stephanie Anderson. Data Assimilation in Coastal Modeing April
 John Kindle Sergio derada Igor Shulman Ole Martin Smedstad Stephanie Anderson Data Assimilation in Coastal Modeing April 3 2007 MODELS Motivation: Global->Coastal Real-Time Regional Coastal Models Global
Evaluation of the sea ice forecast at DMI
 DMI Evaluation of the sea ice forecast at DMI Till A. S. Rasmussen 1 Kristine S. Madsen 1, Mads H. Ribergaard 1, Leif T.Pedersen 1, Jacob L Høyer 1, Gorm Dybkjær 1, Mads Bruun Poulsen 2 and Sofie Abildgaard
Water Balance in the Murray-Darling Basin and the recent drought as modelled with WRF
 18 th World IMACS / MODSIM Congress, Cairns, Australia 13-17 July 2009 http://mssanz.org.au/modsim09 Water Balance in the Murray-Darling Basin and the recent drought as modelled with WRF Evans, J.P. Climate
State of the Ocean 2003: Physical Oceanographic Conditions in the Gulf of St. Lawrence
 Ecosystem Status Report 24/2 Oceanographic sampling gear State of the Ocean 23: Physical Oceanographic Conditions in the Gulf of St. Lawrence Background The physical oceanographic environment influences
Response of water temperature to surface wave effects: experiments with the coupled NEMO-WAM
 Response of water temperature to surface wave effects: experiments with the coupled NEMO-WAM Victor Alari (HZG), Joanna Staneva (HZG), Sebastian Grayek (HZG) and Oyvind Breivik (ECMWF/Norwegian Met. Institute)
Terrestrial Snow Cover: Properties, Trends, and Feedbacks. Chris Derksen Climate Research Division, ECCC
 Terrestrial Snow Cover: Properties, Trends, and Feedbacks Chris Derksen Climate Research Division, ECCC Outline Three Snow Lectures: 1. Why you should care about snow: Snow and the cryosphere Classes of
Modeling oxygen depletion within stratified bottom boundary layers of lakes
 Modeling oxygen depletion within stratified bottom boundary layers of lakes Aidin Jabbari 1, Leon Boegman 1, Murray MacKay 2, Nader Nakhaei 1 1. Environmental Fluid Dynamics Laboratory, Department of Civil
Assimilation of satellite derived soil moisture for weather forecasting
 Assimilation of satellite derived soil moisture for weather forecasting www.cawcr.gov.au Imtiaz Dharssi and Peter Steinle February 2011 SMOS/SMAP workshop, Monash University Summary In preparation of the
Ocean and sea ice modeling for Arctic shipping
 Ocean and sea ice modeling for Arctic shipping Mads H. Ribergaard, Till A. S. Rasmussen, Kristine S. Madsen, Ida M. Ringgaard Danish Meteorological Institute Lyngbyvej 100, Copenhagen, Denmark Ocean modelling
Andrey Martynov 1, René Laprise 1, Laxmi Sushama 1, Katja Winger 1, Bernard Dugas 2. Université du Québec à Montréal 2
 CMOS-2012, Montreal, 31 May 2012 Reanalysis-driven climate simulation over CORDEX North America domain using the Canadian Regional Climate Model, version 5: model performance evaluation Andrey Martynov
Energy transport and transfer in the wake of a tropical cyclone
 Energy transport and transfer in the wake of a tropical cyclone Claudia Pasquero Department of Earth and Environmental Sciences Università degli Studi di Milano - Bicocca Agostino Meroni, Francesco Ragone
Assimilation of Snow and Ice Data (Incomplete list)
") Assimilation of Snow and Ice Data (Incomplete list) Snow/ice Sea ice motion (sat): experimental, climate model Sea ice extent (sat): operational, U.S. Navy PIPs model; Canada; others? Sea ice concentration
Assimilation of Snow and Ice Data (Incomplete list) Snow/ice Sea ice motion (sat): experimental, climate model Sea ice extent (sat): operational, U.S. Navy PIPs model; Canada; others? Sea ice concentration
SIO 210 Problem Set 2 October 17, 2011 Due Oct. 24, 2011
 SIO 210 Problem Set 2 October 17, 2011 Due Oct. 24, 2011 1. The Pacific Ocean is approximately 10,000 km wide. Its upper layer (wind-driven gyre*) is approximately 1,000 m deep. Consider a west-to-east
Earth Science 11 Learning Guide Unit Complete the following paragraph about the ocean and ocean water with the following words:
 Earth Science 11 Learning Guide Unit 8 Name: 8-1 Ocean Properties 1. Complete the following paragraph about the ocean and ocean water with the following words: thousand chloride 70% salinity water sodium
What makes the Arctic hot?
 1/3 total USA UN Environ Prog What makes the Arctic hot? Local communities subsistence Arctic Shipping Routes? Decreasing Ice cover Sept 2007 -ice extent (Pink=1979-2000 mean min) Source: NSIDC Oil/Gas
An Introduction to Coupled Models of the Atmosphere Ocean System
 An Introduction to Coupled Models of the Atmosphere Ocean System Jonathon S. Wright jswright@tsinghua.edu.cn Atmosphere Ocean Coupling 1. Important to climate on a wide range of time scales Diurnal to
R. Hallberg, A. Adcroft, J. P. Dunne, J. P. Krasting and R. J. Stouffer NOAA/GFDL & Princeton University
 Sensitivity of 21st Century Steric Sea Level Rise to Ocean Model Formulation R. Hallberg, A. Adcroft, J. P. Dunne, J. P. Krasting and R. J. Stouffer NOAA/GFDL & Princeton University Hallberg, R., A. Adcroft,
Analysis of Mixing and Dynamics Associated with the Dissolution of Hurricane-Induced Cold Wakes
 DISTRIBUTION STATEMENT A: Approved for public release; distribution is unlimited. Analysis of Mixing and Dynamics Associated with the Dissolution of Hurricane-Induced Cold Wakes Carol Anne Clayson Dept.
Operational and research activities at ECMWF now and in the future
 Operational and research activities at ECMWF now and in the future Sarah Keeley Education Officer Erland Källén Director of Research ECMWF An independent intergovernmental organisation established in 1975
The Scale-dependence of Groundwater Effects on Precipitation and Temperature in the Central United States
 The Scale-dependence of Groundwater Effects on Precipitation and Temperature in the Central United States Michael Barlage, Fei Chen, Changhai Liu NCAR/RAL Gonzalo Miguez-Macho U. Santiago de Compostela
Radiative Climatology of the North Slope of Alaska and the Adjacent Arctic Ocean
 Radiative Climatology of the North Slope of Alaska and the Adjacent Arctic Ocean C. Marty, R. Storvold, and X. Xiong Geophysical Institute University of Alaska Fairbanks, Alaska K. H. Stamnes Stevens Institute
M. Liste 1, M. Grifoll 2, I. Keupers 1, J. Fernández 3, H. Ortega 1, J. Monbaliu 1
 M. Liste 1, M. Grifoll 2, I. Keupers 1, J. Fernández 3, H. Ortega 1, J. Monbaliu 1 1 Hydraulics Laboratory (K.U.Leuven, Belgium) 2 Laboratori d Enginyeria Marítima (LIM/UPC, Spain) 3 SIMO, Spain. Motivation
Future Great Lakes climatology and water levels simulated using Regional Climate Models
 Future Great Lakes climatology and water levels simulated using Regional Climate Models Frank Seglenieks Environment Canada The St. Clair River Symposium Port Huron, MI 2014-09-18 Summary Great Lakes hydroclimatology
The World Ocean. Pacific Ocean 181 x 10 6 km 2. Indian Ocean 74 x 10 6 km 2. Atlantic Ocean 106 x 10 6 km 2
 The World Ocean The ocean and adjacent seas cover 70.8% of the surface of Earth, an area of 361,254,000 km 2 Pacific Ocean 181 x 10 6 km 2 Indian Ocean 74 x 10 6 km 2 Atlantic Ocean 106 x 10 6 km 2 Oceanic
The ECMWF coupled data assimilation system
 The ECMWF coupled data assimilation system Patrick Laloyaux Acknowledgments: Magdalena Balmaseda, Kristian Mogensen, Peter Janssen, Dick Dee August 21, 214 Patrick Laloyaux (ECMWF) CERA August 21, 214
Response of Lake Superior to mesoscale wind forcing: A comparison between currents driven by QuikSCAT and buoy winds
 JOURNAL OF GEOPHYSICAL RESEARCH, VOL. 109,, doi:10.1029/2002jc001692, 2004 Response of Lake Superior to mesoscale wind forcing: A comparison between currents driven by QuikSCAT and buoy winds Changsheng
The Ocean-Atmosphere System II: Oceanic Heat Budget
 The Ocean-Atmosphere System II: Oceanic Heat Budget C. Chen General Physical Oceanography MAR 555 School for Marine Sciences and Technology Umass-Dartmouth MAR 555 Lecture 2: The Oceanic Heat Budget Q
METRIC tm. Mapping Evapotranspiration at high Resolution with Internalized Calibration. Shifa Dinesh
 METRIC tm Mapping Evapotranspiration at high Resolution with Internalized Calibration Shifa Dinesh Outline Introduction Background of METRIC tm Surface Energy Balance Image Processing Estimation of Energy
Hindcast Arabian Gulf
 Hindcast Arabian Gulf Image of isobars of atmospheric pressure and hindcast wind- and wave field over the Arabian Gulf during a storm in January 1993. Detailed wave studies are supported by nesting of
Interactive lakes in the Canadian Regional Climate Model (CRCM): present state and perspectives
: present state and perspectives") 44th Annual CMOS Congress May 31 June 4, 21, Ottawa Interactive lakes in the Canadian Regional Climate Model (CRCM): present state and perspectives A. Martynov, L. Sushama, R. Laprise Centre ESCER Université
44th Annual CMOS Congress May 31 June 4, 21, Ottawa Interactive lakes in the Canadian Regional Climate Model (CRCM): present state and perspectives A. Martynov, L. Sushama, R. Laprise Centre ESCER Université
Lake parameters climatology for cold start runs (lake initialization) in the ECMWF forecast system
 in the ECMWF forecast system") 2nd Workshop on Parameterization of Lakes in Numerical Weather Prediction and Climate Modelling Lake parameters climatology for cold start runs (lake initialization) in the ECMWF forecast system R. Salgado(1),
2nd Workshop on Parameterization of Lakes in Numerical Weather Prediction and Climate Modelling Lake parameters climatology for cold start runs (lake initialization) in the ECMWF forecast system R. Salgado(1),
A 3D unstructured numerical model of Ems-Dollart estuary Observations and 3-D modeling. Pein JU, Stanev EV, Zhang YJ.
 A 3D unstructured numerical model of Ems-Dollart estuary Observations and 3-D modeling Pein JU, Stanev EV, Zhang YJ. in the framework of Future-Ems project. Model area & general research issues - Ems river
3.6 EFFECTS OF WINDS, TIDES, AND STORM SURGES ON OCEAN SURFACE WAVES IN THE JAPAN/EAST SEA
 3.6 EFFECTS OF WINDS, TIDES, AND STORM SURGES ON OCEAN SURFACE WAVES IN THE JAPAN/EAST SEA Wei Zhao 1, Shuyi S. Chen 1 *, Cheryl Ann Blain 2, Jiwei Tian 3 1 MPO/RSMAS, University of Miami, Miami, FL 33149-1098,
Spectral Albedos. a: dry snow. b: wet new snow. c: melting old snow. a: cold MY ice. b: melting MY ice. d: frozen pond. c: melting FY white ice
 Spectral Albedos a: dry snow b: wet new snow a: cold MY ice c: melting old snow b: melting MY ice d: frozen pond c: melting FY white ice d: melting FY blue ice e: early MY pond e: ageing ponds Extinction
M. Mielke et al. C5816
 Atmos. Chem. Phys. Discuss., 14, C5816 C5827, 2014 www.atmos-chem-phys-discuss.net/14/c5816/2014/ Author(s) 2014. This work is distributed under the Creative Commons Attribute 3.0 License. Atmospheric
1. Introduction 2. Ocean circulation a) Temperature, salinity, density b) Thermohaline circulation c) Wind-driven surface currents d) Circulation and
 Temperature, salinity, density b) Thermohaline circulation c) Wind-driven surface currents d) Circulation and") 1. Introduction 2. Ocean circulation a) Temperature, salinity, density b) Thermohaline circulation c) Wind-driven surface currents d) Circulation and climate change e) Oceanic water residence times 3.
1. Introduction 2. Ocean circulation a) Temperature, salinity, density b) Thermohaline circulation c) Wind-driven surface currents d) Circulation and climate change e) Oceanic water residence times 3.
How DBCP Data Contributes to Ocean Forecasting at the UK Met Office
 How DBCP Data Contributes to Ocean Forecasting at the UK Met Office Ed Blockley DBCP XXVI Science & Technical Workshop, 27 th September 2010 Contents This presentation covers the following areas Introduction
Model-simulated interannual variability of Lake Erie ice cover, circulation, and thermal structure in response to atmospheric forcing,
 JOURNAL OF GEOPHYSICAL RESEARCH: OCEANS, VOL. 118, 4286 4304, doi:10.1002/jgrc.20312, 2013 Model-simulated interannual variability of Lake Erie ice cover, circulation, and thermal structure in response
Performance of a 23 years TOPAZ reanalysis
 Performance of a 23 years TOPAZ reanalysis L. Bertino, F. Counillon, J. Xie,, NERSC LOM meeting, Copenhagen, 2 nd -4 th June 2015 Outline Presentation of the TOPAZ4 system Choice of modeling and assimilation
O.M Smedstad 1, E.J. Metzger 2, R.A. Allard 2, R. Broome 1, D.S. Franklin 1 and A.J. Wallcraft 2. QinetiQ North America 2. Naval Research Laboratory
 An eddy-resolving ocean reanalysis using the 1/12 global HYbrid Coordinate Ocean Model (HYCOM) and the Navy Coupled Ocean Data Assimilation (NCODA) scheme O.M Smedstad 1, E.J. Metzger 2, R.A. Allard 2,
Development of Ocean and Coastal Prediction Systems
 Development of Ocean and Coastal Prediction Systems Tal Ezer Program in Atmospheric and Oceanic Sciences P.O.Box CN710, Sayre Hall Princeton University Princeton, NJ 08544-0710 phone: (609) 258-1318 fax:
Which Climate Model is Best?
 Which Climate Model is Best? Ben Santer Program for Climate Model Diagnosis and Intercomparison Lawrence Livermore National Laboratory, Livermore, CA 94550 Adapting for an Uncertain Climate: Preparing
GLERL Coupled Ice-Ocean Modeling and Forecasting
 GLERL Coupled Ice-Ocean Modeling and Forecasting Jia Wang Ice Climatologist NOAA Great Lake Environmental Research Laboratory, Ann Arbor, Michigan Jia.wang@noaa.gov Haoguo Hu, Ayumi Manome, and Xuezhi
The Field Research Facility, Duck, NC Warming Ocean Observations and Forecast of Effects
 The Field Research Facility, Duck, NC Warming Ocean Observations and Forecast of Effects A potential consequence of a warming ocean is more frequent and more intense wind events (Hurricanes & Typhoons)
An Update on the 1/12 Global HYCOM Effort
 An Update on the 1/12 Global HYCOM Effort E. Joseph Metzger, Alan J. Wallcraft, Jay F. Shriver and Harley E. Hurlburt Naval Research Laboratory 10 th HYCOM Consortium Meeting 7-99 November 2006 FSU-COAPS,
THE BC SHELF ROMS MODEL
 THE BC SHELF ROMS MODEL Diane Masson & Isaac Fine, Institute of Ocean Sciences The Canadian west coast perspective (filling the gap ) AVISO, Eddy Kinetic Energy (cm 2 s -2 ) In this talk Model set-up and
NIDIS Intermountain West Drought Early Warning System September 4, 2018
 NIDIS Drought and Water Assessment NIDIS Intermountain West Drought Early Warning System September 4, 2018 Precipitation The images above use daily precipitation statistics from NWS COOP, CoCoRaHS, and
Arctic sea ice falls below 4 million square kilometers
 SOURCE : http://nsidc.org/arcticseaicenews/ Arctic sea ice falls below 4 million square kilometers September 5, 2012 The National Snow and Ice Data Center : Advancing knowledge of Earth's frozen regions
Regional offline land surface simulations over eastern Canada using CLASS. Diana Verseghy Climate Research Division Environment Canada
 Regional offline land surface simulations over eastern Canada using CLASS Diana Verseghy Climate Research Division Environment Canada The Canadian Land Surface Scheme (CLASS) Originally developed for the