Citizen Science Condition Monitoring
|
|
|
- Derick Watkins
- 5 years ago
- Views:
Transcription


1 Citizen Science Condition Monitoring Final Report May 2018 Prepared by Carolinas Integrated Sciences & Assessments (CISA) Amanda Farris, Eleanor Davis, Kerry Guiseppe, Kirsten Lackstrom, Rebecca Ward Phase 2: January 2016 through December 2017

2 Acknowledgements We would like to extend our thanks to the many people and supporting agencies who contributed to the success of CISA s Citizen Science Condition Monitoring project. The diverse expertise of these individuals and their support for the project has resulted in a successful research effort which we hope will contribute to improved drought planning and preparedness in the United States. The success of the project is largely due to the talents of a very dedicated group of CISA research assistants who helped with all components of this research endeavor since its inception in We personally thank Janae Davis, David Eckhardt, Ben Haywood, Aashka Patel, Katie Sayre, Sumi Selvaraj, Meghan Sullivan, and Henrik Westerkam. Leaders from the Community Collaborative Rain, Hail & Snow (CoCoRaHS) Network Nolan Doesken, Noah Newman, Henry Reges, and Julian Turner were pivotal in helping to launch the pilot and transitioning to the national program. Noah Besser s talent as an animator shines through in the CoCoRaHS condition monitoring training animation. Additional funding support from NIDIS to these project partners helped to ensure the successful completion of their work. Other representatives of the drought decision making community contributed key feedback through each phase of the project and have shown enthusiasm for the potential condition monitoring has in improving our understanding of drought and its impacts. We would like to especially thank Rebecca Ward and Heather Dinon Aldridge of the North Carolina State Climate Office, Hope Mizzell of the South Carolina State Climatology Office, and Kelly Smith of the National Drought Mitigation Center for their thoughtful advice and continuous engagement. And, of course, we must thank each of the volunteer citizen scientists who gave freely of their time and without whom this effort would not be possible. Funding Support CISA received support for this project from the following agencies: National Integrated Drought Information System (NIDIS) National Oceanic and Administration s (NOAA) Climate Program Office (Award Numbers NA11OAR and NA16OAR ) University Corporation for Atmospheric Research (UCAR Subaward Number Z ; Prime Award from NOAA, NA11OAR ) Photo: Amanda Farris Photo: Amanda Farris
3 Report Contents Acknowledgements... 2 Funding Support... 2 Executive Summary... 6 Key Components of the Carolinas Condition Monitoring Pilot Project... 6 Contributions to a Drought Early Warning System (DEWS)... 7 Recommendations... 8 Introduction... 9 Key Features of the Project Phase 1 Recap: September 2013 December Phase 2: January 2016 December Transitioning to a National Program Timeline New Tools for Condition Monitoring Condition Monitoring Scale Bar Condition Monitoring Report Form Condition Monitoring Web Map Condition Monitoring: From the Carolinas to a National Effort Condition Monitoring in the Carolinas: Volunteer Engagement and Participation Volunteer Recruitment: Utilizing an Existing Network of Observers Communications and Outreach to Support Volunteer Retention Volunteer Participation Volunteer Feedback Surveys Key Findings Condition Monitoring in the Carolinas: Report Content and Analysis Overview of Condition Monitoring Reports Scale Bar Analysis Condition Monitoring Report Content Condition Monitoring in the Carolinas: Decision Maker Feedback Methods... 48
4 Decision Makers Use Condition Monitoring Reports to Identify Changing Conditions Condition Monitoring Informs More than Just Drought-Related Decisions Decision Maker Perceive Observers to be Credible and Reliable Contributions to a Drought Early Warning System Condition Monitoring for Drought Early Warning Contributions to the US Drought Monitor Map Decision Making Processes Volunteer Engagement Recommendations for the Future of Condition Monitoring Provide Additional Support for Volunteer Engagement Engage Decision Makers Invest in Technological Improvements Develop Regional Guidance for Condition Monitoring Conduct More In-Depth Analysis of Report Content In Conclusion Appendix A: Volunteer Feedback Survey # Appendix B: Volunteer Feedback Survey # Appendix C: Volunteer Feedback Survey # Appendix D: Phase 2 Decision Maker Feedback Survey Appendix E: Decision Makers Who Provided Carolinas Pilot Project Feedback
5 Tables and Figures Table 1: Carolinas CoCoRaHS Condition Monitoring Project Participation Figure 1: CoCoRaHS Citizen Science Condition Monitoring Project Timeline Figure 2: Final iteration of the Condition Monitoring Scale Bar Figure 3: CoCoRaHS Drought Impact Report Form converted to Condition Monitoring Report Form Figure 4: The Carolinas Condition Monitoring Web Map, Version Figure 5: The Carolinas Condition Monitoring Web Map, Version Figure 6: The Carolinas Condition Monitoring Web Map, Version Figure 7: National Condition Monitoring Web Map Figure 8: The CoCoRaHS Condition Monitoring Training Animation Figure 9: Total Reports Submitted by Carolinas Observers during Phase Figure 10: Communications Calendar and Other Potential Factors Influencing Reporting Table 2: Phase 2 Volunteer Feedback Survey Distribution and Responses Figure 11: Carolinas CoCoRaHS Observer Participation in Condition Monitoring Figure 12: Reasons Carolinas CoCoRaHS Volunteers Did Not Submit Condition Monitoring Reports Figure 13: Observer Motivations for Conditioned Participation in Condition Monitoring Figure 14: Carolinas' Observers Perceptions of Condition Monitoring Figure 15: Map of Phase 2 Carolinas Condition Monitoring Observer Locations Figure 16: Scale Bar Selections Recoded to Numerical Scores for Analysis Table 3: Correlation Coefficients Between Drought Index Values and Observer Scale Bar Selections Figure 17: Boxplots of SPEI Correlations with Scale Bar Categories Figure 18: Carolinas Observers Condition Monitoring Report Categories Selections Figure 19: Word Cloud Generated From Study Period Report Content Figure 20: Map of Case Study Observer Locations Table 4: Correlations Between Case Study Observers Scale Bar Selections and Drought Indices Figure 21: Case Study Observers' Categorical Report Content Selections Figure 22: Types of Condition Monitoring Report Information Most Useful to Decision Makers Figure 23: Percentage of Decision Makers Who Find Condition Monitoring Reports Useful

6 Executive Summary Photo: Amanda Farris The Citizen Science Condition Monitoring project was created and piloted in the Carolinas by the Carolinas Integrated Sciences & Assessments (CISA) team. The program, which originally launched in September 2013, was designed to address drought impact monitoring needs identified for the Carolinas, inform broader efforts to develop more effective approaches to drought impacts monitoring, and facilitate the integration of impacts information into decision making. The idea for the project was borne out of stakeholder needs for more on-the-ground information about the societal and environmental impacts of drought. The project team utilized existing tools developed by the Community Collaborative Rain, Hail, and Snow (CoCoRaHS) network to pilot a new method of drought impacts reporting. Unlike drought impact reports, which are often submitted only once drought conditions become severe, condition monitoring seeks to document the evolution of impacts over time by asking volunteers to submit reports weekly to document changing conditions. This process provides more information about the onset, intensification, and recovery of drought impacts in contrast to more traditional, one off, drought impacts reporting. Phase 2 of the program (January 2016 December 2017), outlined in this report, integrated feedback from observers and decision makers solicited during Phase 1 (September 2013 December 2015) in order to enhance the reporting process and develop tools to improve access to information in the reports. New tools and resources developed during Phase 2 comprise a revised report form which incorporates a seven category condition monitoring scale bar, a web map to display observer reports, and updated communications and training materials. These resources were launched to the national network of CoCoRaHS observers, expanding the pilot from the Carolinas to a national program, although CISA s evaluation efforts focused only on the Carolinas. Key Components of the Carolinas Condition Monitoring Pilot Project The evaluation of the CoCoRaHS Citizen Science Condition Monitoring program addressed a nationallevel need for more systematic evaluation of the various tools and methods deployed to collect and communicate drought impacts information. The project evaluation entailed analysis of report content, obtaining feedback from citizen scientists, and surveys with drought decision makers and users of the reports. Report content analysis assessed the types of information included in reports as well as comparing observer scale bar selections with other, objective drought indices. This analysis revealed that observer scale bar selections generally reflect prevailing meteorological 6
7 conditions. Report content varies widely amongst observers providing a detailed picture of the multiple types of conditions occurring in different geographies and under ever-changing conditions. The CISA team requested feedback from the observers themselves, to understand what was needed to support a successful network of citizen scientists. CoCoRaHS observers are a dedicated group of volunteers who seek to provide relevant and useful information to the decision makers who rely on the reports to better understand how precipitation affects the local environment and community. Ensuring that volunteers are aware of how the information is used by decision makers is a key motivation for continued participation. Decision makers considered the citizen scientists to be credible and reliable sources of information. Their reports supply information about local conditions that existing monitoring networks and objective drought indicators do not necessarily provide. Feedback solicited from drought decision makers provided information about how the reports can be incorporated into regular drought monitoring as well as other types of decisions, such as frost/freeze warnings and burn bans. Contributions to a Drought Early Warning System (DEWS) As a key activity of the National Integrated Drought Information System (NIDIS) Coastal Carolinas DEWS program, one objective of the Citizen Science Condition Monitoring project was to provide usable and reliable drought information on an ongoing basis for drought monitoring and decision making. Project results indicate that a national network of citizen scientists, knowledgeable about their local communities and environment, can play an important role in an early warning system. Condition monitoring reports provide information about changing conditions, where drought is emerging, intensifying, or receding. Drought impact reports, in contrast, often focus on the adverse effects and consequences of the most severe or extreme drought. Condition monitoring reports contribute to the convergence of information used by U.S. Drought Monitor authors to determine drought designations. Citizen scientists place-based knowledge allows observers to provide contextual information about environmental and societal impacts of drought that objective indices do not. Regular communications and dissemination of educational materials, through networks such as CoCoRaHS, can help to increase public awareness of drought and its impacts. The decision making context and processes will shape how, and the extent to which, condition monitoring reports are considered in drought monitoring and response processes. Having staff capacity and regular (weekly) monitoring processes, such as those undertaken by the U.S. Drought Monitor and North Carolina Drought Management Advisory Council, facilitated the reports use and utility. 7
8 Recommendations Based on findings and lessons learned from the project, the CISA team makes the following recommendations to support the continued success of a national condition monitoring program. Supporting key components of the program such as volunteer retention, consistency in reporting, and continued refinement of reporting guidance will ensure that the information provided by volunteers is relevant and useful for drought early warning. Continue to support outreach with volunteers and decision makers. Engagement with both citizen science volunteers and decision makers was critical for supporting their participation and should be continued to facilitate ongoing success of the national program. Invest in technological improvements. Condition monitoring participation would likely increase if a mobile phone app were available. Project participants also noted that web map enhancements and having a systematic process to collect and review photos would be useful for drought monitoring. Develop regional guidance. Drought in the Carolinas looks different than drought in other parts of the country. Condition monitoring guidance should reflect regional climates and geographies. Explore new ways to assess report content. Condition monitoring reports contain a wealth of information about local conditions and the effects of weather events. Additional analyses could examine how to more effectively access and use information for drought monitoring as well as signs of fire weather, frost/freeze occurrences, and other extreme events. Support and encourage partnerships. Partners from CoCoRaHS, the National Drought Mitigation Center, and the State Climate Office of North Carolina were instrumental in developing and evaluating the new tools and resources introduced through this project. These partnerships were pivotal in encouraging decision makers to consider the information in drought monitoring efforts. 8
, the collection of drought impact information is typically not well-integrated into existing")
9 Introduction Photo: Christopher Lumpp Identifying and assessing drought impacts are important for understanding and addressing drought vulnerabilities. While such information is a critical component of a comprehensive Drought Early Warning System (DEWS), the collection of drought impact information is typically not well-integrated into existing drought monitoring and management activities). 1, 2 The Carolinas Integrated Sciences & Assessments (CISA) designed the Citizen Science Condition Monitoring project in response to needs and priorities identified by stakeholders at the NIDIS Carolinas Drought Early Warning System: Supporting Coastal Ecosystem Management Scoping Workshop (2012). Workshop participants suggested many potential benefits of improving drought impacts reporting, to include building public awareness of drought conditions and impacts, advancing understanding of the linkages between drought and on-the-ground conditions, and capturing more information about drought onset, intensification, and recovery. A key priority was to assess ways in which drought impacts might be monitored through a citizen science effort. Initiated in 2013 as part of the National Integrated Drought Information System (NIDIS) Coastal Carolinas Drought Early Warning System (DEWS), the Citizen Science Condition Monitoring project built on existing tools developed by the Community Collaborative Rain, Hail and Snow (CoCoRaHS) network. CISA recruited citizen scientists in the Carolinas to participate in condition monitoring, asking volunteers to submit weekly status reports about the condition of ecosystems and communities in their area. The focus on regular reporting, in contrast to intermittent drought impact reports, is intended to create a baseline for comparison of change through time and to improve understanding of different stages of drought. The project was conducted in two phases. Phase 1 took place from September 2013-December 2015 and demonstrated that the information provided by citizen scientists was relevant and had potential value for drought monitoring. A separate report documents Phase 1 activities and findings. Phase 2 took place from January 2016-December 2017, building on recommendations and findings from Phase 1. Phase 2 activities focused on developing and testing new tools to streamline the processes of submitting and accessing condition monitoring reports. While originally conceived as a pilot project 1 Hayes, M. M. Svoboda, N. Wall, and M. Widhalm The Lincoln Declaration on Drought Indices: Universal Meteorological Drought Index Recommended. Bulletin of the American Meteorological Society 92: Lackstrom, K., A. Brennan, D. Ferguson, M. Crimmins, L. Darby, K. Dow, K. Ingram, A. Meadow, H. Reges, M. Shafer, and K. Smith The Missing Piece: Drought Impacts Monitoring. Workshop report produced by the Carolinas Integrated Sciences & Assessments program and the Climate Assessment for the Southwest. 9
10 for the Carolinas, the project expanded to a national effort due to positive feedback from project partners, citizen scientists, and drought decision makers. This report specifically focuses on Phase 2 (January 2016-December 2017) of the Carolinas pilot project. Individual sections describe the different components of the Carolinas pilot project: volunteer engagement, analysis of condition monitoring reports, and feedback from users of the condition monitoring tools and information. Each component included activities to assess how a citizen science effort can most effectively contribute to the monitoring and understanding of drought impacts. The report also discusses the expansion of the project to a national effort, condition monitoring contributions to drought early warning, and recommendations to further enhance and support the condition monitoring approach on the national level. Key Features of the Project 1. The project leveraged well-established networks and tools, namely the Community Collaborative Rain, Hail and Snow (CoCoRaHS) Network and the National Drought Mitigation Center (NDMC) Drought Impact Reporter. The CoCoRaHS Network, established in 1998, is a network of approximately 20,000 volunteer observers who record daily precipitation data throughout the U.S., Puerto Rico, the U.S. Virgin Islands, and Canada. CoCoRaHS is a trusted, high-quality source of precipitation data and is used for a wide range of climate monitoring and research applications. It often supplements data acquired through other monitoring networks, such as the National Weather Service Cooperative Observer Program, or fills in data gaps for areas not covered by those networks (Reges et al., 2016). 3 In addition to daily precipitation observations, CoCoRaHS volunteers have the option to provide supplemental reports regarding hail, severe weather, snow, and drought conditions. Drought impact reports, and subsequently condition monitoring reports, are ingested in the NDMC Drought Impact Reporter, and are accessible through both the CoCoRaHS and Drought Impact Reporter websites. 2. The project used a condition monitoring approach to drought impact reporting. Typically drought impacts data is collected on an intermittent basis, or provided as one-off reports, only when dry conditions have reached a more severe level. In contrast, condition monitoring asks volunteers to submit regular status reports about the condition of their local ecosystem and community. Consistent reporting is intended to create a baseline for comparison of change over time and to improve understanding of drought onset, intensification, and recovery. 3 Reges, H., N. Doesken, J. Turner, N. Newman, A. Bergantino, and Z. Schwalbe, 2016: CoCoRaHS: The evolution and accomplishments of a volunteer rain gauge network. Bulletin of the American Meteorological Society 97: , 10
11 3. The project addressed a national-level need for more systematic efforts that evaluate the various tools and methods being deployed to collect and communicate drought impacts information. A major project goal was to assess the effectiveness and suitability of the CoCoRaHS citizen science network as a tool to expand drought impacts reporting and monitoring. CISA developed and implemented evaluation methods and activities around three major themes as part of the overall pilot project design in the Carolinas. The Phase 1 and Phase 2 final reports focus on the findings from these efforts. a) What practices and approaches are best for engaging citizen scientists around drought issues and building their capacity to participate in drought monitoring? CISA regularly communicated with volunteers throughout the project to provide educational and training materials and to encourage and sustain participation. Communications also indicated to volunteers how their information was utilized by decision makers, a key motivation for many participants. For both Phase 1 and 2, CISA disseminated a series of three online feedback surveys (six total) to Carolinas volunteers to assess the effectiveness of those outreach efforts. Survey results informed ongoing efforts to engage citizen scientists in condition monitoring. b) What types of information can volunteers provide in their condition monitoring reports? The CISA team analyzed condition monitoring report content to assess how information provided by citizen scientists could improve understanding of local drought impacts and sensitivities and how the condition monitoring approach could be used to identify signs of drought onset, severity, and recovery. c) How can the information provided add value to drought monitoring and decision making? Interviews with drought decision makers provided feedback regarding how the citizen scientists reports could be used in drought monitoring and decision making and enhance drought early warning and response activities. 4. The project relied on partnerships and ongoing outreach for a sustainable, drought impacts information system. CISA regularly consulted and worked with national-, state-, and local-level partners such as the CoCoRaHS Network, the National Drought Mitigation Center (NDMC), the North Carolina and South Carolina State Climate Offices, and citizen science volunteers to implement and evaluate the project. Regular communications ensured that the Carolinas condition monitoring project was complementary and not duplicative of other efforts and that lessons learned in other places were incorporated into the Carolinas pilot. Ongoing involvement by CoCoRaHS and NDMC representatives enabled the pilot project to transition to a national effort. Forty-one drought decision makers provided invaluable feedback over the course of the entire project (Phase 1 and Phase 2). They represented the U.S. Drought Monitor, National Weather Service Offices, drought response committees, and other organizations with responsibilities for monitoring and responding to drought. Their willingness to experiment with and integrate citizen scientists reports into 11
12 drought decision making processes demonstrated how localized, on-the-ground information can be used in drought monitoring. Volunteer engagement was an integral part of the project design due to its reliance on citizen science volunteers to provide information about their observations of local environmental conditions and drought impacts. Overall, 330 citizen science volunteers in North Carolina and South Carolina submitted condition monitoring reports as part of the Carolinas pilot. Over 1,900 CoCoRaHS observers in North Carolina and South Carolina received regular project newsletters, as well as other drought-related information and educational materials, as part of this project. Although CISA never actively recruited observers in Georgia, 95 CoCoRaHS observers from Georgia participated in condition monitoring over the course of the study period. During Phase 1 when communications were directly solely to observers in the Carolinas, the 11 Georgia observers who submitted reports likely learned about the opportunity from their regional CoCoRaHS coordinators who helped CISA share information with their volunteers about condition monitoring and recruit participants for Phase 1. These coordinators are based in the National Weather Service forecast offices with county warning areas that extend into Georgia. After the launch of condition monitoring resources to the national network of CoCoRaHS observers, more Georgia observers who learned about the program through national CoCoRaHS communications submitted reports. Carolinas CoCoRaHS Observers Carolinas CoCoRaHS Condition Monitoring Pilot Project Participation Phase 1 (Sept 2013 Dec 2015) Phase 2 (Jan 2016 Dec 2017) Total 371 (54 observers participated in both Phase 1 and Phase 2) Reports Submitted 1,572 3,165 4,737 Observer Feedback Surveys Decision Maker Feedback Providers Table 1: Carolinas CoCoRaHS Condition Monitoring Project Participation 41 (11 decision makers provided feedback in both Phase 1 and Phase 2) Phase 1 Recap: September 2013 December 2015 CISA recruited citizen science groups such as Master Naturalists, Master Gardeners, and CoCoRaHS observers to participate in condition monitoring. CISA asked volunteers to submit weekly status reports about the condition of ecosystems and communities in their area using tools developed by the CoCoRaHS network. To accommodate the project, CoCoRaHS worked with CISA to modify the existing Drought Impact Report Form on their website. Using this existing resource provided a fairly easy and efficient way for project volunteers to submit their reports. In addition, this arrangement provided an online repository for the reports. CISA team members, and other potential users, could then view and access the reports through either the CoCoRaHS or NDMC National Drought Impact Reporter websites. 12
13 From September 2013 to December 2015, 68 project volunteers provided 1,572 condition monitoring reports. The CISA team coded and analyzed these reports using NVivo, a qualitative analysis software package. CISA used this information to develop maps, graphs, and charts to summarize and visualize the report content for interviews with decision makers responsible for drought monitoring and decision making. CISA conducted interviews with representatives from the U.S. Drought Monitor, State Climate Offices, National Weather Service forecast offices, and state drought response committees to obtain feedback on how their organizations could use the information provided by citizen scientists. Interviewees indicated that the reports were relevant for drought monitoring. However, they also noted that the open-ended nature of the reports made them difficult and time-consuming to access and use. Positive feedback about condition monitoring as an improvement to previously established methods of drought impacts reporting motivated the project s continuation. Phase 2: January 2016 December 2017 Based on the positive feedback from citizen science observers, project partners, and decision makers, CISA began Phase 2 planning in fall Informed by the needs and suggestions identified in Phase 1, new activities focused on streamlining the reporting process and improving the communication and visualization of the reports. Phase 2 included four major project and corresponding evaluation activities: 1. Develop new tools to streamline the processes of submitting and accessing condition monitoring reports (October 2015 September 2017) CoCoRaHS transitioned the original Drought Impact Report Form to a Condition Monitoring Report Form by removing unused parts of the form and adding a condition monitoring scale bar. CISA developed a web map to spatially display the condition monitoring reports. 2. Continue communications and outreach with condition monitoring volunteers (January 2016 December 2017) This included monthly newsletters, quarterly conference calls, and a series of three online feedback surveys circulated to project volunteers over the course of Phase Analyze condition monitoring reports (November 2017 March 2018) The State Climate Office of North Carolina studied observer scale bar selections to look for correlations with other, objective, drought indices, namely the Standardized Precipitation Index and the Standardized Precipitation Evapotranspiration Index. Observer case studies further explore how variations in scale bar selections differed across geographies and observer reports. Content analysis was based on observers self-selected report categories. 4. Engage with condition monitoring information users (January 2017 December 2017) Over the course of Phase 2, CISA provided information about the availability of condition monitoring reports to various drought decision makers, requesting that they review the information provided in the reports to determine if it was helpful to inform drought designations or other related decisions. Feedback interviews at the end of Phase 2 assessed if and how the information was used. 13
14 Transitioning to a National Program The CISA team worked with CoCoRaHS headquarters throughout Phase 2 to implement condition monitoring for all CoCoRaHS observers nationally, building on the successful pilot project in the Carolinas. As revisions were made to the reporting process and new tools were developed to access the reports, CISA collaborated with CoCoRaHS partners at Colorado State University and the National Drought Mitigation Center (NDMC) to ensure that materials developed for Phase 2 of the Carolinas pilot were also appropriate to transfer to the national network of CoCoRaHS observers. This included the revised report form and condition monitoring scale bar, scale bar summary data charts, the web map, and recruitment and training materials, including an animation. CoCoRaHS launched the new report form and scale bar to its national network in October 2016 and launched the national web map, scale bar summary data charts, and training animation in September This report describes the development of these new materials. However, the evaluation efforts described were solely conducted with respect to the Carolinas pilot program. How dry I am. There continues to be a need for rain. For the month of November, we had rain on 9 days for This compares to 4 days and.72 in Lake level continues to drop, now at With warm temperatures, bird activity is low but the yard and garden continue to go dormant. There is very little lake activity. Scale Bar Selection: Moderately Dry ~ Caswell County, NC, December 3, 2017 Conditions in the Graniteville/Aiken, South Carolina area have not changed this past week. Received 0.17 inches of light rain on 04APR18. Air Quality sensor readings remain in the MODERATE range due to pine pollen. Soil temperatures have rebounded to the lower 60 s. Evapotranspiration evaporative rates have ranged between 0.13 to 0.20 this past week. I had to bring in the ET gauge on the morning of 05APR18 due to freeze warnings issued. (Low Temp 30F). Irrigation of my lawns continues. Today s forecast (07APR18) for rain and thunderstorms are promising. I will report tomorrow (08APR18) if changing conditions are observed. Scale Bar Selection: Moderately Dry ~ Aiken County, SC, April 7,
15 Timeline The timeline below provides a summary of activities conducted over the course of the entire condition monitoring project, from initial scoping to final analysis. There was some overlap between Phase 1 and Phase 2 activities as new tools and resources were developed beginning in 2015 to implement Phase 2 activities. Scoping Primary Activities Coastal Carolinas DEWS Stakeholder Workshop Drought Impacts Monitoring Workshop; The Missing Piece Report Phase 1 Design and Work Plan Condition Monitoring checkbox added to the CoCoRaHS Drought Impact Report Form Tool and Resource Development Phase 2 Design and Work Plan Scale Bar Development & Report Revisions Condition Monitoring Web Map Training Animation Summary Charts Education and Training Materials Volunteer Engagement Volunteer Recruitment and Trainings Communications: Newsletter, Blog, Conference Calls Volunteer Feedback Surveys Condition Monitoring Report Analysis Decision Maker Feedback Nvivo Report Coding and Analysis (Phase 1) Charts, Graphs, and Maps to Visualize Report Content (Phase 1) Scale Bar Analysis (Phase 2) Report Content & Case Study Analysis (Phase 2) Communications and Outreach Feedback Interviews & Online Survey Figure 1: CoCoRaHS Citizen Science Condition Monitoring Project Timeline 15
 the condition monitoring web map. These tools are intended to streamline the processes of submitting and accessing condition monitoring reports.")
16 New Tools for Condition Monitoring Photo: Amanda Farris The primary objective of Phase 2 was to develop, implement, and evaluate two enhancements to the project: 1) a condition monitoring scale bar and 2) the condition monitoring web map. These tools are intended to streamline the processes of submitting and accessing condition monitoring reports. CISA developed these tools based on feedback from Phase 1 of the project and in consultation with CoCoRaHS, the NDMC, drought decision makers, and CoCoRaHS observers. Condition Monitoring Scale Bar Submitting raw text reports produces rich data, but there are inherent drawbacks. The open-ended report format produces inconsistency in what is reported in terms of content, as well as spatial and temporal characteristics of the data. More importantly, it is very difficult and time consuming to process report text into a summarized form for end users. Open-ended reports are valuable, but Phase 1 interviewees noted a need for close-ended questions in addition to the text reports to provide more structure and comparability between different reports. The idea for a condition monitoring scale bar was proposed to meet this need. Beginning in summer 2015, CISA graduate student David Eckhardt conducted research and outreach with decision makers and CoCoRaHS observers to develop the scale bar and prototype web map as a master s project in the University of South Carolina, Department of Geography. Summary information is provided in the February 2017 project progress report; more detailed information is available in Eckhardt s final master s project paper. 4 In order to provide a standardized drought metric and enhance condition monitoring reporting, Eckhardt developed the Condition Monitoring Scale Bar using a seven category Likert scale format (Figure 2). This scale bar design limits cognitive load and the Likert scale protocol is well established. Striking a balance between decision maker utility and observer usability is important. The final iteration of the scale bar achieves this balance. The construction of the scale bar categories, and accompanying guidance, was based upon USDM categories. 4 Eckhardt, D Improving Citizen Science Condition Monitoring Reporting: Condition Monitoring Scale Bar. Master s Project Paper, Department of Geography University of South Carolina, Columbia, SC. 16

17 Figure 2: Final iteration of the Condition Monitoring Scale Bar Scale Bar Guidance During the conceptual development stage for the scale bar it became clear that citizen scientists would need guidance on making scale bar selections. Clear definitions as to what constitutes each category of dry and wet conditions are necessary in order to obtain consistent responses from observers. This sentiment was independently echoed by some drought decision makers in feedback interviews as well. Citizen science research also states that projects should develop protocols for citizen participation. Protocols can guide citizen scientists in their data collection efforts and help to ensure data quality and potential use of the data. 5 CISA, with CoCoRaHS and NDMC input, created guidance for each dry, wet, and neutral category for the scale bar, producing seven descriptions of likely conditions. The guidance is a composite of the Possible Impacts categories used in the U.S. Drought Monitor Drought Severity Classification table and information derived from qualitative coding of Condition Monitoring reports during Phase 1 of the condition monitoring pilot project. Guidance for Mildly Dry is written to match D0 (Abnormally Dry), the least severe USDM category. Moderately Dry is tied to the possible impacts list for D1 (Moderate Drought), and Severely Dry is associated primarily with D2 (Severe Drought) but extends description to include the possibility of impacts listed under D3 (Extreme Drought) and D4 (Exceptional Drought). Condition Monitoring Report Form CISA, CoCoRaHS, and NDMC also collaborated to make modifications to the online report form, converting it from a Drought Impact Report Form to a Condition Monitoring Report Form (Figure 3). This change reflects a growing need and recognition for a more systematic approach to the monitoring of local conditions and the effects of drought at different stages. 6, 7 Specific modifications included changes to the Report Date and Report Categories sections of the form and removal of the request for monetary impact amounts. Instead of requesting that observers include both a start and end date, the form was updated to only include a report submission date. This was intended to reduce confusion about when a report period might start or end for an observer. The 5 Bonney, R., J. L. Shirk, T. B. Phillips, A. Wiggins, H. L. Ballard, A. J. Miller-Rushing, and J. K. Parrish Next Steps for Citizen Science. Science 343: Ferguson, D. B., A. Masayesva, A. M. Meadow, and M. A. Crimmins Gauges to Range Conditions: Collaborative Development of a Drought Information System to Support Local Decision-Making. Weather, Climate and Society 8: Meadow, A. M., M. A. Crimmins, and D. B. Ferguson Field of Dreams, or Dream Team?: Assessing Two Models For Drought Impact Reporting in the Semiarid Southwest. Bulletin of the American Meteorological Society. doi: /BAMS-D
. Finally, the request for monetary impacts was removed from the form.")
 in comparison to the modified Condition Monitoring Report form (bottom).")
18 General Awareness report category was added to allow observers to make a selection about the content of their report if they were not submitting information about specific impacts related to the other report categories (e.g., agriculture, tourism and recreation, water supply and quality, etc.). Finally, the request for monetary impacts was removed from the form. This information was rarely entered on the Drought Impact Report form, primarily because observers were unclear about what to submit. Figure 3 below shows the original Drought Impact Report form (top) in comparison to the modified Condition Monitoring Report form (bottom). CoCoRaHS officially replaced the Drought Impact Report Form with the Condition Monitoring Report Form on Monday, October 10, As of April 13, 2018, 22,948 condition monitoring reports have been submitted by 3,297 CoCoRaHS volunteers across all 50 states, Puerto Rico, and the Bahamas. Figure 3: CoCoRaHS Drought Impact Report Form (left) converted to Condition Monitoring Report Form (right) 18

19 Condition Monitoring Web Map Interviews with decision makers who regularly monitor drought conditions, such as US Drought Monitor authors, provided the impetus for the web map. Interviewees indicated that a streamlined and efficient way to access the condition monitoring reports would potentially enhance their use of reports for monitoring and decision making. Carolinas Web Map Version 1.0 CISA began development of the Condition Monitoring Web Map in September Version 1.0 (Figure 4) was completed and made publicly available from the CISA website in April The web map allowed users to view the location of each observer s report and click the location to access the full qualitative report. Additional base layers that could be toggled on and off are intended to help contextualize observer reports. These layers included climate divisions, ecological regions, watersheds, and the US Drought Monitor map. After this initial release of the web map, the State Climate Office of North Carolina (SCONC) began using the map to access condition monitoring reports and share information about drought impacts on weekly calls with the NC Drought Management Advisory Council (DMAC). These reports helped council members delineate drought designations on the NC drought monitor map. Figure 4: The Carolinas Condition Monitoring Web Map, Version 1.0 Carolinas Web Map Version 2.0 Refinements to the web map were made from June 2016 to January 2017; version 2.0 (Figure 6) was launched in January Web map 2.0 allowed users enhanced access to condition monitoring reports and provided spatial context for the information provided by citizen scientists. Improvements to the web map were made in the following areas: mobile first design, quicker site performance, increased report legibility, searchable report content, improved symbology, additional basemaps, and data downloading. 19

20 A collapsible sidebar was added to allow users to scroll through observer reports. Users can scroll through reports to find information of interest. The report location is highlighted on the map when a user hovers over a report in the sidebar. Reports can also be filtered in the sidebar by searching for specific keywords or category type in the search bar at the top of the column. Additionally, the pop up used in the map to display the report was improved to make the content more legible. In the original version of web map 2.0, report locations were shown as a cluster in the symbology on the map. Feedback from users indicated that, even if observer locations were very close and the individual symbology overlapped on the screen, users would prefer to see the individual report locations represented. Therefore, a symbology was developed to denote the observers scale bar selection to represent their location (Version 2.1, Figure 6). Dry scale bar categories are represented by increasingly darker shades of red and as an inverted triangle. Wet scale bar categories are represented as triangles of increasingly darker shades of blue. The triangle and inverted triangle were used to help distinguish between wet or dry conditions for color blind individuals. The near normal scale bar selection is represented by a gray circle. Figure 5: The Carolinas Condition Monitoring Web Map, Version


21 Figure 6: The Carolinas Condition Monitoring Web Map, Version 2.1 The National Condition Monitoring Web Map CISA initiated discussions with CoCoRaHS and NIDIS about expanding the Condition Monitoring Web Map, initially only available to the Carolinas, to a national map in January CoCoRaHS provided IT support to CISA to help maintain the Carolinas web map such as ensuring that the data feed of condition monitoring reports continued uninterrupted, answering technical questions, and discussing how new features might be incorporated into the national version of the map. CoCoRaHS also provided IT support to CISA to develop a national condition monitoring web map to include code development and database management. The national web map was integrated into the CoCoRaHS website and launched in September 2017 (Figure 7). Figure 7: National Condition Monitoring Web Map 21

22 Condition Monitoring: From the Carolinas to a National Effort Photo: Amanda Farris As the Carolinas pilot project progressed, new tools and resources for the Carolinas would not have been possible without CoCoRaHS involvement and collaboration. 8 The CoCoRaHS team supported the change from drought impact reporting to condition monitoring for its entire network of observers. As described above, CoCoRaHS and CISA collaborated to modify the report form and develop the National Condition Monitoring Web Map. October 10, 2016: CoCoRaHS released the condition monitoring report form to its network of approximately 20,000 volunteers. Through April 2018, over 23,000 reports have been submitted from observers across the United States. September 11, 2017: CoCoRaHS launched the national web map and training animation. Between December 1, 2017 and April 15, 2018 (the date range for which CoCoRaHS has website user data), the map has recorded 3,096 views. To accompany these new tools, CISA and the CoCoRaHS teams modified existing Carolinas-specific observer training materials for a national audience (see CoCoRaHS Condition Monitoring resource page), with the intent to encourage more CoCoRaHS observers to contribute to the program. Materials include general information sheets, reporting instructions, online training slideshows, and frequently asked questions. These materials incorporate lessons learned and feedback from interactions with observers participating in the Carolinas pilot program. For example, guidance for observers with respect to report content and timing has also been refined over the life of the project to make the reports most useful. One such addition has been the recommendation to submit reports on Saturday or Sunday so that reports are available at the beginning of each week for review by US Drought Monitor authors and members of the NC Drought Management Advisory Council (DMAC) as they work to develop the weekly USDM map. To accompany the national web map launch CoCoRaHS, CISA, and other partners developed a training animation and summary charts to support the condition monitoring effort. These resources were released in September 2017, with the launch of the national web map. 8 Additional funding from NIDIS was provided through UCAR to CoCoRaHS and Noah Besser to support the national launch of the condition monitoring program. 22

23 Training Animation CISA collaborated with animator Noah Besser and CoCoRaHS to develop a condition monitoring animation to help citizen scientists understand the reporting process and what their efforts can produce. The animation includes information describing condition monitoring, who uses the reports, how to submit reports, and what types of information to include. CISA developed the first draft of the storyline and narration script and provided feedback on the draft storyboard. After the initial round of revisions, CISA worked with CoCoRaHS to obtain feedback on the draft animation from CoCoRaHS volunteers, the target audience for the animation. Their feedback was incorporated into the final version of the animation. Figure 8: The CoCoRaHS Condition Monitoring Training Animation Summary Charts CoCoRaHS created a new webpage to provide summary charts which display information provided in condition monitoring reports to document changing on-the-ground conditions over time. The summary charts provide an overview of the data displayed on the national web map using observers scale bar selections. By providing a weekly count of wet, dry, and near normal reports, at quick glance a user can see change over time in the information submitted by volunteers. Another chart depicts counts for which condition monitoring categories (Agriculture, Energy, etc.) were checked in the reports. Users can view data at the national, state, county, or station number level, beginning from October 2016 (when the condition monitoring report form was released nationally). 23
24 National Communications, Outreach, and Dissemination Plan CISA and CoCoRaHS followed a strategic dissemination plan to ensure that information about these new resources was circulated to all CoCoRaHS observers, as well as potential users of condition monitoring reports. Information was circulated through the networks of CISA, CoCoRaHS, the National Drought Mitigation Center, other NIDIS DEWS programs with which the project team engages, and state and regional CoCoRaHS coordinators. While CISA continued to issue targeted communications for the Carolinas, CoCoRaHS sent announcements directly to all CoCoRaHS observers. They also utilized the CoCoRaHS Message of the Day that appears after an observer submits a daily precipitation report to further promote the condition monitoring report form. A monthly written by Nolan Doesken, National Director of CoCoRaHS, continues to remind observers to submit their condition monitoring reports. Materials were also promoted through the NIDIS newsletters and other opportunities as they arose. 24
.")
25 Photo: Julie Sohm Condition Monitoring in the Carolinas: Volunteer Engagement and Participation Observer guidance and communications and outreach efforts are very important for observer retention in all citizen science efforts (Dickinson et al., 2012). CISA worked to ensure high volunteer retention rates for the Carolinas pilot through distribution of materials such as a monthly newsletter and quarterly observer conference calls. As CISA and CoCoRaHS launched the new report form (October 2016), CISA communicated to Carolinas observers about the form modifications in advance of the change, primarily through the monthly Carolinas newsletter and a webinar. Volunteer Recruitment: Utilizing an Existing Network of Observers In summer and fall 2016, the CISA project team worked with the state climate offices and regional CoCoRaHS coordinators to disseminate information about Phase 2 and recruit participants from the existing network of CoCoRaHS observers in the Carolinas. CISA also conducted outreach to existing condition monitoring volunteers to encourage continued participation, using their experience with the project to solicit feedback during the development of the scale bar and revisions to the condition monitoring report form. Phase 2 participation primarily relied on the existing network of Carolinas observers, although efforts were made to recruit participants from other citizen science initiatives and groups who monitor and manage environmental resources, particularly those in coastal areas who might be able to contribute to the Coastal Carolinas DEWS program. This included presentations to the Master Gardeners of Florence, SC, in November 2016, and at the Waccamaw Conference in Myrtle Beach, SC, in February Communications and Outreach to Support Volunteer Retention Following citizen science and volunteer engagement best practices, the team regularly communicated with volunteers through the monthly newsletter, the Cuckoo for CoCoRaHS in the Carolinas blog, the project webpage, volunteer conference calls, and presentations (in-person and via webinar). Newsletter content drew from lessons learned in citizen science engagement, reiterating to participants the value of their contributions and how the information they provide is used. CISA team members solicited feedback for newsletter content from volunteers to show responsiveness to volunteer information needs. Project correspondence also provided information about other citizen science efforts and educational opportunities. 25
26 CISA distributed the monthly newsletter to all NC and SC CoCoRaHS observers, not just condition monitoring reporters, thereby encouraging new condition monitoring reporters as they learned more about the program each month. State CoCoRaHS coordinators were pleased to have this regular correspondence to share with volunteers noting a lack of time and resources in their own offices to provide this resource. The newsletter consistently included a Climate Update for the Carolinas with information about any recent significant weather events and the current US Drought Monitor map. The newsletter also included a Star of the Month condition monitoring reporter to highlight high quality reports from a different observer each month. Graduate students interviewed the Star of the Month to provide additional context and perspective. According to survey responses, observers selected as Star of the Month identified this as a key incentive to continued participation and increased their confidence in reporting. After the national program was launched, observers from other parts of the country were also included in this newsletter feature, in order to better connect the broader network of volunteers. Other newsletter articles provided updates on the research efforts of the CISA team, information about a variety of different citizen science projects, ideas for report content such as monitoring for seasonal changes, interviews with drought decision makers about how they use condition monitoring reports, and seasonally relevant articles. For example, the December 2015/January 2016 newsletter featured a sports climatology with information about potential weather conditions for the upcoming football playoff season. Observers have reported using newsletter articles to learn about more citizen science opportunities such as the National Weather Service cooperative observer program and National Field Photos Weekends. In addition, the team held quarterly conference calls with observers to disseminate information, deliver trainings, receive feedback, and provide a forum for discussion between observers, team members, and practitioners. End-users of the CoCoRaHS Condition Monitoring Reports such as the North Carolina State Climate Office or the local National Weather Service office often attended the calls as well. Observers expressed that these opportunities for communication helped them improve their personal data gathering and reporting. The content of the Cuckoo for CoCoRaHS in the Carolinas blog posts coincided closely with the types of information and resources provided in the newsletter. However, blog readership was much lower. Additionally, feedback through volunteer surveys indicated that the blog was not a widely accessed resource. Therefore, CISA s communication efforts primarily focused on the newsletter and observer conference calls during Phase 2. 26

27 Volunteer Participation Figure 9 below shows Carolinas condition monitoring observer locations and the number of reports submitted by each observer. Because communications and outreach in Phase 2 was circulated to all observers in the Carolinas, not just those who were directly recruited by CISA to participate, the number of participating observers and reports submitted in Phase 2 substantially increased. Figure 9: Total Reports Submitted by Carolinas Observers during Phase 2 27
 communication dissemination dates Figure 10 above depicts the number of condition monitoring reports (represented by the black line) submitted during the Phase 2 study period in")
28 Figure 10: The number of condition monitoring reports submitted during Phase 2 (black line) overlaid with 1) US Drought Monitor drought designations in NC and SC, 2) extreme weather events that occurred, and 3) communication dissemination dates Figure 10 above depicts the number of condition monitoring reports (represented by the black line) submitted during the Phase 2 study period in conjunction with factors which may have influenced the number of submitted reports. These factors include the severity of drought conditions in the Carolinas at any given time, extreme events which occurred during the study period, and the dissemination dates for communications and outreach materials (e.g., newsletter, webinars, feedback surveys). The reporting trends suggest that communications by both CISA and CoCoRaHS helped to boost participation in condition monitoring. Feedback surveys also seemed to trigger spikes in condition monitoring. Over the course of the year during which three online feedback surveys were circulated to Carolinas observers, the number of respondents indicating that they did not submit condition monitoring reports because they were unaware of the program declined. Drought conditions during the Phase 2 study period did not appear to contribute to a significant increase in the number of reports submitted. For example, there was a decline in the number of reports submitted between October and November 2016 despite worsening drought conditions. There was, however, a spike in reporting in January This more likely corresponded to the observer feedback survey and monthly newsletter that were circulated to Carolinas observers, reminding them to report. These communications materials seemed to be a greater driving force for participation in the earlier months of the study period. 28
29 Extreme events (other than drought) appeared to contribute to an increase in report submissions as well. For instance, Hurricane Matthew, which made landfall in the Carolinas in September 2016, led to major impacts along the coastline and throughout the Southeast as coastal residents evacuated to inland communities. An increase in report submissions motivated by these impacts was evident as observers documented their experiences during these events. As a result of Hurricane Matthew, the water from the marsh along the Ashley River covered my neighbor s backyard for the first time. It lifted the bottom step of my deck off its footing. It has never been this high, even last October [2015] did not reach this level. Charleston County, SC, October 9, 2016 No direct impact on me, but numerous people in the southeast portion of the state are severely impacted by the aftermath of Hurricane Matthew. Roads are blocked, farmers fields are inundated, homes are under water, and beaches are eroded. Has the water supply been impacted by agricultural runoff? Testing stations are inaccessible due to flooding. Brunswick County, NC, October 15,
30 Volunteer Feedback Surveys CISA disseminated three online surveys for project volunteers in the Carolinas to obtain feedback during Phase 2. More specific questions asked for feedback regarding the new tools developed for Phase 2 (i.e., condition monitoring scale bar and web map), motivations for participation, and the training and communications materials provided by CISA. CISA circulated surveys to all CoCoRaHS observers in the Carolinas who submitted a precipitation report since October 2016 (Table 2), to correspond with the launch of the new condition monitoring report form on the CoCoRaHS website. To support the evaluation process during Phase 2, CoCoRaHS gave administrative access to CISA in order for the research team to have access to contact information for all observers in the Carolinas. This allowed CISA to request feedback from more observers than in Phase 1 of the project, during which only those observers with whom CISA had direct contact through trainings received surveys. Consequently only 85 participants received feedback surveys in Phase 1, while all Carolinas CoCoRaHS observers who reported precipitation data received surveys in 2017 (see Table 2). 9 The number of survey recipients varied over the study period due to new volunteers joining CoCoRaHS (CISA added these observers to the survey distribution list) or when observers unsubscribed from the CISA distribution list. Survey Circulation Date Survey Recipients Responses January 26, , (43%) May 26, , (31%) September 25, , (16%) Table 2: Phase 2 Volunteer Feedback Survey Distribution and Responses 9 Note: Not all survey respondents answered all questions. Figures indicate the number of respondents who answered the specific questions discussed in the report. 30
31 Feedback on Participation Have you submitted a CoCoRaHS condition monitoring report? 80% 70% 60% 50% 40% 30% 20% 10% 0% 72% 48% 46% 35% 33% 21% 17% 17% 12% Survey 1 (n=800) Survey 2 (n=638) Survey 3 (n=320) Yes, I began reporting before October 2016 Yes, I began reporting in or after October 2016 No, I have never submitted a report Figure 11: Carolinas CoCoRaHS observer participation in condition monitoring All three surveys inquired about CoCoRaHS observers participation in condition monitoring reporting (Figure 11). The reasons for not participating appeared to shift over the survey period (Figure 12). In Survey 1, most respondents (51%) listed they were unaware of the reports, while others (19%) were only interested in submitting precipitation data. Over the next two surveys, the number of respondents unaware of the program dropped (17%), but those interested in submitting only precipitation data increased (41%). From written comments, respondents who did not submit had a variety of reasons that echoed through all 3 surveys. Feedback included perceptions that the process was complicated and time consuming, the observer s location was not interesting enough or helpful, and personal issues, such as frequent travel. 31
32 60% 50% 40% 51% I have never submitted a CoCoRaHS condition monitoring report because: 41% 37% 30% 20% 10% 17% 17% 19% 7% 17% 13% 5% 7% 8% 22% 19% 21% 0% I was unaware of this option on the CoCoRaHS website I am only interested in providing daily precipitation measurements I do not know how to submit a condition monitoring report I do not have time Other (please explain) Survey 1 (n=571) Survey 2 (n=215) Survey 3 (n=100) Figure 12: Reasons Carolinas CoCoRaHS volunteers did not submit condition monitoring reports Survey 1: Feedback on Trainings, Scale Bar, and Web Map The first survey asked for feedback on the scale bar, trainings, and the Carolinas-based web map. Approximately half of the respondents found the scale bar made reporting easier (47%). Deciding which category of the scale bar to select was easy or somewhat easy for most respondents (64%). Respondents selected categories by referencing data from their own reports (62%), comparing the conditions to normal precipitation amounts for the area (31%), or comparing conditions to the previous week (30%). Observer trainings were attended or viewed online by half of those surveyed, and the majority found them to be useful. The survey asked for web map feedback but a majority of respondents were not utilizing it at that time (58%). Most were unaware of the web map (71%), perhaps due to its recent release to the public. However, those who had viewed the web map found it useful and liked to be able to view and read other condition monitoring reports in conjunction with the US Drought Monitor Map. Survey 2: Feedback on Reporting Frequency and Communications Materials The second survey queried about the frequency of reporting, respondents confidence in reporting, and the effectiveness of communication materials. Most respondents (71%) reported with the same frequency since beginning condition monitoring. Respondents who report consistently credited their participation to the complementary nature of monitoring with their interest in weather and the environment (79%). The map on page 27 (Figure 9) represents observer locations and indicates the number of reports submitted over the Phase 2 study period. Those who reported more consistently are represented by the larger circles, indicating a higher number of reports submitted. Other factors that motivated reporting include a sense of contributing to scientific knowledge, how well condition monitoring fits with an observer s skills, and resources provided by CoCoRaHS (Figure 13). 32
33 If you report the same amount or more often, what keeps you interested? Check all that apply. Condition monitoring fits well with my skills 31% Condition monitoring compliments my interest in weather and the environment 79% The project allows me to contribute to scientific knowledge 65% The project helped me fulfill the requirements of another volunteer program (e.g., volunteer hours for Master Gardeners) The Cuckoo for CoCoRaHS in the Carolinas blog and monthly newsletter help me learn more about weather and climate 7% 11% Correspondence from CISA showed me that my reports were useful 22% Correspondence with other volunteers (e.g., through quarterly conference calls) helped connect me to a network of like-minded individuals 2% The CoCoRaHS website offered tools to help me understand precipitation in my area 29% Other (please explain) 13% 0% 10% 20% 30% 40% 50% 60% 70% 80% 90% Figure 13: Motivations for conditioned participation in condition monitoring, n=301 Those who reported less frequently attributed this to a variety of reasons including forgetting to report, not feeling the need to report normal conditions, and travel. Most respondents were very confident (59%) in reporting conditions in their area, while very few were not confident (2%). Survey respondents read the CISA and CoCoRaHS monthly newsletter (58%) more than the Cuckoo for CoCoRaHS in the Carolinas blog (21%). The most important information gleaned from these communications included the knowledge of how reports are being used, what information to provide in the condition monitoring reports, and current weather and climate conditions in the Carolinas. Survey 3: Feedback on Learning, General Impressions, and Demographic Information The final survey asked CoCoRaHS observers about their frequency of reporting, impressions of condition monitoring, and demographic information. Over 70% of respondents reported with the same frequency as when they first began reporting, with 20% reporting less often or not at all. When asked to rate 33
34 several statements about their experiences with condition monitoring, most respondents felt that they had learned more about the effects of precipitation on the local environment, contributed to scientific knowledge, and taught others about weather. While some respondents indicated that monitoring required more effort than they expected, they also believed it was useful to themselves and the scientific community, convenient, and they planned to continue reporting (Figure 14). Please rank the following statements: I plan to continue submitting condition monitoring reports in addition to my daily precipitation Submitting condition monitoring reports is convenient I understand how the data I submit is useful to the scientific community Condition monitoring is useful to me Condition monitoring requires more effort and time than I expected 0% 10% 20% 30% 40% 50% 60% 70% 80% 90% 100% 1 Strongly Disagree Strongly Agree Figure 14: Carolinas' observers perceptions about the CoCoRaHS Condition Monitoring program, n=178 More observers who responded to the survey reside in North Carolina (66%) than South Carolina (32%). There were more male (69%) observers than female. While there were several races represented, including African American, Hispanic, and mixed heritage, the majority of responders were white (88%) and over the age of 60 (74%). The age of observers corresponds with the majority being retired (64%). The majority of respondents (68%) were also graduates of college with a bachelor s degree or higher level of education. Key Findings Overall, volunteer participation in condition monitoring increased during Phase 2. CoCoRaHS volunteers who did not participate gave various reasons including the time commitment it required, disinterest, and perceived difficulty in participating. Volunteer communications including the newsletter, quarterly conference calls, and trainings raised awareness about the program. Improvements to the program during Phase 2, such as the development of the scale bar, made reporting easier for some volunteers. Ultimately volunteers appreciated knowing they contributed to scientific knowledge. Knowing that their reports were useful for decision makers was a key motivation for continued participation. 34

35 Photo: Amanda Farris Condition Monitoring in the Carolinas: Report Content and Analysis Feedback from drought decision makers indicates that condition monitoring reports provide valuable, useful information, particularly regarding changing conditions caused by weather patterns or seasonal change. Nevertheless, actual drought impacts information provided by CoCoRaHS observers is lessfrequently used than objective drought indices and condition monitoring scale bar selections are primarily used for visual guidance on the web map to determine which reports to read. It is common for new datasets, particularly those based on subjective assessments, to be met with a healthy amount of skepticism by decision makers. Even as CoCoRaHS reports have become integrated into more drought monitoring efforts, questions about their accuracy and reliability remain. Researchers at the State Climate Office of North Carolina (SCONC) addressed these questions through several types of report content analysis to determine if observer scale bar selections are comparable to objective drought indices and to assess what types of information are provided in observers qualitative descriptions of local conditions. During Phase 1, the content of 1,572 observer reports was coded using NVivo qualitative software. This information was used to develop charts and graphs to share with decision makers during the feedback process. This methodology required extensive amounts of time for report coding and analysis. Therefore, during Phase 2, new resources including the condition monitoring scale bar, summary report charts, and data download features were used to modify this analysis process. The following sections describe the various types of analysis conducted by the SCONC. Results are included in the sections below while broader discussion points are included in the Contributions to a Drought Early Warning System and Recommendations for the Future of Condition Monitoring sections. 35
36 Overview of Condition Monitoring Reports The period of analysis spans from October 2016, when the scale bar selection became an option on the condition monitoring report form, to December 2017, the end of Phase 2 of the Carolinas pilot project. The team obtained the CoCoRaHS condition monitoring reports via the following URL query to CoCoRaHS s download service: artdate=10/01/2016&enddate=12/31/2017. Reports were subset to only those that contained scale bar selections from observers in North and South Carolina, plus one observer in Georgia (site GA-MI-5) who had been actively involved since the start of the pilot project. These steps resulted in 2,709 reports submitted by 298 unique observers in the study area for the October 2016 December 2017 period (Figure 15). All subsequent analyses refer to these 2,709 reports. Figure 15: Reporters who submitted scale bar values with their condition monitoring reports during Phase 2 (October December 2017) 36
.")
37 Scale Bar Analysis Pearson s correlation coefficients were calculated between scale bar selections and drought index values to get a sense of the time scale on which observers based their scale bar selections. Scale bar selections recoded to numbers facilitated comparison to objective drought indices (Figure 16). Figure 16: Scale bar selections from the CoCoRaHS condition monitoring report form recoded to numerical scores ranging from - 3 to +3 for subsequent analysis The Standardized Precipitation Index (SPI) and Standardized Precipitation Evapotranspiration Index (SPEI) are two frequently-used indices for drought monitoring. The SCONC generates updated-daily SPI and SPEI for the contiguous United States using a combination of National Weather Service (NWS) Advanced Hydrologic Prediction Service (AHPS) quantitative precipitation estimates and PRISM (Parameter-Elevation Regressions on Independent Slopes Model) daily temperature estimates (used for SPEI only). These drought index grids have a spatial resolution of approximately 4.6 km. Both SPI and SPEI are normally-distributed with a mean of 0 and a standard deviation of 1, with positive values indicating wet conditions and negative values indicating dry conditions. SPI and SPEI values are continuous but SCONC rounds values to two decimal points for storage; additionally, the drought index values are theoretically unbounded, but they generally fall within +/-3. SCONC obtained 1, 2, 3, 6, 9, and 12 month SPI and SPEI values 10 for grid cells closest to each CoCoRaHS observer s latitude/longitude coordinates and for corresponding condition monitoring report dates. All analyses used MATLAB (version R2017a) custom scripts and functions. Though SPI and SPEI are continuous variables and the recoded scale bar values can only take on one of seven possible integer values, the Pearson correlation coefficient still provides insight into which timescale (short or long) observers likely use in their reports. Correlations indicate that the most agreement is with short term (1-month) time scale, with the strength of the correlation decreasing with duration (Table 3). The strength of the correlation with scale bar selections is roughly equivalent for SPI and SPEI. While SPEI does include a temperature component and SPI only uses precipitation, the two indices are strongly correlated in most instances (correlations for the study period were greater than 0.9 for all durations). Pearson correlation coefficients suggest that more observers may be basing their scale bar selections on short-term conditions. Short-term SPI and SPEI values only explain approximately 50% of the variance in 10 1-, 2-, and 3-month SPI time scales assume 30-day months, Therefore, the 1-month is a 30 day SPI, 2-month is 60 days, and 3-month is 90 days. The 6, 9, and 12-month time scales, in contrast, are actually based on calendar days. 37
38 scale bar selections. Possible interpretations are that either the observers or the indices are not capturing all the factors that contribute to on-the-ground wet or dry conditions. Alternatively, observers may be paying attention to different factors, such as secondary or tertiary drought impacts, that cannot be captured with these weather-data-driven drought indices. Drought Index Pearson Correlation Coefficient Duration SPI to Scale Bar SPEI to Scale Bar Table 3: Correlations between drought index values and scale bar selections are strongest for the 1-month time scale and decrease with longer timescales. Correlations for all timescales were statistically significant (α=0.05). To further examine the relationship between scale bar selections and information that can be obtained from an objective drought index, an analysis of variance (ANOVA) was carried out between scale bar selections and 1-month SPEI. ANOVA is a test to determine whether groups means are significantly different. For the purposes of this analysis, the groups corresponded to the different scale bar categories, and the dependent variable is the 1-month SPEI, chosen because it had the strongest correlation with scale bar selections. The ANOVA results indicated significant differences in group means (F=197.88, p=1.69e-209; Figure 17). The group means were additionally compared for each combination of categories; results indicated that, for all combinations, the mean of the 1-month SPEIs were significantly different, suggesting that the prevailing meteorological moisture conditions (wet vs. dry) are captured by the scale bar selections. 38
39 Figure 17: Boxplots reveal that 1-month SPEI values correspond with scale bar categories, with drier categories having lower SPEIs, and wetter categories higher SPEIs While there are statistically significant differences between group means, boxplots (Figure 17) reveal instances when the 1-month SPEI and scale bar selections disagree on the prevailing moisture conditions (i.e., one suggests conditions are dry while the other suggests conditions are wet). This is particularly evident for drier scale bar selections. Numerous possible explanations exist for these discrepancies. Recent precipitation may result in a positive (wet) 1-month SPEI value, but an observer may continue to see impacts from long-term dryness, leading to the selection of a dry category. In this hypothetical instance both sources of information are correct. Alternatively, observers may be basing their reports and scale bar selections on information that is more loosely linked to the impacts from raw precipitation amounts, such as wildlife activity or water use restrictions. Furthermore, occasional biases in the AHPS precipitation estimates can result in inaccurate SPEI values. All, none, or some combination of these may be present. Such nuances are difficult to explore with quantitative data for the whole dataset, but a closer look at the reports and scale bar selections of individual observers could provide insight into what information is used to make scale bar selections and how this is similar to, or different from, information provided by objective drought indices. 39

40 Condition Monitoring Report Content Condition monitoring reporters can choose from ten possible categories to tag the information contained in their weekly report. These categories correspond to the impact categories in the National Drought Impacts Reporter. The process of coding condition monitoring report content during Phase 1 of the project was very time and resource intensive. For Phase 2 of the project, the research team relied on self-selected report categories to analyze the types of information included in volunteers reports. Categorical Breakdowns Figure 18 shows the proportions of categories submitted by all 298 observers. The most frequently checked category was General Awareness (2155), followed by Plants and Wildlife (1366), Agriculture (907), and Water Supply & Quality (683). Figure 18: Breakdown of report categories selected by all 298 Carolinas observers. Word Frequency A word cloud (Figure 19) generated from all reports in the study period reveals that the most commonly-used words in condition monitoring reports include rain (1936 times), week (1570 times), water (1305 times), and dry (1078 times). These words suggest observers, as a whole, are basing the qualitative portions of their reports on recent conditions, with recent weather and precipitation featured prominently. 40
.")
41 Figure 19: Word cloud generated from all 2,709 study period reports Figure 19 was generated using the online word cloud creator at This tool determines word counts from a given input text file (in this case, a file containing 2,709 condition monitoring reports). Words that appear more frequently in the text appear larger in the generated word cloud. Not all words used in reports were able to be displayed in the graphic, but the most frequentlyused words are present. Minor modifications were made to the narrative reports prior to generating this word cloud. These modifications include converting all capital letters to lower case letters and replacing instances of double quotations as a unit for inch with the word inches. Similarly, there were several instances where the phrase t was used to refer to the word trace (as in a trace amount of precipitation); in these instances, t was replaced with the word trace. Finally, and were replaced with at and degree, respectively. Preliminary exploration revealed several instances of words that appeared in different tenses or pluralities, such as rain, rains, rained, and raining. However, due to the number of unique words (~2.500) and the absence of an existing, accessible routine to group these, the research team decided not account for any of these. More sophisticated analyses, such as those using MATLABs text analytics package, could account for these subtleties and reveal additional detail about report content. 41
42 Observer Case Studies While the information from all observers in the study period provides useful insight into the agreement between scale bar selections and objective drought information, it is too broad to capture the distinctions between the types of information that may inform an individual observer s reports and scale bar selections. Six observers (3 in NC and 3 in SC) were identified for a more in-depth case study analysis (Figure 20). These observers were selected by the project team based on a combination of knowledge of observers and observer report statistics (number and frequency). Figure 20: Observers selected for case study are marked with red dots on the map above. Pearson correlation coefficients were calculated between the time series of scale bar selections and objective drought indices for the six case study observers (Table 4). The time scale(s) with the strongest correlation are inconsistent across observers, which may indicate that some observers base their reports on shorter-term conditions (NC-CN-31), while others may be reporting on conditions that reflect midterm (NC-MS-5) or longer-term (SC-RC-88) conditions. Additionally, some observers scale bar selections are strongly correlated with multiple drought index timescales (e.g. NC-DH-6). Rather than suggesting observers are all over the place, in-depth analyses of individual observers (see Appendix) indicate that drought index patterns were, by chance, similar at multiple time scales during the study period, observers reports were based on multiple indicators that respond at different time scales, or/and the indicators examined differ from observer to observer. This last point is supported observer categorical 42
43 selections (Figure 21). Some observers consistently report on one or two categories (e.g. NC-DH-6, SC- RC-12, SC-CR-88) while others seem to base their reports on a broader range of indicators (e.g. NC-CN- 31, NC-MS-5, SC-AN-21). Closer examination of category selections and narratives written by observers suggest, overall, that the scale bar selections are based on more information than what is presented by SPI or SPEI. In other words, they consider more than just precipitation and/or temperature. For example, NC-CN-31 frequently reports on a range of conditions that occurred over the preceding week, such as bird activity, gardening, and health impacts. It is evident from the narrative reports that observations refer to the most recent week and are sometimes compared to the preceding week. It is therefore not surprising that drought indices at the 1-month time scale have the strongest correlations with NC-CN-31 s scale bar selections. That said, less than 50% of the variance in this observer s scale bar selections can be explained by these 1-month drought indices. Many of the conditions reported by this observer occur on different timescales; for example, changes in wildlife activity beyond what is expected of seasonal (e.g., migratory) patterns may be tied to longer accumulations of dry or wet conditions whereas plant stress can occur after just a few days without precipitation. More detailed examination of each case study observer can be found in the text below. Drought Index Duration Pearson Correlation Coefficient between Scale Bar selections and: NC-MS-5 NC-CN-31 NC-DH-6 SC-CR-88 SC-AN-21 SC-RC-12 SPI SPEI SPI SPEI SPI SPEI SPI SPEI SPI SPEI SPI SPEI Table 4: Pearson correlation coefficients between case study observers scale bar selections and drought indices (SPI and SPEI) 43

44 Figure 21: Case study observers' categorical report content selections 44
45 Case Study: NC-MS-5 NC-MS-5 is in Madison County, North Carolina. Comparison of observer scale bar selections to SPI and SPEI reveal the highest correlations occur at the 2-month timescale (Table 4). Analysis of the written narratives reveals the word rain is mentioned most frequently (86 times). Since the drought indexes used are based on precipitation (and SPI is only based on precipitation), it is not surprising that the scale bars chosen by this observer are strongly correlated with drought indexes. NC-MS-5 frequently reports on the same specific moisture indicators: a spring, microhydro, and the quality and quantity of drinking water produced. These, while strongly dependent on precipitation amounts, exhibit a lagged relationship to precipitation. It might take several weeks for the influence of no precipitation to be felt in the amount of water flowing from a spring, for example. This could be why a 2-month timescale has the strongest correlation and why other timescales (1, 3, and 6) are also strongly correlated. The categories General Awareness and Water Supply & Quality were selected for every report submitted by this observer (60 times, Figure 21). A word cloud generated from this observer s written reports (left) shows the prevalence of water-related conditions, such as spring, quality, quantity (frequently in reference to the quality and quantity of drinking water), and microhydro. Case Study: NC-CN-31 NC-CN-31 is located in eastern North Carolina in Craven County. For the study period, Craven County never experienced drought conditions, and was designated as being in abnormally dry conditions as determined by the US Drought Monitor for a brief, ~1-month period that coincided with the end of the study period. Additionally, just prior to and at the start of the study period, Hurricane Matthew brought rainfall and subsequent flooding to portions of eastern North Carolina. The most commonly used word in this observer s reports is week (130 instances), and, unlike many observers who report on a single indicator each week, NC- CN-31 often provides a summary of a variety of conditions, broken down by categories, for the surrounding area. These can be seen in the pie charts of the observer s category selections (Figure 21), as well as in the word cloud (left), where words such as week, water, plants and blooming, fire and wildfire, energy, and agriculture feature prominently. Because these observations take into account much more than rainfall or precipitation, it makes sense that the scale bar selections may not agree as strongly with precipitation or temperature-based objective drought indexes (Table 4). 45
.")
46 Case Study: NC-DH-6 NC-DH-6 is located in the Piedmont of North Carolina in Durham County, a more-urban region of the state. NC-DH-6 only has three categorical selections: General Awareness followed by Agriculture and Plants & Wildlife (Figure 21). Examination of the narrative reports reflects these categories, with words like soil and growth frequently used in reference to recent conditions, along with words such as week, ( rain, and normal (word cloud on left). The narrative reports frequently mention the current week s precipitation amounts in relation to what is typical for that time of year or in comparison to previous years. Interestingly, the 1-month and 12-month timescales have the strongest correlation between this observer s scale bar selections and objective drought indices (Table 4). Visual examination of time series (not shown) reveal that scale bar selections often changed from one week to the next, though there was an overall pattern of wetter conditions at the start, mildly dry to near normal in late 2016 and early 2017, a return to wetter conditions in mid-2017, followed by a general trend to drier conditions in late Like the scale bar selections, the 1- month SPI and SPEI, which respond to short-term precipitation patterns, show more pronounced changes from one week to the next. While both the 1-month and the 12-month drought indices also follow the same general pattern as the scale bar selections, it is dampened in the 1-month compared to the 12-month. Case Study: SC-CR-88 SC-CR-88 is located in Charleston County, along the coast of South Carolina. Sixty-three reports with scale bar selections were submitted during the study period, and both Plants & Wildlife and Agriculture categories were selected for every one of these (Figure 21). The most commonly mentioned words in their narrative reports reflect this: vegetable, garden, supplemental (as in supplemental watering), plants, and watering (word cloud on left) The word cloud also reveals few instances of words that do not refer to agriculture, plants, or precipitation. Each of these indicators are typically thought of as responding to moisture on the short-term (i.e. meteorological or agricultural drought, which have timescales of up to 3 months). Because there is such a strong emphasis on agriculture and rainfall, it is surprising that the 12-month timescale of drought indices exhibit the highest correlations with SC-CR-88 scale bar values (Table 4). 46
47 Case Study: SC-AN-21 SC-AN-21 is located in western South Carolina. The reporting categories for the study period are General Awareness (selected 60 times), followed by Plants & Wildlife, Agriculture, Tourism & Recreation, and Water Supply & Quality (Figure 21) Analysis of word frequencies used in the written reports reveal that week is the most common word (105 times) followed by rain, both indicative of the observer looking at conditions over the past week (word cloud on left). These are, interestingly, followed in frequency by the word still, mentioned 54 times. In the reports, still is frequently (though not always) used as a reference to time. Examples include Hummingbirds are still here (October 1, 2017), or My brotherin-law is still giving supplemental feed to his livestock because the winter grass isn't sufficient to carry the load and lake levels are still very low but at least we're starting to fill the rain bucket back up, (January 8, 2017). The reference to ongoing or continuing conditions is one possible explanation for why the scale bar selections for SC-AN-21 correlate strongest with objective indices at the 3- to 6-month timescales, instead of the 1-month time scale, even though there are frequent references to indicators that are typically thought of as having short (<=1 month) time scales (Table 4). Case Study: SC-RC-12 SC-RC-12 is located in central South Carolina in Richland County. This observer submitted 37 reports with an average of days between reports. Reports frequently reference the number of days since the most recent rainfall and impacts to plants (word cloud on left). These are reflected in the observer s categorical selections of General Awareness and Plants & Wildlife (Figure 21). Scale bar values are generally strongly correlated with SPI and SPEI at timescales of 1 to 9 months (Table 4). For this study period, different timescales of SPI and SPEI were strongly correlated, which could partly explain this pattern. 47

48 Photo: Christopher Lumpp Condition Monitoring in the Carolinas: Decision Maker Feedback Over the course of the pilot study, CISA engaged with drought decision makers to promote the use of condition monitoring reports and assess their usefulness for decision makers. The objectives and methods for doing so remained generally consistent over both Phase 1 and Phase 2. Feedback from decision makers sought to assess how the information provided in condition monitoring reports could be used to support drought monitoring, planning, and preparedness activities as well as decision maker perceptions about the credibility and reliability of citizen scientists as information providers. During Phase 2, CISA also solicited feedback about the web map, to determine if this new tool increased accessibility of condition monitoring reports and incorporation into different types of decision making. Methods CISA research staff conducted telephone interviews with 13 decision makers. 18 additional decision makers completed an online feedback survey which contained the same questions posed to telephone interviewees. The online survey option was offered to make participation as easy as possible for decision makers. The interview format did allow for follow up questions and some additional information that might not have been gleaned from online survey responses only. A copy of the feedback survey is available in Appendix D: Phase 2 Decision Maker Feedback Telephone interviewees 13 1 telephone interview included 2 interviewees Online survey respondents 18 1 survey was jointly completed by 3 people Incomplete surveys 7 No names provided for follow up Total 38 Feedback interviews were conducted in November 2017, approximately one year after the scale bar and revised condition monitoring report form were released to CoCoRaHS volunteers. Interviewees represented a cross-section of the diversity of interests and approaches to drought management. They are involved in drought monitoring and assessment at local, state, and national scales. and work for a variety of agencies and organizations including state-level drought management committees, CoCoRaHS, NC and SC state climate offices, the National Drought Mitigation Center, the National Drought Impacts Reporter, National Weather Service forecast offices throughout the Carolinas, 48
49 Soil and Water Conservation Districts, the US Department of Agriculture, and the US Drought Monitor. A master list of interviewees is included in Appendix F. Decision Makers Use Condition Monitoring Reports to Identify Changing Conditions 90% 80% 70% 60% 50% 40% 30% 20% 10% 0% What types of information provided by CoCoRaHS observers in their condition monitoring reports are most useful to you? Figure 22: Types of Condition Monitoring Report Information Most Useful to Decision Makers Decision makers found a wide range of condition monitoring report information useful for their respective decision making processes (Figure 22). For several categories, such as agriculture and water supply, drought committee members and US Drought Monitor authors utilize a variety of other indices to monitor these sectors. However, respondents noted that condition monitoring reports can help to fill gaps at times of the year when these indices are less informative. For instance, agricultural impacts are limited during the winter when there are fewer crop types to monitor. Information about impacts to other types of unmanaged plant species, as provided by CoCoRaHS observers, can help to fill this information gap. Contextual information in the reports, such as recent weather conditions (e.g., windy, temperature, or the amount of precipitation received over the last week) also helps decision makers better understand how various factors contribute to local conditions. 49
50 When I looked at it from my perspective of doing a national product and wanting to know what was going on in the different sectors, that's where I saw the main utility for me. It wasn't just agriculture product or water or energy or tourism or any of those categories. It wasn't just focused on that but the wide breadth of information because sometimes those are the areas that aren't as represented. ~ US Drought Monitor author Ninety three percent (93%) of respondents indicated that condition monitoring reports add value to other sources of information. For instance, one respondent noted that observations such as whether, or how much, a reporter waters his/her vegetable garden is a clear indication of how recent precipitation, or a lack thereof, affects local conditions in real time. In such an instance, observers are recognizing that weather conditions are contributing to some type of impact. Condition Monitoring Informs More than Just Drought-Related Decisions Condition monitoring was initially designed to support drought decision making. Survey responses indicate that the reports have proven useful for better understanding how on-the-ground conditions have been affected by recent precipitation, or a lack thereof. Additionally, the broad range of agencies and organizations which were notified about the availability of the reports make many different types of decisions based on weather and climate. Through the interview process, CISA learned that the information in condition monitoring reports has proven useful for more than just drought monitoring. National Weather Service (NWS) representatives noted that reports about extreme cold events helped to support decisions to issue winter weather and frost/freeze warnings. NWS representatives responsible for fire weather forecasts conveyed the utility of information provided in the reports for informing potential fire risk in an area. NWS interviewees also indicated that information about soil moisture levels, which are often included in the reports, could inform flood warnings if antecedent conditions might suggest a lack of infiltration for a heavy rain event. Over the course of the study period, several extreme weather events occurred in the Carolinas including wildfires in the fall of 2016, hurricanes that tracked up the East Coast, and a late freeze that caused severe crop damage in spring Observers shared information in their reports about the extent of impacts in their region. One respondent also noted that his perception was that observers tended to pay more attention to local conditions when extreme events are occurring in other parts of the country. For instance, the California wildfires may have prompted observers to consider how dry conditions were at that time in the Carolinas. 50
51 Decision Maker Perceive Observers to be Credible and Reliable Interviewees and survey respondents were asked about their perceptions of the credibility and reliability of condition monitoring observers in order to better understand how this might influence the use of condition monitoring reports. Credibility refers to whether or not observers provide information that can be trusted to better understand on-the-ground conditions. Reliability refers to whether or not condition monitoring reports serve as a consistent resource for this information. These questions were included in the feedback survey to better understand how decision makers perceive information submitted by citizen scientists and whether or not they consider it a legitimate data source to inform their decisions. Sixty-eight percent (68%) of respondents indicated that they find observers to be both credible and reliable sources of on-the-ground information. The remaining respondents indicated that observers were either credible or reliable (16% each), but not both. CoCoRaHS observers are credible and reliable because they have a clear interest in citizen science and commit time out of their busy lives to report this valuable on-the-ground information. Many also appear to be quite knowledgeable about a variety of different topics, including nature, tourism, hydrology, agriculture, and botany. ~ Southeast Regional Climate Center representative Decision makers also ranked which observer characteristics were most important in order to be considered credible and reliable. Respondents ranked consistency in submitting condition monitoring reports as the number one characteristic of an observer whose reports the decision maker would reference. Interviewees perceived consistent reporters as having a better understanding of on-the-ground conditions, being more in-tune with smaller shifts, and reporting smaller changes each week knowing that they could add up to big changes over time. Respondents also ranked the location of an observer as an important characteristic. Follow up discussion with telephone interviewees provided additional insight into this question. Most often the respondent s ranking order was determined by the type of decision to be made. For instance, NC DMAC committee members and US Drought Monitor authors noted that reports from observers who are located in areas where map lines are being drawn help determine appropriate delineations for drought severity on the map. Many of these interviewees ranked observer location as a more important characteristic. 51

52 Consistency in daily precipitation measurements and providing the most relevant types of information to the decision maker were also considered important characteristics. Photo: Amanda Farris Contributions to a Drought Early Warning System A drought early warning system is a comprehensive system that collects and integrates information on the key indicators of drought in order to make usable, reliable, and timely drought forecasts and assessments of drought, including assessments of the severity of drought conditions and impacts. An early warning system also communicates drought forecasts, drought conditions, and drought impacts on an ongoing basis to decision makers at the federal, regional, state, tribal, and local levels of government, the private sector, and the public. 11 CISA s Citizen Science Condition Monitoring project was intended to support drought early warning by providing this usable, reliable, and timely information through an extensive national network of citizen scientists, who are knowledgeable about their local communities and environment. This place-based knowledge allows observers to provide contextual information about environmental and societal impacts of drought that other, objective indices do not. The data collection method for condition monitoring reports is intended to provide this information such that drought onset, intensification, and recovery are documented over time, recording the evolution of droughtinduced impacts. Condition Monitoring for Drought Early Warning Decision maker survey respondents indicated that information in condition monitoring reports about changing seasons or conditions (becoming either wetter or drier) was most useful to them. The condition monitoring process was designed with this need in mind, as the process of drought impacts reporting often did not capture some of the early signs of drought or lingering impacts
53 Condition monitoring reports are most important for onset and recovery and seasonal transition. These are the most difficult conditions to convey on the map. ~ US Drought Monitor author The majority of interviewees cited indicators of changing conditions (e.g., soil moisture, watering the garden more/less, water levels) as the more useful types of information. This type of information helped decision makers determine where drought conditions might be emerging or receding, providing the detail necessary to know where to draw the lines on a drought status map. Actual drought impacts information was referenced less often by decision makers. Observer scale bar selections are used as visual guidance for which reports to read. For example, if several observers select Mildly Dry in an area that is not currently designated as being in abnormally dry or drought conditions, these reports may receive additional scrutiny. This scrutiny has the potential to translate into early warning of emerging drought conditions, particularly when other drought information is either not yet available or does not yet reflect the same level of dryness. Because the purpose is to capture the baseline, condition monitoring reports both the written portion and the scale bar selections inform the drought monitoring and decision making process in a way that reports of solely drought impacts do not. As noted in the scale bar analysis section, the scale bar comparisons with objective drought indices suggest the assessments by these citizen scientists do reflect prevailing meteorological conditions, particularly, but not exclusively, at shorter timescales (e.g. 1-month). Examination of the reports and scale bar selections of the six case study observers compared with contemporary, objective drought information revealed a complex web of observations and interpretations used by observers in preparing their reports. While data that can be captured with traditional means, such as precipitation, is frequently cited, so are other, less-measurable impacts, such as phenological or wildlife responses to changing moisture conditions. Typically, the information found in the reports from a single observer are chronological, building off previously-shared information and unfolding in a narrative-like fashion that conveys how conditions are evolving to a variety of factors not all directly a result of precipitation amounts. Additionally, based on the information presented in reports and the selected scale bar values, the breadth and depth of information varies from one citizen scientist to the other. For decision makers, these observer-to-observer variations allow for a more detailed picture of the multiple types of conditions that are occurring simultaneously, and perhaps even at the same location. Contributions to the US Drought Monitor Map Over the course of the study period questions have been raised about whether or not there is potential for CoCoRaHS condition monitoring reports to exaggerate drought conditions in a particular area which might lead to a more severe drought designation for an area. This might happen, for instance, if more observers than normal submit reports in an area experiencing drier than normal conditions, drawing attention to that location on the map. In particular, US Drought Monitor (USDM) authors are aware of 53
54 this potential issue because of the ways in which the USDM is used to support other types of decisions, such as aid provided to ranchers through the livestock forest production program. USDM authors addressed this concern directly in the telephone interviews. They described the convergence of information that they rely upon each week to delineate the lines on the map. They noted that a heavy influx of reports noting dry conditions in an area would raise red flags, leading them to investigate further and possibly contacting other drought decision makers in those areas for additional information. A built-in screening process exists for CoCoRaHS observers who submit condition monitoring reports. Unlike the NDMC Drought Impacts Reporter, which is an open tool for anyone who wants to submit a report, condition monitoring through CoCoRaHS is limited to observers who sign up as CoCoRaHS volunteers and use a designated user name and password to access the online reporting forms. This, to some extent, is a limiting factor in how many reports might be submitted through CoCoRaHS in a particular area. There are opportunities to capitalize on how this reporting system is set up. CoCoRaHS condition monitoring could be used as a way to encourage those who raise concerns about whether or not substantiated on-the-ground information is incorporated into USDM drought designations become condition monitoring reporters. By establishing themselves as consistent, detailed reporters, these stakeholders can earn a voice in the decision making process. Decision Making Processes In both North Carolina and South Carolina, the state drought committee structure and decision making processes are established by state legislation. However, the two committees function quite differently. These differences have been informative in assessing how committee function plays a role in the utility of condition monitoring reports for drought monitoring. The North Carolina Drought Management Advisory Council (DMAC) meets via conference call each Tuesday. Agencies that provide different indicator information (e.g., the state climate office, NC Forestry Commission, US Geological Survey) as well as public and private sector representatives (e.g., water utilities, energy providers) participate in the calls to discuss and designate the drought status throughout the state. The DMAC passes this on to the US Drought Monitor map author to be considered for the national map each week. The SC State Climate Office utilizes the reports for identifying and validating weather impacts especially for drought. Often as we deliberate the drought status for some areas we have a limited amount of rainfall data and impact data so information provided in the reports proves to be beneficial. Ideally there would be more observers in each region providing reports for cross-reference. ~ SC State Climatologist 54
55 In contrast, the South Carolina Drought Response Committee (DRC) convenes only when drought conditions develop, worsen, or improve. The committee consists of a similar make-up of representatives as the NC DMAC. The SC DRC also considers a range of indicator and impacts information. However, the drought designations are state specific and there is not a formal process for consistently providing information to the US Drought Monitor. The difference in committee structure and responsibilities was a contributing factor to differences in how condition monitoring reports were used in each state. In North Carolina, the DMAC committee member from the state climate office reviewed the condition monitoring reports weekly in order to share relevant information with other committee members during the weekly call. In South Carolina, the committee met only 16 times over the project study period (Phases 1 and 2). CISA team members who participated in the SC DRC calls learned that, although condition monitoring report information was mentioned during the meetings, report content had very little impact on the designations determined by the committee. In her survey responses, Hope Mizzell, the SC State Climatologist and Drought Response Program coordinator, noted that more consistency from reporters would validate the condition monitoring reports and allow for additional consideration by the SC DRC. Volunteer Engagement CISA s experience in recruiting observers for the project revealed that utilizing an existing network of observers was more successful than recruiting new CoCoRaHS volunteers, despite targeting volunteer groups with related interests such as Master Naturalists and Master Gardeners. CoCoRaHS volunteers are inherently an engaged group that is both interested in and knowledgeable about monitor weather and related impacts. On the other hand, there are drawbacks to using CoCoRaHS as the primary platform to collect condition monitoring reports. Condition monitoring is not a stand-alone activity through CoCoRaHS. Participants are asked to purchase the standard 4 CoCoRaHS rain gauge, register through CoCoRaHS, and submit daily precipitation reports in addition to condition monitoring reports. This may pose challenges to some potential observers for several reasons. The cost of the gauge may be prohibitive or an interested individual may not live in a place where a rain gauge can properly be installed (e.g., in an apartment complex). Additionally, observers need clear guidance on how to participate. Some volunteers noted that they were less inclined to continue reporting because they were unsure whether or not the information they included in their reports was relevant for any type of decision making need. Guidelines about when to submit reports and suggestions for the types of information to include were developed as these lessons surfaced. However, more guidance would likely prove helpful. During the feedback process, decision makers were asked whether or not they would consider requesting information directly from observers. For instance, if a particular area had not received any precipitation for a period of time, would it be appropriate to send a request for reports directly to observers in that area? Or, if decision makers needed more information about a particular impact (e.g., water levels) or sector (e.g., agriculture), would they be willing to ask directly? There were mixed responses to this question. Some decision makers felt that it could make the reports more useful. Others felt that it might lead an observer to over emphasize a less serious impact had they not been asked to 55
56 pay attention to something specifically rather than letting their own judgement discern whether or not to report. One decision maker noted that it may be asking too much of observers, who are already giving their time freely to provide the information. Making additional request may insinuate that more is expected of them than their initial commitment. Interestingly, both decision makers and observers addressed concerns about the subjective nature of the report content throughout the feedback process. Observers expressed concern that their information would not be perceived as useful because it is based on each observer s subjective experience(s). Decision makers noted that they too see the information as being subjective. However, they also look to these observers as experts in terms of what varying degrees of wetness or dryness look like in their own backyards. For this reason, decision makers find the reports useful in better understanding what on-the-ground conditions are like (Figure 23). 100% 80% 60% 40% 20% 0% Has the information in condition monitoring reports improved your understanding of on-the-ground drought impacts? Yes No Figure 23: Ninety two percent (92%) of decision maker survey respondents indicated that condition monitoring report have improved their understanding of on-the-ground impacts. 56

57 Recommendations for the Future of Condition Monitoring Photo: Amanda Farris Throughout the four and a half year condition monitoring pilot project, CISA has learned many lessons about what contributes to the success of the program. Many of the ideas and feedback from observers and decision makers have been incorporated into the program to enhance the utility of condition monitoring reports for drought monitoring and to facilitate the process of submitting reports for volunteers. Despite the success to date, the program could be further supported or improved to ensure that it grows into a reliable network of observers and information users. The following are suggestions from the project team which could help to guide future development of the national program. Provide Additional Support for Volunteer Engagement Overall, CISA found that the volunteer engagement portion of this project has been integral to its success. In feedback surveys, observers repeatedly indicated that regular communications, education and training materials, and opportunities to engage with other volunteers through quarterly conference calls helped to empower them and foster their sense of community. The engagement process was also key to providing information to volunteers about how their information was utilized by decision makers, a key motivation for many participants. Continuous volunteer training, communications, and engagement are necessary elements for the success of the national program. Despite the success of the program to date, the majority of CoCoRaHS observers do not regularly submit condition monitoring reports. Outreach efforts will help to recruit new volunteers to increase the coverage of reporting around the country. An annual contest between states, similar to the CoCoRaHS March Madness recruitment competition, could also help motivate participation. Continuous training and reminders to participate are necessary in order to maintain consistency in reporting, a key factor in the usefulness of reports for decision makers. Continued training also helps to refine observers reporting capabilities and provides an opportunity to foster the network of participants and their sense of community belonging. One suggestion would be to test a train the trainer model with regional CoCoRaHS coordinators. By providing additional training to coordinators who recruit volunteers in their areas, the more nuanced elements of the program can be conveyed through a network of coordinators, rather than solely relying on CoCoRaHS headquarters to be the only source of information for observers. Henry Reges, National Coordinator for CoCoRaHS, has been conducting some training during his routine visits to National Weather Service forecast offices around the country. However, feedback from these coordinators indicates that time constraints often limit their capacity to relay the information to observers in their area. Developing regionally tailored materials for these coordinators to pass on to their observers directly could help alleviate some of this burden. 57
58 Decision makers also emphasized the importance of having volunteers in rural areas, where other types of monitoring stations are not located. This is a challenge not only for condition monitoring but the CoCoRaHS program as a whole. Identifying ways in which residents in these areas could be targeted for recruitment could help to build out a more comprehensive network of reporters. As noted above, consistency is key in giving legitimacy to reporters over time. Consistent reporting is likely to improve the skills of the observer as well as creating a reliable source of on-the-ground information for decision makers. One interviewee suggested designating super reporters who are the most consistent. This could help decision makers easily identify particular reporters so they are more confident in the information they review. Gaining recognition as a super reporter would likely also be a motivating factor for an observer, to remain as consistent as possible in their report submission. Similarly to the annual precipitation measurement recognition for CoCoRaHS observers who submit each day for 365 days, these super reporters could also be recognized to help validate the effort for observers. The precipitation measurement certificates are awarded in October at the end of each water year. Distributing condition monitoring super reporter certificates in the spring could serve as a reminder to report as the drier months of the year approach. Demographics Outreach and communications must be tailored to groups outside those who are typical citizen scientists or volunteers: Demographic questions were posed in the third feedback survey. The predominant profile of observers is a retired (64%) white (88%) male (69%) over the age of 60 (74%), with a Bachelor s degree or higher (68%). This profile is consistent with many other citizen science volunteer groups. However, there are many different types of societal impacts not captured by this section of the population. Developing tailored training, communications, and outreach materials can help to encourage participation by other groups. Additionally, providing explicit information about how their contributions benefit their communities directly may also compel more participation. Engage Decision Makers Outreach to a variety of different types of decision makers who could utilize the information will also be important to ensure the success of the program. As CISA learned through the feedback process, the information in condition monitoring reports can be used for a wide range of decisions, not only drought monitoring. Ensuring that decision makers who could potentially benefit from the information, particularly National Weather Service forecast offices, will create a greater demand for condition monitoring reports and would also likely identify even more uses for the information. CISA s evaluation also revealed that certain decision making processes through which drought conditions are monitored on a weekly basis (i.e., US Drought Monitor map publication, NC Drought Management Advisory Council weekly meetings) are more conducive to the use of information in condition monitoring reports. Identifying states with other drought monitoring processes where condition monitoring report information might be integrated would allow further evaluation to determine how the information can be used. 58
59 Invest in Technological Improvements Mobile Phone App In the volunteer feedback surveys, many volunteers noted that not having the ability to submit a condition monitoring report via the CoCoRaHS mobile phone app limited their participation. Additionally, the Message of the Day, which appears after a precipitation measurement is submitted through the desktop version of the website, is not available on the mobile app. The Message of the Day is used consistently as a reminder to submit condition monitoring reports. As a first step, adding the Message of the Day to the mobile app could help increase participation. CoCoRaHS currently relies on volunteer efforts in the development of its mobile applications. Providing funding for the improvement of their app is likely to increase participation. This may also help to engage other demographics in the reporting process, who are more likely to utilize their mobile phones rather than a desktop or laptop computer to participate in a volunteer effort. Photo Submissions Over the course of the Carolinas pilot program, CISA has collected photographs from observers through direct . These have been passed along to decision makers for whom the information is likely to be most relevant. One observer in particular in Nash County, NC regularly submits a series of photographs via . CISA passes these photos onto Rebecca Ward, Extension Climatologist for the State Climate Office of North Carolina and member of the NC Drought Management Advisory Council. Rebecca has noted that, because the Nash County observer submits photos of water levels or plant growth (i.e., wilting or dying vegetation) in the same areas, the photos can be compared over time to determine the severity of wetness or dryness in the area. Seventy nine percent (79%) of decision maker survey respondents indicated that photos would help to document or support information provided in condition monitoring reports. Several interviewees suggested that photo documentation of changing water levels would be especially helpful. Although, there were also several comments that photos would need to be submitted regularly in order to be useful. Those who were unsure if this would be helpful (21%) noted concern for requesting additional items from observers and that reviewing lots of photos along with the reports may be too burdensome. The CoCoRaHS team has also expressed concerns in accepting photos from all volunteers because of additional technological requirements. These responses and suggestions are reflective of the Field Photo Weekends model that the Southern Climate Impacts Planning Program (SCIPP) has developed. Therefore, it may be beneficial to investigate ways in which this program can continue to be supported and promoted to ensure that photos are utilized by decision makers as a measure of on-the-ground conditions and change over time. 59
60 Web Map Improvements Feedback about the national web map was very positive from both observers and decision makers. Both groups find the map to be relatively easy to navigate. Decision makers noted that it is very useful in identifying areas that might need more investigation based on the severity of dryness represented by the observer s scale bar selection on the map. There were a few specific suggestions from decision makers to improve the utility of the national web map. These included: Adding a weekly precipitation layer similar to the US Drought Monitor map layer, that could be toggled on and off Creating a filter that would only display reports from observers who submit consistently (i.e., super reporters ) Adding a search field for specific dates, especially as more and more reports are added over time Adding a filter for only wet or dry reports, rather than having all reports displayed Develop Regional Guidance for Condition Monitoring Decision makers and CoCoRaHS-condition monitoring observers provided feedback on the guidance for the seven scale bar categories (severely wet to severely dry). Both agreed that the guidance is beneficial for observers to better understand what and how to report. It also helps decision makers understand what level of wetness or dryness an observer is seeing based on the guidance given for each category. However, specific issues arose during feedback discussions such as how to account for variation in regional differences in dry or drought conditions. For example, what is defined as dry would be very different in Arizona versus South Carolina. Moreover, even within the Carolinas, the definition of what is dry can vary greatly from the coastal to mountain regions. Seasonal changes can also have a significant impact. How to account for temporal aspects in the guidance, which the category descriptions are currently lacking, was also raised. As the condition monitoring program expands nationally, addressing this need for regionally specific guidance for the scale bar categories should be considered. The National Drought Mitigation Center is conducting research to better understand regional drought impacts based on information submitted to the National Drought Impacts Reporter. This work has potential to be very informative for regional scale bar guidance. Other DEWS, RISAs, or national programs which are doing applied climate work at the regional level would also make logical partners to help develop guidance. Conduct More In-Depth Analysis of Report Content The 22,000+ condition monitoring reports which have been submitted to CoCoRaHS since October 2016 make up a rich database. The results of the scale bar selection analysis indicate that observers selected values reflect prevailing meteorological conditions, as indicated by SPI and SPEI. Furthermore, the types of information contained in the reports of the six case study observers reveal agreements between the types of observations shared, the categories selected, and the time scale of the objective drought index 60
61 with the strongest correlation. Additional analyses could provide greater context for the reports that could ultimately lead to better drought early warning. For the current assessment, minimal text analysis was performed on the reports to capture word counts. More sophisticated analysis of word pairs, such as mentions of low soil moisture versus high soil moisture could help quantify the degree of association between the types of information frequently tagged for each scale bar category. This could, in turn, add confidence to the accuracy of the reports. Connecting this information with comparisons to objective drought index values may additionally provide guidance on potential drought impacts in areas without on-the-ground information. This analysis conducted at other regional scales, along with other efforts to better understand the degree of impacts at different levels of drought severity as described above, could also help to inform the development of regional scale bar guidance, to better train observers in scale bar selections that accurately represent regionally-specific levels of drought. In Conclusion Providing additional support to continue engagement with volunteers and report users as well as investing in the iterative improvement of reporting guidance and technologies will help to ensure that the CoCoRaHS condition monitoring program continues to thrive and evolve. 61
62 Appendix A: Volunteer Feedback Survey #1 62
63 63
64 64
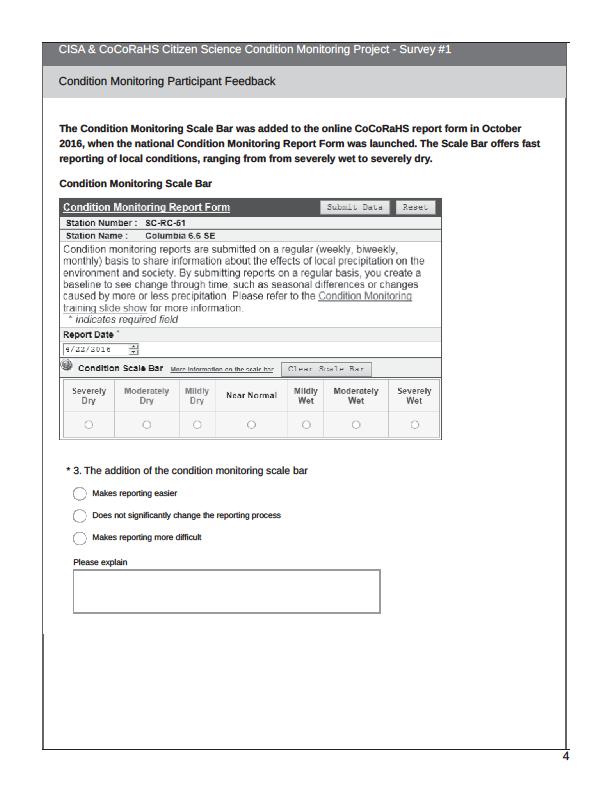
65 65
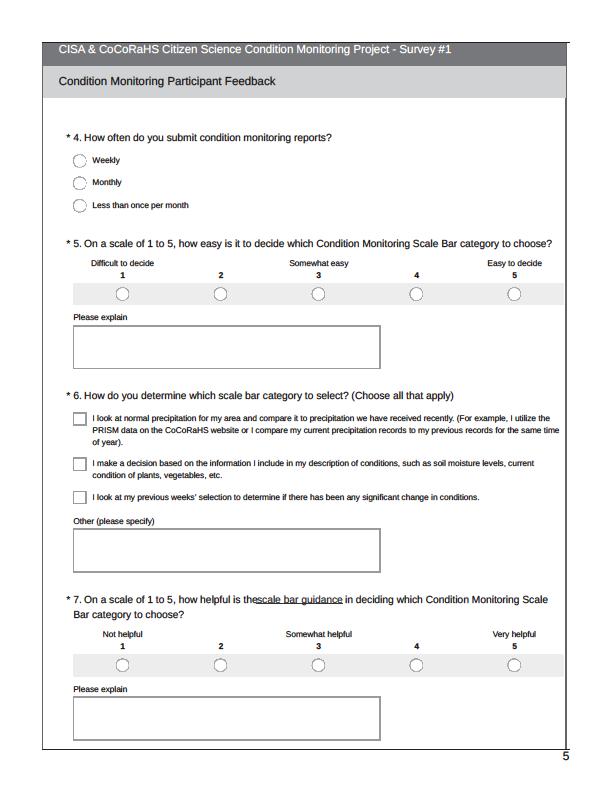
66 66
67 67
68 68
69 69
70 70
71 71
72 Appendix B: Volunteer Feedback Survey #2 72
73 73
74 74
75 75
76 76
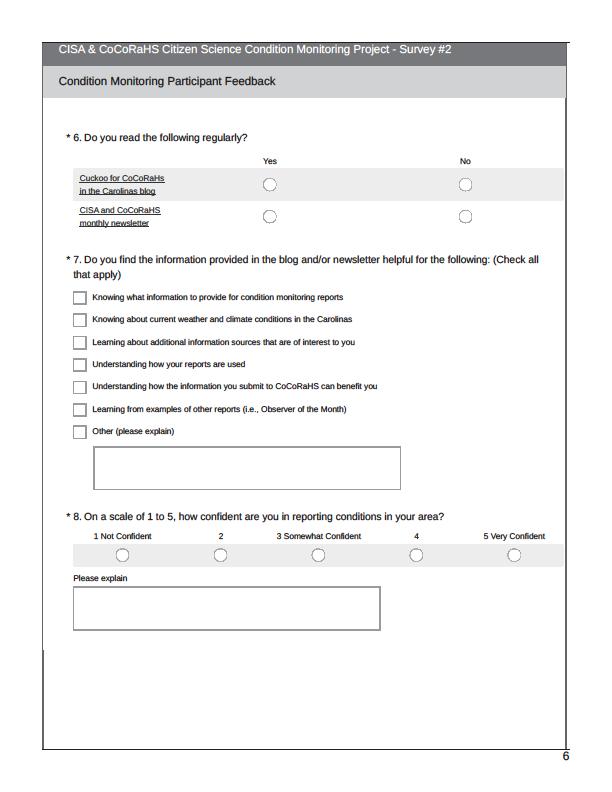
77 77
78 78
79 Appendix C: Volunteer Feedback Survey #3 79
80 80
81 81
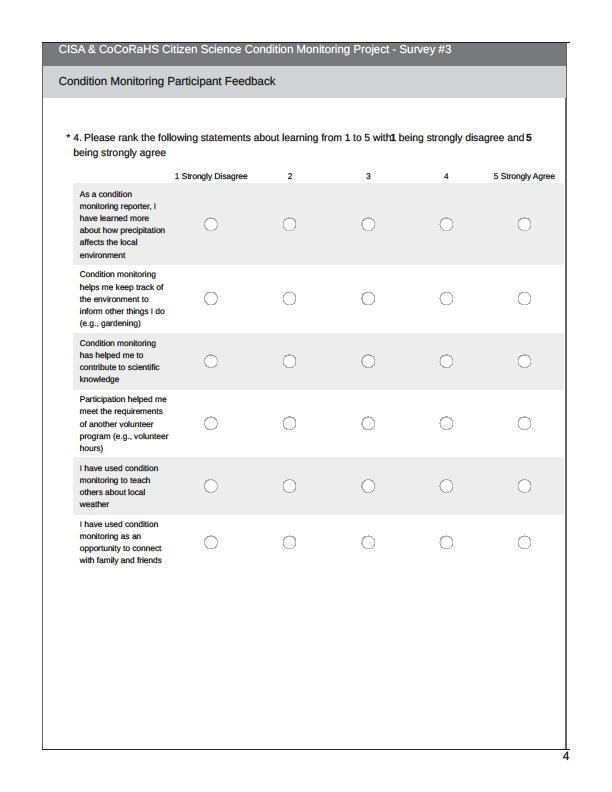
82 82
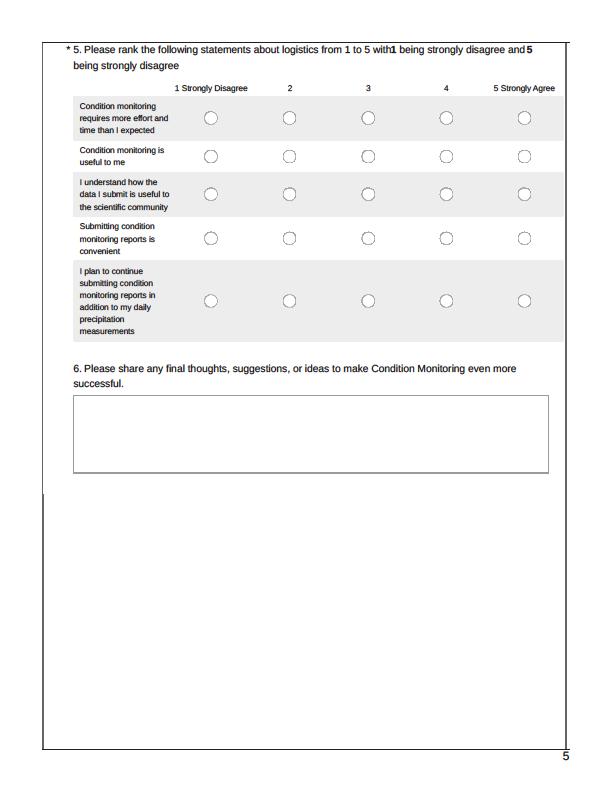
83 83
84 84
85 85
86 86
87 ! 87

88 Appendix D: Phase 2 Decision Maker Feedback Survey 88
89 89
90 90
91 91
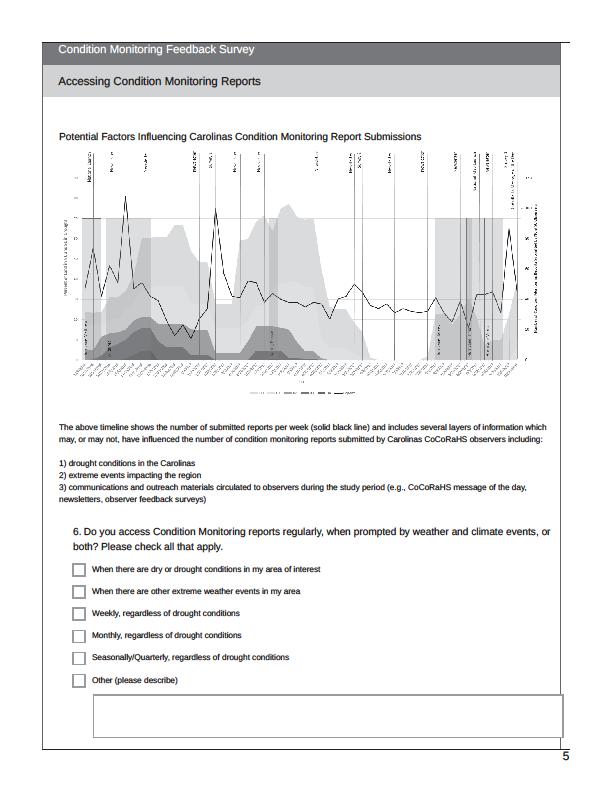
92 92
93 93
94 94
95 95
96 96
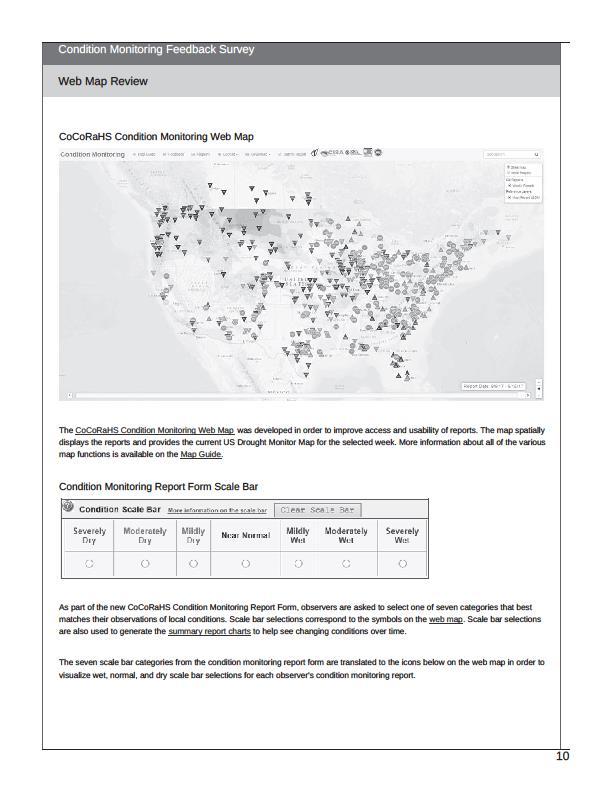
97 97
Improving Understanding of Drought Impacts through Citizen Science
 Improving Understanding of Drought Impacts through Citizen Science Amanda Brennan, Janae Davis, Kirstin Dow, Kirsten Lackstrom, Sumi Selvaraj North Carolina Water Resources Research Institute Annual Meeting
What Can Citizen Scientists Tell Us about Drought?
 What Can Citizen Scientists Tell Us about Drought? Using CoCoRaHS to Improve the Monitoring and Reporting of Drought Impacts Amanda Farris, Kirsten Lackstrom Carolinas Integrated Sciences & Assessments
What Can Citizen Scientists Tell Us about Drought?
 What Can Citizen Scientists Tell Us about Drought? Amanda Brennan, Kirstin Dow, Benjamin Haywood, Kirsten Lackstrom American Meteorological Society Annual Meeting January 13, 2016 New Orleans, LA Today
Condition Monitoring: A New System for Drought Impacts Reporting through CoCoRaHS
 Condition Monitoring: A New System for Drought Impacts Reporting through CoCoRaHS Amanda Farris Carolinas Integrated Sciences & Assessments (CISA) University of South Carolina WERA 1012 Annual Conference
CoCoRaHS Condition Monitoring. Webinar with Carolinas Observers January 25, 2017
 CoCoRaHS Condition Monitoring Webinar with Carolinas Observers January 25, 2017 Amanda Kirsten David Ellie & Meghan Project Partners CoCoRaHS Condition Monitoring Overview Regular reports describing how
CoCoRaHS Condition Monitoring
 CoCoRaHS Condition Monitoring CISA Carolinas Integrated Sciences & Assessments CISA works with a variety of stakeholders across North and South Carolina to incorporate climate information into water, public
CISA & CoCoRaHS Condition Monitoring Newsletter
 Page 1 of 9 Click this link to open the e-mail in a browser. Click here CISA & CoCoRaHS Condition Monitoring Newsletter Dear CoCoRaHS Observer, Happy spring! We hope that you have been enjoying the azaleas,
CoCoRaHS and the Drought Monitor (Help us help you!) Colorado Climate Center
 Colorado Climate Center") CoCoRaHS and the Drought Monitor (Help us help you!) Colorado Climate Center Anybody bring a rain gauge?! A sight for sore eyes The Community Collaborative Rain, Hail, and Snow (CoCoRaHS) networks is a
CoCoRaHS and the Drought Monitor (Help us help you!) Colorado Climate Center Anybody bring a rain gauge?! A sight for sore eyes The Community Collaborative Rain, Hail, and Snow (CoCoRaHS) networks is a
CISA & CoCoRaHS. June This month's newsletter includes: 20 Years of CoCoRaHS!
 CISA & CoCoRaHS Condition Monitoring Newsletter This month's newsletter includes: 20 Years of CoCoRaHS! Information about our next Carolinas' Condition Monitoring Observer Call A Southeast Regional Climate
Making a Climograph: GLOBE Data Explorations
 Making a Climograph: A GLOBE Data Exploration Purpose Students learn how to construct and interpret climographs and understand how climate differs from weather. Overview Students calculate and graph maximum
CoCoRaHS. Carolina PAGES Hurricane Matthew in South Carolina. CoCoRaHS Observers Activity During Hurricane Matthew.
 Carolina CoCoRaHS SUMMER 2017 Hurricane Matthew in South Carolina H urricane Matthew was the first South Carolina hurricane landfall since Hurricane Charley and Gaston came ashore in 2004. It made landfall
Applications/Users for Improved S2S Forecasts
 Applications/Users for Improved S2S Forecasts Nolan Doesken Colorado Climate Center Colorado State University WSWC Precipitation Forecasting Workshop June 7-9, 2016 San Diego, CA First -- A short background
Spatial Data Availability Energizes Florida s Citizens
 NASCIO 2016 Recognition Awards Nomination Spatial Data Availability Energizes Florida s Citizens State of Florida Agency for State Technology & Department of Environmental Protection Category: ICT Innovations
Local Precipitation Variability
 Local Precipitation Variability Precipitation from one storm can vary from neighborhood to neighborhood. What falls in your yard may not fall in the next. The next time it rains see how the precipitation
National Drought Mitigation Center. Drought Services: Collaborative Efforts Towards Drought Early Warning and Information Systems
 National Drought Mitigation Center Drought Services: Collaborative Efforts Towards Drought Early Warning and Information Systems Mark Svoboda, Climatologist Monitoring Program Area Leader National Drought
An Online Platform for Sustainable Water Management for Ontario Sod Producers
 An Online Platform for Sustainable Water Management for Ontario Sod Producers 2014 Season Update Kyle McFadden January 30, 2015 Overview In 2014, 26 weather stations in four configurations were installed
By Lillian Ntshwarisang Department of Meteorological Services Phone:
 By Lillian Ntshwarisang Department of Meteorological Services Phone: +267 3612200 Email: lntshwarisang@gov.bw/ lntshwarisang@gmail.com Introduction Mandate of DMS Function of the Department Services to
South Carolina s Climate Report Card: South Carolina State Climatology Office. Understanding South Carolina s Climate Trends and Variability
 The information provided here is for informational and educational purposes and current as of the date of publication. The information is not a substitute for legal advice and does not necessarily reflect
CISA & CoCoRaHS Condition Monitoring Newsletter
 Page 1 of 8 CISA & CoCoRaHS Condition Monitoring Newsletter Dear CoCoRaHS Observer, Aside from the regular regional climate update, this month's newsletter features a drought decision maker that CISA has
Framework on reducing diffuse pollution from agriculture perspectives from catchment managers
 Framework on reducing diffuse pollution from agriculture perspectives from catchment managers Photo: River Eden catchment, Sim Reaney, Durham University Introduction This framework has arisen from a series
CISA & CoCoRaHS Condition Monitoring Newsletter
 Page 1 of 10 Click this link to open the e-mail in a browser. Click here CISA & CoCoRaHS Condition Monitoring Newsletter Dear CoCoRaHS Observer, Summer is almost here, marked by kids and grandkids getting
Ministry of Health and Long-Term Care Geographic Information System (GIS) Strategy An Overview of the Strategy Implementation Plan November 2009
 Strategy An Overview of the Strategy Implementation Plan November 2009") Ministry of Health and Long-Term Care Geographic Information System (GIS) Strategy An Overview of the Strategy Implementation Plan November 2009 John Hill, Health Analytics Branch Health System Information
Ministry of Health and Long-Term Care Geographic Information System (GIS) Strategy An Overview of the Strategy Implementation Plan November 2009 John Hill, Health Analytics Branch Health System Information
Doug Kluck NOAA Kansas City, MO National Center for Environmental Information (NCEI) National Integrated Drought Information System (NIDIS)
 National Integrated Drought Information System (NIDIS)") National Integrated Drought Information System (NIDIS) for the Missouri River Basin Drought Early Warning Information System (DEWS) & Runoff Trends in the Missouri Basin & Latest Flood Outlook Doug Kluck
National Integrated Drought Information System (NIDIS) for the Missouri River Basin Drought Early Warning Information System (DEWS) & Runoff Trends in the Missouri Basin & Latest Flood Outlook Doug Kluck
2018 NASCIO Award Submission Category: Cross-Boundary Collaboration and Partnerships. Project Title: Tennessee Wildfires: A Coordinated GIS Response
 2018 NASCIO Award Submission Category: Cross-Boundary Collaboration and Partnerships Project Title: Tennessee Wildfires: A Coordinated GIS Response Sevier County, Tennessee State of Tennessee, Emergency
The United States Drought Monitor How is it Made?
 The United States Drought Monitor How is it Made? Brian Fuchs, Climatologist National Drought Mitigation Center School of Natural Resources University of Nebraska-Lincoln September 14-17, 2009 Bamako,
The National Integrated Drought Information System (NIDIS) Moving the Nation from Reactive to Proactive Drought Risk Management
 Moving the Nation from Reactive to Proactive Drought Risk Management") The National Integrated Drought Information System (NIDIS) Moving the Nation from Reactive to Proactive Drought Risk Management CSG-West Annual Meeting Agriculture & Water Committee Snowbird, UT September
The National Integrated Drought Information System (NIDIS) Moving the Nation from Reactive to Proactive Drought Risk Management CSG-West Annual Meeting Agriculture & Water Committee Snowbird, UT September
3.6. support remote sensing, weather forecasting and other atmospheric and hydrologic research (Cifelli, et al, 2005).
.") 3.6 THE COMMUNITY COLLABORATIVE RAIN, HAIL AND SNOW NETWORK (COCORAHS) INFORMAL ATMOSPHERIC SCIENCE IN THE COMMUNITY: WHAT CAN WE ACCOMPLISH? Henry W. Reges, Nolan J. Doesken and Julian Turner CoCoRaHS/Colorado
3.6 THE COMMUNITY COLLABORATIVE RAIN, HAIL AND SNOW NETWORK (COCORAHS) INFORMAL ATMOSPHERIC SCIENCE IN THE COMMUNITY: WHAT CAN WE ACCOMPLISH? Henry W. Reges, Nolan J. Doesken and Julian Turner CoCoRaHS/Colorado
The Kentucky Mesonet: Entering a New Phase
 The Kentucky Mesonet: Entering a New Phase Stuart A. Foster State Climatologist Kentucky Climate Center Western Kentucky University KCJEA Winter Conference Lexington, Kentucky February 9, 2017 Kentucky
Dr. Steven Koch Director, NOAA National Severe Storms Laboratory Chair, WRN Workshop Executive Committee. Photo Credit: Associated Press
 Dr. Steven Koch Director, NOAA National Severe Storms Laboratory Chair, WRN Workshop Executive Committee 1 Photo Credit: Associated Press 1" 2" Much%Increased%Vulnerability%to% High6Impact%Weather% %even%before%2011!%
NADM, NACEM, and Opportunities for Future Collaboration
 NADM, NACEM, and Opportunities for Future Collaboration Richard R. Heim Jr. NOAA/NESDIS/National Climatic Data Center Asheville, North Carolina, U.S.A. 4th Annual DRI Workshop 26-28 January 2009, Regina,
PROGRESS REPORT ON APPROACH PAPER THE IMPLEMENTATION OF THE GEF KNOWLEDGE MANAGEMENT. GEF/C.49/Inf.04 September 23, 2015
 49 th GEF Council Meeting October 20 22, 2015 Washington, D.C. GEF/C.49/Inf.04 September 23, 2015 PROGRESS REPORT ON THE IMPLEMENTATION OF THE GEF KNOWLEDGE MANAGEMENT APPROACH PAPER TABLE OF CONTENTS
THE IMPACT OF EL NIÑO AND LA NIÑA ON SOUTHEAST ASIA
 THE IMPACT OF EL NIÑO AND LA NIÑA ON SOUTHEAST ASIA 21st-23rd February 2000 WORKSHOP SUMMARY Organized by the Indochina Global Change Network Funded by the Asia-Pacific Network for Global Change Research
2007 / 2008 GeoNOVA Secretariat Annual Report
 2007 / 2008 GeoNOVA Secretariat Annual Report Prepared for: Assistant Deputy Minister and Deputy Minister of Service Nova Scotia and Municipal Relations BACKGROUND This report reflects GeoNOVA s ongoing
Day of the Last Spring Freeze?
 Messages of the Day May 2015 Saturday, May 2, 2015 Day of the Last Spring Freeze? Here is a very helpful message from the Midwestern Regional Climate Center: Just when you think winter is over Every spring,
CoCoRaHS. Community Collaborative Rain, Hail, & Snow Network. Ashley Wolf Meteorologist NWS Green Bay Northeast Wisconsin CoCoRaHS Coordinator
 CoCoRaHS Community Collaborative Rain, Hail, & Snow Network Ashley Wolf Meteorologist NWS Green Bay Northeast Wisconsin CoCoRaHS Coordinator What is CoCoRaHS Who, What, Where and Whys of CoCoRaHS What?
Extreme Temperature Protocol in Middlesex-London
 Clean Air Partnership Webinar March 17, 2009 Extreme Temperature Protocol in Middlesex-London Presented by Iqbal Kalsi, MBA, CPHI(C), CCEP iqbal.kalsi@mlhu.on.ca 1 History Informal monitoring, tracking
THE COMMUNITY COLLABORATIVE RAIN, HAIL AND SNOW NETWORK (COCORAHS) A GREAT WAY TO LEARN AND TEACH ABOUT OUR CLIMATE
 A GREAT WAY TO LEARN AND TEACH ABOUT OUR CLIMATE") J2.2 THE COMMUNITY COLLABORATIVE RAIN, HAIL AND SNOW NETWORK (COCORAHS) A GREAT WAY TO LEARN AND TEACH ABOUT OUR CLIMATE Henry W. Reges*, Robert C. Cifelli, and Nolan J. Doesken. CoCoRaHS/Colorado State
J2.2 THE COMMUNITY COLLABORATIVE RAIN, HAIL AND SNOW NETWORK (COCORAHS) A GREAT WAY TO LEARN AND TEACH ABOUT OUR CLIMATE Henry W. Reges*, Robert C. Cifelli, and Nolan J. Doesken. CoCoRaHS/Colorado State
CoCoRaHS Monitoring Colorado s s Water Resources through Community Collaborations
 CoCoRaHS Monitoring Colorado s s Water Resources through Community Collaborations Nolan Doesken Colorado Climate Center Atmospheric Science Department Colorado State University Presented at Sustaining
NWSEO CALLS FOR NATIONAL CLIMATE SERVICE TO BE MADE PART OF THE NATIONAL WEATHER SERVICE
 APRIL 2009 NWSEO CALLS FOR NATIONAL CLIMATE SERVICE TO BE MADE PART OF THE NATIONAL WEATHER SERVICE At its recent winter meeting, the NWSEO National Council decided to urge the Administration and Congress
The National Integrated Drought Information System in the Midwest
 The National Integrated Drought Information System in the Midwest Advancing Drought Science and Preparedness Across the Nation Ohio River Basin Alliance Summit Thomas More College October 19, 2018 What
The purpose of this report is to recommend a Geographic Information System (GIS) Strategy for the Town of Richmond Hill.
 Strategy for the Town of Richmond Hill.") Staff Report for Committee of the Whole Meeting Department: Division: Subject: Office of the Chief Administrative Officer Strategic Initiatives SRCAO.18.12 GIS Strategy Purpose: The purpose of this report
Staff Report for Committee of the Whole Meeting Department: Division: Subject: Office of the Chief Administrative Officer Strategic Initiatives SRCAO.18.12 GIS Strategy Purpose: The purpose of this report
WMO. Key Elements of PWS and Effective EWS. Haleh Haleh Kootval Chief, PWS Programme
 WMO Key Elements of PWS and Effective EWS Haleh Haleh Kootval Chief, PWS Programme Workshop Objectives This workshop is all about Service Delivery and becoming excellent at it through: Sharing experiences
Operational MRCC Tools Useful and Usable by the National Weather Service
 Operational MRCC Tools Useful and Usable by the National Weather Service Vegetation Impact Program (VIP): Frost / Freeze Project Beth Hall Accumulated Winter Season Severity Index (AWSSI) Steve Hilberg
The U.S. National Integrated Drought Information System. Roger S. Pulwarty National Oceanic and Atmospheric Administration USA
 The U.S. National Integrated Drought Information System Roger S. Pulwarty National Oceanic and Atmospheric Administration USA Drought: Weather-climate continuum and adaptation deficits 2010 2011 2012 2015
Analysis of 3, 6, 12, and 24 Hour Precipitation Frequencies Over the Southern United States
 Analysis of 3, 6, 12, and 24 Hour Precipitation Frequencies Over the Southern United States Final Report University: University Contact: NWS Office: NWS Contact: Florida State University Henry E. Fuelberg
United States Multi-Hazard Early Warning System
 United States Multi-Hazard Early Warning System Saving Lives Through Partnership Lynn Maximuk National Weather Service Director, Central Region Kansas City, Missouri America s s Weather Enterprise: Protecting
Spatial Optimization of CoCoRAHS Network in Tennessee. Joanne Logan Department of Biosystems Engineering and Soil Science University of Tennessee
 Spatial Optimization of CoCoRAHS Network in Tennessee Joanne Logan Department of Biosystems Engineering and Soil Science University of Tennessee Abstract CoCoRaHS (Community Collaborative Rain, Hail and
Rainfall-River Forecasting: Overview of NOAA s Role, Responsibilities, and Services
 Dr. Thomas Graziano Chief Hydrologic Services Division NWS Headquarters Steve Buan Service Coordination Hydrologist NWS North Central River Forecast Center Rainfall-River Forecasting: Overview of NOAA
NJ Community Collaborative Rain, Hail and Snow Network
 NJ Community Collaborative Rain, Hail and Snow Network Mathieu Gerbush NJ Assistant State Climatologist/Climate Services Co-CoCoRaHS Coordinator NJ Agricultural Experiment Station School of Environmental
Title: Storm of the Century: Documenting the 1993 Superstorm
 A. PAIIF 2011 Cover Page Title: Storm of the Century: Documenting the 1993 Superstorm Point of Contact: Name: Alex Granger Email: alex.granger@noaa.gov Phone Number: 571-555-9278 Mailing Address: Research
Weather Analysis and Forecasting
 Weather Analysis and Forecasting An Information Statement of the American Meteorological Society (Adopted by AMS Council on 25 March 2015) Bull. Amer. Meteor. Soc., 88 This Information Statement describes
WMO Priorities and Perspectives on IPWG
 WMO Priorities and Perspectives on IPWG Stephan Bojinski WMO Space Programme IPWG-6, São José dos Campos, Brazil, 15-19 October 2012 1. Introduction to WMO Extended Abstract The World Meteorological Organization
NOAA S2S Planning. Dave DeWitt Fred Toepfer
 NOAA S2S Planning Dave DeWitt Fred Toepfer 1 Agenda 1. Brief synopsis of The Weather Research and Forecasting Act of 2017 2. Report to Congress a. Timeline b. Process c. Document Outline 3. Some Preliminary
NWS/AFWA/Navy Office: JAN NWS (primary) and other NWS (see report) Name of NWS/AFWA/Navy Researcher Preparing Report: Jeff Craven (Alan Gerard)
 and other NWS (see report) Name of NWS/AFWA/Navy Researcher Preparing Report: Jeff Craven (Alan Gerard)") University of Louisiana at Monroe Name of University Researcher Preparing Report: Dr. Paul J. Croft NWS/AFWA/Navy Office: JAN NWS (primary) and other NWS (see report) Name of NWS/AFWA/Navy Researcher Preparing
University of Louisiana at Monroe Name of University Researcher Preparing Report: Dr. Paul J. Croft NWS/AFWA/Navy Office: JAN NWS (primary) and other NWS (see report) Name of NWS/AFWA/Navy Researcher Preparing
Challenges to Improving the Skill of Weekly to Seasonal Climate Predictions. David DeWitt with contributions from CPC staff
 Challenges to Improving the Skill of Weekly to Seasonal Climate Predictions David DeWitt with contributions from CPC staff 1 Outline CPC Background Prediction, monitoring, diagnostics, and climate services
COMPARISON OF DROUGHT INDICES AND SC DROUGHT ALERT PHASES
 COMPARISON OF DROUGHT INDICES AND SC DROUGHT ALERT PHASES Ekaterina Altman 1 AUTHORS : 1 Master of Environmental Resource Management Candidate, Environment and Sustainability Program, University of South
Drought Impacts in the Southern Great Plains. Mark Shafer University of Oklahoma Norman, OK
 Drought Impacts in the Southern Great Plains Mark Shafer University of Oklahoma Norman, OK Causes of Drought: Large-Scale, Stationary High Pressure Air rotates clockwise around high pressure steers storms
2018/1 The integration of statistical and geospatial information. The Regional Committee of UN-GGIM: Americas:
 The following are the conclusions and recommendations of the Regional Committee of the United Nations on Global Geospatial Information Management for the Americas, during its Fifth Session, Thursday 8
CoCoRaHS Condition Monitoring. Presentation to NC CoCoRaHS Observers February 21, 2014
 CoCoRaHS Condition Monitoring Presentation to NC CoCoRaHS Observers February 21, 2014 Today s Presentation Heather Dinon Aldridge NC State Climate Office Amanda Brennan CISA Communications & Outreach Weather
JCOMM-CHy Coastal Inundation Forecasting Demonstration Project (CIFDP)
") WMO World Meteorological Organization Working together in weather, climate and water JCOMM-CHy Coastal Inundation Forecasting Demonstration Project (CIFDP) Coastal Flooding & Vulnerable Populations Coastal
WMO World Meteorological Organization Working together in weather, climate and water JCOMM-CHy Coastal Inundation Forecasting Demonstration Project (CIFDP) Coastal Flooding & Vulnerable Populations Coastal
GEO Geohazards Community of Practice
 GEO Geohazards Community of Practice 1) Co-Chair of GHCP With input from: Stuart Marsh, GHCP Co-Chair Francesco Gaetani, GEO Secretariat and many GHCP contributors 1) Nevada Bureau of Mines and Geology
WSWC/NOAA Workshops on S2S Precipitation Forecasting
 WSWC/NOAA Workshops on S2S Precipitation Forecasting San Diego, May 2015 Salt Lake City at NWS Western Region HQ, October 2015 Las Vegas at Colorado River Water Users Association, December 2015 College
Contemporary Challenges in Short-Term Climate Forecasting. David DeWitt Director, Climate Prediction Center
 Contemporary Challenges in Short-Term Climate Forecasting David DeWitt Director, Climate Prediction Center 1 Outline Commercial: NOAA Administrator s Award for Decisions Support Services Associated with
UN-GGIM: Strengthening Geospatial Capability
 Fifth Plenary Meeting of UN-GGIM: Europe Brussels, 6-7 June 2018 UN-GGIM: Strengthening Geospatial Capability Walking the talk to leave no one behind Greg Scott, UN-GGIM Secretariat Environmental Statistics
Drought Indices in Decision-making Process of Drought Management
 Drought Indices in Decision-making Process of Drought Management Ekaterina Altman Master of Earth and Environmental Resources Management University of South Carolina Carolina Climate Resilience Conference
Chemical Safety as a Core ACS Value: Report on the 2018 Safety Summit
 Chemical Safety as a Core ACS Value: Report on the 2018 Safety Summit Introduction In December 2016, the ACS Board of Directors adopted safety as one of the Society s core values, thus affirming that the
8 th Arctic Regional Hydrographic Commission Meeting September 2018, Longyearbyen, Svalbard Norway
 8 th Arctic Regional Hydrographic Commission Meeting 11-13 September 2018, Longyearbyen, Svalbard Norway Status Report of the Arctic Regional Marine Spatial Data Infrastructures Working Group (ARMSDIWG)
TERMS OF REFERENCE CONSULTANCY TO DEVELOP CLIMATE PRODUCTS AND SERVICES FOR THE CARIBBEAN TOURISM INDUSTRY (FEASIBILITY STUDY)
") Appendix 2 TERMS OF REFERENCE CONSULTANCY TO DEVELOP CLIMATE PRODUCTS AND SERVICES FOR THE CARIBBEAN TOURISM INDUSTRY (FEASIBILITY STUDY) 1. BACKGROUND 1.01 The Caribbean tourism product depends largely
Appendix 2 TERMS OF REFERENCE CONSULTANCY TO DEVELOP CLIMATE PRODUCTS AND SERVICES FOR THE CARIBBEAN TOURISM INDUSTRY (FEASIBILITY STUDY) 1. BACKGROUND 1.01 The Caribbean tourism product depends largely
PUBLIC SAFETY POWER SHUTOFF POLICIES AND PROCEDURES
 PACIFIC GAS AND ELECTRIC COMPANY PUBLIC SAFETY POWER SHUTOFF POLICIES AND PROCEDURES SEPTEMBER 2018 1 PACIFIC GAS AND ELECTRIC COMPANY PUBLIC SAFETY POWER SHUTOFF POLICIES AND PROCEDURES SEPTEMBER 2018
SOUTHERN CLIMATE MONITOR
 SOUTHERN CLIMATE MONITOR MARCH 2011 VOLUME 1, ISSUE 3 IN THIS ISSUE: Page 2 to 4 Severe Thunderstorm Climatology in the SCIPP Region Page 4 Drought Update Page 5 Southern U.S. Precipitation Summary for
Enhancing Weather Information with Probability Forecasts. An Information Statement of the American Meteorological Society
 Enhancing Weather Information with Probability Forecasts An Information Statement of the American Meteorological Society (Adopted by AMS Council on 12 May 2008) Bull. Amer. Meteor. Soc., 89 Summary This
Key Steps for Assessing Mission Critical Data for An ebook by Geo-Comm, Inc.
 Key Steps for Assessing Mission Critical Data for 9-1-1 An ebook by Geo-Comm, Inc. If you re reading this, you probably understand transitioning to Next Generation 9-1-1 (NG9-1-1) means your Geographic
50 th GEF Council Meeting June 07 09, 2016 Washington, D.C. GEF/C.50/Inf.07 May 11, 2016 PROGRESS REPORT ON THE GENDER EQUALITY ACTION PLAN
 50 th GEF Council Meeting June 07 09, 206 Washington, D.C. GEF/C.50/Inf.07 May, 206 PROGRESS REPORT ON THE GENDER EQUALITY ACTION PLAN TABLE OF CONTENTS Background on the Gender Equality Action Plan (GEAP)...
Copernicus Relays. Roles and responsibilities of the Copernicus Relays. user uptake
 Copernicus Relays user uptake Roles and responsibilities of the Copernicus Relays The European Commission has launched two Networks, the Copernicus Relays and the Copernicus Academy, to contribute to spreading
Briefing. H.E. Mr. Gyan Chandra Acharya
 Briefing by H.E. Mr. Gyan Chandra Acharya Under-Secretary-General and High Representative for the Least Developed Countries, Landlocked Developing Countries and Small Island Developing States Briefing
2014 Annual Mitigation Plan Review Meeting
 2014 Annual Mitigation Plan Review Meeting Highland County EMA MEETING OBJECTIVES Understand Your Natural Disaster Risk Review of Previous Plans Current Plan Status Future Activity Plan/Needs of Each Community
The History and Making of the U.S. Drought Monitor
 The History and Making of the U.S. Drought Monitor Mike Hayes, Director Mark Svoboda, Climatologist/Monitoring Program Area Leader Kelly Smith, Communications Specialist National Drought Mitigation Center
FINDINGS OF THE ARCTIC METEOROLOGY SUMMIT
 FINDINGS OF THE ARCTIC METEOROLOGY SUMMIT 2018 WWW.FMI.FI CHAIR S SUMMARY: 1 2 3 We need to be curious to explore the known unknowns. Meteorology is an elemental part of international collaboration in
INTEGRATING GEOSPATIAL PERSPECTIVES IN THE ANTHROPOLOGY CURRICULUM AT THE UNIVERSITY OF NEW MEXICO (UNM)
") INTEGRATING GEOSPATIAL PERSPECTIVES IN THE ANTHROPOLOGY CURRICULUM AT THE UNIVERSITY OF NEW MEXICO (UNM) VERONICA ARIAS HEATHER RICHARDS JUDITH VAN DER ELST DEPARTMENT OF ANTHROPOLOGY MARCH 2005 INTEGRATING
INTEGRATING GEOSPATIAL PERSPECTIVES IN THE ANTHROPOLOGY CURRICULUM AT THE UNIVERSITY OF NEW MEXICO (UNM) VERONICA ARIAS HEATHER RICHARDS JUDITH VAN DER ELST DEPARTMENT OF ANTHROPOLOGY MARCH 2005 INTEGRATING
NIDIS Intermountain West Drought Early Warning System October 17, 2017
 NIDIS Drought and Water Assessment NIDIS Intermountain West Drought Early Warning System October 17, 2017 Precipitation The images above use daily precipitation statistics from NWS COOP, CoCoRaHS, and
WMO Public Weather Services: Enhanced Communication Skills for Improved Service Delivery. by S.W. Muchemi (WMO)
") WMO Public Weather Services: Enhanced Communication Skills for Improved Service Delivery by S.W. Muchemi (WMO) Functions of the Public Weather Services (PWS) programme of WMO To strengthen the capabilities
WMO Public Weather Services: Enhanced Communication Skills for Improved Service Delivery by S.W. Muchemi (WMO) Functions of the Public Weather Services (PWS) programme of WMO To strengthen the capabilities
NATIONAL HYDROPOWER ASSOCIATION MEETING. December 3, 2008 Birmingham Alabama. Roger McNeil Service Hydrologist NWS Birmingham Alabama
 NATIONAL HYDROPOWER ASSOCIATION MEETING December 3, 2008 Birmingham Alabama Roger McNeil Service Hydrologist NWS Birmingham Alabama There are three commonly described types of Drought: Meteorological drought
Hudson River Estuary Climate Change Lesson Project. Grades 5-8 Teacher s Packet. Lesson 2. Observing Changes at Mohonk Preserve
 Grades 5-8 Teacher s Packet Lesson 2 Observing Changes at Mohonk Preserve 2 Observing Changes at Mohonk Preserve NYS Intermediate Level Science Standard 1: Analysis, Inquiry and Design/Scientific Inquiry
Dec 2015 & Jan Dear CoCoRaHS Observer,
 ISA & CoCoRaHS Condition Monitoring Newsletter - Dec 2015 & Jan... 1 of 12 1/25/2016 4:34 PM Click this link to open the e-mail in a browser. Click here Dec 2015 & Jan 2016 In This Issue Climate Update
Economic and Social Council
 United Nations Economic and Social Council Distr.: General 18 July 2016 Original: English Committee of Experts on Global Geospatial Information Management Sixth session New York, 3-5 August 2016 Item 2
Summary of SARP Kickoff Workshop 10/1/ /2/2012
 Summary of SARP Kickoff Workshop 10/1/2012-10/2/2012 On October 1 st a kickoff meeting for the Integrating Climate Forecasts and Reforecasts into Decision Making SARP project was held in Salt Lake City
CARIWIN Regional Seminar January 14-15, 2010, Georgetown, Guyana
 Creating the North American Drought Monitor Angel (Bennett) McCoy Angel.M.Bennett@noaa.gov NOAA/Climate Prediction Center Camp Springs, Maryland, U.S.A. Doug LeComte NOAA/Climate Prediction Center Richard
NIDIS Intermountain West Drought Early Warning System November 21, 2017
 NIDIS Drought and Water Assessment NIDIS Intermountain West Drought Early Warning System November 21, 2017 Precipitation The images above use daily precipitation statistics from NWS COOP, CoCoRaHS, and
Himawari-8 BUFR Development for Winds Processing and Radiances Cloud Mask, Cloud Phase, Cloud Height
 Sandy Supplemental Grant Recipient Quarterly Progress Report Himawari-8 BUFR Development for Winds Processing and Radiances Award Number: NA14NES4830006 The National Oceanic and Atmospheric Administration
A Regional Database Tracking Fire Footprint Each Year within the South Atlantic Region: Current Database Description and Future Directions
 A Regional Database Tracking Fire Footprint Each Year within the South Atlantic Region: Current Database Description and Future Directions Last Updated on September 30, 2018 Contributors: NatureServe,
Citizen Science Networks
 LIVE INTERACTIVE LEARNING @ YOUR DESKTOP Citizen Science Networks Presented by: Henry Reges and James Zdrojewski October 12, 2011 CoCoRaHS Because every drop counts What is CoCoRaHS? An overview CoCoRaHS
The U.S. Drought Monitor: A Composite Indicator Approach
 The U.S. Drought Monitor: A Composite Indicator Approach Mark Svoboda, Climatologist Monitoring Program Area Leader National Drought Mitigation Center University of Nebraska-Lincoln NWS IN Climate Services
Himawari-8 BUFR Development for Winds Processing and Radiances - Packaging for Algorithm Integration Team (AIT)
") Sandy Supplemental Grant Recipient Quarterly Progress Report Himawari-8 BUFR Development for Winds Processing and Radiances - Packaging for Algorithm Integration Team (AIT) Award Number: NA14NWS4830052
Sandy Supplemental Grant Recipient Quarterly Progress Report Himawari-8 BUFR Development for Winds Processing and Radiances - Packaging for Algorithm Integration Team (AIT) Award Number: NA14NWS4830052
Economic and Social Council 2 July 2015
 ADVANCE UNEDITED VERSION UNITED NATIONS E/C.20/2015/11/Add.1 Economic and Social Council 2 July 2015 Committee of Experts on Global Geospatial Information Management Fifth session New York, 5-7 August
NIDIS Intermountain West Drought Early Warning System September 4, 2018
 NIDIS Drought and Water Assessment NIDIS Intermountain West Drought Early Warning System September 4, 2018 Precipitation The images above use daily precipitation statistics from NWS COOP, CoCoRaHS, and
Outline National legislative & policy context Regional history with ESSIM ESSIM Evaluation Phase Government Integration via RCCOM Regional ICOM Framew
 What MSP Implementation could change in the Maritimes Region Tim Hall, Regional Manager Oceans and Coastal Management Division Ecosystem Management Branch Fisheries and Oceans Canada Maritimes Region BIO
Community Collaborative Rain, Hail & Snow Network
 Community Collaborative Rain, Hail & Snow Network NWS Gray and Matt Spies September 2016 Hello Observers! This is the first edition of a newsletter that we will be sending out to our current CoCoRaHS observers.
Weather Permitting/Meteorology. North Carolina Science Olympiad Coaches Clinic October 6, 2018 Michelle Hafey
 Weather Permitting/Meteorology North Carolina Science Olympiad Coaches Clinic October 6, 2018 Michelle Hafey hafeym@uncw.edu Read the Rules Weather Permitting Division A Team Of Up To: 2 Bring writing
Meteorological instruments and observations methods: a key component of the Global Earth Observing System of Systems (GEOSS)
") GLOBAL OBSERVING SYSTEMS Instruments and Methods of Observation Programme Meteorological instruments and observations methods: a key component of the Global Earth Observing System of Systems (GEOSS) Dr.
GLOBAL OBSERVING SYSTEMS Instruments and Methods of Observation Programme Meteorological instruments and observations methods: a key component of the Global Earth Observing System of Systems (GEOSS) Dr.
GIS in Weather and Society
 GIS in Weather and Society Olga Wilhelmi Institute for the Study of Society and Environment National Center for Atmospheric Research WAS*IS November 8, 2005 Boulder, Colorado Presentation Outline GIS basic