Comparative analysis of data collected by installed automated meteorological stations and manual data in Central Asia.
|
|
|
- Anne Cannon
- 6 years ago
- Views:
Transcription
1 Comparative analysis of data collected by installed automated meteorological stations and manual data in Central Asia. Merkushkin Aleksandr Uzhydromet 71 K. Makhsumov str., Tashkent, Uzbekistan Tel: (998) Fax: (998)
2 Abstract Critical water management within the five central Asian republics (CAR) requires access to reliable climate and hydrological data. As part of the effort to strengthen transboundary water resources management within the region, the US Agency for International Development s (USAID) Natural Resources Management Program (NRMP) funded a pilot automated climate data collection network. Sixteen automated weather stations (AWS) were installed within Tajikistan, Kyrgyzstan, Kazakhstan, Uzbekistan and Turkmenistan during the period from February 2002 to September Ease of use, low operational cost, suitability for remote unmanned operation, proven reliable collection of high quality data and capability to electronically store and transfer data are the primary reasons for utilizing automated climate monitoring instrumentation. Most of these stations use the USAID sponsored meteor burst radio communications to provide real time data telemetry and acquisition. This automated data collection and telemetry system was the first of its kind deployed within the region. The national Hydromet service (NHS) within the CAR had little experience with this technology. Two key objectives of the program was to demonstrate the utility for remote automated deployment as well as allow for simultaneous operation with familiar manual monitoring. Eight of the stations were installed at operational climate stations that were staffed by NHS observers. This рresentation provides the results of the comparative analysis from some of the simultaneous measurements.

3 Incomplete picture on spatial coverage the territory of Central Asia with automated weather stations

4 All automated weather stations (AWS) installed in Central Asia talk via Meteor Burst Communication System except AWS installed in Uzbekistan

5 Spatial coverage the territory of Uzbekistan with manual and automated weather stations (only 7 of 78 meteorological stations are automated ones)
6

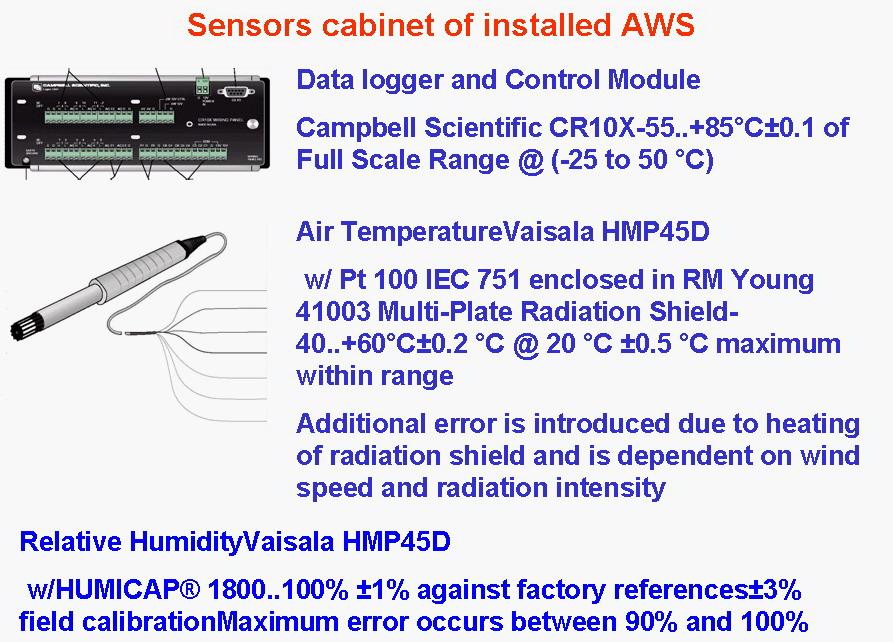
7 Sensors cabinet of installed AWS Atmospheric PressureVaisala PTB100 Analog Barometer mb ± C±6 mb maximum within C range. Measures absolute pressure and uses equation to calculate pressure at sea-level Wind Speed and Direction RM Young Wind Speed0..60 m/sgust survival 100 m/s±0.3 m/swind Direction ±3


8 Sensors cabinet of installed AWS Solar RadiationKipp & Zonen CM W/m2±10% for daily sums.second Class thermopile type pyranometer Standard ISO Precipitation (Rainfall)Texas Electronics 525M Tipping Bucket Rain Gauge0.1 mm resolution1.0% < 25 mm/hr+0..-3% mm/hr+0..-5% mm/hrnot suitable for measurement of snow. Heated tipping bucket rain gauges are not recommended by WMO.

9 Sensors cabinet of installed AWS Ground TemperatureCSI T-107/8 ThermistorT-107: C ±0.4 C for range of C T-108: C ±0.3 C for range of CSensitive to solar radiation heating when sensor exposed to sunlight Snow Water Equivalent3 meter Hypalon Snow Pillow w/ Druck 1230 Pressure Transducer. 7 m H 2 O. 2 cm H 2 O resolution Extremely sensitive to placement. May be under representative because of snow bridging.
10 AWS installed performance rates Station Start of Record End of Record Performance Parameters Almaty 21-Sep Dec % 3 hr Air temp, Rh, Air Pressure 24hr Max. and Min Air Temp, Precipitation Bishkek 18-Jun Dec % 3 hr Air temp, Rh, Air Pressure 24hr Max. and Min Air Temp, Precipitation Tashkent 13-Sep Nov % 3 hr Air temp, Rh, Air Pressure 24hr Max. and Min Air Temp, Precipitation Naryn 15-Sep Dec % 24hr Max. and Min Air Temp, Precipitation
11 AWS vs manual data comparison for daily and monthly calculations based on standard differences 3 hour Temperature (degree C) Station AWS Manual Std. Diff. Almaty Bishkek Tashkent hour Relative Humidity (percent) Station AWS Manual Std. Diff. Almaty Bishkek Tashkent hour Atmospheric Pressure (mbar) Station AWS Manual Std. Diff. Almaty Bishkek Tashkent
12 AWS vs manual data comparison for daily and monthly calculations based on standard differences Maximum Temperature (degree C) Station Almaty Bishkek Naryn Tashkent AWS Manual Std. Diff Minimum Temperature (degree C) Station AWS Manual Almaty Bishkek Naryn Tashkent Std. Diff

13 AWS vs manual data comparison for daily and monthly calculations based on standard differences Month AWS Almaty Manual Error 100% 99% 69% 19% 5% 6% 6% 18% 4% 15% 59% 100%

14 AWS vs manual data comparison for daily and monthly calculations based on standard differences Month AWS Bishkek Manual Error 11% 15% 11% 10% 8% 10% 8% 38% 6% 4% 9% 30%

15 AWS vs manual data comparison for daily and monthly calculations based on standard differences Month AWS Naryn Manual Error 57% 5% 14% 4% 7% 5% 4% 20% 15% 4% 17% 41%
16 AWS vs manual data comparison for daily and monthly calculations based on standard differences Month AWS Tashkent Manual Error 70% 9% 8% 16% 10% 12% 3% 18% 25% 19% 27% 18%
17 AWS vs manual data comparison for 3 hours and daily measurements based on T and F tests (air temperature) Manual measurements Air temperature measured at 03:00 UTC y = x R 2 = manual Sensor measurements sens Dif man 43.8 Dis sen manual Ratio 1.02 sens T 0.67 F 0.91 Dif. mean Manual measurements Dis man Air temperature measured at 03:00 UTC (wood box) Dis sen 83.9 y = 1.008x R 2 = Dis Ratio T Sensor measurements F 0.63
18 AWS vs. manual data comparison for 3 hours and daily measurements based on T and F tests (air temperature) Air temperature measured at 09:00 UTC 36 manual sens. Dif. mean Man. Sens. Ratio T F Manual measurements y = x R 2 = manual sens Sensor measurements Dif. mean 0.03 Man sens Ratio T F Manual measurements Air temperature measured at 09:00 UTC (wood box) y = x R 2 = Sensor measurements 0.98
19 AWS vs manual data comparison for 3 hours and daily measurements based on T and F tests (air temperature) Manual measurements Air temperature measured at 15:00 UTC y = 1.011x R 2 = manual Sensor measurements sens Dif. mean 0.20 Man Sens manual Ratio 1.00 sens T 0.77 Dif. mean 0.60 F 0.98 Man 84.3 Manual measurements Sens Air temperature measured at 15:00 UTC (wood box) Ratio 1.03 y = x R 2 = Sensor measurements T F

20 AWS vs. manual data comparison for 3 hours and daily measurements based on T and F tests (air temperature) Air temperature measured at 21:00 UTC 36 manual sens Dif. mean Man Sens. Disp. Ratio T F Manual measurements y = x R 2 = Sensor measurements Air temperature measured at 21:00 UTC (wood box) 32 manual sens Dif. mean Man Sens. Ratio T F Manual measurements y = x R 2 = Sensor measurements
21
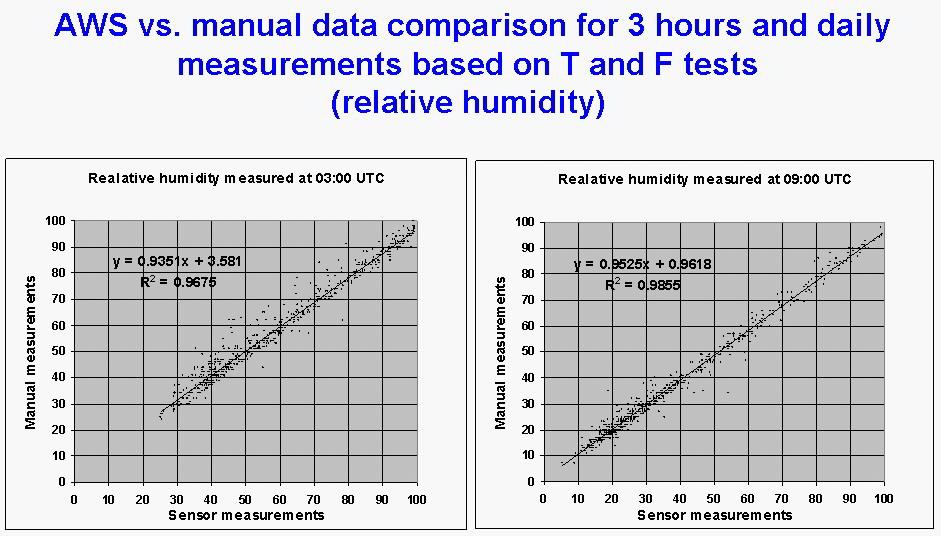
22 AWS vs. manual data comparison for 3 hours and daily measurements based on T and F tests (relative humidity) Realative humidity measured at 15:00 UTC Realative humidity measured at 21:00 UTC Manual measurements y = 0.929x R 2 = Manual measurements y = x R 2 = Sensor measurements Sensor measurements
23 AWS vs manual data comparison for 3 hours and daily measurements based on T and F tests (relative humidity) Time manual sens. Dif. mean Disp. Man Disp. sensor Disp. Ratio T F
24 AWS vs manual data comparison for 3 hours and daily measurements based on T and F tests (Barometric pressure) Barometric pressure measured at 09:00 UTC Barometric pressure measured at 21:00 UTC Manual measurements y = x R 2 = Manual measurements y = 0.986x R 2 = Sensor measurements Sensor measurements
25 AWS vs manual data comparison for 3 hours and daily measurements based on T and F tests (Barometric pressure) Time manual sens. Dif. mean Disp. Man Disp. sensor Disp. Ratio T F


26 AWS vs manual data comparison for 3 hours and daily measurements based on T and F tests (daily totalized liquid precipitation) Differences Min Max Averaged Ttest Ftest
27 Conclusions 1.Only daily averaged measurements by sensors look like as confident in terms of statistically proven homogeneity in respect to manual data series 2.Data come from sensors with 3 hours resolution cannot be merged to the manual data series as being a replenishment of that data series without adequate data processing because the risk of heterogeneity 3.Variance sensor data-manual data can be minimized via mitigation the ambient influences
Figure 1. Daily variation of air temperature
 Comparative analysis of the meteorological data acquired on standard equipment and by automatic weather station of CAMPBELL SCIENTIFIC, INC Company Kudekov T.K. Director-General of the KAZHYDROMET 050022
UWM Field Station meteorological data
 University of Wisconsin Milwaukee UWM Digital Commons Field Station Bulletins UWM Field Station Spring 992 UWM Field Station meteorological data James W. Popp University of Wisconsin - Milwaukee Follow
Quality assurance for sensors at the Deutscher Wetterdienst (DWD)
") Quality assurance for sensors at the Deutscher Wetterdienst (DWD) Quality assurance / maintenance / calibration Holger Dörschel, Dr Tilman Holfelder WMO International Conference on Automatic Weather Stations
Quality assurance for sensors at the Deutscher Wetterdienst (DWD) Quality assurance / maintenance / calibration Holger Dörschel, Dr Tilman Holfelder WMO International Conference on Automatic Weather Stations
Comparison of meteorological data from different sources for Bishkek city, Kyrgyzstan
 Comparison of meteorological data from different sources for Bishkek city, Kyrgyzstan Ruslan Botpaev¹*, Alaibek Obozov¹, Janybek Orozaliev², Christian Budig², Klaus Vajen², 1 Kyrgyz State Technical University,
Memo. I. Executive Summary. II. ALERT Data Source. III. General System-Wide Reporting Summary. Date: January 26, 2009 To: From: Subject:
 Memo Date: January 26, 2009 To: From: Subject: Kevin Stewart Markus Ritsch 2010 Annual Legacy ALERT Data Analysis Summary Report I. Executive Summary The Urban Drainage and Flood Control District (District)
Development of Innovative Technology to Provide Low-Cost Surface Atmospheric Observations in Data-sparse Regions
 Development of Innovative Technology to Provide Low-Cost Surface Atmospheric Observations in Data-sparse Regions Paul Kucera and Martin Steinson University Corporation for Atmospheric Research/COMET 3D-Printed
WEATHER STATION FOR SOLAR FARM MONITORING
 WEATHER STATION FOR SOLAR FARM MONITORING SOLAR FARM MONITORING SYSTEM: Measures global, horizontal, & background irradiance. Measures wind speed, wind direction, ambient temperature, and relative humidity.
Applications. Remote Weather Station with Telephone Communications. Tripod Tower Weather Station with 4-20 ma Outputs
 Tripod Tower Weather Station with 4-20 ma Outputs Remote Weather Station with Telephone Communications NEMA-4X Enclosure with Two Translator Boards and Analog Barometer Typical Analog Output Evaporation
Vermont Soil Climate Analysis Network (SCAN) sites at Lye Brook and Mount Mansfield
 sites at Lye Brook and Mount Mansfield") Vermont Soil Climate Analysis Network (SCAN) sites at Lye Brook and Mount Mansfield 13 Years of Soil Temperature and Soil Moisture Data Collection September 2000 September 2013 Soil Climate Analysis Network
Vermont Soil Climate Analysis Network (SCAN) sites at Lye Brook and Mount Mansfield 13 Years of Soil Temperature and Soil Moisture Data Collection September 2000 September 2013 Soil Climate Analysis Network
McArthur River Mining Borroloola Caravan and Devils Spring Stations
 Borroloola Caravan and Devils Spring Ambient Air Quality Monitoring Validated Report 1 st July 2016 31 st July 2016 Report No.: DAT10991 Report issue date: 25 th August 2016 Maintenance contract: MC1100,
Recent Improvement of Integrated Observation Systems in JMA
 Recent Improvement of Integrated Observation Systems in JMA Mr Osamu Suzuki and Mr Yoshihiko Tahara Japan Meteorological Agency 1-3-4 Otemachi, Chiyoda-ku, Tokyo 100-8122, Japan Tel: +81-3-3212-8341, Fax:
Quality Assurance and Quality Control
 Quality Assurance and Quality Control of Surface Observations in JMA Japan Meteorological Agency Hakaru MIZUNO "Guide to Meteorological Instruments and Methods of Observation", WMO-No.8, 7th ed., 2008.
SASKATOON STATION
 Day Max Max 1981-1 Temperature Degree-days Precipitation Min Min 1981-1 Mean Mean 1981-1 Growing Heating Cooling Weighing Gauge base 18 base 18 base Comments Preliminary DECEMBER 17 Snow-on- Ground 9h
AWOS. Automated Weather Observing Systems COASTAL
 AWOS Automated Weather Observing Systems COASTAL Environmental Systems Monitor Monitor Your Your World World Coastal s Experience & Expertise Since 1981, Coastal Environmental Systems, Inc. (Coastal) has
Meteorological Service
 Meteorological Service The Meteorological Service in Oman was established in 1973. Oman joined ICAO in 1973 Oman joined WMO in 1975. Meteorological Service is under the framework of the Directorate General
Introductions to RIC-Beijing. NAN Xuejing, CUI Xiai Meteorological Observation Center China Meteorological Administration March,2018
 Introductions to RIC-Beijing NAN Xuejing, CUI Xiai China Meteorological Administration March,2018 Contents 1. China Meteorological Administration (CMA) Organization 2. (MOC) Functional Structure Responsibilities
Technical Report DMI SYNOP AWS Summit. Data status March Ellen Vaarby Laursen. SYNOP weather station Summit.
 10-09 DMI SYNOP AWS 04416 Summit. Data status March 2010. Ellen Vaarby Laursen SYNOP weather station 04416 Summit Picture Taken: 2007:06:20 16:16:11 Picture Taken: 2009:07:09 08:22:51 Copenhagen 2010 www.dmi.dk/dmi/tr
Hydrological change in the. regions of Central Asia
 Hydrological change in the mountainous and downstream regions of Central Asia Alexander I. Shiklomanov Water Systems Analysis Group University of New Hampshire International Workshop on the Northern Eurasia
1 Introduction. Station Type No. Synoptic/GTS 17 Principal 172 Ordinary 546 Precipitation
 Use of Automatic Weather Stations in Ethiopia Dula Shanko National Meteorological Agency(NMA), Addis Ababa, Ethiopia Phone: +251116639662, Mob +251911208024 Fax +251116625292, Email: Du_shanko@yahoo.com
APPENDIX 3.6-A Support Information for Newcastle, Wyoming Meteorological Monitoring Site
 APPENDIX 3.6-A Support Information for Newcastle, Wyoming Meteorological Monitoring Site September 2012 3.6-A-i Appendix 3.6-A This page intentionally left blank September 2012 Appendix 3.6-A APPENDIX
Product Description. 1 of 6
 Product Description The 6250 Vantage Vue Wireless Weather Station provides accurate, reliable weather monitoring in a self-contained, easy-to-install system. Designed to provide the weather data you need
LOG_aLevel. Tsunami Warning System
 LOG_aLevel Tsunami Warning System General Acoustics e.k. Am Kiel-Kanal 1 24106 Kiel Germany Phone: +49 431 5 80 81 80 www.generalacoustics.com Info@generalacoustics.com LOG_aLevel Tsunami Warning System
SU solar resource measurement station: Sonbesie metadata
 SU solar resource measurement station: Sonbesie metadata Date: 30 July 2013 Introduction A solar resource measurement station, known as Sonbesie, has been installed at Stellenbosch University. The system
for JMA/WMO Training Workshop on CALIBRATION AND MAINTENANCE OF METEOROLOGICAL INSTRUMENTS
 for JMA/WMO Training Workshop on CALIBRATION AND MAINTENANCE OF METEOROLOGICAL INSTRUMENTS in RA II (ASIA) 0. Overview of JMA 3 4 1. Surface observation station 5-8 2. Instruments in operational use 9-14
Scientific component of Berlin Process (CAWa Project)
") Regional Research Network Central Asian Water Scientific component of Berlin Process (CAWa Project) Almas Kitapbayev, Abror Gafurov, Sarah Schönbrodt-Stitt, Lars Gerlitz Tashkent, 24.11.2017 CAWa Project
Regional Research Network Central Asian Water Scientific component of Berlin Process (CAWa Project) Almas Kitapbayev, Abror Gafurov, Sarah Schönbrodt-Stitt, Lars Gerlitz Tashkent, 24.11.2017 CAWa Project
MaxiMet. Compact Weather Stations. gillinstruments.com
 MaxiMet Compact Weather Stations gillinstruments.com Compact Weather Stations MaxiMet is an advanced compact weather station, designed and manufactured by Gill Instruments using proven technology to measure
Country Report for Japan (Submitted by Kenji Akaeda, Japan Meteorological Agency)
") Japan JMA/WMO Workshop on Quality Management in Surface, Climate and Upper-air Observations in RA II (Asia) Tokyo, Japan 27 30 July 2010 Doc. Japan (10.VII.2010) Country Report for Japan (Submitted by
Japan JMA/WMO Workshop on Quality Management in Surface, Climate and Upper-air Observations in RA II (Asia) Tokyo, Japan 27 30 July 2010 Doc. Japan (10.VII.2010) Country Report for Japan (Submitted by
Intercomparision of snowfall measured by weighing and tipping bucket precipitation gauges at Jumla Airport, Nepal
 Intercomparision of snowfall measured by weighing and tipping bucket precipitation gauges at Jumla Airport, Nepal Department of Hydrology and Meteorology, Nepal Ministry of Environment, Science and Technology
SASKATOON STATION
 Day Max Max 191-1 Temperature Degree-days Precipitation Min Min 191-1 Mean Mean 191-1 Growing Heating Cooling 1 1 Geonor Weighing Gauge Notes Preliminary OCTOBER 17 Snow-on- Ground 9h Max ½ hr Min ½ hr
Quality assurance for sensors at the Deutscher Wetterdienst (DWD)
") Paper submitted to ICAWS 2017: Topic 3 Sustainability of the measurements: Calibration, intercomparisons, laboratory and field performance tests, quality assurance and control assessment for traceable
Paper submitted to ICAWS 2017: Topic 3 Sustainability of the measurements: Calibration, intercomparisons, laboratory and field performance tests, quality assurance and control assessment for traceable
Wali Ullah Khan Pakistan Meteorological Department
 An overview of Weather Observation practices over Pakistan By Wali Ullah Khan Pakistan Meteorological Department JMA/WMO TRAINING WORKSHOP ON CALIBRATION AND MAINTENANCE OF METEOROLOGICAL INSTRUMENTS IN
AUTOMATION OF OBSERVING NETWORK IN BMKG
 Agency for Meteorology, Climatology, and Geophysics of the Republic of Indonesia AUTOMATION OF OBSERVING NETWORK IN BMKG Agung Saifulloh Majid, G.S. Budhi Dharmawan, Damianus Tri Heryanto, Untung Merdijanto
Use of geo-referenced data for DRM in Central Asia, problems and prospective
 Use of geo-referenced data for DRM in Central Asia, problems and prospective Dr. Akylbek Chymyrov Director, Kyrgyz Center of Geoinformation Systems Member of the Public Supervisory Board MES KR KSUCTA,
TRMM Multi-satellite Precipitation Analysis (TMPA)
") TRMM Multi-satellite Precipitation Analysis (TMPA) (sometimes known as 3B42/43, TRMM product numbers) R. Adler, G. Huffman, D. Bolvin, E. Nelkin, D. Wolff NASA/Goddard Laboratory for Atmospheres with key
TRMM Multi-satellite Precipitation Analysis (TMPA) (sometimes known as 3B42/43, TRMM product numbers) R. Adler, G. Huffman, D. Bolvin, E. Nelkin, D. Wolff NASA/Goddard Laboratory for Atmospheres with key
Series tore word. Acknowledgements
 Series tore word p. xi Preface p. xiii Acknowledgements p. xv Disclaimer p. xvii Introduction p. 1 The instrumental age p. 2 Measurements and the climate record p. 2 Clouds and rainfall p. 3 Standardisation
CIMIS. California Irrigation Management Information System
 CIMIS California Irrigation Management Information System What is CIMIS? A network of over 130 fully automated weather stations that collect weather data throughout California and provide estimates of
Be relevant and effective thinking beyond accuracy and timeliness
 The Fourth Technical Conference on the Management of Meteorological and Hydrological Services in WMO RA II (Asia) Be relevant and effective thinking beyond accuracy and timeliness C. Y. LAM Hong Kong Observatory
Antarctic Automatic Weather Station Data for the calendar year 2000
 Antarctic Automatic Weather Station Data for the calendar year 2000 by Linda M. Keller George A. Weidner Charles R. Stearns Matthew T. Whittaker Robert E. Holmes Matthew A. Lazzara Space Science and Engineering
SOUTH MOUNTAIN WEATHER STATION: REPORT FOR QUARTER 2 (APRIL JUNE) 2011
 2011") SOUTH MOUNTAIN WEATHER STATION: REPORT FOR QUARTER 2 (APRIL JUNE) 2011 Prepared for ESTANCIA BASIN WATERSHED HEALTH, RESTORATION AND MONITORING STEERING COMMITTEE c/o CLAUNCH-PINTO SOIL AND WATER CONSERVATION
SOUTH MOUNTAIN WEATHER STATION: REPORT FOR QUARTER 2 (APRIL JUNE) 2011 Prepared for ESTANCIA BASIN WATERSHED HEALTH, RESTORATION AND MONITORING STEERING COMMITTEE c/o CLAUNCH-PINTO SOIL AND WATER CONSERVATION
World Meteorological Organization
 World Meteorological Organization CIMO/WIGOS EXPLORATORY WORKSHOP: IMPROVING SURFACE-BASED DATA QUALITY THOUGH IMPROVED STANDARDIZATION OF PRACTICES AND PROCEDURES Langen, Germany, 5-3 December 2014 Regional
CoCoRaHS Monitoring Colorado s s Water Resources through Community Collaborations
 CoCoRaHS Monitoring Colorado s s Water Resources through Community Collaborations Nolan Doesken Colorado Climate Center Atmospheric Science Department Colorado State University Presented at Sustaining
OverviewofRIC Tsukuba (Japan,RAII )
") OverviewofRIC Tsukuba (Japan,RAII ) 7Nov.2016 Hiroshi Yoshimura Scientific Officer Regional Instrument Centre Tsukuba Observing Division, Observing Department Outline 1. WMO Regional Instrument Center
OverviewofRIC Tsukuba (Japan,RAII ) 7Nov.2016 Hiroshi Yoshimura Scientific Officer Regional Instrument Centre Tsukuba Observing Division, Observing Department Outline 1. WMO Regional Instrument Center
Low Cost Weather Stations for Developing Countries (Kenya)
") Low Cost Weather Stations for Developing Countries (Kenya) Charles Mwangi Kenya Space Agency 7 th UNSPIDER Conference 23th-25th October 2017 Prepared with support of: Martin Steinson/Paul Kucera - UCAR/NCAR
Low Cost Weather Stations for Developing Countries (Kenya) Charles Mwangi Kenya Space Agency 7 th UNSPIDER Conference 23th-25th October 2017 Prepared with support of: Martin Steinson/Paul Kucera - UCAR/NCAR
BIAN ZEQIANG Senior Engineer National Center for Meteorological Metrology Meteorological Observation Cent China Meteorological Administration
 Introduction of RIC-Beijing BIAN ZEQIANG Senior Engineer National Center for Meteorological Metrology Meteorological Observation Cent China Meteorological Administration Outline 1. China Meteorology Administration
Observing Weather: Making the Invisible Visible. Dr. Michael J. Passow
 Observing Weather: Making the Invisible Visible Dr. Michael J. Passow What Is Weather? Weather refers to the conditions of the atmosphere at a certain place and time. Weather differs from Climate, which
Climatography of the United States No
 Climate Division: AK 5 NWS Call Sign: ANC Month (1) Min (2) Month(1) Extremes Lowest (2) Temperature ( F) Lowest Month(1) Degree s (1) Base Temp 65 Heating Cooling 90 Number of s (3) Jan 22.2 9.3 15.8
Available data and products for Agricultural purpose at the National Meteorological Agency of Ethiopia
 Available data and products for Agricultural purpose at the National Meteorological Agency of Ethiopia NSF-PIRE KICKOFF CONFERENCE, JULY 11-12 DELANO HOTEL, BAHIR DAR By Melesse Lemma National Meteorological
Introduction to Climatology. GEOG/ENST 2331: Lecture 1
 Introduction to Climatology GEOG/ENST 2331: Lecture 1 Us! Graham Saunders (RC 2006C) graham.saundersl@lakeheadu.ca! Jason Freeburn (RC 2004) jtfreebu@lakeheadu.ca Graham Saunders! Australian Weather Bureau!
LEA_EN_TEM Weather Sensors. Instruments and Systems for Geotechnical and Structural Monitoring
 LEA_EN_TEM0001001 Weather Sensors LEA_EN_TEM0001001 Weather Sensors Description _ Pizzi Instruments offers a wide range of instruments for meteorological and environmental monitoring to be integrated into
Report on cryosphere related activity in Uzbekistan.
 Report on cryosphere related activity in Uzbekistan. CryoNet Asia Workshop (The second Session) Salekhard, 2 5 February 2016 Klimentiy Valiev Centre of Hydrometeorological Service at Cabinet of Ministers
2000 LOCAL CLIMATOLOGICAL DATA Annual Summary with Comparative Data
 - - Freezing.............. JAN FEB MAR APR MAY JUN JUL AUG EP OC NOV DEC EMPERAURE PRECIPIAION PREURE Fahrenheit Inches Inches of Hg LOCAL CLIMAOLOGICAL DAA Annual ummary with Comparative Data aunton W
2003 Water Year Wrap-Up and Look Ahead
 2003 Water Year Wrap-Up and Look Ahead Nolan Doesken Colorado Climate Center Prepared by Odie Bliss http://ccc.atmos.colostate.edu Colorado Average Annual Precipitation Map South Platte Average Precipitation
Gridding of precipitation and air temperature observations in Belgium. Michel Journée Royal Meteorological Institute of Belgium (RMI)
") Gridding of precipitation and air temperature observations in Belgium Michel Journée Royal Meteorological Institute of Belgium (RMI) Gridding of meteorological data A variety of hydrologic, ecological,
Gridding of precipitation and air temperature observations in Belgium Michel Journée Royal Meteorological Institute of Belgium (RMI) Gridding of meteorological data A variety of hydrologic, ecological,
Interview with Dr. Jaya Singh. 1. How critical is weather monitoring in a solar power plant and what are all the parameters to be monitored?
 Interview with Dr. Jaya Singh Dr. Jaya Singh is an entrepreneur and scientist with experience in a range of industries including biotech, environmental sciences, and agriculture. She currently drives strategy
EVALUATION OF THE ENVIRONMENTAL EFFECTS ON A MEDIUM RISE BUILDING
 7th European Workshop on Structural Health Monitoring July 8-11, 214. La Cité, Nantes, France More Info at Open Access Database www.ndt.net/?id=17121 EVALUATION OF THE ENVIRONMENTAL EFFECTS ON A MEDIUM
WeatherHawk Weather Station Protocol
 WeatherHawk Weather Station Protocol Purpose To log atmosphere data using a WeatherHawk TM weather station Overview A weather station is setup to measure and record atmospheric measurements at 15 minute
Weather Stations. Evaluation copy. 9. Post live weather data on the school s web site for students, faculty and community.
 Weather Stations Computer P6 Collecting and analyzing weather data can be an important part of your Earth Science curriculum. It might even be an ongoing part of your entire course. A variety of activities
Trevor Lee Director, Buildings. Grant Edwards PhD Department of Environment and Geography
 Weather Affects Building Performance Simulation v Monitoring real time solar and coincident weather data for building optimisation and energy management Trevor Lee Director, Buildings Grant Edwards PhD
Questionnaire on Quality Management for Surface Meteorological Observations in Regional Association II (Asia)
") Questionnaire on Quality Management for Surface Meteorological Observations in Regional Association II (Asia) RA II WIGOS Project to Enhance the Availability and Quality of Management Support for NMHSs
Questionnaire on Quality Management for Surface Meteorological Observations in Regional Association II (Asia) RA II WIGOS Project to Enhance the Availability and Quality of Management Support for NMHSs
CLIMATE CHANGE ADAPTATION BY MEANS OF PUBLIC PRIVATE PARTNERSHIP TO ESTABLISH EARLY WARNING SYSTEM
 CLIMATE CHANGE ADAPTATION BY MEANS OF PUBLIC PRIVATE PARTNERSHIP TO ESTABLISH EARLY WARNING SYSTEM By: Dr Mamadou Lamine BAH, National Director Direction Nationale de la Meteorologie (DNM), Guinea President,
LEA_IT_TEM Weather Sensors. Instruments and Systems for Geotechnical and Structural Monitoring
 LEA_IT_TEM0001001 Weather Sensors LEA_IT_TEM0001001 Weather Sensors Description _ Pizzi Instruments offers a wide range of instruments for meteorological and environmental monitoring to be integrated into
NATIONAL HYDROMETEOROLOGICAL SERVICE OF REPUBLIC KAZAKHSTAN
 KAZHYDROMET- NATIONAL HYDROMETEOROLOGICAL SERVICE OF REPUBLIC KAZAKHSTAN ASTANA, 2010 The ministry of preservation of the environment of Republic Kazakhstan The republican State Enterprise «Kazhydromet»
The Kentucky Mesonet: Entering a New Phase
 The Kentucky Mesonet: Entering a New Phase Stuart A. Foster State Climatologist Kentucky Climate Center Western Kentucky University KCJEA Winter Conference Lexington, Kentucky February 9, 2017 Kentucky
CALIBRATION CENTER. Republic of Turkey. Ministry of Forestry and. Water Affairs. Turkish State Meteorological Service.
 Republic of Turkey Ministry of Forest and Water Affairs Republic of Turkey Ministry of Forestry and Water Affairs Turkish State Meteorological Service CALIBRATION CENTER Turkish State Meteorological Service
5.6. Barrow, Alaska, USA
 SECTION 5: QUALITY CONTROL SUMMARY 5.6. Barrow, Alaska, USA The Barrow installation is located on Alaska s North Slope at the edge of the Arctic Ocean in the city of Barrow. The instrument is located in
The Arctic Sea Ice Cover
 The Arctic Sea Ice Cover From the Living Earth Interface, Impediment, Integrator Frozen ocean 8-15 million km 2 Size of U.S. Meters thick Floating, moving ice Highly variable Large albedo Climate change!
Operation and Maintenance of Networking of CAAQM stations at Bangalore and Chennai.
 2014-15 CENTRAL POLLUTION NTROL BOARD ZONAL OFFICE (SOUTH), BENGALURU 560079 Project II-.Scientific & Technical Activities and R & D Operation and Maintenance of Networking of CAAQM stations at Bangalore
Long Term Autonomous Ocean Remote Sensing Utilizing the Wave Glider
 Long Term Autonomous Ocean Remote Sensing Utilizing the Wave Glider J. Griffith, K. VanderLugt, Matt Cosad Liquid Robotics 1329 Moffett Park Drive Sunnyvale, CA 94089 Abstract Rising costs of ship time
The Colorado Climate Center at CSU. residents of the state through its threefold
 The CoAgMet Network: Overview History and How It Overview, Works N l Doesken Nolan D k and d Wendy W d Ryan R Colorado Climate Center Colorado State University First -- A short background In 1973 the federal
2016 Meteorology Summary
 2016 Meteorology Summary New Jersey Department of Environmental Protection AIR POLLUTION AND METEOROLOGY Meteorology plays an important role in the distribution of pollution throughout the troposphere,
Water Resources of Central Asia: Contemporary Status and Future Projections
 Water Resources of Central Asia: Contemporary Status and Future Projections Natalya Agaltseva 1, Alexander Shiklomanov 2 1-Hydrometeorological Research Institute, Uzydromet, Tashkent 2-Water Systems Analysis
The impact of global climate change on natural disasters related to the water
 The impact of global climate change on natural disasters related to the water HOMIDOV ANVAR TAJIKISTAN СГЯ Content Change of temperature and precipitation in Central Asia; Dangerous hydro meteorological
Module 11: Meteorology Topic 3 Content: Weather Instruments Notes
 Introduction In order for meteorologists to accurately predict the weather, they take thousands of different weather measurements each day. Meteorologists need to use many tools in order to draw an accurate
Climatography of the United States No
 Month (1) Min (2) Month(1) Extremes Lowest (2) Temperature ( F) Lowest Month(1) Degree s (1) Base Temp 65 Heating Cooling 100 Number of s (3) 42.6 24.2 33.4 79 1950 25 44.2 1974-16 1994 19 18.8 1977 977
Radar rain gauges new alternative for urban measurement networks. Copyright OTT Hydromet 2018
 Radar rain gauges new alternative for urban measurement networks Stormwater event in the city of Münster July 28 th 2014 4 Ernst Mennerich Stormwater event in the city of Münster July 28 th 2014 5 Ernst
Biases in precipitation records found in parallel measurements
 Biases in precipitation records found in parallel measurements Petr Stepanek (1,2), Enric Aguilar (3), Victor Venema (4), Renate Auchmann (5), Fabricio Daniel dos Santos Silva (6), Erik Engström (7), Alba
The Arable Mark: Accuracy and Applications
 The Arable Mark: Accuracy and Applications January 7, 2018 Overview Physical and Biological Observations Precipitation Air temperature, humidity, pressure Shortwave (SW) radiation (down & upwelling) Longwave
Quality control methodology for temperature data of Automatic Weather Stations with non-wooden radiation shield
 Quality control methodology for temperature data of Automatic Weather Stations with non-wooden radiation shield Eng. Nuwan Kumarasinghe Chief Electronics Engineer Department of Meteorology, Sri Lanka nuwan1960@gmail.com
Climatography of the United States No
 Month (1) Min (2) Month(1) Extremes Lowest (2) Temperature ( F) Lowest Month(1) Degree s (1) Base Temp 65 Heating Cooling 100 Number of s (3) Jan 63.9 39.3 51.6 86 1976 16 56.6 1986 20 1976 2 47.5 1973
Climatography of the United States No
 Temperature ( F) Month (1) Min (2) Month(1) Extremes Lowest (2) Lowest Month(1) Degree s (1) Base Temp 65 Heating Cooling 100 Number of s (3) Jan 32.8 21.7 27.3 62 1918 1 35.8 1983-24 1950 29 10.5 1979
Climatography of the United States No
 Climate Division: CA 7 NWS Call Sign: Month (1) Min (2) Month(1) Extremes Lowest (2) Temperature ( F) Lowest Month(1) Degree s (1) Base Temp 65 Heating Cooling 100 Number of s (3) Jan 54.4 36.9 45.7 77+
Climatography of the United States No
 Climate Division: CA 5 NWS Call Sign: Month (1) Min (2) Month(1) Extremes Lowest (2) Temperature ( F) Lowest Month(1) Degree s (1) Base Temp 65 Heating Cooling 100 Number of s (3) 59.3 31.5 45.4 80 1976
Climatography of the United States No
 Climate Division: CA 7 NWS Call Sign: Month (1) Min (2) Month(1) Extremes Lowest (2) Temperature ( F) Lowest Month(1) Degree s (1) Base Temp 65 Heating Cooling 100 Number of s (3) 56.0 35.7 45.9 83 1975
Climatography of the United States No
 Climate Division: CA 6 NWS Call Sign: Month (1) Min (2) Month(1) Extremes Lowest (2) Temperature ( F) Lowest Month(1) Degree s (1) Base Temp 65 Heating Cooling 100 Number of s (3) 68.5 45.7 57.1 90 1971
Climatography of the United States No
 Climate Division: CA 7 NWS Call Sign: Month (1) Min (2) Month(1) Extremes Lowest (2) Temperature ( F) Lowest Month(1) Degree s (1) Base Temp 65 Heating Cooling 100 Number of s (3) 58.8 34.3 46.6 81+ 1948
MANAGEMENT OF THE NIEMEN RIVER BASIN WITH ACCOUNT OF ADAPTATION TO CLIMATE CHANGE. Hydro-meteorological Monitoring System
 MANAGEMENT OF THE NIEMEN RIVER BASIN WITH ACCOUNT OF ADAPTATION TO CLIMATE CHANGE Hydro-meteorological Monitoring System Draft Interim Report Milestone 1 Giovanni Crema 18 October 2012 Scope of work assessment
Climatography of the United States No
 Climate Division: CA 7 NWS Call Sign: Month (1) Min (2) Month(1) Extremes Lowest (2) Temperature ( F) Lowest Month(1) Degree s (1) Base Temp 65 Heating Cooling 100 Number of s (3) 70.4 44.2 57.3 95 1971
Climatography of the United States No
 Climate Division: CA 7 NWS Call Sign: Month (1) Min (2) Month(1) Extremes Lowest (2) Temperature ( F) Lowest Month(1) Degree s (1) Base Temp 65 Heating Cooling 1 Number of s (3) 64.8 45.4 55.1 85 1971
Climatography of the United States No
 Climate Division: CA 7 NWS Call Sign: Month (1) Min (2) Month(1) Extremes Lowest (2) Temperature ( F) Lowest Month(1) Degree s (1) Base Temp 65 Heating Cooling 100 Number of s (3) 44.5 29.3 36.9 69 1951
Climatography of the United States No
 Climate Division: CA 2 NWS Call Sign: Month (1) Min (2) Month(1) Extremes Lowest (2) Temperature ( F) Lowest Month(1) Degree s (1) Base Temp 65 Heating Cooling 100 Number of s (3) 53.7 32.7 43.2 79 1962
Climatography of the United States No
 Climate Division: CA 7 NWS Call Sign: Month (1) Min (2) Month(1) Extremes Lowest (2) Temperature ( F) Lowest Month(1) Degree s (1) Base Temp 65 Heating Cooling 1 Number of s (3) 65.5 38.7 52.1 87 1962
Climatography of the United States No
 Climate Division: CA 2 NWS Call Sign: Month (1) Min (2) Month(1) Extremes Lowest (2) Temperature ( F) Lowest Month(1) Degree s (1) Base Temp 65 Heating Cooling 100 Number of s (3) 53.3 31.8 42.6 74+ 1975
Climatography of the United States No
 Climate Division: CA 2 NWS Call Sign: Month (1) Min (2) Month(1) Extremes Lowest (2) Temperature ( F) Lowest Month(1) Degree s (1) Base Temp 65 Heating Cooling 100 Number of s (3) 53.3 37.1 45.2 77 1962
Climatography of the United States No
 Climate Division: CA 6 NWS Call Sign: Month (1) Min (2) Month(1) Extremes Lowest (2) Temperature ( F) Lowest Month(1) Degree s (1) Base Temp 65 Heating Cooling 100 Number of s (3) Jan 51.5 35.0 43.3 80
Agricultural Science Climatology Semester 2, Anne Green / Richard Thompson
 Agricultural Science Climatology Semester 2, 2006 Anne Green / Richard Thompson http://www.physics.usyd.edu.au/ag/agschome.htm Course Coordinator: Mike Wheatland Course Goals Evaluate & interpret information,
Antarctic Automatic Weather Station Data for the calendar year 1998
 Antarctic Automatic Weather Station Data for the calendar year 1998 by Linda M. Keller George A. Weidner Charles R. Stearns Matthew T. Whittaker Robert E. Holmes Space Science and Engineering Center University
STATUS OF THE WIGOS DEMONSTRATION PROJECTS
 STATUS OF THE WIGOS DEMONSTRATION PROJECTS Demonstration Project Morocco Strengthening Moroccan RIC Capacities (Submitted by Rabia Merrouchi, National Meteorological Service of Morocco (DMN)) February
Climatography of the United States No
 Climate Division: CA 4 NWS Call Sign: Month (1) Min (2) Month(1) Extremes Lowest (2) Temperature ( F) Lowest Month(1) Degree s (1) Base Temp 65 Heating Cooling 1 Number of s (3) Jan 58.5 38.8 48.7 79 1962
PRESENT STATE OF METEOROLOGICAL INSTRUMENTS IN MONGOLIA
 JMA/WMO TRAINING WORKSHOP ON CALIBRATION AND MAINTENANCE OF METEOROLOGICAL INSTRUMENTS IN RA II (ASIA) PRESENT STATE OF METEOROLOGICAL INSTRUMENTS IN MONGOLIA Tseveenravdan DOVCHIN NAMEM-CLEM Mongolia
Climatography of the United States No
 Climate Division: CA 6 NWS Call Sign: Month (1) Min (2) Month(1) Extremes Lowest (2) Temperature ( F) Lowest Month(1) Degree s (1) Base Temp 65 Heating Cooling 1 Number of s (3) Jan 67.5 42. 54.8 92 1971