Lisa Hannak Karsten Friedrich, Florian Imbery, Frank Kaspar Deutscher Wetterdienst National climate monitoring
|
|
|
- Myra Cooper
- 6 years ago
- Views:
Transcription

 Karsten Friedrich, Florian Imbery, Frank Kaspar Deutscher")
1 Changes in the measurement systems and the impact on the homogeneity of long time series A study based on parallel measurements from German reference stations Lisa Hannak (Lisa.Hannak@dwd.de) Karsten Friedrich, Florian Imbery, Frank Kaspar Deutscher Wetterdienst National climate monitoring


2 Parallel measurements at climate reference stations Comparison between manual and automatic measurements Motivation Why parallel measurements? Which parameters? Results Are measurement systems comparable? Statistical analysis Systematic differences Summary and outlook
3 Station since with manual measurements Aachen Aachen-Orsbach Brocken 1881 since 2008 Fichtelberg Frankfurt 1949 since 2008 Görlitz Hamburg Helgoland Hohenpeißenberg 1781 since 2008 Konstanz Lindenberg 1906 since 2008 Potsdam 1893 since 2008 Schleswig 1947 since 2008 Climate reference stations with parallel measurements of automatic sensors (CRS ll) Climate reference stations with manual measurements (CRS l)


4 Climate reference stations: Parallel measurements Parameters: Air temperature, extreme temperatures, soil temperatures, air pressure, relative humidity, sunshine duration, and precipitation
5 Climate reference stations: Parallel measurements Parameters: Air temperature, extreme temperatures, soil temperatures, air pressure, relative humidity, sunshine duration, and precipitation The aims: Analysis of comparability of measurement systems and effect on homogeneity Data quality control Analysis of measurement uncertainty Use results to advance homogenization methods
6 Climate reference stations: Parallel measurements Parameters: Air temperature, extreme temperatures, soil temperatures, air pressure, relative humidity, sunshine duration, and precipitation The aims: Analysis of comparability of measurement systems and effect on homogeneity Data quality control Analysis of measurement uncertainty Why parallel measurements? Use results to advance homogenization methods


7 Analysis of comparability Compare measurements of manual and automatic sensors
8 Analysis of comparability Compare measurements of manual and automatic sensors

9 Analysis of comparability Compare measurements of manual and automatic sensors Statistical analysis


10 Analysis of comparability Compare measurements of manual and automatic sensors Good agreement! Statistical analysis
11 Annual mean temperature in Germany since 1881 as anomalies from the mean value (Kaspar and Friedrich, 2016)
12 Analysis of comparability Compare measurements of manual and automatic sensors Statistical analysis

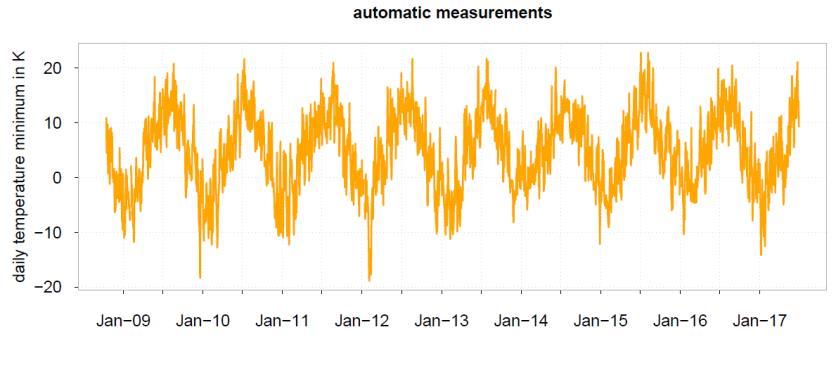
13 temperature in C What else? Air temperature at station Hohenpeißenberg time
14 Differences in K Air temperature at station Hohenpeißenberg Differences of automatic minus manual measurements at traditional observing times time

15 Differences in K Air temperature at station Hohenpeißenberg Differences of automatic minus manual measurements at traditional observing times time Data quality control
16 Breakpoint detection methods uniseg Using dynamic programming algorithm for joint segmentation Maximum likelihood criterion Picard et al., 2016 SNHT Trend Test Detects changes in the mean value Using moving window Alexandersson and Moberg, 1997
17 Data quality control Relative humidity at station Lindenberg
18 Data quality control Relative humidity at station Lindenberg
19 Analysis of comparability Compare measurements of manual and automatic sensors
20 Analysis of comparability - Air temperature Compare measurements of manual and automatic sensors mercury in glass thermometer in a stevenson shelter (most cases) Pt100-sensor in a lamellar shelter LAM 630 (most cases)
21 Air temperature (all stations) n = Differences: automatic minus manual measurements at 6:30 UTC, 13:30 UTC, and 20:30 UTC Mean is close to zero, standard deviation is small

22 Air temperature (all stations) n = Differences: automatic minus manual measurements at 6:30 UTC, 13:30 UTC, and 20:30 UTC Mean is close to zero, standard deviation is small measurement systems seem to be comparable
23 Systematic differences between measurement systems
24 Systematic differences between measurement systems Daily maximum temperature
25 Systematic differences between measurement systems Differences of daily maximum temperature per months (station Potsdam)


26 Systematic differences between measurement systems Differences of daily maximum temperature per months (station Potsdam) radiation effect in the lamellar shelter LAM 630
27 Systematic differences between measurement systems Soil temperature
28 Systematic differences between measurement systems Mean differences of soil temperature per season, station, observing times
29 Systematic differences between measurement systems Mean differences of soil temperature per season, station, observing times
30 Systematic differences between measurement systems Mean differences of soil temperature per season, station, observing times
31 Systematic differences between measurement systems Mean differences of soil temperature per season, station, observing times
32 Systematic differences between measurement systems Mean differences of soil temperature per season, station, observing times
33 Systematic differences between measurement systems Mean differences of soil temperature per season, station, observing times
34 Systematic differences between measurement systems Mean differences of soil temperature per season, station, observing times
35 Systematic differences between measurement systems Mean differences of soil temperature per season, station, observing times
36 Systematic differences between measurement systems Mean differences of soil temperature per season, station, observing times

37 Systematic differences between measurement systems Mean differences of soil temperature per season, station, observing times
38 Systematic differences between measurement systems Daily sunshine duration
39 Systematic differences between measurement systems Differences of daily sunshine duration (station Schleswig)
40 Systematic differences between measurement systems Differences of daily sunshine duration (station Schleswig) Larger standard deviation in summer because of longer days
41 Systematic differences between measurement systems Differences of daily sunshine duration (station Schleswig) Summer: more sunshine (mean) in manual observations


42 Systematic differences between measurement systems Differences of daily sunshine duration (station Schleswig) Observers tend to overestimate daily sunshine duration
43 Systematic differences between measurement systems Daily precipitation amount
44 Systematic differences between measurement systems Daily precipitation amount Reference = manual observations 87.1% inside tolerance range

45 Systematic differences between measurement systems Small precipitation amounts: Large relative error Large precipitation amounts: Underestimation of automatic observation

46 Systematic differences between measurement systems Relative error in winter larger than in summer
47 Summary and outlook Parallel measurements can be used for data quality control and analysis on homogeneity

48 Summary and outlook Parallel measurements can be used for data quality control and analysis on homogeneity Trend periods in automatic measurements of relative humidity Annual cycle in differences of daily maximum temperature, soil temperature, sunshine duration Temperature measurements at traditional observing times seem to be comparable
49 Summary and outlook Parallel measurements can be used for data quality control and analysis on homogeneity Trend periods in automatic measurements of relative humidity Annual cycle in differences of daily maximum temperature, soil temperature, sunshine duration Temperature measurements at traditional observing times seem to be comparable To do: Homogenization of time series Correction of systematic differences
50 Summary and outlook Parallel measurements can be used for data quality control and analysis on homogeneity Trend periods in automatic measurements of relative humidity Annual cycle in differences of daily maximum temperature, soil temperature, sunshine duration Temperature measurements at traditional observing times seem to be comparable To do: Homogenization of time series Correction of systematic differences Thank you for your attention!
Parallel measurements at German climate reference stations: DWD s approach to compare manual vs. automatic observations
 Parallel measurements at German climate reference stations: DWD s approach to compare manual vs. automatic observations Frank Kaspar and Lisa Hannak Deutscher Wetterdienst, National Climate Monitoring,
NINTH SEMINAR FOR HOMOGENIZATION AND QUALITY CONTROL IN CLIMATOLOGICAL DATABASES
 Climate Data and Monitoring WCDMP-No. 85 NINTH SEMINAR FOR HOMOGENIZATION AND QUALITY CONTROL IN CLIMATOLOGICAL DATABASES AND FOURTH CONFERENCE ON SPATIAL INTERPOLATION TECHNIQUES IN CLIMATOLOGY AND METEOROLOGY
Quality assurance for sensors at the Deutscher Wetterdienst (DWD)
") Quality assurance for sensors at the Deutscher Wetterdienst (DWD) Quality assurance / maintenance / calibration Holger Dörschel, Dr Tilman Holfelder WMO International Conference on Automatic Weather Stations
Quality assurance for sensors at the Deutscher Wetterdienst (DWD) Quality assurance / maintenance / calibration Holger Dörschel, Dr Tilman Holfelder WMO International Conference on Automatic Weather Stations
Quality assurance for sensors at the Deutscher Wetterdienst (DWD)
") Paper submitted to ICAWS 2017: Topic 3 Sustainability of the measurements: Calibration, intercomparisons, laboratory and field performance tests, quality assurance and control assessment for traceable
Paper submitted to ICAWS 2017: Topic 3 Sustainability of the measurements: Calibration, intercomparisons, laboratory and field performance tests, quality assurance and control assessment for traceable
INFLUENCE OF THE AVERAGING PERIOD IN AIR TEMPERATURE MEASUREMENT
 INFLUENCE OF THE AVERAGING PERIOD IN AIR TEMPERATURE MEASUREMENT Hristomir Branzov 1, Valentina Pencheva 2 1 National Institute of Meteorology and Hydrology, Sofia, Bulgaria, Hristomir.Branzov@meteo.bg
Wali Ullah Khan Pakistan Meteorological Department
 An overview of Weather Observation practices over Pakistan By Wali Ullah Khan Pakistan Meteorological Department JMA/WMO TRAINING WORKSHOP ON CALIBRATION AND MAINTENANCE OF METEOROLOGICAL INSTRUMENTS IN
QualiMET 2.0. The new Quality Control System of Deutscher Wetterdienst
 QualiMET 2.0 The new Quality Control System of Deutscher Wetterdienst Reinhard Spengler Deutscher Wetterdienst Department Observing Networks and Data Quality Assurance of Meteorological Data Michendorfer
Regional Climate Modelling in Europe:
 Regional Climate Modelling in Europe: Focus on precipitation Clemens Simmer Meteorologisches Institut Rheinische Friedrich-Wilhelms-Universität Bonn Content Motivation Why do we need Regional Climate Models
An index to indicate precipitation probability and to investigate effects of sub-grid-scale surface parameterizations on model performance
 An index to indicate precipitation probability and to investigate effects of sub-grid-scale surface parameteriations on model performance Sylvia Bohnenstengel (1,2), K. Heinke Schlünen (2) (1) Max-Planck
Variational soil assimilation at DWD
 Variational soil assimilation at DWD Werner Wergen, Reinhold Hess and Martin Lange Deutscher Wetterdienst Offenbach am Main, Germany The soil moisture assimilation scheme (SMA) at DWD Full description
Application and verification of the ECMWF products Report 2007
 Application and verification of the ECMWF products Report 2007 National Meteorological Administration Romania 1. Summary of major highlights The medium range forecast activity within the National Meteorological
Deutscher Wetterdienst. German Climate Services - A contribution to the Global Framework for Climate Services (GFCS) Tobias Fuchs and Paul Becker
 Tobias Fuchs and Paul Becker") Deutscher Wetterdienst German Climate Services - A contribution to the Global Framework for Climate Services (GFCS) Tobias Fuchs and Paul Becker Deutscher Wetterdienst (DWD) Business Area Climate and Environment
Deutscher Wetterdienst German Climate Services - A contribution to the Global Framework for Climate Services (GFCS) Tobias Fuchs and Paul Becker Deutscher Wetterdienst (DWD) Business Area Climate and Environment
Introductions to RIC-Beijing. NAN Xuejing, CUI Xiai Meteorological Observation Center China Meteorological Administration March,2018
 Introductions to RIC-Beijing NAN Xuejing, CUI Xiai China Meteorological Administration March,2018 Contents 1. China Meteorological Administration (CMA) Organization 2. (MOC) Functional Structure Responsibilities
Climate Variables for Energy: WP2
 Climate Variables for Energy: WP2 Phil Jones CRU, UEA, Norwich, UK Within ECEM, WP2 provides climate data for numerous variables to feed into WP3, where ESCIIs will be used to produce energy-relevant series
Global temperature trend biases and statistical homogenization methods
 Global temperature trend biases and statistical homogenization methods Victor Venema & Ralf Lindau @VariabilityBlog variable-variability.blogspot.com Outline talk Early warming (1850 to 1920, red rectangle)
Gridding of precipitation and air temperature observations in Belgium. Michel Journée Royal Meteorological Institute of Belgium (RMI)
") Gridding of precipitation and air temperature observations in Belgium Michel Journée Royal Meteorological Institute of Belgium (RMI) Gridding of meteorological data A variety of hydrologic, ecological,
Gridding of precipitation and air temperature observations in Belgium Michel Journée Royal Meteorological Institute of Belgium (RMI) Gridding of meteorological data A variety of hydrologic, ecological,
Comparison of meteorological data from different sources for Bishkek city, Kyrgyzstan
 Comparison of meteorological data from different sources for Bishkek city, Kyrgyzstan Ruslan Botpaev¹*, Alaibek Obozov¹, Janybek Orozaliev², Christian Budig², Klaus Vajen², 1 Kyrgyz State Technical University,
Figure 1. Daily variation of air temperature
 Comparative analysis of the meteorological data acquired on standard equipment and by automatic weather station of CAMPBELL SCIENTIFIC, INC Company Kudekov T.K. Director-General of the KAZHYDROMET 050022
STOCHASTIC MODELING OF ENVIRONMENTAL TIME SERIES. Richard W. Katz LECTURE 5
 STOCHASTIC MODELING OF ENVIRONMENTAL TIME SERIES Richard W Katz LECTURE 5 (1) Hidden Markov Models: Applications (2) Hidden Markov Models: Viterbi Algorithm (3) Non-Homogeneous Hidden Markov Model (1)
Guidelines on Quality Control Procedures for Data from Automatic Weather Stations
 Guidelines on Quality Control Procedures for Data from Automatic Weather Stations Igor Zahumenský Slovak Hydrometeorological Institute SHMI, Jeséniova 17, 833 15 Bratislava, Slovakia Tel./Fax. +421 46
Multi-model approach for projecting future climate change conditions in Central Vietnam
 2011/03/03 at the ICSS-Asia 2011 conference Multi-model approach for projecting future climate change conditions in Central Vietnam Thanh NGO-DUC, Van Tan PHAN, Trung NGUYEN QUANG Department of Meteorology
3 PERFORMANCE OF WATERGAP AS COMPARED TO MESOSCALE MODELS: A CASE STUDY FOR THE ELBE AND ODER BASINS
 EuroWasser: Performance of WaterGAP as compared to mesoscale models 3-1 3 PERFORMANCE OF WATERGAP AS COMPARED TO MESOSCALE MODELS: A CASE STUDY FOR THE ELBE AND ODER BASINS Bernhard Lehner *, Frank Kaspar
THE ÅS TEMPERATURE SERIES IN SOUTHERN NORWAY HOMOGENEITY TESTING AND CLIMATE ANALYSIS
 Bulletin of Geography Physical Geography Series No 7/2014: 7 26 http://dx.doi.org/10.2478/bgeo-2014-0001 HERDIS M. GJELTEN 1, 2, ØYVIND NORDLI 2, ARNE A. GRIMENES 1 AND ELIN LUNDSTAD 2 1 Department of
COUPLING A DISTRIBUTED HYDROLOGICAL MODEL TO REGIONAL CLIMATE MODEL OUTPUT: AN EVALUATION OF EXPERIMENTS FOR THE RHINE BASIN IN EUROPE
 P.1 COUPLING A DISTRIBUTED HYDROLOGICAL MODEL TO REGIONAL CLIMATE MODEL OUTPUT: AN EVALUATION OF EXPERIMENTS FOR THE RHINE BASIN IN EUROPE Jan Kleinn*, Christoph Frei, Joachim Gurtz, Pier Luigi Vidale,
10/27/2015. Content. Well-homogenized national datasets. Difference (national global) BEST (1800) Difference BEST (1911) Difference GHCN & GISS (1911)
 BEST (1800) Difference BEST (1911) Difference GHCN & GISS (1911)") Content Is the global mean temperature trend too low? Victor Venema, Phil Jones, Ralf Lindau, Tim Osborn and numerous collaborators @VariabilityBlog variable-variability.blogspot.com 1. Comparison trend
Content Is the global mean temperature trend too low? Victor Venema, Phil Jones, Ralf Lindau, Tim Osborn and numerous collaborators @VariabilityBlog variable-variability.blogspot.com 1. Comparison trend
THE CLIMATE INFORMATION MODULE
 Climate Information and Prediction Services (CLIPS) -Curriculum- THE CLIMATE INFORMATION MODULE designed by Dipl.-Met. Peer Hechler Deutscher Wetterdienst P.O. Box 10 04 65 63004 Offenbach Germany THE
Verification of ECMWF products at the Deutscher Wetterdienst (DWD)
") Verification of ECMWF products at the Deutscher Wetterdienst (DWD) DWD Martin Göber 1. Summary of major highlights The usage of a combined GME-MOS and ECMWF-MOS continues to lead to a further increase
Verification of ECMWF products at the Deutscher Wetterdienst (DWD) DWD Martin Göber 1. Summary of major highlights The usage of a combined GME-MOS and ECMWF-MOS continues to lead to a further increase
Climate Change and Runoff Statistics in the Rhine Basin: A Process Study with a Coupled Climate-Runoff Model
 IACETH Climate Change and Runoff Statistics in the Rhine Basin: A Process Study with a Coupled Climate-Runoff Model Jan KLEINN, Christoph Frei, Joachim Gurtz, Pier Luigi Vidale, and Christoph Schär Institute
Developments at DWD: Integrated water vapour (IWV) from ground-based GPS
 from ground-based GPS") 1 Working Group on Data Assimilation 2 Developments at DWD: Integrated water vapour (IWV) from ground-based Christoph Schraff, Maria Tomassini, and Klaus Stephan Deutscher Wetterdienst, Frankfurter Strasse
1 Working Group on Data Assimilation 2 Developments at DWD: Integrated water vapour (IWV) from ground-based Christoph Schraff, Maria Tomassini, and Klaus Stephan Deutscher Wetterdienst, Frankfurter Strasse
Interannual variation of MODIS NDVI in Lake Taihu and its relation to climate in submerged macrophyte region
 Yale-NUIST Center on Atmospheric Environment Interannual variation of MODIS NDVI in Lake Taihu and its relation to climate in submerged macrophyte region ZhangZhen 2015.07.10 1 Outline Introduction Data
Homogenization of monthly and daily climatological time series
 Homogenization of monthly and daily climatological time series Petr Štěpánek Czech Hydrometeorological Institute, Czech Republic E-mail: petr.stepanek@chmi.cz Latsis Foundation 1st International Summer
Climate Dataset: Aitik Closure Project. November 28 th & 29 th, 2018
 1 Climate Dataset: Aitik Closure Project November 28 th & 29 th, 2018 Climate Dataset: Aitik Closure Project 2 Early in the Closure Project, consensus was reached to assemble a long-term daily climate
SASKATOON STATION
 Day Max Max 191-1 Temperature Degree-days Precipitation Min Min 191-1 Mean Mean 191-1 Growing Heating Cooling 1 1 Geonor Weighing Gauge Notes Preliminary OCTOBER 17 Snow-on- Ground 9h Max ½ hr Min ½ hr
The Global Precipitation Climatology Centre (GPCC) Serving the Hydro-Climatology Community
 Serving the Hydro-Climatology Community") The Global Precipitation Climatology Centre (GPCC) Serving the Hydro-Climatology Community Bruno Rudolf, Andreas Becker, Udo Schneider, Anja Meyer-Christoffer, Markus Ziese, Peter Finger Deutscher Wetterdienst
The Global Precipitation Climatology Centre (GPCC) Serving the Hydro-Climatology Community Bruno Rudolf, Andreas Becker, Udo Schneider, Anja Meyer-Christoffer, Markus Ziese, Peter Finger Deutscher Wetterdienst
Appendix D. Model Setup, Calibration, and Validation
 . Model Setup, Calibration, and Validation Lower Grand River Watershed TMDL January 1 1. Model Selection and Setup The Loading Simulation Program in C++ (LSPC) was selected to address the modeling needs
Some details about the theoretical background of CarpatClim DanubeClim gridded databases and their practical consequences
 Some details about the theoretical background of CarpatClim DanubeClim gridded databases and their practical consequences Zita Bihari, Tamás Szentimrey, Andrea Kircsi Hungarian Meteorological Service Outline
Analysis of long-term temporal variations in atmospheric water vapor time series
 Analysis of long-term temporal variations in atmospheric water vapor time series F. Alshawaf, G. Dick, S. Heise, T. Simeonov, S. Vey, T. Schmidt, and J. Wickert German Research Center for Geosciences GFZ
Application and verification of ECMWF products 2008
 Application and verification of ECMWF products 2008 RHMS of Serbia 1. Summary of major highlights ECMWF products are operationally used in Hydrometeorological Service of Serbia from the beginning of 2003.
TEMPERATURE AND PRECIPITATION CHANGES IN TÂRGU- MURES (ROMANIA) FROM PERIOD
 FROM PERIOD") TEMPERATURE AND PRECIPITATION CHANGES IN TÂRGU- MURES (ROMANIA) FROM PERIOD 1951-2010 O.RUSZ 1 ABSTRACT. Temperature and precipitation changes in Târgu Mures (Romania) from period 1951-2010. The analysis
TEMPERATURE AND PRECIPITATION CHANGES IN TÂRGU- MURES (ROMANIA) FROM PERIOD 1951-2010 O.RUSZ 1 ABSTRACT. Temperature and precipitation changes in Târgu Mures (Romania) from period 1951-2010. The analysis
SEASONAL AND DAILY TEMPERATURES
 1 2 3 4 5 6 7 8 9 10 11 12 SEASONAL AND DAILY TEMPERATURES Chapter 3 Earth revolves in elliptical path around sun every 365 days. Earth rotates counterclockwise or eastward every 24 hours. Earth closest
Development and applications of regional reanalyses for Europe and Germany based on DWD s NWP models: Status and outlook
 Development and applications of regional reanalyses for Europe and Germany based on DWD s NWP models: Status and outlook Frank Kaspar 1, Michael Borsche 1, Natacha Fery 1, Andrea K. Kaiser-Weiss 1, Jan
6/17/2016. Content. My credentials. Who am I. Inhomogeneities. Global temperature changes
 Content Is the global mean temperature trend too low? Victor Venema Ralf Lindau @VariabilityBlog variable-variability.blogspot.com About me Global mean temperature change Independent lines of research
Description of the Temperature Observation and Averaging Methods Used at the Blue Hill Meteorological Observatory
 Description of the Temperature Observation and Averaging Methods Used at the Blue Hill Meteorological Observatory Michael J. Iacono Blue Hill Meteorological Observatory November 2015 The Blue Hill Meteorological
Application and verification of ECMWF products 2012
 Application and verification of ECMWF products 2012 Instituto Português do Mar e da Atmosfera, I.P. (IPMA) 1. Summary of major highlights ECMWF products are used as the main source of data for operational
Why the Earth has seasons. Why the Earth has seasons 1/20/11
 Chapter 3 Earth revolves in elliptical path around sun every 365 days. Earth rotates counterclockwise or eastward every 24 hours. Earth closest to Sun (147 million km) in January, farthest from Sun (152
Measurements and Dispersion Calculations by the Deutscher Wetterdienst Regarding the Release of Radionuclides at Fukushima Daiichi Nuclear Power Plant
 Measurements and Dispersion Calculations by the Deutscher Wetterdienst Regarding the Release of Radionuclides at Fukushima Daiichi Nuclear Power Plant T. Steinkopff, J. Barth, A. Dalheimer, A. Ehlers,
A new leaf phenology for the land surface scheme TERRA of the COSMO atmospheric model
 A new leaf phenology for the land surface scheme TERRA of the COSMO atmospheric model Jan-Peter Schulz 1,3,*, Gerd Vogel 2, Bodo Ahrens 3, Reto Stöckli 4 and Jean-Marie Bettems 4 1 Biodiversity and Climate
Model Output Statistics (MOS)
") Model Output Statistics (MOS) Numerical Weather Prediction (NWP) models calculate the future state of the atmosphere at certain points of time (forecasts). The calculation of these forecasts is based on
Model Output Statistics (MOS) Numerical Weather Prediction (NWP) models calculate the future state of the atmosphere at certain points of time (forecasts). The calculation of these forecasts is based on
Heavier summer downpours with climate change revealed by weather forecast resolution model
 SUPPLEMENTARY INFORMATION DOI: 10.1038/NCLIMATE2258 Heavier summer downpours with climate change revealed by weather forecast resolution model Number of files = 1 File #1 filename: kendon14supp.pdf File
Application and verification of ECMWF products 2014
 Application and verification of ECMWF products 2014 Israel Meteorological Service (IMS), 1. Summary of major highlights ECMWF deterministic runs are used to issue most of the operational forecasts at IMS.
Regional Climate Variability in the Western U.S.: Observed vs. Anticipated
 Regional Climate Variability in the Western U.S.: Observed vs. Anticipated Klaus Wolter University of Colorado at Boulder, klaus.wolter@noaa.gov Kudos to Joe Barsugli and Jon Eischeid Seasonal Precipitation
Satellite-Based Sunshine Duration for Europe
 Remote Sens. 2013, 5, 2943-2972; doi:10.3390/rs5062943 Article OPEN ACCESS Remote Sensing ISSN 2072-4292 www.mdpi.com/journal/remotesensing Satellite-Based Sunshine Duration for Europe Steffen Kothe 1,
Reduced Overdispersion in Stochastic Weather Generators for Statistical Downscaling of Seasonal Forecasts and Climate Change Scenarios
 Reduced Overdispersion in Stochastic Weather Generators for Statistical Downscaling of Seasonal Forecasts and Climate Change Scenarios Yongku Kim Institute for Mathematics Applied to Geosciences National
SUBJECT AREA(S): science, math, solar power, visible light, ultraviolet (UV), infrared (IR), energy, Watt, atmospheric conditions
: science, math, solar power, visible light, ultraviolet (UV), infrared (IR), energy, Watt, atmospheric conditions") Our Place in Space Cosmic Rays AUTHOR: Jamie Repasky GRADE LEVEL(S): 3-5 SUBJECT AREA(S): science, math, solar power, visible light, ultraviolet (UV), infrared (IR), energy, Watt, atmospheric conditions
Our Place in Space Cosmic Rays AUTHOR: Jamie Repasky GRADE LEVEL(S): 3-5 SUBJECT AREA(S): science, math, solar power, visible light, ultraviolet (UV), infrared (IR), energy, Watt, atmospheric conditions
Climate Change and Arizona s Rangelands: Management Challenges and Opportunities
 Climate Change and Arizona s Rangelands: Management Challenges and Opportunities Mike Crimmins Climate Science Extension Specialist Dept. of Soil, Water, & Env. Science & Arizona Cooperative Extension
John R. Christy and William B. Norris University of Alabama in Huntsville, Huntsville, Alabama USA
 FOURTEENTH CONFERENCE ON APPLIED CLIMATOLOGY J1.2 IRRIGATION-INDUCED WARMING IN CENTRAL CALIFORNIA? John R. Christy and William B. Norris University of Alabama in Huntsville, Huntsville, Alabama USA 1.
Regional Climate Centre Network (RCC) in RA VI as a GFCS contribution
 in RA VI as a GFCS contribution") Regional Climate Centre Network (RCC) in RA VI as a GFCS contribution Stefan Rösner and Peter Bissolli Deutscher Wetterdienst (German Meteorological Service) Dep. Climate Monitoring, Offenbach, Germany
Regional Climate Centre Network (RCC) in RA VI as a GFCS contribution Stefan Rösner and Peter Bissolli Deutscher Wetterdienst (German Meteorological Service) Dep. Climate Monitoring, Offenbach, Germany
Analysis of spatial and temporal distribution of wet snow events in Germany
 IWAIS XIII, Andermatt, September 8 to 11, 29 Analysis of spatial and temporal distribution of wet snow events in Germany D. Nikolov 1, B. Wichura 2 1 National Institute of Meteorology and Hydrology Bulgaria,
Series tore word. Acknowledgements
 Series tore word p. xi Preface p. xiii Acknowledgements p. xv Disclaimer p. xvii Introduction p. 1 The instrumental age p. 2 Measurements and the climate record p. 2 Clouds and rainfall p. 3 Standardisation
Homogenization of the total ozone amount series derived from NOAA/TOVS data
 Homogenization of the total ozone amount series derived from NOAA/TOVS data B.Lapeta 1, I.Dyras 1, Z.Ustrnul 2 1 Institute of Meteorology and Water Management, ul. Borowego 14, 30-215 Krakow, Poland e-mail:
Long Term Renewables Forecast Hauser Plads 10, 4 DK-1127 Copenhagen K Denmark
 Area: Germany Client: xxx Issued: 08:00 UTC 26.08.2016 Next update: 02.09.2016 Overview During 27-29 Aug a low pressure is passing south of UK towards southern Scandinavia and the connected fronts are
LONG -TERM OBSERVATIONS OF CLOUDNESS IN HURBANOVO
 LONG -TERM OBSERVATIONS OF CLOUDNESS IN HURBANOVO Tekušová Mária, Horecká Viera Slovak Hydrometeorological Institute in Bratislava, 83101 Bratislava, Slovakia Abstract. In our work, we are analyzed climatological
Chapter 4: Weather & Climate. (Pg )
") Chapter 4: Weather & Climate (Pg. 54 73) Introduction: Distinguish between the terms weather & climate. P. 54 Weather: the state of the atmosphere at any one place or time. (short term) Climate: the average
Chapter 4: Weather & Climate (Pg. 54 73) Introduction: Distinguish between the terms weather & climate. P. 54 Weather: the state of the atmosphere at any one place or time. (short term) Climate: the average
The Summer Flooding 2005 in Southern Bavaria A Climatological Review. J. Grieser, C. Beck, B. Rudolf
 168 DWD Klimastatusbericht 2005 The Summer Flooding 2005 in Southern Bavaria A Climatological Review J. Grieser, C. Beck, B. Rudolf The Flood-Event During the second half of August 2005 severe floodings
Series homogenization, missing data filling and gridded products with Climatol
 Series homogenization, missing data filling and gridded products with Climatol José A. Guijarro State Meteorological Agency (AEMET), Balearic Islands Office, Spain 11 th EUMETNET Data Management Workshop
PRECIPITATION TYPE AND RAINFALL INTENSITY FROM THE PLUDIX DISDROMETER DURING THE WASSERKUPPE CAMPAIGN
 PRECIPITATION TYPE AND RAINFALL INTENSITY FROM THE PLUDIX DISDROMETER DURING THE WASSERKUPPE CAMPAIGN Clelia Caracciolo1, Franco Prodi1,2, Leo Pio D Adderio2 and Eckhard Lanzinger4 1 University of Ferrara,
Indicator Trends for Canadian Climate Changes during the Last 60 to 140 Years
 Indicator Trends for Canadian Climate Changes during the Last 60 to 140 Years Presented to CPANS, Edmonton Luncheon Forum by Kurt Hansen, P. Eng. President, Green Inc., Calgary, Alberta greeninc@telus.net
A TEST OF THE PRECIPITATION AMOUNT AND INTENSITY MEASUREMENTS WITH THE OTT PLUVIO
 A TEST OF THE PRECIPITATION AMOUNT AND INTENSITY MEASUREMENTS WITH THE OTT PLUVIO Wiel M.F. Wauben, Instrumental Department, Royal Netherlands Meteorological Institute (KNMI) P.O. Box 201, 3730 AE De Bilt,
DEPARTMENT OF EARTH & CLIMATE SCIENCES Name SAN FRANCISCO STATE UNIVERSITY Nov 29, ERTH 360 Test #2 200 pts
 DEPARTMENT OF EARTH & CLIMATE SCIENCES Name SAN FRANCISCO STATE UNIVERSITY Nov 29, 2018 ERTH 360 Test #2 200 pts Each question is worth 4 points. Indicate your BEST CHOICE for each question on the Scantron
Studies on adaptation capacity of Carpathian ecosystems/landscape to climate change
 ` Studies on adaptation capacity of Carpathian ecosystems/landscape to climate change Science for the Carpathians CARPATHIAN CONVENTION COP5 Lillafüred, 10.10.2017-12.10.2017 Marcel Mîndrescu, Anita Bokwa
A quantile matching adjustment algorithm for Gaussian data series
 A quantile matching adjustment algorithm for Gaussian data series Xiaolan L. Wang Climate Research Division, Science and Technology Branch Environment Canada, Toronto, Canada December 3, 2009 The Quantile
What is one-month forecast guidance?
 What is one-month forecast guidance? Kohshiro DEHARA (dehara@met.kishou.go.jp) Forecast Unit Climate Prediction Division Japan Meteorological Agency Outline 1. Introduction 2. Purposes of using guidance
Meteorology. Chapter 15 Worksheet 1
 Chapter 15 Worksheet 1 Meteorology Name: Circle the letter that corresponds to the correct answer 1) The Tropic of Cancer and the Arctic Circle are examples of locations determined by: a) measuring systems.
A preliminary global survey of high elevation mountain stations and remarks on recent climatic changes at high altitudes in Asia
 A preliminary global survey of high elevation mountain stations and remarks on recent climatic changes at high altitudes in Asia What is a mountain station? Global HE station distribution PET as an estimator
A Revised Version of the Cloud Microphysical Parameterization of COSMO-LME
 A Revised Version of the Cloud Microphysical Parameterization of COSMO-LME Axel Seifert DWD, Offenbach -1- Motivation: Well known problems of COSMO-LME regards wintertime precipitation: Overestimation
Climate. Annual Temperature (Last 30 Years) January Temperature. July Temperature. Average Precipitation (Last 30 Years)
 January Temperature. July Temperature. Average Precipitation (Last 30 Years)") Climate Annual Temperature (Last 30 Years) Average Annual High Temp. (F)70, (C)21 Average Annual Low Temp. (F)43, (C)6 January Temperature Average January High Temp. (F)48, (C)9 Average January Low Temp.
Climate Annual Temperature (Last 30 Years) Average Annual High Temp. (F)70, (C)21 Average Annual Low Temp. (F)43, (C)6 January Temperature Average January High Temp. (F)48, (C)9 Average January Low Temp.
Biases in precipitation records found in parallel measurements
 Biases in precipitation records found in parallel measurements Petr Stepanek (1,2), Enric Aguilar (3), Victor Venema (4), Renate Auchmann (5), Fabricio Daniel dos Santos Silva (6), Erik Engström (7), Alba
Methodology and Data Sources for Agriculture and Forestry s Interpolated Data ( )
") Methodology and Data Sources for Agriculture and Forestry s Interpolated Data (1961-2016) Disclaimer: This data is provided as is with no warranties neither expressed nor implied. As a user of the data
Methodology and Data Sources for Agriculture and Forestry s Interpolated Data (1961-2016) Disclaimer: This data is provided as is with no warranties neither expressed nor implied. As a user of the data
MeteoSwiss acceptance procedure for automatic weather stations
 MeteoSwiss acceptance procedure for automatic weather stations J. Fisler, M. Kube, E. Grueter and B. Calpini MeteoSwiss, Krähbühlstrasse 58, 8044 Zurich, Switzerland Phone:+41 44 256 9433, Email: joel.fisler@meteoswiss.ch
TRENDS IN DIRECT NORMAL SOLAR IRRADIANCE IN OREGON FROM
 TRENDS IN DIRECT NORMAL SOLAR IRRADIANCE IN OREGON FROM 1979-200 Laura Riihimaki Frank Vignola Department of Physics University of Oregon Eugene, OR 970 lriihim1@uoregon.edu fev@uoregon.edu ABSTRACT To
Investigating Weather with Google Earth Student Guide
 Investigating Weather with Google Earth Student Guide In this activity, you will use Google Earth to explore some factors that affect weather. You will: 1. Determine how different factors affect a location
The Australian Operational Daily Rain Gauge Analysis
 The Australian Operational Daily Rain Gauge Analysis Beth Ebert and Gary Weymouth Bureau of Meteorology Research Centre, Melbourne, Australia e.ebert@bom.gov.au Daily rainfall data and analysis procedure
Water Stress, Droughts under Changing Climate
 Water Stress, Droughts under Changing Climate Professor A.K.M. Saiful Islam Institute of Water and Flood Management Bangladesh University of Engineering and Technology (BUET) Outline of the presentation
Application and verification of ECMWF products in Serbia
 Application and verification of ECMWF products in Serbia Hydrometeorological Service of Serbia 1. Summary of major highlights ECMWF products are operationally used in Hydrometeorological Service of Serbia
The Kentucky Mesonet: Entering a New Phase
 The Kentucky Mesonet: Entering a New Phase Stuart A. Foster State Climatologist Kentucky Climate Center Western Kentucky University KCJEA Winter Conference Lexington, Kentucky February 9, 2017 Kentucky
Cryosphere matters attribution of observed streamflow changes in headwater catchments of the Tarim River
 Cryosphere matters attribution of observed streamflow changes in headwater catchments of the Tarim River Doris Düthmann, Tobias Bolch *, Tino Pieczonka *, Daniel Farinotti, David Kriegel, Sergiy Vorogushyn,
Modelling changes in the runoff regime in Slovakia using high resolution climate scenarios
 Modelling changes in the runoff regime in Slovakia using high resolution climate scenarios K. HLAVČOVÁ, R. VÝLETA, J. SZOLGAY, S. KOHNOVÁ, Z. MACUROVÁ & P. ŠÚREK Department of Land and Water Resources
Stevenson screen temperatures an investigation
 an investigation 156 Bernard Burton Wokingham, Berkshire Introduction The installation in 2006 of an automatic weather station (AWS) at the Wokingham (Berkshire) climatological station, which is equipped
Application and verification of ECMWF products 2009
 Application and verification of ECMWF products 2009 Icelandic Meteorological Office (www.vedur.is) Gu rún Nína Petersen 1. Summary of major highlights Medium range weather forecasts issued at IMO are mainly
Application and verification of ECMWF products 2016
 Application and verification of ECMWF products 2016 Icelandic Meteorological Office (www.vedur.is) Bolli Pálmason and Guðrún Nína Petersen 1. Summary of major highlights Medium range weather forecasts
Preliminary results obtained following the intercomparison of the meteorological parameters provided by automatic and classical stations in Romania
 Preliminary results obtained following the intercomparison of the meteorological parameters provided by automatic and classical stations in Romania Madalina Baciu, Violeta Copaciu, Traian Breza, Sorin
Site assessment for a type certification icing class Fraunhofer IWES Kassel, Germany
 Site assessment for a type certification icing class Kai Freudenreich 1, Michael Steiniger 1, Zouhair Khadiri-Yazami 2, Ting Tang 2, Thomas Säger 2 1 DNV GL Renewables Certification, Hamburg, Germany kai.freudenreich@dnvgl.com,
URBAN HEAT ISLAND IN SEOUL
 URBAN HEAT ISLAND IN SEOUL Jong-Jin Baik *, Yeon-Hee Kim ** *Seoul National University; ** Meteorological Research Institute/KMA, Korea Abstract The spatial and temporal structure of the urban heat island
5) The amount of heat needed to raise the temperature of 1 gram of a substance by 1 C is called: Page Ref: 69
 The amount of heat needed to raise the temperature of 1 gram of a substance by 1 C is called: Page Ref: 69") Homework #2 Due 9/19/14 1) If the maximum temperature for a particular day is 26 C and the minimum temperature is 14 C, what would the daily mean temperature be? (Page Ref: 66) 2) How is the annual mean
Homework #2 Due 9/19/14 1) If the maximum temperature for a particular day is 26 C and the minimum temperature is 14 C, what would the daily mean temperature be? (Page Ref: 66) 2) How is the annual mean
Worksheet: The Climate in Numbers and Graphs
 Worksheet: The Climate in Numbers and Graphs Purpose of this activity You will determine the climatic conditions of a city using a graphical tool called a climate chart. It represents the long-term climatic
Water Balance in the Murray-Darling Basin and the recent drought as modelled with WRF
 18 th World IMACS / MODSIM Congress, Cairns, Australia 13-17 July 2009 http://mssanz.org.au/modsim09 Water Balance in the Murray-Darling Basin and the recent drought as modelled with WRF Evans, J.P. Climate
Lecture 4 Air Temperature. Measuring Temperature. Measuring Temperature. Surface & Air Temperature. Environmental Contrasts 3/27/2012
 Lecture 4 Air Temperature Geo210 An Introduction to Physical Geography Temperature Concepts and Measurement Temperature the average kinetic energy (motion) of molecules of matter Temperature Scales Fahrenheit
Quality Assurance and Quality Control
 Quality Assurance and Quality Control of Surface Observations in JMA Japan Meteorological Agency Hakaru MIZUNO "Guide to Meteorological Instruments and Methods of Observation", WMO-No.8, 7th ed., 2008.
DAILY AIR TEMPERATURE AND PRESSURE SERIES FOR STOCKHOLM ( ) 1. Introduction
 1. Introduction") DAILY AIR TEMPERATURE AND PRESSURE SERIES FOR STOCKHOLM (1756 1998) ANDERS MOBERG 1, HANS BERGSTRÖM 2, JOSEFIN RUIZ KRIGSMAN 1 and OLA SVANERED 1 1 Department of Physical Geography and Quaternary Geology,
DAILY AIR TEMPERATURE AND PRESSURE SERIES FOR STOCKHOLM (1756 1998) ANDERS MOBERG 1, HANS BERGSTRÖM 2, JOSEFIN RUIZ KRIGSMAN 1 and OLA SVANERED 1 1 Department of Physical Geography and Quaternary Geology,
Weather & Climate of Virginia
 Weather & Climate of Virginia Robert E. Davis Professor of Climatology Dept. of Environmental Sciences University of Virginia Email: red3u@virginia.edu Rivanna Master Naturalists March 14, 2017 Arctic