Homogenization of monthly and daily climatological time series
|
|
|
- Sheena Johns
- 5 years ago
- Views:
Transcription
1 Homogenization of monthly and daily climatological time series Petr Štěpánek Czech Hydrometeorological Institute, Czech Republic Latsis Foundation 1st International Summer School Environment: Climate Climate change - Impacts
2 Climatological studies Measuring and collecting data
3 Climatological studies Measuring data Data quality control and 0.8 Homogenization
4 Climatological studies Measuring data Homogenization Data Analysis

5 Processing before any data analysis Software AnClim, ProClimDB
6 Data Quality Control Finding Outliers Two main approaches: Using limits derived from interquartile ranges (time series) -2.0 comparing values to values of -4.0 neighbouring stations (spatial analysis) Quality control Homogenization Data Analysis

7 Homogenization Change of measuring conditions inhomogeneities
8 Inhomogeneity Detection Absolute Homogeneity Testing 3,0 2,0 Praha - Klementinum 1,0 0,0-1,0-2,0-3,0-4,
9 Inhomogeneity Detection Absolute Homogeneity Testing Relative Homogeneity Testing (differences with reference series) 1,5 1,0 0,5 0,0-0,5-1,0-1,5-2,0 Diference Praha - Klementinum a průměrovaná řada okolí ČR
10 Relative Homogeneity Testing Creating reference Series
11 Relative Homogeneity Testing Creating reference Series Tests of homogeneity
12 Relative Homogeneity Testing Creating reference Series Tests of homogeneity Assessing homogeneity - Metadata - Physically justified - undoubted inhomogeneity
13 Relative Homogeneity Testing Creating reference Series Tests of homogeneity Assessing homogeneity - Metadata - Physically justified - undoubted inhomogeneity Adjusting Series
14 Inhomogeneity Detecting by SNHT (p=0.05, 950 series) Inhomogeneities detected/ % Error /years > Amount of change in level / C
15 Assessing Homogeneity Problems: most of metadata incomplete we depend upon statistical tests results
16 Assessing Homogeneity Problems: most of metadata incomplete we depend upon statistical tests results uncertainty in test results - right inhomogeneity detection is problematic (for smaller amount of change)
17 Proposed solution To get as many test results for each candidate series as possible Ensemble approach - processing of big amount of test results for each individual series
18 Adventages of the Ensemble approach we know relevance (probability) of each inhomogeneity we can easily assess quality of measurements for series as a whole
19 How to increase number of test results Monthly, Seasonal and How to increase Data Processing number of test Annual results Averages Quality Control - Outliers Interquartile Range Comparing to Neighbours Combining Near Stations Homogeneity Testing Alexandersson test Bivariate Test t-test Mann-Whitney-Pettit from Correlations Reference Series from Distances Several Iterations Hom. Assessment Probability Adjusting Data Filling Miss. Values Days, Months, seasons, year
 limit correlation, limit distance limit difference in altitudes neighbouring stations series should be standardized to")
20 Creating Reference Series for monthly, daily data (each month individually) weighted/unweighted mean from neighbouring stations criterions used for stations selection (or combination of it): best correlated / nearest neighbours (correlations from the first differenced series) limit correlation, limit distance limit difference in altitudes neighbouring stations series should be standardized to test series AVG and / or STD (temperature - elevation, precipitation - variance) - missing data are not so big problem then
21 Relative homogeneity testing Available statistical tests: Alexandersson SNHT Bivariate test of Maronna and Yohai Mann Whitney Pettit test t-test Easterling and Peterson test Vincent method 20 year parts of the daily series (40 for monthly series with 10 years overlap), in SNHT splitting into subperiods in position of detected significant changepoint (30-40 years per one inhomogeneity)
22 Homogeneity Tests Alexandersson s SNHT Alexandersson Standart Normal Homogeneity Test (Single shift test) Reference series: k q i = Y /{[ ρ X Y / X j ]/ ρ } i j= 1 k 2 j ji k j= 1 2 j q i = Yi { ρ j [ X ji X j + Y ]/ ρ j } j= 1 2 k j= Null and alternative hypothesis: H 0 : z i N(0,1), i {1,..,n}. H 1 : z i N(μ 1,1), i {1,..,a}, z i N(μ 2,1), i {a+1,..,n}, for 1? a < n a μ 1? μ 2. z i = (q i - q )/s q, z i N(0,1) Test statistic: 2 2 T 0 = max {Ta} 1 a< n 1 = max { az1 + ( n a) z 2} 1 a< n 1 where z a 1 1 = z i, ( z 1? μ a 1), Quality control í = 1 n z 1 Homogenization 2 = z i, ( z 2? μ ( n a) 2). í = a+ 1 Data Analysis
23 Homogeneity Tests Bivariate Test of Maronna and Yohai Bivariate Test Null and alternative hypothesis: H 0 : vectors {x i,y i } bivariate normal distributed N(μ x, μ y, σ 2 x, σ 2 y, ρ) H 1 : pro 0<i 0 <n a d? 0 - N(μ x, μ y, σ 2 x, σ 2 y, ρ) pro i? i 0 N(μ x, μ y+d, σ 2 x, σ 2 y, ρ) pro i > i 0. Test statistic: T 0 = max{t } i<n i i where: X i = 1 / i x j, Y i = 1 / i y j, X = X n, Y = Yn n j= 1 i j= S x = ( x j X ), S y = ( y j Y), S xy = ( x j X )( y j Y), j = 1 n j= 1 2 F i = S x ( X i X ) ni /( n i), i<n, D i = S x ( Y Yi ) S xy( X X i ) n /[( n i) Fi ], 2 i 2 xy T i =[ i( n i) D F ]/( S S S ) i x y n j= 1
24 Homogeneity Tests Two-phase linear regression (Vincent Technique, Easterling and Peterson test) Easterling and Peterson Test statistic: U = [(RSS 1 -RSS 2 )/3]/[RSS 2 /(n-4)]? F(3,n-4) t-test: differences of levels before and after a discontinuity
25 Homogeneity assessment Various outputs created for better inhomogeneities assessment Combining results with information from metadata whenever possible Decision about undoubted inhomogeneities (without metadata) coincidence of test results
26 Homogeneity assessment Output example: Station Čáslav, 3rd segment, , n=40 Test Ref I II III IV V VI VII VIII IX X XI XII Win Spr Sum Aut Year A avg A 1930 A corr A A dist A B avg B 1922 B corr B B 1937 B dist B V corr V V 1937 V dist V 1918
27 Homogeneity assessment, Output II example: Begin End Length InHomogen eity Number % detected inhom % possible inhom End Missin g Summed numbers of detections for individual years
28 Homogeneity assessment combining several outputs (sums of detections in individual years, metadata, graphs of differences/ratios, ) ID ELYEAR_BEGINEND YEAR_COUNY_POSSIBL YEAMIS X_BEGIN_DX_END_DATX_X_L L ABREMARKC C_ x B1BOJK01 x # # Bchange B1BOJK01 x # # obs V B B1BYSH01 x ? B1BYSH01 x ? B1BYSH01 x ? B1HLHO01 x B1HOLE01 x B1KROM01 x xb1rade01x # # Rchange B1RADE01 x # # obs JoB x B1RYCH01 x # # Vchange B1RYCH01 x # # obs MB xx? B1STRZ01 x B1STRZ01 x B1UHBR01 x # # Uchange B1UHBR01 x # # obs JoB x B1UHBR01 x # # Uchange B1UHBR01 x # # obs JoB B1VELI01 x ? B1VELI01 x ? B1VKLO01 x x B1VYSK01 x # # Vchange B1VYSK01 x # # obs V B B2BOSK01_rx B2BREC01 x B2BRUM01 x # # Bchange B2BRUM01 x # # obs MB
29 Adjusting monthly data using reference series based on correlations adjustment: from differences/ratios 20 years before and after a change, monhtly smoothing monthly adjustments (low-pass filter for adjacent values) I II III IV V VI VII VIII IX X XI XII
30 Iterative homogeneity testing several iteration of testing and results evaluation several iterations of homogeneity testing and series adjusting (3 iterations should be sufficient) question of homogeneity of reference series is thus solved: possible inhomogeneities should be eliminated by using averages of several neighbouring stations if this is not true: in next iteration neighbours should be already homogenized
31 Filling missing values Before homogenization: influence on right inhomogeneity detection After homogenization: more precise - data are not influenced by possible shifts in the series Dependence of tested series on reference series
32 Example: CZ, air temperature (200 stations, ) Number of significant inhomogeneities before and after homogenization (p=0.05) 2500 Before After I II III IV V VI VII VIII IX X XI XII Before After 0 Win Spr Sum Aut Year
33 Amount of adjustments for homogenised series (absolute values) - median C I II III IV V VI VII VIII IX X XI XII Correlation coefficients between candidate and reference series before and after homogenization (median) 1.00 Before After I II III IV V VI VII VIII IX X XI XII
34 Example: CZ, precipitation (800 stations, ) 4 tests, 4 reference series, 12 months + 4 seasons and year Number of detected inhomogeneities (significant) 6000 Number of detections I II III IV V VI VII VIII IX X XI XII Month
35 Amount of change (ratios standardized to be >1.0), precipitation (reference series calculation based on correlations) Amount of change (standardized) I II III IV V VI VII VIII IX X XI XII Boxplots: -Median - Upper and lower quartiles (for 589 testes series) Correlation improvement Correlation increase I II III IV V VI VII VIII IX X XI XII
36 Inhomogeneities in summer versus in winter, Air temperature Change of measuring conditions at the station (relocation etc.) is manifested in the series mainly in summer in winter: active surface role is diminished, prevailng circulation factors, in summer: active surface role increases, prevailing radiation factors
37 Inhomogeneities in summer versus in winter, Precipitation Change of measuring conditions at the station (relocation etc.) is manifested in the series mainly in winter in winter: errors of measurement (solid precipitation -wind, )
38 Homogenization Final remarksr emarks, recommendations 1/3 data quality control before homogenization is of very importance (if it is not part of it) Using series of observation hours (complementarily to daily AVG) is highly recommended (different manifestation of breaks) be aware of annual cycle of inhomogeneities, adjustments, to know behavior of spatial correlations (of element being processed) to be able to create reference series of sufficient quality
39 Homogenization Final remarksr emarks, recommendations 2/3 Because of Noise in the time series it makes sense: - Ensemble approach to homogenization (combining information from different statistical tests, time frames, overlapping periods, reference series, meteorological elements, ) - more information for inhomogeneities assessment higher quality of homogenization in case metadata are incomplete
40 Homogenization of daily values, remarks 3/3 Correlation coefficients (tested versus reference series) are slightly lower (compared to monthly data), but still high enough (around 0.9 even in case precipitation) Advantage: reliable inhomogeneities detection near the ends of series Complementary information to monthly and seasonal values detections (but problems with distribution, autocorrelations, ) Correction of daily data: delta method, if applied, it should be discriminated with regard to other parameters like cloudiness, Variable correction (such as HOM) seems to be a good choice (preserving CDF)
41 Software used for data processing LoadData - application for downloading data from central database (e.g. Oracle) ProClimDB software for processing whole dataset (finding outliers, combining series, creating reference series, preparing data for homogeneity testing, extreme value analysis, RCM outputs validation, correction, ) AnClim software for homogeneity testing limahom.eu
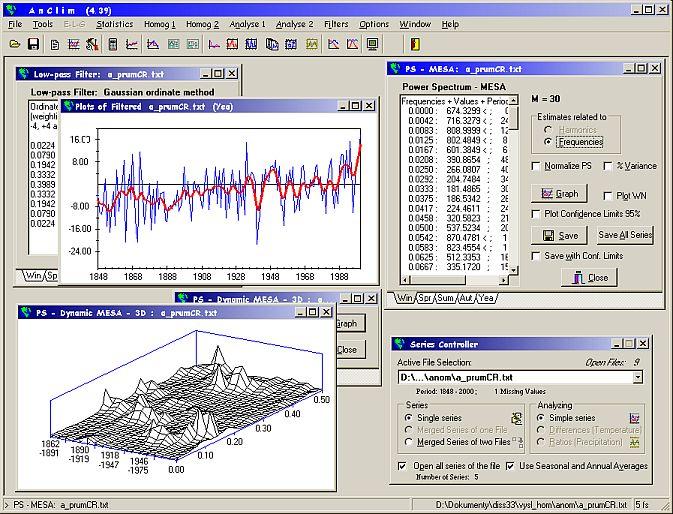
42 AnClim software AnClim software

43 Examples of Data formats AnClim, monthly data

44 Examples of Data formats AnClim, daily data

45 ProClimDB software ProcData software
46 limahom.eu
47 ACTION COST-ES0601: Advances in homogenisation methods of climate series: an integrated approach (HOME) 03/05/ End date: 02/05/2011, Year: 3 Inventory of existing detection and correction methods Compilation of a benchmark dataset with (un)known inhomogeneities Selection, comparison and evaluation of existing detection and correction (including those not traditionally used in climatology) Objective analysis of advantages and/or disadvantages of existing methods (benchmark) Investigation in further improvements of methods Documentation of practical recommendations Presentation and release of a new common method
AIR TEMPERATURE FLUCTUATION IN THE CZECH REPUBLIC IN THE PERIOD
 PRACE GEOGRAFICZNE, zeszyt 107 Instytut Geografii UJ Kraków 2000 Rudolf Brázdil, Petr Štěpánek, Vít Květoň AIR TEMPERATURE FLUCTUATION IN THE CZECH REPUBLIC IN THE PERIOD 1961 1999 Abstract: For 95 meteorological
Extreme precipitation events in the Czech Republic in the context of climate change
 Adv. Geosci., 14, 251 255, 28 www.adv-geosci.net/14/251/28/ Author(s) 28. This work is licensed under a Creative Coons License. Advances in Geosciences Extreme precipitation events in the Czech Republic
Introduction to Climate Data Homogenization techniques
 Introduction to Climate Data Homogenization techniques By Thomas Peterson Using material stolen from Enric Aguilar* CCRG Geography Unit Universitat Rovira i Virgili de Tarragona Spain * Who in turn stole
TEMPERATURE AND PRECIPITATION CHANGES IN TÂRGU- MURES (ROMANIA) FROM PERIOD
 FROM PERIOD") TEMPERATURE AND PRECIPITATION CHANGES IN TÂRGU- MURES (ROMANIA) FROM PERIOD 1951-2010 O.RUSZ 1 ABSTRACT. Temperature and precipitation changes in Târgu Mures (Romania) from period 1951-2010. The analysis
TEMPERATURE AND PRECIPITATION CHANGES IN TÂRGU- MURES (ROMANIA) FROM PERIOD 1951-2010 O.RUSZ 1 ABSTRACT. Temperature and precipitation changes in Târgu Mures (Romania) from period 1951-2010. The analysis
IDŐJÁRÁS Quarterly Journal of the Hungarian Meteorological Service Vol. 117, No. 1, January March 2013, pp
 IDŐJÁRÁS Quarterly Journal of the Hungarian Meteorological Service Vol. 117, No. 1, January March 2013, pp. 35-45 Climatological series shift test comparison on running windows José A. Guijarro State Meteorological
EFFICIENCIES OF HOMOGENISATION METHODS: OUR PRESENT KNOWLEDGE AND ITS LIMITATION
 EFFICIENCIES OF HOMOGENISATION METHODS: OUR PRESENT KNOWLEDGE AND ITS LIMITATION Peter Domonkos 1, Victor Venema 2 and Olivier Mestre 3 1 Center for Climate Change, Univ. Rovira i Virgili, Campus Terres
2.10 HOMOGENEITY ASSESSMENT OF CANADIAN PRECIPITATION DATA FOR JOINED STATIONS
 2.10 HOMOGENEITY ASSESSMENT OF CANADIAN PRECIPITATION DATA FOR JOINED STATIONS Éva Mekis* and Lucie Vincent Meteorological Service of Canada, Toronto, Ontario 1. INTRODUCTION It is often essential to join
Homogenization of the total ozone amount series derived from NOAA/TOVS data
 Homogenization of the total ozone amount series derived from NOAA/TOVS data B.Lapeta 1, I.Dyras 1, Z.Ustrnul 2 1 Institute of Meteorology and Water Management, ul. Borowego 14, 30-215 Krakow, Poland e-mail:
Homogenization of the Hellenic cloud amount time series
 Homogenization of the Hellenic cloud amount time series A Argiriou 1, A Mamara 2, E Dimadis 1 1 Laboratory of Atmospheric Physics, 2 Hellenic Meteorological Service October 19, 2017 A Argiriou 1, A Mamara
Global solar radiation: comparison of satellite and ground based observations
 Global solar radiation: comparison of satellite and ground based observations Petr Skalak 1,2, Piotr Struzik 3, Aleš Farda 2,1, Pavel Zahradníček 2,1, Petr Štěpánek 2,1 1) Czech Hydrometeorological Institute,
Transition Passage to Descriptive Statistics 28
 viii Preface xiv chapter 1 Introduction 1 Disciplines That Use Quantitative Data 5 What Do You Mean, Statistics? 6 Statistics: A Dynamic Discipline 8 Some Terminology 9 Problems and Answers 12 Scales of
Identification of Inhomogeneities in Precipitation Time Series Using Stochastic Simulation
 Identification of Inhomogeneities in Precipitation Time Series Using Stochastic Simulation A. C. M. Costa, J. Negreiros and A. Soares Abstract Accurate quantification of observed precipitation variability
Series homogenization, missing data filling and gridded products with Climatol
 Series homogenization, missing data filling and gridded products with Climatol José A. Guijarro State Meteorological Agency (AEMET), Balearic Islands Office, Spain 11 th EUMETNET Data Management Workshop
A quantile matching adjustment algorithm for Gaussian data series
 A quantile matching adjustment algorithm for Gaussian data series Xiaolan L. Wang Climate Research Division, Science and Technology Branch Environment Canada, Toronto, Canada December 3, 2009 The Quantile
A New Monthly Precipitation Climatology for the Global Land Areas for the Period 1951 to Ch. Beck, J. Grieser and Bruno Rudolf
 Klimastatusbericht 2004 DWD 181 A New Monthly Precipitation Climatology for the Global Land Areas for the Period 1951 to 2000 Ch. Beck, J. Grieser and Bruno Rudolf 1 INTRODUCTION Globally gridded precipitation-data
Reconstructing sunshine duration and solar radiation long-term evolution for Italy: a challenge for quality control and homogenization procedures
 14th IMEKO TC10 Workshop Technical Diagnostics New Perspectives in Measurements, Tools and Techniques for system s reliability, maintainability and safety Milan, Italy, June 27-28, 2016 Reconstructing
A complete daily precipitation database for northeast Spain: reconstruction, quality control, and homogeneity
 INTERNATIONAL JOURNAL OF CLIMATOLOGY Int. J. Climatol. 3: 1146 1163 (21) Published online 27 May 21 in Wiley InterScience (www.interscience.wiley.com) DOI: 1.12/joc.185 A complete daily precipitation database
Homogenization of Temperature Series via Pairwise Comparisons
 1700 J O U R N A L O F C L I M A T E VOLUME 22 Homogenization of Temperature Series via Pairwise Comparisons MATTHEW J. MENNE AND CLAUDE N. WILLIAMS JR. NOAA/National Climatic Data Center, Asheville, North
Homogenization of Daily Temperatures over Canada
 1322 JOURNAL OF CLIMATE Homogenization of Daily Temperatures over Canada LUCIE A. VINCENT AND X. ZHANG Climate Research Branch, Meteorological Service of Canada, Downsview, Ontario, Canada B. R. BONSAL
Lisa Hannak Karsten Friedrich, Florian Imbery, Frank Kaspar Deutscher Wetterdienst National climate monitoring
 Changes in the measurement systems and the impact on the homogeneity of long time series A study based on parallel measurements from German reference stations Lisa Hannak (Lisa.Hannak@dwd.de) Karsten Friedrich,
Attributes of Several Methods for Detecting Discontinuities in Mean Temperature Series
 838 J O U R N A L O F C L I M A T E VOLUME 19 Attributes of Several Methods for Detecting Discontinuities in Mean Temperature Series ARTHUR T. DEGAETANO Northeast Regional Climate Center, Department of
Ensemble approach to the homogenisation of monthly climate records in Slovenia
 MINISTRY OF AGRICULTURE AND ENVIRONMENT SLOVENIAN ENVIRONMENT AGENCY Ensemble approach to the homogenisation of monthly climate records in Slovenia Gregor Vertačnik Meteorological Office, ARSO gregor.vertacnik@gov.si
THE ÅS TEMPERATURE SERIES IN SOUTHERN NORWAY HOMOGENEITY TESTING AND CLIMATE ANALYSIS
 Bulletin of Geography Physical Geography Series No 7/2014: 7 26 http://dx.doi.org/10.2478/bgeo-2014-0001 HERDIS M. GJELTEN 1, 2, ØYVIND NORDLI 2, ARNE A. GRIMENES 1 AND ELIN LUNDSTAD 2 1 Department of
Biases in precipitation records found in parallel measurements
 Biases in precipitation records found in parallel measurements Petr Stepanek (1,2), Enric Aguilar (3), Victor Venema (4), Renate Auchmann (5), Fabricio Daniel dos Santos Silva (6), Erik Engström (7), Alba
10/27/2015. Content. Well-homogenized national datasets. Difference (national global) BEST (1800) Difference BEST (1911) Difference GHCN & GISS (1911)
 BEST (1800) Difference BEST (1911) Difference GHCN & GISS (1911)") Content Is the global mean temperature trend too low? Victor Venema, Phil Jones, Ralf Lindau, Tim Osborn and numerous collaborators @VariabilityBlog variable-variability.blogspot.com 1. Comparison trend
Content Is the global mean temperature trend too low? Victor Venema, Phil Jones, Ralf Lindau, Tim Osborn and numerous collaborators @VariabilityBlog variable-variability.blogspot.com 1. Comparison trend
HOMOGENIZATION OF SWEDISH TEMPERATURE DATA. PART I: HOMOGENEITY TEST FOR LINEAR TRENDS
 INTERNATIONAL JOURNAL OF CLIMATOLOGY, VOL. 17, 25 34 (1997) HOMOGENIZATION OF SWEDISH TEMPERATURE DATA. PART I: HOMOGENEITY TEST FOR LINEAR TRENDS HANS ALEXANDERSSON 1 AND ANDERS MOBERG 2 1 Swedish Meteorological
Hindcasting Wave Conditions on the North American Great Lakes
 Hindcasting Wave Conditions on the North American Great Lakes D. Scott 1, D. Schwab 2, C. Padala 1, and P. Zusek 1 1. & Associates 2. Great Lakes Environmental Research Laboratory, NOAA Lake Ontario 310
An introduction to homogenisation
 An introduction to homogenisation WMO-ETSCI Workshop, Pune 3-7 October 2016 Acacia Pepler Australian Bureau of Meteorology What do we want? A perfect station A well-situated and maintained station with
A re-sampling based weather generator
 A re-sampling based weather generator Sara Martino 1 Joint work with T. Nipen 2 and C. Lussana 2 1 Sintef Energy Resources 2 Norwegian Metereologic Institute Berlin 19th Sept. 2017 Sara Martino Joint work
Unit 2. Describing Data: Numerical
 Unit 2 Describing Data: Numerical Describing Data Numerically Describing Data Numerically Central Tendency Arithmetic Mean Median Mode Variation Range Interquartile Range Variance Standard Deviation Coefficient
Homogenisation of Pau Maximum Temperatures. Content. Causes of inhomogeneities. Homogenisation: WHY? Example of PAU-UZEIN temperature
 Homogenisation of monthly and daily temperature and precipitation data Meteorologisches Kolloquium, Freie Universität Berlin, 14. Januar 2013 Content Inhomogeneities in climate data Homogenization Validation
Appendix D. Model Setup, Calibration, and Validation
 . Model Setup, Calibration, and Validation Lower Grand River Watershed TMDL January 1 1. Model Selection and Setup The Loading Simulation Program in C++ (LSPC) was selected to address the modeling needs
Contents. Acknowledgments. xix
 Table of Preface Acknowledgments page xv xix 1 Introduction 1 The Role of the Computer in Data Analysis 1 Statistics: Descriptive and Inferential 2 Variables and Constants 3 The Measurement of Variables
Global Warming degrees over the last 50 years (e.g., IPCC)
") Global Warming 0.5 1.0 degrees over the last 50 years (e.g., IPCC) Global Dimming (?) 10 20% decrease in surface solar radiation over the period 1950 1990 Pan Evaporation Paradox If climate is warming,
Global Warming 0.5 1.0 degrees over the last 50 years (e.g., IPCC) Global Dimming (?) 10 20% decrease in surface solar radiation over the period 1950 1990 Pan Evaporation Paradox If climate is warming,
A re-sampling based weather generator
 A re-sampling based weather generator Sara Martino 1 Joint work with T. Nipen 2 and C. Lussana 2 1 Sintef Energy Resources 2 Norwegian Metereologic Institute Stockholm 7th Dec. 2017 Sara Martino Joint
Global temperature trend biases and statistical homogenization methods
 Global temperature trend biases and statistical homogenization methods Victor Venema & Ralf Lindau @VariabilityBlog variable-variability.blogspot.com Outline talk Early warming (1850 to 1920, red rectangle)
XI. DIFFUSE GLOBAL CORRELATIONS: SEASONAL VARIATIONS
 XI. DIFFUSE GLOBAL CORRELATIONS: SEASONAL VARIATIONS Estimating the performance of a solar system requires an accurate assessment of incident solar radiation. Ordinarily, solar radiation is measured on
Mining Imperfect Data
 Mining Imperfect Data Dealing with Contamination and Incomplete Records Ronald K. Pearson ProSanos Corporation Harrisburg, Pennsylvania and Thomas Jefferson University Philadelphia, Pennsylvania siam.
STATISTICS 174: APPLIED STATISTICS FINAL EXAM DECEMBER 10, 2002
 Time allowed: 3 HOURS. STATISTICS 174: APPLIED STATISTICS FINAL EXAM DECEMBER 10, 2002 This is an open book exam: all course notes and the text are allowed, and you are expected to use your own calculator.
Analysis of temperature series: estimation of missing data and homogeneity test
 METEOROLOGICAL APPLICATIONS Meteorol. Appl. 19: 397 46 (12) Published online 3 June 11 in Wiley Online Library (wileyonlinelibrary.com) DOI:.2/met.271 Analysis of temperature series: estimation of missing
Efficiencies of inhomogeneity-detection algorithms: comparison of different detection methods and efficiency measures
 1 Efficiencies of inhomogeneity-detection algorithms: comparison of different detection methods and efficiency measures Peter Domonkos University of Rovira i Virgili, Centre for Climate Change, Campus
Analysis. Components of a Time Series
 Module 8: Time Series Analysis 8.2 Components of a Time Series, Detection of Change Points and Trends, Time Series Models Components of a Time Series There can be several things happening simultaneously
Issues in estimating past climate change at local scale.
 14th EMS Annual Meeting, Prague Oct. 6th 2014 Issues in estimating past climate change at local scale. Case study: the recent warming (1959-2009) over France. Lola Corre (Division de la Climatologie, Météo-France)
Estimating Design Rainfalls Using Dynamical Downscaling Data
 Estimating Design Rainfalls Using Dynamical Downscaling Data Ke-Sheng Cheng Department of Bioenvironmental Systems Engineering Mater Program in Statistics National Taiwan University Introduction Outline
The Australian Operational Daily Rain Gauge Analysis
 The Australian Operational Daily Rain Gauge Analysis Beth Ebert and Gary Weymouth Bureau of Meteorology Research Centre, Melbourne, Australia e.ebert@bom.gov.au Daily rainfall data and analysis procedure
Met Éireann Climatological Note No. 15 Long-term rainfall averages for Ireland,
 Met Éireann Climatological Note No. 15 Long-term rainfall averages for Ireland, 1981-2010 Séamus Walsh Glasnevin Hill, Dublin 9 2016 Disclaimer Although every effort has been made to ensure the accuracy
STP 420 INTRODUCTION TO APPLIED STATISTICS NOTES
 INTRODUCTION TO APPLIED STATISTICS NOTES PART - DATA CHAPTER LOOKING AT DATA - DISTRIBUTIONS Individuals objects described by a set of data (people, animals, things) - all the data for one individual make
Collection, management and use of observational data in Romania
 Collection, management and use of observational data in Romania Constanta Boroneant National Meteorological Admnistration, Climate Research Group Bucharest, Romania WMO CCl OPAG1 ET1.2- Expert Team on
SEASONAL AND ANNUAL TRENDS OF AUSTRALIAN MINIMUM/MAXIMUM DAILY TEMPERATURES DURING
 SEASONAL AND ANNUAL TRENDS OF AUSTRALIAN MINIMUM/MAXIMUM DAILY TEMPERATURES DURING 1856-2014 W. A. van Wijngaarden* and A. Mouraviev Physics Department, York University, Toronto, Ontario, Canada 1. INTRODUCTION
C1: From Weather to Climate Looking at Air Temperature Data
 C1: From Weather to Climate Looking at Air Temperature Data Purpose Students will work with short- and longterm air temperature data in order to better understand the differences between weather and climate.
Climate Downscaling 201
 Climate Downscaling 201 (with applications to Florida Precipitation) Michael E. Mann Departments of Meteorology & Geosciences; Earth & Environmental Systems Institute Penn State University USGS-FAU Precipitation
The Trend Analysis Of Rainfall In The Wainganga River Basin, India
 Journal of Engineering Research and Application ISSN : 2248-9622, PP 29-33 RESEARCH ARTICLE OPEN ACCESS The Trend Analysis Of Rainfall In The Wainganga River Basin, India Malyala Phalguna*, Ashwini B.Mirajkar**
Estimating the slope and standard error of a long-term. linear trend fitted to adjusted annual temperatures
 Estimating the slope and standard error of a long-term linear trend fitted to adjusted annual temperatures Brett Mullan National Institute of Water and Atmospheric Research New Zealand Stephen Stuart National
Seasonal forecasting of climate anomalies for agriculture in Italy: the TEMPIO Project
 Seasonal forecasting of climate anomalies for agriculture in Italy: the TEMPIO Project M. Baldi(*), S. Esposito(**), E. Di Giuseppe (**), M. Pasqui(*), G. Maracchi(*) and D. Vento (**) * CNR IBIMET **
HadISD: Sub-daily data for studying extreme events. Robert Dunn Kate Willett, David Parker (Met Office), Peter Thorne (NERSC)+others
, Peter Thorne (NERSC)+others") HadISD: Sub-daily data for studying extreme events Robert Dunn Kate Willett, David Parker (Met Office), Peter Thorne (NERSC)+others C20C, 7th November 2013 Contents HadISD QC checks & Validation Example
HadISD: Sub-daily data for studying extreme events Robert Dunn Kate Willett, David Parker (Met Office), Peter Thorne (NERSC)+others C20C, 7th November 2013 Contents HadISD QC checks & Validation Example
Reduced Overdispersion in Stochastic Weather Generators for Statistical Downscaling of Seasonal Forecasts and Climate Change Scenarios
 Reduced Overdispersion in Stochastic Weather Generators for Statistical Downscaling of Seasonal Forecasts and Climate Change Scenarios Yongku Kim Institute for Mathematics Applied to Geosciences National
Graphical Techniques Stem and Leaf Box plot Histograms Cumulative Frequency Distributions
 Class #8 Wednesday 9 February 2011 What did we cover last time? Description & Inference Robustness & Resistance Median & Quartiles Location, Spread and Symmetry (parallels from classical statistics: Mean,
4.5 Comparison of weather data from the Remote Automated Weather Station network and the North American Regional Reanalysis
 4.5 Comparison of weather data from the Remote Automated Weather Station network and the North American Regional Reanalysis Beth L. Hall and Timothy. J. Brown DRI, Reno, NV ABSTRACT. The North American
DETAILED CONTENTS PART I INTRODUCTION AND DESCRIPTIVE STATISTICS. 1. Introduction to Statistics
 DETAILED CONTENTS About the Author Preface to the Instructor To the Student How to Use SPSS With This Book PART I INTRODUCTION AND DESCRIPTIVE STATISTICS 1. Introduction to Statistics 1.1 Descriptive and
Temporal validation Radan HUTH
 Temporal validation Radan HUTH Faculty of Science, Charles University, Prague, CZ Institute of Atmospheric Physics, Prague, CZ What is it? validation in the temporal domain validation of temporal behaviour
Homogenization of Tianjin monthly near-surface wind speed using RHtestsV4 for
 Theor Appl Climatol (2018) 132:1303 1320 DOI 10.1007/s00704-017-2140-7 ORIGINAL PAPER Homogenization of Tianjin monthly near-surface wind speed using RHtestsV4 for 1951 2014 Peng Si 1 & Chuanjun Luo 1
Large scale circulation patterns associated to seasonal dry and wet conditions over the Czech Republic
 Large scale circulation patterns associated to seasonal dry and wet conditions over the Czech Republic C. BORONEANT, V. POTOP, M. MOZNÝ3, P. ŠTEPÁNEK3, P. SKALÁK3 Center for Climate Change, Geography Dept.,
Gridding of precipitation and air temperature observations in Belgium. Michel Journée Royal Meteorological Institute of Belgium (RMI)
") Gridding of precipitation and air temperature observations in Belgium Michel Journée Royal Meteorological Institute of Belgium (RMI) Gridding of meteorological data A variety of hydrologic, ecological,
Gridding of precipitation and air temperature observations in Belgium Michel Journée Royal Meteorological Institute of Belgium (RMI) Gridding of meteorological data A variety of hydrologic, ecological,
Testing E-OBS European high-resolution gridded data set of daily precipitation and surface temperature
 JOURNAL OF GEOPHYSICAL RESEARCH, VOL. 114,, doi:10.1029/2009jd011799, 2009 Testing E-OBS European high-resolution gridded data set of daily precipitation and surface temperature Nynke Hofstra, 1,2 Malcolm
Reproduction of extreme temperature and precipitation events by two stochastic weather generators
 Reproduction of extreme temperature and precipitation events by two stochastic weather generators Martin Dubrovský and Jan Kyselý Institute of Atmospheric Physics ASCR, Prague, Czechia (dub@ufa.cas.cz,
IS THE LAST YEARS ABRUPT WARMING IN THE NATIONAL OBSERVATORY OF ATHENS RECORDS A CLIMATE CHANGE MANIFESTATION?
 Global NEST Journal, Vol 9, No 2, pp 107-116, 2007 Copyright 2007 Global NEST Printed in Greece. All rights reserved IS THE LAST YEARS ABRUPT WARMING IN THE NATIONAL OBSERVATORY OF ATHENS RECORDS A CLIMATE
Paper Reference. Statistics S1 Advanced/Advanced Subsidiary. Friday 5 June 2015 Morning Time: 1 hour 30 minutes
 Centre No. Candidate No. Paper Reference(s) 6683/01 Edexcel GCE Statistics S1 Advanced/Advanced Subsidiary Friday 5 June 2015 Morning Time: 1 hour 30 minutes Materials required for examination Mathematical
Drought Identification and Trend Analysis in Peloponnese, Greece
 European Water 60: 335-340, 2017. 2017 E.W. Publications Drought Identification and Trend Analysis in Peloponnese, Greece K. Saita, I. Papageorgaki * and H. Vangelis Lab. of Reclamation Works and Water
HOMOGENEITY AND QUALITY CONTROL OF LONG TIME SERIES OF DAILY TEMPERATURE IN URUGUAY
 JP2.21 HOMOGENEITY AND QUALITY CONTROL OF LONG TIME SERIES OF DAILY TEMPERATURE IN URUGUAY Matilde Rusticucci * Universidad de Buenos Aires, Buenos Aires, Argentina Madeleine Renom Universidad de la República,
Use of extended range and seasonal forecasts at MeteoSwiss
 Federal Department of Home Affairs FDHA Federal Office of Meteorology and Climatology MeteoSwiss Use of extended range and seasonal forecasts at MeteoSwiss Current use and ongoing developments Christoph
Glossary. The ISI glossary of statistical terms provides definitions in a number of different languages:
 Glossary The ISI glossary of statistical terms provides definitions in a number of different languages: http://isi.cbs.nl/glossary/index.htm Adjusted r 2 Adjusted R squared measures the proportion of the
Memorandum. Höfundur: Halldór Björnsson, Nikolai Nawri, Guðrún Elín Jóhannsdóttir and Davíð Egilson.
 EBV-007-1 Memorandum Date: 17.12.2015 Title: Estimation of evaporation and precipitation in Iceland Höfundur: Halldór Björnsson, Nikolai Nawri, Guðrún Elín Jóhannsdóttir and Davíð Egilson. Ref: 2015-69
Comparison of two interpolation methods for modelling crop yields in ungauged locations
 Comparison of two interpolation methods for modelling crop yields in ungauged locations M. Dubrovsky (1), M. Trnka (2), F. Rouget (3), P. Hlavinka (2) (1) Institute of Atmospheric Physics ASCR, Prague,
Climate Variables for Energy: WP2
 Climate Variables for Energy: WP2 Phil Jones CRU, UEA, Norwich, UK Within ECEM, WP2 provides climate data for numerous variables to feed into WP3, where ESCIIs will be used to produce energy-relevant series
The ISTI: Land surface air temperature datasets for the 21st Century
 The ISTI: Land surface air temperature datasets for the 21st Century WRCP Extremes, Feb 2015 Kate Willett, with thanks to many Initiative participants The real world observing system is not perfect US
Accuracy of Meteonorm ( )
") Accuracy of Meteonorm (7.1.6.14035) A detailed look at the model steps and uncertainties 22.10.2015 Jan Remund Contents The atmosphere is a choatic system, not as exactly describable as many technical
Accuracy of Meteonorm (7.1.6.14035) A detailed look at the model steps and uncertainties 22.10.2015 Jan Remund Contents The atmosphere is a choatic system, not as exactly describable as many technical
HOMOGENEITY AND TREND ANALYSIS OF TEMPERATURE FOR URBAN AND RURAL AREAS
 HOMOGENEITY AND TREND ANALYSIS OF TEMPERATURE FOR URBAN AND RURAL AREAS A.K.M. Saifuddin MEE09202 Supervisor: Prof. A. W. Jayawardena ABSTRACT The objective of this work is to study the temperature of
Homogenization of mean monthly temperature time series of Greece
 INTERNATIONAL JOURNAL OF CLIMATOLOGY Int. J. Climatol. 33: 2649 2666 (2013) Published online 1 November 2012 in Wiley Online Library (wileyonlinelibrary.com) DOI: 10.1002/joc.3614 Homogenization of mean
STATISTICS 479 Exam II (100 points)
") Name STATISTICS 79 Exam II (1 points) 1. A SAS data set was created using the following input statement: Answer parts(a) to (e) below. input State $ City $ Pop199 Income Housing Electric; (a) () Give the
Name STATISTICS 79 Exam II (1 points) 1. A SAS data set was created using the following input statement: Answer parts(a) to (e) below. input State $ City $ Pop199 Income Housing Electric; (a) () Give the
Seasonal and annual variation of Temperature and Precipitation in Phuntsholing
 easonal and annual variation of Temperature and Precipitation in Phuntsholing Leki Dorji Department of Civil Engineering, College of cience and Technology, Royal University of Bhutan. Bhutan Abstract Bhutan
HOW TYPICAL IS SOLAR ENERGY? A 6 YEAR EVALUATION OF TYPICAL METEOROLOGICAL DATA (TMY3)
") HOW TYPICAL IS SOLAR ENERGY? A 6 YEAR EVALUATION OF TYPICAL METEOROLOGICAL DATA (TMY3) Matthew K. Williams Shawn L. Kerrigan Locus Energy 657 Mission Street, Suite 401 San Francisco, CA 94105 matthew.williams@locusenergy.com
HOW TYPICAL IS SOLAR ENERGY? A 6 YEAR EVALUATION OF TYPICAL METEOROLOGICAL DATA (TMY3) Matthew K. Williams Shawn L. Kerrigan Locus Energy 657 Mission Street, Suite 401 San Francisco, CA 94105 matthew.williams@locusenergy.com
How reliable are selected methods of projections of future thermal conditions? A case from Poland
 How reliable are selected methods of projections of future thermal conditions? A case from Poland Joanna Wibig Department of Meteorology and Climatology, University of Łódź, Outline 1. Motivation Requirements
Verification of Continuous Forecasts
 Verification of Continuous Forecasts Presented by Barbara Brown Including contributions by Tressa Fowler, Barbara Casati, Laurence Wilson, and others Exploratory methods Scatter plots Discrimination plots
Enabling Climate Information Services for Europe
 Enabling Climate Information Services for Europe Report DELIVERABLE 6.5 Report on past and future stream flow estimates coupled to dam flow evaluation and hydropower production potential Activity: Activity
LONG -TERM OBSERVATIONS OF CLOUDNESS IN HURBANOVO
 LONG -TERM OBSERVATIONS OF CLOUDNESS IN HURBANOVO Tekušová Mária, Horecká Viera Slovak Hydrometeorological Institute in Bratislava, 83101 Bratislava, Slovakia Abstract. In our work, we are analyzed climatological
Uncertainties in multi-model climate projections
 *** EMS Annual Meeting *** 28.9. 2.10.2009 *** Toulouse *** Uncertainties in multi-model climate projections Martin Dubrovský Institute of Atmospheric Physics ASCR, Prague, Czech Rep. The study is supported
TABLE OF CONTENTS CHAPTER 1 COMBINATORIAL PROBABILITY 1
 TABLE OF CONTENTS CHAPTER 1 COMBINATORIAL PROBABILITY 1 1.1 The Probability Model...1 1.2 Finite Discrete Models with Equally Likely Outcomes...5 1.2.1 Tree Diagrams...6 1.2.2 The Multiplication Principle...8
Gridded observation data for Climate Services
 Gridded observation data for Climate Services Ole Einar Tveito, Inger Hanssen Bauer, Eirik J. Førland and Cristian Lussana Norwegian Meteorological Institute Norwegian annual temperatures Norwegian annual
are the objects described by a set of data. They may be people, animals or things.
 ( c ) E p s t e i n, C a r t e r a n d B o l l i n g e r 2016 C h a p t e r 5 : E x p l o r i n g D a t a : D i s t r i b u t i o n s P a g e 1 CHAPTER 5: EXPLORING DATA DISTRIBUTIONS 5.1 Creating Histograms
PREDICTING OVERHEATING RISK IN HOMES
 PREDICTING OVERHEATING RISK IN HOMES Susie Diamond Inkling Anastasia Mylona CIBSE Simulation for Health and Wellbeing 27th June 2016 - CIBSE About Inkling Building Physics Consultancy Susie Diamond Claire
Spain: Climate records of interest for MEDARE database. Yolanda Luna Spanish Meteorological Agency
 Spain: Climate records of interest for MEDARE database Yolanda Luna Spanish Meteorological Agency INTRODUCTION Official meteorological observations in Spain started in 1869, although prior to this date
Probability distributions of monthly-to-annual mean temperature and precipitation in a changing climate
 Probability distributions of monthly-to-annual mean temperature and precipitation in a changing climate Jouni Räisänen Department of Physics, University of Helsinki Climate probability distribution of
Application and verification of ECMWF products 2008
 Application and verification of ECMWF products 2008 RHMS of Serbia 1. Summary of major highlights ECMWF products are operationally used in Hydrometeorological Service of Serbia from the beginning of 2003.
Regional Climate Simulations with WRF Model
 WDS'3 Proceedings of Contributed Papers, Part III, 8 84, 23. ISBN 978-8-737852-8 MATFYZPRESS Regional Climate Simulations with WRF Model J. Karlický Charles University in Prague, Faculty of Mathematics
Section 3: Simple Linear Regression
 Section 3: Simple Linear Regression Carlos M. Carvalho The University of Texas at Austin McCombs School of Business http://faculty.mccombs.utexas.edu/carlos.carvalho/teaching/ 1 Regression: General Introduction
Drought and Climate Extremes Indices for the North American Drought Monitor and North America Climate Extremes Monitoring System. Richard R. Heim Jr.
 Drought and Climate Extremes Indices for the North American Drought Monitor and North America Climate Extremes Monitoring System Richard R. Heim Jr. NOAA/NESDIS/National Climatic Data Center Asheville,
1. How will an increase in the sample size affect the width of the confidence interval?
 Study Guide Concept Questions 1. How will an increase in the sample size affect the width of the confidence interval? 2. How will an increase in the sample size affect the power of a statistical test?
A procedure for the detection of undocumented multiple. Abrupt changes in the mean value of daily temperature. time series of a regional network
 INTERNATIONAL JOURNAL OF CLIMATOLOGY Int. J. Climatol. 33: 1107 1120 (2013) Published online 27 April 2012 in Wiley Online Library (wileyonlinelibrary.com) DOI: 10.1002/joc.3496 A procedure for the detection
Anahit Hovsepyan ARMSTATEHYDROMET Second WMO/MEDARE International Workshop May 2010, Nicosia, Cyprus
 Anahit Hovsepyan ARMSTATEHYDROMET ahovsepyan@sci.am Second WMO/MEDARE International Workshop 10-12 May 2010, Nicosia, Cyprus OUTLINE Armenia in brief Meteorological observation network Climate data and
NOAA s Climate Normals. Pre-release Webcast presented by NOAA s National Climatic Data Center June 13, 2011
 NOAA s 1981-2010 Climate Normals Pre-release Webcast presented by NOAA s National Climatic Data Center June 13, 2011 Takeaway Messages Most Normals will be available July 1 via FTP NWS Normals to be loaded