Permanent GPS Receiver Network in Northwestern Mexico
|
|
|
- Rebecca Ellen Willis
- 6 years ago
- Views:
Transcription
1 Permanent GPS Receiver Network in Northwestern Mexico E. R. Kursinski R. Bennett, R. Maddox, W. Kolczynski,, C. Minjares (U. Arizona) I. Minjares (UNISON)
2 Outline 1. GPS for addressing the need for water vapor observations in the NAM Tier 1 area 2. GPS instrumentation in NAM area 3. Selected Highlights of GPS NAME Future GPS-NAM network applications and ideas
3 1. Achieving the NAME objectives: The need for water vapor observations in the NAM area
4 Our Focus: Water Vapor in and around the SMO Goal: 4-D observations of water vapor, condensed water, temperature, pressure and winds Want to trace water vapor and condensed water from source to location & time of precipitation Very difficult to do No observations are fully capable of this Not sure how good the models are Analyses include moisture increments when observations are assimilated which lose track of the moisture path through the atmosphere
5 GPS Observation Information A network of GPS & surface observations provides a subset of the desired 4-D information: Diurnally-resolved water column and surface water at array of locations ~2.5-D Diurnally resolved near T & winds (~2-D) Denser network (and more clever processing) can start to provide more information through synergy: ex. water vapor winds Also (relatively inexpensive) long term monitoring for interannual variability

6 GPS Observing Geometry Typically 8 to 12 satellites line of sights (LOS) in view Determine atmospheric delay along each LOS Map each LOS delay to zenith delay Average the zenith delays to produce one zenith delay

7 Atmospheric Transformations in GPS-Met

8 GPS PW Instrumentation GPS GPS GPS GPS Antenna Barometer Puerto Penasco Thermometer Hygrometer
9 GPS PWV Accuracy Comparisons of GPS and Tucson radiosonde PWV indicate ~2 mm (1-sigma) discrepancies
10 2. GPS instrumentation in NAM Area
11 Existing Geodetic Network in North American Southwest


12 GPS PWV processed by NOAA FSL and Suominet From UA Atmospheric Sciences GPS PWV web site
13 UA & UNISON GPS NAME Instruments Site IDs Location Lat (ºN) Long (ºE) Elev. (m) Duration SA21/SA46 Tucson, AZ present SA24 Douglas, AZ present SA27 Hermosillo, Son present SA31 Phoenix, AZ present SA33 Puerto Peñasco, Son present NAM1/YESX Yecora, Son present NAM2 Creel, Chi NAM3 Tesopaco, Son NAM4 Mazatan, Son NAM5/USMX Moctezuma, Son present SA48 Tohono Oodham /2005-present
14 NAME GPS PW & Surface Obs.. Array R. Kursinski, R. Bennett, W. Kolczynski, M. Leuthold, R. Maddox, C. Minjarez I. Minjarez, C. Rarellan UNISON S. Gutman, K. Hollub FSL NOAA T. Van Hove UCAR U. Arizona Funded by NSF & NOAA Jay Fein Combine existing GPS instrumentation plus 5 new sets in Northwestern Mexico to Understand relation between PW and precipitation in and around the SMO Assess and improve knowledge and model representations of moisture and precipitation Monitor intra- & inter-annual variations Improve forecasting initialization
15 NAME GPS PW & Surface Obs.. Array Puerto Penasco Douglas Moctezuma Hermosillo Mazatan Yecora Tesopaco Creel Placed 7 additional instrumentation sets at 5 locations in Mexico GPS receiver, barometer, thermometer, hygrometer Measured column water vapor & surface meteorological conditions In convectively active area in SMO In clear and cloudy conditions (5 to) 30 minute sampling Resolved diurnal water vapor, temperature and pressure cycle Internet for near real-time access & monitoring FSL & Suominet provided GPS processing at 30 minute resolution Through end of NAME Summer 04 campaign

16 North American Monsoon Experiment (NAME)
17 3. NAME GPS Results Highlights
 Rain at Moctezuma Monsoon Onset at Yecora Rain at Yecora Pre-monsoon event The monsoon onset at Yecora comes earlier, on July 4.")
18 Yecora & Moctezuma PWV 2004 Monsoon Onset (at least) 2 scales evident: 1. Large scale flow of moisture 2. Hour to day-scale (created by moist convection?) Rain at Moctezuma Monsoon Onset at Yecora Rain at Yecora Pre-monsoon event The monsoon onset at Yecora comes earlier, on July 4. Yecora PWV then roughly levels off whereas Moctezuma PWV continues to grow. Moctezuma PWV grows appreciably higher than Yecora s 3 days later on July 7. June 14 July 24

19 Mazatan-Hermosillo Comparison mid-july through mid-september 2004 Mazatan functioning DOY 200 (July 18) Mazatan is ~90 km east of Hermosillo at edge of SMO Elevation: Hermosillo 217 m, Mazatan 549 m Puerto Penasco Douglas Moctezuma Hermosillo Mazatan Yecora Tesopaco Creel

20 Hermosillo & Mazatan PW & q Overall PW Correlation: 0.55 Bias: 4.27 mm Cor: 0.88 Bias: 2.63 Cor: 0.34 Bias: 5.21 Monsoon Post-Monsoon Cor: 0.46 Bias: mm Cor: 0.74 Bias: 0.05 mm Cor: 0.54 Bias: mm August 17
21 Hermosillo-Mazatan Moisture Comparison PWV Hermosillo > PWV Mazatan BUT q Hermosillo < q Mazatan for mid-july to mid-august => Smaller average water vapor scale height over Mazatan Lower LCL over Mazatan (higher surface q,, lower surface T) Easier to form moist convection More daily precipitation at Mazatan Evaporation from wet surface maintains high near surface mixing ratios at Mazatan POSITIVE FEEDBACK during monsoon
22 Hermosillo-Mazatan Monsoon & Moisture Correlations Monsoon is characterized by relatively low correlations of PW and q mid-july to mid-august Higher correlation following mid-august several day dry spell Low correlation in PW and q presumably associated with frequent convective events over Mazatan (and Hermosillo) Higher correlation and smaller biases after mid-august indicates larger scale dynamical control of water vapor structure Local convective scale in SMO foothills less important after mid-august ( post-monsoon( post-monsoon ) 2 to 6 days of drying and circulation change apparently kills monsoon and diurnal cycle of moist convection near Mazatan
23 Monsoonal Diurnal Cycle of q (mid-july to mid-august) Larger diurnal cycle in q at Hermosillo suggests Diurnal evolution of mixed layer Deeper (?) over Hermosillo than Mazatan? entraining drier air aloft (than Mazatan) ) yielding minimum q in afternoon q at Mazatan is higher and generally varies less diurnally Shallower mixed layer? Air entrained from above BL is more moist? Larger moisture flux from surface is able to maintain moist surface air?
24 Hermosillo/Mazatan PW, T, T q & Hermosillo dt/dt & Precip Residual convective peak from earlier in the day? Westward propagating disturbances Downdrafts

25 Hermosillo/Mazatan PW, T, T q & Mazatan dt/dt & Precip Residual convective peak from earlier in the day? Westward propagating disturbances Downdrafts
26 Temperature and Rain: Hermosillo vs. Mazatan Mazatan Hermosillo
27 Convective Downdrafts and Precipitation C. Minjares thesis discussed signatures of downdrafts in Tucson Explained ~half of outliers in radiosonde-gps PWV comparisons Convective downdrafts are evident as Sharp decrease in surface temperature Often with near-coincident precipitation (if precip. meas.. available) with coincident well-defined peaks in PW» Possibly asymmetric: faster decrease than rise may or may not be a sharp change in surface q or pressure Sharp change in wind velocity would be useful diagnostic Propagating convective systems are evident in comparing Mazatan and Hermosillo downdrafts Consistent with satellite imagery Water isotope implication: lots of mixing=> messy & difficult to interpret
28 Convective Downdraft Differences: Hermosillo vs. Mazatan Downdraft temperature decrease is generally more sharply defined and obvious at Hermosillo Multiple events often evident at Hermosillo Overhead convection or more distant cold gust fronts? Downdraft change in surface q Similar q downdraft at Hermosillo & Mazatan Mazatan: : Typically seems to decrease (at least briefly) Hermosillo: : typically increases from relatively low values in late afternoon Guess: Rain is falling into lower RH air above Hermosillo More evaporation => colder, stronger downdrafts at Hermosillo
29 Convective Downdrafts with no Precipitation (Measurement) Two obvious explanations are Virga Precipitation was too localized and was missed by gauge Both should be observed by radar (if there is a radar) Hermosillo example: DOY :30 UTC sharp increase in PW and decrease in surface temperature but nearby gauge did not measure precip No satellite data available in NAME data set Radar data show dbz echoes move across Hermosillo GPS can observe what the water in the column is doing after the intense precipitation Under the anvil which hides behavior at IR and shorter wavelengths
30 Timing of Precipitation Downdraft identification complements sampling of convective precipitation and virga events by rain gauges Cold outflow from downdrafts covers larger area than rainfall event itself individual downdraft sensor can pick up more precipitation events than a rain gauge May be particularly useful for determining timing of precipitation vs diurnal cycle, a critical variable for climate and climate model realism
31 Residual convective plumes: Keeping track of the water There are a number of PWV peaks without the sudden cold temperature signature of a convective downdraft Example: :30 UTC PW Event over Hermosillo w/o evidence of downdraft Strong convective event over Yecora earlier in the day at :30 UTC Not simple westward advection because no Mazatan PWV signature Based on GOES IR, the PWV moisture may be coming from the south Surface q signature is very different from PWV signature suggesting this is a free troposphere structure, not a BL moisture structure Much of the relatively sharp PWV structure may be mid-level moisture left over from residual or fossil convective structure Such moisture may play a role in subsequent convection Mid and upper troposphere moisture important for climate
32 Sensitivity of NAM Precipitation to Initial PW Conditions We planned to evaluate WRF using our NAME data. However, the first comparison of WRF with GPS measurements revealed a problem with the quality of the initial conditions that overwhelmed any sensitivity to the quality of WRF So we performed a two step study 1. We estimated the sensitivity of WRF moist convection, specifically dpw/dt,, to changes in the initial PW field 2. We evaluated the quality of the ETA PW analyses in Northwestern Mexico via comparisons with the GPS PW
33 Sensitivity of NAM Precipitation to Initial PW Conditions 5 panels show dpw/dt at 3:30 PM MST on July 29, The percentage of the ETA analyzed PWV field used to initialize the WRF model run for the five panels is 90%, 92.5%, 95%, 100% and 105%. A uniform scaling is applied to the moisture in all WRF grid cells.
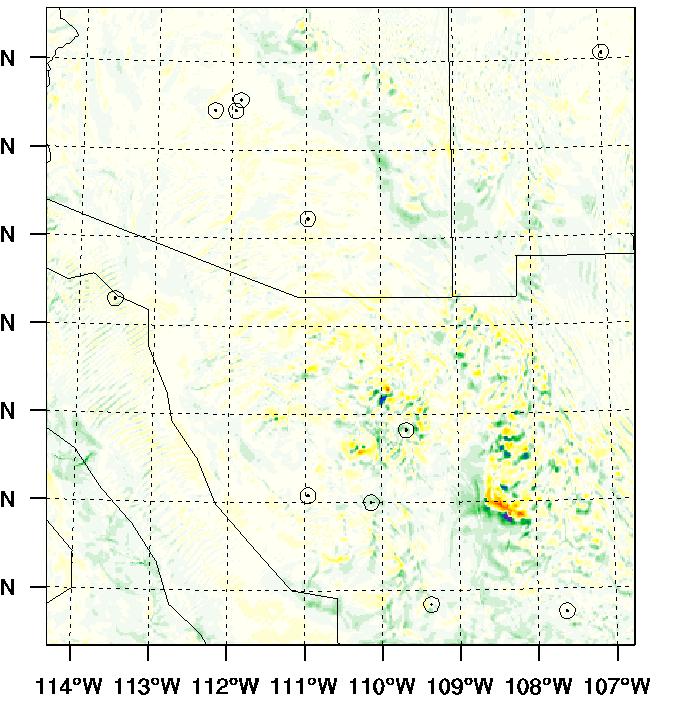
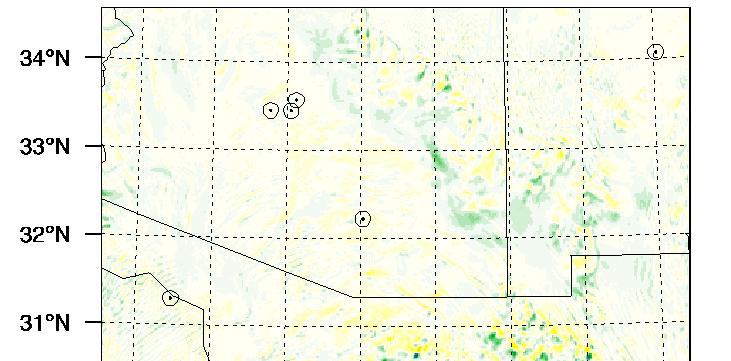
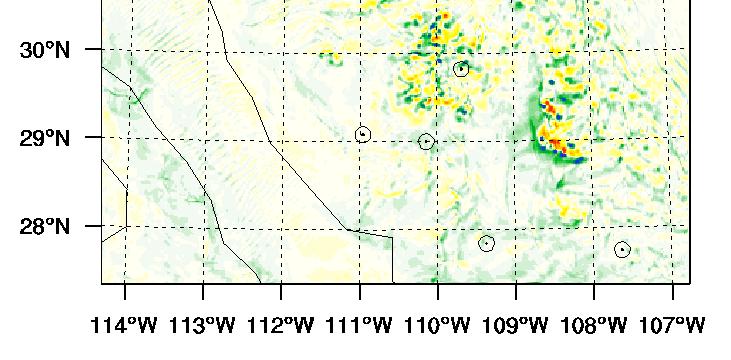
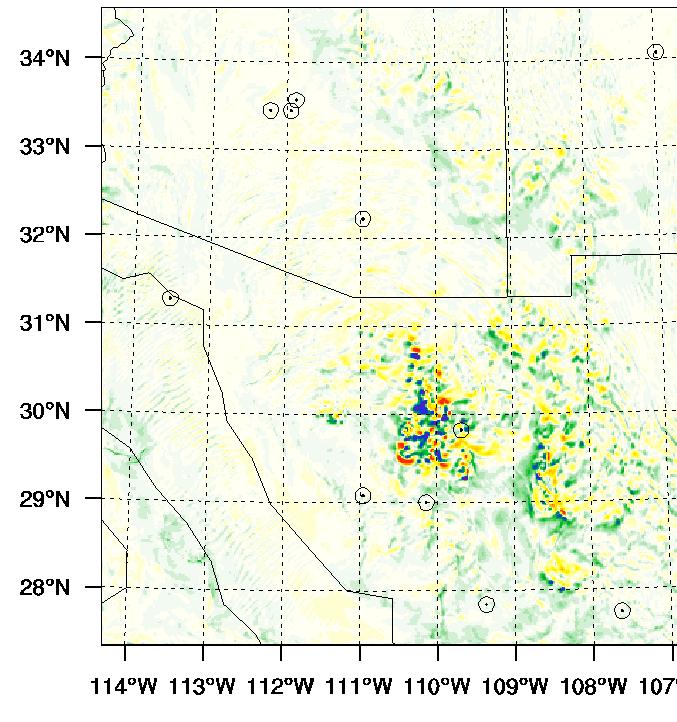
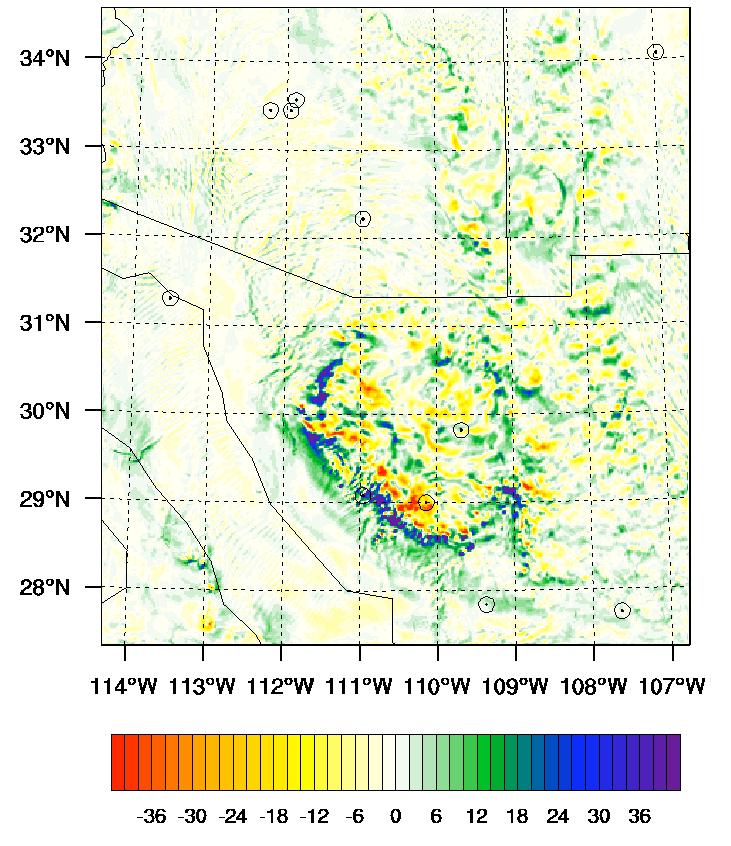
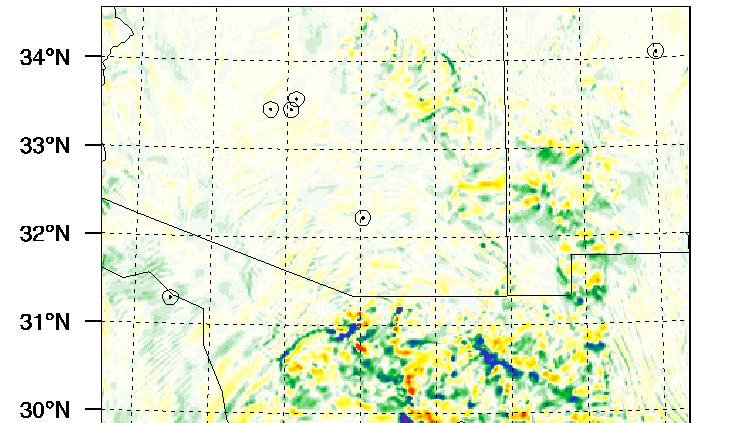
34 Sensitivity of NAM precipitation to initial conditions 90% 92.5% 95% 100% 105%
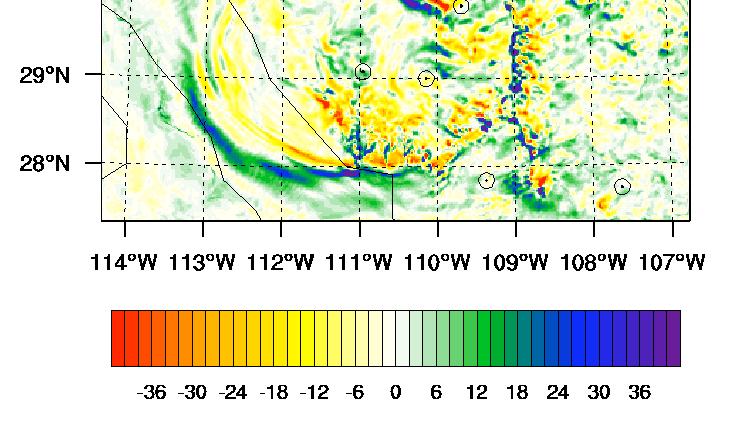
35 Sensitivity of NAM Precipitation to Initial PW Conditions Substantial differences in the 5 panels indicate magnitude and timing of moist convection and precipitation is very sensitive to the moisture initially available. Under wetter initial conditions, Moist convection initiated & evolved earlier The resulting convective storms intensified and propagated further to the west by 3:30 PM local time. ~10 m/s propagation speeds may be tied to mid-level wind velocity needs further examination.
36 Sensitivity of NAM Precipitation to Initial PW Conditions Step 2: Assessed quality of ETA PW analyses vs GPS PW ETA 1-sigma PW errors in Sonora are ~7-8% Location/Station Year GPS PWV ETA PWV Bias(mm) Standard deviation of ETA PW (mm) Tucson/SA Douglas/SA Phoenix/SA Hermosillo/SA P.Penasco/SA WRF exhibited large changes in precipitation with 5% PW changes Errors in 2003 and 2004 ETA PW analyses are too large for accurate NAM precipitation forecasts in Northwestern Mexico
37 TBD on Data Set The data from this special NAME GPS data has not been put in the NAME archive Need to complete QC and refine error estimates Put data in standardized data format Reprocess to fill in day-long gaps Refine the estimate Moctezuma surface pressure during first 40 days Reprocess to 5 minute intervals to better capture convective events Analyze the results!
38 4. Future GPS NAM Network Solid Earth Applications UNISON interest Summary of Utility Instrumentation at each site Possible locations Atmospheric Capabilities/Functions
39 Solid Earth applications for GPS networks in Mexico High-precision tectonics characterized by a) measuring plate boundary deformation in and around the Gulf of California (a focus site for the NSF MARGINs program) b) possible diffuse deformation within the Mexican Basin and Range province. Seismology using surface waves (e.g., Larson et al., SCIENCE, 2003) and records of near-field displacements captured by high-rate GPS receivers. A network complementing the US-based Plate Boundary Observatory (PBO) facility by extending GPS coverage into northern Mexico and Other relatively smaller-scale GPS networks in southern Mexico.

40 Existing Geodetic Network in North American Southwest

41 Spreading of Floor of Gulf of California
42 UNISON Interest in Mexican GPS Network UNISON is interested in future work with GPS stations for developing the following subjects: 1. Studying moist convective events in Mazatan and SMO. 2. Developing an early warning system for extreme storms and flooding. 3. Providing a infrastructure complementing the rain gauge stations. 4. Measuring the tectonic motion of Baja, and possible active extensional tectonics in Sierra Madre and neighboring areas. 5. Measuring subsidence in regions with overpumped aquifers. UNISON has offered to contact Mexican federal agencies, such as Comisión Nacional del Agua (CNA) and Comisión Estatal del Agua (CEA), to gain support for logistics, internet connection and more.
43 Instrumentation & Infrastructure for each site GPS Receiver Barometer Thermometer Hygrometer Anemometer Rain gauge Solar power meter Camera Computer plus Power Science location Safe location Internet
44 Preliminary Hardware Cost per Site $0-6K GPS receiver + antenna (less if old receiver) $3K Met package (P,( T, T D ) $1K Anemometer $0.5K Rain gauge $2-5K Mounting hardware, solar power (if necessary) $1K Computer $1K Travel $8-15K TOTAL Plus salaries
45 How closely spaced should the sites be? First order answer is closer is better so likely comes down to $ Sample a range of elevations to constrain processes and parameterizations Sufficiently dense spacing to sample all of the large convective events Dense enough to constrain/determine water transport NAME spacing was NOT dense enough to determine where water was coming from Depends on horizontal scale of water blobs» During monsoon, decorrelation length may get down to the scale of the convection, ~few km Can estimate water vapor motion from 3 relatively close receivers:» test this at Tucson Can transport be achieved using line of site and higher time resolution processing? Perhaps

46 Potential Locations Place instruments at a subset of present rain gauge locations along Mexican roads through the SMO
47 GPS/Surface Obs.. Information Summary Unique data set measuring complete diurnal cycle Independent of clouds Provides key observations in and around SMO Understand topographic influence and interaction with warm season convection and precipitation Measures water vapor evolution and history Complements precipitation observations Crucial information for understanding and modeling transport and source/cause of precipitation Determines Intra- and Inter-annual Climate variability Provides basic objective climatology Drives more correct and resolved climate analyses
48 GPS/Surface Obs.. Information Summary (cont d) Constrains precursor conditions for moist convection and evolution of moisture field associated with convection Measures properties of convective downdrafts Proxy for precipitation Refine diurnal timing of convection and precipitation complementing rain gauge and radar observations Strong and unique set of observational constraints for evaluating and improving models» downdrafts can be critical in evolution of convective events
49 GPS/Surface Obs.. Information Summary (cont d) Monsoon onset and end Increase in PWV indicates monsoon onset Increase in moisture spatial correlations indicates end of Monsoon Key constraints to evaluate model performance and improve model parameterizations Relation between surface conditions, water vapor, moist convection and precipitation Diurnal cycle of column and surface water vapor, surface temperature, pressure (winds in the future) Determine important scales of variability Downdrafts NWP: Better model initialization, better forecast models Establish feasibility & utility of observational network in Mexico
50 Summary of Network Functions Provide critical data for constraining processes, evaluating models and improving parameterizations Establish interannual NAM climatology Provide key data for NWP initialization Improve severe weather and flooding forecasts Determine subsidence due to aquafer overuse Measure tectonic motion Measure seismic waves Provide reference stations for surveying Provide internet in more remote areas
Water vapor and surface observations in northwestern Mexico during the 2004 NAME Enhanced Observing Period
 Click Here for Full Article GEOPHYSICAL RESEARCH LETTERS, VOL. 35, L03815, doi:10.1029/2007gl031404, 2008 Water vapor and surface observations in northwestern Mexico during the 2004 NAME Enhanced Observing
Abstract/Executive Summary
 Observing the Interdependence of Precipitation and Precipitable Water Vapor during the North American Monsoon Experiment (NAME) E. R. Kursinski - March 20, 2006 Abstract/Executive Summary This project
USE OF TOTAL COLUMN WATER VAPOR MEASUREMENTS FOR FORECASTS OF THE NORTH AMERICAN MONSOON PRECIPITATION
 USE OF TOTAL COLUMN WATER VAPOR MEASUREMENTS FOR FORECASTS OF THE NORTH AMERICAN MONSOON PRECIPITATION Presented by Yolande Serra University of Arizona Collaborators / Support Ave Arellano (UA Faculty)
IMPACT OF GROUND-BASED GPS PRECIPITABLE WATER VAPOR AND COSMIC GPS REFRACTIVITY PROFILE ON HURRICANE DEAN FORECAST. (a) (b) (c)
 (b) (c)") 9B.3 IMPACT OF GROUND-BASED GPS PRECIPITABLE WATER VAPOR AND COSMIC GPS REFRACTIVITY PROFILE ON HURRICANE DEAN FORECAST Tetsuya Iwabuchi *, J. J. Braun, and T. Van Hove UCAR, Boulder, Colorado 1. INTRODUCTION
9B.3 IMPACT OF GROUND-BASED GPS PRECIPITABLE WATER VAPOR AND COSMIC GPS REFRACTIVITY PROFILE ON HURRICANE DEAN FORECAST Tetsuya Iwabuchi *, J. J. Braun, and T. Van Hove UCAR, Boulder, Colorado 1. INTRODUCTION
Diagnosing the Climatology and Interannual Variability of North American Summer Climate with the Regional Atmospheric Modeling System (RAMS)
") Diagnosing the Climatology and Interannual Variability of North American Summer Climate with the Regional Atmospheric Modeling System (RAMS) Christopher L. Castro and Roger A. Pielke, Sr. Department of
Diagnosing the Climatology and Interannual Variability of North American Summer Climate with the Regional Atmospheric Modeling System (RAMS) Christopher L. Castro and Roger A. Pielke, Sr. Department of
Type of storm viewed by Spotter A Ordinary, multi-cell thunderstorm. Type of storm viewed by Spotter B Supecell thunderstorm
 ANSWER KEY Part I: Locating Geographical Features 1. The National Weather Service s Storm Prediction Center (www.spc.noaa.gov) has issued a tornado watch on a warm spring day. The watch covers a large
Modeling rainfall diurnal variation of the North American monsoon core using different spatial resolutions
 Modeling rainfall diurnal variation of the North American monsoon core using different spatial resolutions Jialun Li, X. Gao, K.-L. Hsu, B. Imam, and S. Sorooshian Department of Civil and Environmental
Large-Eddy Simulations of Tropical Convective Systems, the Boundary Layer, and Upper Ocean Coupling
 DISTRIBUTION STATEMENT A. Approved for public release; distribution is unlimited. Large-Eddy Simulations of Tropical Convective Systems, the Boundary Layer, and Upper Ocean Coupling Eric D. Skyllingstad
Reprint 850. Within the Eye of Typhoon Nuri in Hong Kong in C.P. Wong & P.W. Chan
 Reprint 850 Remote Sensing Observations of the Subsidence Zone Within the Eye of Typhoon Nuri in Hong Kong in 2008 C.P. Wong & P.W. Chan 8 th International Symposium on Tropospheric Profiling: Integration
Use of the Combined Pacific Variability Mode for Climate Prediction in North America
 Use of the Combined Pacific Variability Mode for Climate Prediction in North America Christopher L. Castro,, Stephen Bieda III, and Francina Dominguez University of Arizona Regional Climate Forum for Northwest
Charles A. Doswell III, Harold E. Brooks, and Robert A. Maddox
 Charles A. Doswell III, Harold E. Brooks, and Robert A. Maddox Flash floods account for the greatest number of fatalities among convective storm-related events but it still remains difficult to forecast
On the Appropriateness of Spectral Nudging in Regional Climate Models
 On the Appropriateness of Spectral Nudging in Regional Climate Models Christopher L. Castro Department of Atmospheric Sciences University of Arizona Tucson, Arizona, USA Dynamically Downscaled IPCC model
Stephen W. Bieda III, Steven L. Mullen, Christopher L. Castro University of Arizona Department of Atmospheric Sciences
 Stephen W. Bieda III, Steven L. Mullen, Christopher L. Castro University of Arizona Department of Atmospheric Sciences Collaborative effort between National Weather Service, Tucson, AZ WSFO and the University
Characteristics of extreme convection over equatorial America and Africa
 Characteristics of extreme convection over equatorial America and Africa Manuel D. Zuluaga, K. Rasmussen and R. A. Houze Jr. Atmospheric & Climate Dynamics Seminar Department of Atmospheric Sciences, University
Module 11: Meteorology Topic 3 Content: Weather Instruments Notes
 Introduction In order for meteorologists to accurately predict the weather, they take thousands of different weather measurements each day. Meteorologists need to use many tools in order to draw an accurate
Presentation Overview. Southwestern Climate: Past, present and future. Global Energy Balance. What is climate?
 Southwestern Climate: Past, present and future Mike Crimmins Climate Science Extension Specialist Dept. of Soil, Water, & Env. Science & Arizona Cooperative Extension The University of Arizona Presentation
Use of Emerging Applications of the Weather Research and Forecasting Model to Investigate the North American Monsoon
 Use of Emerging Applications of the Weather Research and Forecasting Model to Investigate the North American Monsoon Christopher L. Castro, Francina Dominguez, and Stephen Bieda III, Department of Atmospheric
Lecture #14 March 29, 2010, Monday. Air Masses & Fronts
 Lecture #14 March 29, 2010, Monday Air Masses & Fronts General definitions air masses source regions fronts Air masses formation types Fronts formation types Air Masses General Definitions a large body
Arizona Climate Summary
 Arizona Climate Summary April 2014 Summary of conditions for March 2014 March 2014 Temperature and Precipitation Summary March 1 st 16 th : We started off the month of March with a significant precipitation
The Transfer of Heat
 The Transfer of Heat Outcomes: S2-4-03 Explain effects of heat transfer within the atmosphere and hydrosphere on the development and movement of wind and ocean currents. Coriolis Effect In our ecology
Flux Tower Data Quality Analysis in the North American Monsoon Region
 Flux Tower Data Quality Analysis in the North American Monsoon Region 1. Motivation The area of focus in this study is mainly Arizona, due to data richness and availability. Monsoon rains in Arizona usually
Arizona Climate Summary October 2015 Summary of conditions for September 2015
 September 2015 Temperature and Precipitation Summary Arizona Climate Summary October 2015 Summary of conditions for September 2015 September 1 st 18 th : September began with high pressure over southern
Atmospheric Moisture, Precipitation, and Weather Systems
 Atmospheric Moisture, Precipitation, and Weather Systems 6 Chapter Overview The atmosphere is a complex system, sometimes described as chaotic in nature. In this chapter we examine one of the principal
Large-Eddy Simulations of Tropical Convective Systems, the Boundary Layer, and Upper Ocean Coupling
 DISTRIBUTION STATEMENT A. Approved for public release; distribution is unlimited. Large-Eddy Simulations of Tropical Convective Systems, the Boundary Layer, and Upper Ocean Coupling Eric D. Skyllingstad
ALMA MEMO : the driest and coldest summer. Ricardo Bustos CBI Project SEP 06
 ALMA MEMO 433 2002: the driest and coldest summer Ricardo Bustos CBI Project E-mail: rbustos@dgf.uchile.cl 2002 SEP 06 Abstract: This memo reports NCEP/NCAR Reanalysis results for the southern hemisphere
1 What Is Climate? TAKE A LOOK 2. Explain Why do areas near the equator tend to have high temperatures?
 CHAPTER 17 1 What Is Climate? SECTION Climate BEFORE YOU READ After you read this section, you should be able to answer these questions: What is climate? What factors affect climate? How do climates differ
MET Lecture 34 Downbursts
 MET 4300 Lecture 34 Downbursts Downbursts A strong downdraft that originates within the lower part of a cumulus cloud or thunderstorms and spreads out at the surface Downbursts do not require strong thunderstorms
Chapter 12: Meteorology
 Chapter 12: Meteorology Section 1: The Causes of Weather 1. Compare and contrast weather and climate. 2. Analyze how imbalances in the heating of Earth s surface create weather. 3. Describe how and where
Crux of AGW s Flawed Science (Wrong water-vapor feedback and missing ocean influence)
") 1 Crux of AGW s Flawed Science (Wrong water-vapor feedback and missing ocean influence) William M. Gray Professor Emeritus Colorado State University There are many flaws in the global climate models. But
1 Crux of AGW s Flawed Science (Wrong water-vapor feedback and missing ocean influence) William M. Gray Professor Emeritus Colorado State University There are many flaws in the global climate models. But
DEPARTMENT OF EARTH & CLIMATE SCIENCES NAME SAN FRANCISCO STATE UNIVERSITY Fall ERTH FINAL EXAMINATION KEY 200 pts
 DEPARTMENT OF EARTH & CLIMATE SCIENCES NAME SAN FRANCISCO STATE UNIVERSITY Fall 2016 Part 1. Weather Map Interpretation ERTH 365.02 FINAL EXAMINATION KEY 200 pts Questions 1 through 9 refer to Figure 1,
Sensitivity Analysis of WRF Forecasts in Arizona During the Monsoon Season Case Study: August 2, 2005 to August 3, 2005
 Sensitivity Analysis of WRF Forecasts in Arizona During the Monsoon Season Case Study: August 2, 2005 to August 3, 2005 Christopher L. Castro and Stephen Bieda III University of Arizona Susanne Grossman-Clarke
THE IMPACT OF GROUND-BASED GPS SLANT-PATH WET DELAY MEASUREMENTS ON SHORT-RANGE PREDICTION OF A PREFRONTAL SQUALL LINE
 JP1.17 THE IMPACT OF GROUND-BASED GPS SLANT-PATH WET DELAY MEASUREMENTS ON SHORT-RANGE PREDICTION OF A PREFRONTAL SQUALL LINE So-Young Ha *1,, Ying-Hwa Kuo 1, Gyu-Ho Lim 1 National Center for Atmospheric
Arizona Climate Summary
 August 2015 Temperature and Precipitation Summary Arizona Climate Summary September 2015 Summary of conditions for August 2015 August 1 st 16 th : August was a wet month across the state with only 3 days
Introduction to Numerical Weather Prediction. Mike Leuthold Atmo 336
 Introduction to Numerical Weather Prediction Mike Leuthold Atmo 336 Model Components This flowchart, starting at the bottom, shows how the components of Numerical Weather Prediction (NWP) and how it fits
Foundations of Earth Science, 6e Lutgens, Tarbuck, & Tasa
 Foundations of Earth Science, 6e Lutgens, Tarbuck, & Tasa Weather Patterns and Severe Weather Foundations, 6e - Chapter 14 Stan Hatfield Southwestern Illinois College Air masses Characteristics Large body
Temperature (T) degrees Celsius ( o C) arbitrary scale from 0 o C at melting point of ice to 100 o C at boiling point of water Also (Kelvin, K) = o C
 degrees Celsius ( o C) arbitrary scale from 0 o C at melting point of ice to 100 o C at boiling point of water Also (Kelvin, K) = o C") 1 2 3 4 Temperature (T) degrees Celsius ( o C) arbitrary scale from 0 o C at melting point of ice to 100 o C at boiling point of water Also (Kelvin, K) = o C plus 273.15 0 K is absolute zero, the minimum
1 2 3 4 Temperature (T) degrees Celsius ( o C) arbitrary scale from 0 o C at melting point of ice to 100 o C at boiling point of water Also (Kelvin, K) = o C plus 273.15 0 K is absolute zero, the minimum
Figure 1: Tephigram for radiosonde launched from Bath at 1100 UTC on 15 June 2005 (IOP 1). The CAPE and CIN are shaded dark and light gray,
. The CAPE and CIN are shaded dark and light gray,") Figure 1: Tephigram for radiosonde launched from Bath at 1100 UTC on 1 June 200 (IOP 1). The CAPE and CIN are shaded dark and light gray, respectively; the thin solid line partially bounding these areas
Figure 1: Tephigram for radiosonde launched from Bath at 1100 UTC on 1 June 200 (IOP 1). The CAPE and CIN are shaded dark and light gray, respectively; the thin solid line partially bounding these areas
Standard 3: Students will understand the atmospheric processes that support life and cause weather and climate.
 Course: 9 th Grade Earth Systems Science Standard 3: Students will understand the atmospheric processes that support life and cause weather and climate. Instructions: In the space provided, write the letter
4 Forecasting Weather
 CHAPTER 2 4 Forecasting Weather SECTION Understanding Weather BEFORE YOU READ After you read this section, you should be able to answer these questions: What instruments are used to forecast weather? How
Variability of Moisture and Convection over the South American Altiplano during SALLJEX: An Exploratory Study
 Variability of Moisture and Convection over the South American Altiplano during SALLJEX: An Exploratory Study Mark Falvey, René Garreaud and Patricio Aceituno falvey@dgf.uchile.cl Departamento de Geofísica,
Convection-Resolving Model Simulations: Process-Based Comparison of LM Results with Observations
 Convection-Resolving Model Simulations: Process-Based Comparison of LM Results with Observations Jörg Trentmann, Britta Wecker, Marcus Paulat, Heini Wernli, Ulrich Corsmeier, Jan Handwerker Goal Improve
Chapter Introduction. Weather. Patterns. Forecasts Chapter Wrap-Up
 Chapter Introduction Lesson 1 Lesson 2 Lesson 3 Describing Weather Weather Patterns Weather Forecasts Chapter Wrap-Up How do scientists describe and predict weather? What do you think? Before you begin,
Examination #3 Wednesday, 28 November 2001
 Name & Signature Dr. Droegemeier Student ID Meteorology 1004 Introduction to Meteorology Fall, 2001 Examination #3 Wednesday, 28 November 2001 BEFORE YOU BEGIN!! Please be sure to read each question CAREFULLY
Estimating Atmospheric Water Vapor with Groundbased. Lecture 12
 Estimating Atmospheric Water Vapor with Groundbased GPS Lecture 12 Overview This lecture covers metrological applica4ons of GPS Some of the material has already been presented and is shown here for completeness.
Meteorology Curriculum Maps Unit 1: Basic Concepts of Meteorology Unit 2: The Atmosphere in Motion
 Meteorology Curriculum Maps Unit 1: Basic Concepts of Meteorology Unit 2: The Atmosphere in Motion NOTE: Meteorology is a one semester course designed for students interested in understanding the complex
Chapter 3 Convective Dynamics 3.4. Bright Bands, Bow Echoes and Mesoscale Convective Complexes
 Chapter 3 Convective Dynamics 3.4. Bright Bands, Bow Echoes and Mesoscale Convective Complexes Photographs Todd Lindley Bright band associated with stratiform precipitation in a squall line system 1 Bright
MASTERY ASSIGNMENT 2015
 Climate & Meteorology MASTERY ASSIGNMENT 2015 Directions: You must submit this document via Google Docs to lzimmerman@wcpss.net. The document must include the questions and pictures must be hand drawn
Weather. A. atmosphere is a layer of gases that wrap around the Earth like a blanket.
 Weather I. The air around us A. atmosphere is a layer of gases that wrap around the Earth like a blanket. II. Weather Temperature Humidity Air pressure Wind 1. contains the air we breathe, protects us
Wind: Global Systems Chapter 10
 Wind: Global Systems Chapter 10 General Circulation of the Atmosphere General circulation of the atmosphere describes average wind patterns and is useful for understanding climate Over the earth, incoming
1 of 7 Thunderstorm Notes by Paul Sirvatka College of DuPage Meteorology. Thunderstorms
 1 of 7 Thunderstorm Notes by Paul Sirvatka College of DuPage Meteorology Thunderstorms There are three types of thunderstorms: single-cell (or air mass) multicell (cluster or squall line) supercell Although
Preliminary results. Leonardo Calvetti, Rafael Toshio, Flávio Deppe and Cesar Beneti. Technological Institute SIMEPAR, Curitiba, Paraná, Brazil
 HIGH RESOLUTION WRF SIMULATIONS FOR WIND GUST EVENTS Preliminary results Leonardo Calvetti, Rafael Toshio, Flávio Deppe and Cesar Beneti Technological Institute SIMEPAR, Curitiba, Paraná, Brazil 3 rd WMO/WWRP
4 Forecasting Weather
 CHAPTER 16 4 Forecasting Weather SECTION Understanding Weather BEFORE YOU READ After you read this section, you should be able to answer these questions: What instruments are used to forecast weather?
Page 1. Name:
 Name: 1) As the difference between the dewpoint temperature and the air temperature decreases, the probability of precipitation increases remains the same decreases 2) Which statement best explains why
P2.4 THE IMPACT OF TROPICAL CYCLONE REMNANTS ON THE RAINFALL OF THE NORTH AMERICAN SOUTHWEST REGION
 P2.4 THE IMPACT OF TROPICAL CYCLONE REMNANTS ON THE RAINFALL OF THE NORTH AMERICAN SOUTHWEST REGION by Elizabeth A. Ritchie 1 and David Szenasi University of New Mexico 1. INTRODUCTION New Mexico has a
above the land to be warmer, causing convection currents because of the difference in air pressure.
 Name Date Period Earth Science Unit Test Review Sheet Directions: Use my web site and/or your lab book to help to answer the following questions. 1. What type of weather does a low pressure system bring?
Arizona Climate Summary May 2012
 Arizona Climate Summary May 2012 Summary of conditions for April 2012 April 2012 Temperature and Precipitation Summary April 1 st 16 th : Although April began with another low pressure system sweeping
Assimilation of Satellite Infrared Brightness Temperatures and Doppler Radar Observations in a High-Resolution OSSE
 Assimilation of Satellite Infrared Brightness Temperatures and Doppler Radar Observations in a High-Resolution OSSE Jason Otkin and Becky Cintineo University of Wisconsin-Madison, Cooperative Institute
Developments at DWD: Integrated water vapour (IWV) from ground-based GPS
 from ground-based GPS") 1 Working Group on Data Assimilation 2 Developments at DWD: Integrated water vapour (IWV) from ground-based Christoph Schraff, Maria Tomassini, and Klaus Stephan Deutscher Wetterdienst, Frankfurter Strasse
1 Working Group on Data Assimilation 2 Developments at DWD: Integrated water vapour (IWV) from ground-based Christoph Schraff, Maria Tomassini, and Klaus Stephan Deutscher Wetterdienst, Frankfurter Strasse
Climate vs. Weather. Weather: Short term state of the atmosphere. Climate: The average weather conditions in an area over a long period of time
 Weather and Climate Climate vs. Weather Weather: Short term state of the atmosphere. Temperature, humidity, cloud cover, precipitation, winds, visibility, air pressure, air pollution, etc Climate: The
Tornadogenesis in Supercells: The Three Main Ingredients. Ted Funk
 Tornadogenesis in Supercells: The Three Main Ingredients Ted Funk NWS Louisville, KY Spring 2002 Environmental Parameters Supercells occur within environments exhibiting several wellknown characteristics
Seasonal and interannual relations between precipitation, soil moisture and vegetation in the North American monsoon region
 Seasonal and interannual relations between precipitation, soil moisture and vegetation in the North American monsoon region Luis A. Mendez-Barroso 1, Enrique R. Vivoni 1, Christopher J. Watts 2 and Julio
Verification of the Seasonal Forecast for the 2005/06 Winter
 Verification of the Seasonal Forecast for the 2005/06 Winter Shingo Yamada Tokyo Climate Center Japan Meteorological Agency 2006/11/02 7 th Joint Meeting on EAWM Contents 1. Verification of the Seasonal
We have processed RO data for climate research and for validation of weather data since 1995 as illustrated in Figure 1.
 Real-time Analysis of COSMIC Data Christian Rocken, Doug Hunt, Bill Schreiner University Corporation for Atmospheric Research (UCAR) COSMIC Project Office Boulder, CO Abstract UCAR has analyzed GPS radio
Moisture, Clouds, and Precipitation: Clouds and Precipitation. Dr. Michael J Passow
 Moisture, Clouds, and Precipitation: Clouds and Precipitation Dr. Michael J Passow What Processes Lift Air? Clouds require three things: water vapor, a condensation nucleus, and cooling Cooling usually
Storm Report : September 27, 2014
 True-color Visible Satellite, Sep. 27, 2014 2:00 PM MST Flood Control District of Maricopa County Engineering Division, Flood Warning Branch Storm Report : September 27, 2014 Initial Release: 10/10/2014
Investigation of the Arizona Severe Weather Event of August 8 th, 1997
 Investigation of the Arizona Severe Weather Event of August 8 th, 1997 Tim Hollfelder May 10 th, 2006 Abstract Synoptic scale forcings were very weak for these thunderstorms on August 7-8, 1997 over the
Michael F. Stringfellow
 Michael F. Stringfellow Thermals Columns or bubbles of warm air that rise from the ground when it is heated by the sun Soaring Sustained engineless flight using natural sources of lift Boundary or mixing
25.1 Air Masses. Section 25.1 Objectives
 Section 25.1 Objectives Explain how an air mass forms. List the four main types of air masses. Describe how air masses affect the weather of North America. Air Masses 25.1 Air Masses Differences in air
Transient and Eddy. Transient/Eddy Flux. Flux Components. Lecture 3: Weather/Disturbance. Transient: deviations from time mean Time Mean
 Lecture 3: Weather/Disturbance Transients and Eddies Climate Roles Mid-Latitude Cyclones Tropical Hurricanes Mid-Ocean Eddies Transient and Eddy Transient: deviations from time mean Time Mean Eddy: deviations
Seasonal associations between mid-tropospheric height patterns and precipitation in the western Great Basin, USA
 Seasonal associations between mid-tropospheric height patterns and precipitation in the western Great Basin, USA By: Paul A. Knapp Knapp, P.A. (1994) Seasonal associations between mid-tropospheric pressure
Road Weather: The Science Behind What You Know
 The Weather Road Weather: The Science Behind What You Know Jon Tarleton Global Roads Marketing Manager Meteorologist Jon.tarleton@vaisala.com Page 2 / date / name / Internal use / Vaisala Weather and Our
Weather and Climate Summary and Forecast Summer 2017
 Weather and Climate Summary and Forecast Summer 2017 Gregory V. Jones Southern Oregon University August 4, 2017 July largely held true to forecast, although it ended with the start of one of the most extreme
Talk Overview. Concepts. Climatology. Monitoring. Applications
 Atmospheric Rivers Talk Overview Concepts Climatology Monitoring Applications Satellite View Where is the storm? Where is the impact? Atmospheric Rivers Plume or fire hose of tropical moisture Heavy precipitation
Kenneth L. Pryor* and Gary P. Ellrod Center for Satellite Applications and Research (NOAA/NESDIS) Camp Springs, MD
 Camp Springs, MD") P1.57 GOES WMSI PROGRESS AND DEVELOPMENTS Kenneth L. Pryor* and Gary P. Ellrod Center for Satellite Applications and Research (NOAA/NESDIS) Camp Springs, MD 1. INTRODUCTION A multi-parameter index has
P1.57 GOES WMSI PROGRESS AND DEVELOPMENTS Kenneth L. Pryor* and Gary P. Ellrod Center for Satellite Applications and Research (NOAA/NESDIS) Camp Springs, MD 1. INTRODUCTION A multi-parameter index has
The Impacts of GPS Radio Occultation Data on the Analysis and Prediction of Tropical Cyclones. Bill Kuo, Xingqin Fang, and Hui Liu UCAR COSMIC
 The Impacts of GPS Radio Occultation Data on the Analysis and Prediction of Tropical Cyclones Bill Kuo, Xingqin Fang, and Hui Liu UCAR COSMIC GPS Radio Occultation α GPS RO observations advantages for
Arizona Climate Summary February 2012
 Arizona Climate Summary February 2012 Summary of conditions for January 2012 January 2012 Temperature and Precipitation Summary January 1 st 20 th : The New Year has started on a very dry note. The La
The Role of CORS GNSS Data for Climate Monitoring: Case Study using NIGNET Network BY
 The Role of CORS GNSS Data for Climate Monitoring: Case Study using NIGNET Network BY Abayomi AYOOLA, Adeyemi ADEBOMEHIN, Kufre Eko (Nigeria) and SÁ ANDRÉ (Portugal). Introduction The 2012 rainy season
Fronts. Direction of Front
 Fronts Direction of Front Direction of Front Warm Front A cold air mass meets and displaces a warm air mass. Because the moving cold air is more dense, it moves under the less-dense warm air, pushing it
9D.3 THE INFLUENCE OF VERTICAL WIND SHEAR ON DEEP CONVECTION IN THE TROPICS
 9D.3 THE INFLUENCE OF VERTICAL WIND SHEAR ON DEEP CONVECTION IN THE TROPICS Ulrike Wissmeier, Robert Goler University of Munich, Germany 1 Introduction One does not associate severe storms with the tropics
Atmosphere and Weather Revision Notes
 Atmosphere and Weather Revision Notes Atmosphere The blanket of gases that surrounds the Earth is called the atmosphere. The main gases are nitrogen (78 %), oxygen (21 %), water vapour, ozone and carbon
Arizona Climate Summary
 Arizona Climate Summary June 2012 Summary of conditions for May 2012 May 2012 Temperature and Precipitation Summary May 1 st 16 th : May began with a surface cold front sweeping across the western states
Weather Systems Study Guide:
 Weather Systems Study Guide: 1. Draw a diagram of Earth s water cycle and label each part. 2. Explain how the water cycle works. 3. What happens in the troposphere and stratosphere? Atmosphere Level What
Science 1206 Chapter 1 - Inquiring about Weather
 Science 1206 Chapter 1 - Inquiring about Weather 1.1 - The Atmosphere: Energy Transfer and Properties (pp. 10-25) Weather and the Atmosphere weather the physical conditions of the atmosphere at a specific
DEPARTMENT OF EARTH & CLIMATE SCIENCES Name SAN FRANCISCO STATE UNIVERSITY Nov 29, ERTH 360 Test #2 200 pts
 DEPARTMENT OF EARTH & CLIMATE SCIENCES Name SAN FRANCISCO STATE UNIVERSITY Nov 29, 2018 ERTH 360 Test #2 200 pts Each question is worth 4 points. Indicate your BEST CHOICE for each question on the Scantron
3 Severe Weather. Critical Thinking
 CHAPTER 2 3 Severe Weather SECTION Understanding Weather BEFORE YOU READ After you read this section, you should be able to answer these questions: What are some types of severe weather? How can you stay
Impacts of the April 2013 Mean trough over central North America
 Impacts of the April 2013 Mean trough over central North America By Richard H. Grumm National Weather Service State College, PA Abstract: The mean 500 hpa flow over North America featured a trough over
Anthony A. Rockwood Robert A. Maddox
 Anthony A. Rockwood Robert A. Maddox An unusually intense MCS produced large hail and wind damage in northeast Kansas and northern Missouri during the predawn hours of June 7 th, 1982. Takes a look at
Forecasting of Optical Turbulence in Support of Realtime Optical Imaging and Communication Systems
 Forecasting of Optical Turbulence in Support of Realtime Optical Imaging and Communication Systems Randall J. Alliss and Billy Felton Northrop Grumman Corporation, 15010 Conference Center Drive, Chantilly,
THE SEPTEMBER 24,1987, YUMA PROVING GROUND TORNADO
 Volume 14 Number February, 1989 13 THE SEPTEMBER 24,1987, YUMA PROVNG GROUND TORNADO Paul R. Vukits (1) ASL Yuma Met Team ABSTRACT Numerous reports of a tornado on the Yuma Proving Grounds (YPG), Arizona
Weather and Climate Summary and Forecast August 2018 Report
 Weather and Climate Summary and Forecast August 2018 Report Gregory V. Jones Linfield College August 5, 2018 Summary: July 2018 will likely go down as one of the top five warmest July s on record for many
RR#4 - Multiple Choice
 1. The map below shows the amount of snowfall, in inches, produced by a lake-effect snowstorm in central New York State. The wind that produced this snowfall pattern most likely came from the 1) northeast
Chapter 8 cont. Clouds and Storms. Spring 2018
 Chapter 8 cont. Clouds and Storms Spring 2018 Clouds and Storms Clouds cover ~ 50% of earth at any time. Clouds are linked to a number of condensation processes. Cloud morphology, cloud types, associated
Arizona Climate Summary October 2018 Summary of conditions for September 2018
 Arizona Climate Summary October 2018 Summary of conditions for September 2018 September 2018 Temperature and Precipitation Summary September 1 st 17 th : The wet pattern from August continued into September
Use the terms from the following list to complete the sentences below. Each term may be used only once.
 Skills Worksheet Directed Reading Section: Air Masses Use the terms from the following list to complete the sentences below. Each term may be used only once. high pressure poles low pressure equator wind
The Causes of Weather
 Meteorology The Causes of Weather Where does the weather in our country come from? * Which air masses determine the weather in our country? * Weather or Climate? *The current state of the atmosphere *
Thunderstorm Downburst Prediction: An Integrated Remote Sensing Approach. Ken Pryor Center for Satellite Applications and Research (NOAA/NESDIS)
") Thunderstorm Downburst Prediction: An Integrated Remote Sensing Approach Ken Pryor Center for Satellite Applications and Research (NOAA/NESDIS) Topics of Discussion Thunderstorm Life Cycle Thunderstorm
Thunderstorm Downburst Prediction: An Integrated Remote Sensing Approach Ken Pryor Center for Satellite Applications and Research (NOAA/NESDIS) Topics of Discussion Thunderstorm Life Cycle Thunderstorm
Clouds and Rain Unit (3 pts)
") Name: Section: Clouds and Rain Unit (Topic 8A-2) page 1 Clouds and Rain Unit (3 pts) As air rises, it cools due to the reduction in atmospheric pressure Air mainly consists of oxygen molecules and nitrogen
Name: Section: Clouds and Rain Unit (Topic 8A-2) page 1 Clouds and Rain Unit (3 pts) As air rises, it cools due to the reduction in atmospheric pressure Air mainly consists of oxygen molecules and nitrogen
Southern California Storm of July 2015
 Southern California Storm of 18-20 July 2015 Discussion Former Hurricane Dolores moved north through the northeast Pacific along the Mexican and California coasts The tropical air mass associated with
3 Weather and Climate
 CHAPTER 22 3 Weather and Climate SECTION The Atmosphere KEY IDEAS As you read this section, keep these questions in mind: What are fronts? What are some types of severe weather? How is climate different
Christopher L. Castro Department of Atmospheric Sciences University of Arizona
 Spatiotemporal Variability and Covariability of Temperature, Precipitation, Soil Moisture, and Vegetation in North America for Regional Climate Model Applications Christopher L. Castro Department of Atmospheric