Uncertainties in Seismicity Models: Towards Bayesian Earthquake Forecasting
|
|
|
- Roger Newton
- 5 years ago
- Views:
Transcription
1 Ucertaities i Seismicity Models: Towards Bayesia Earthquake Forecastig Max Werer (UCLA) Kayo Ide (UCLA) Didier Sorette (ETHZ & UCLA) It is ot certai that everythig is ucertai. - Blaise Pascal
 Magitude Noise i a Aftershock Model Impact o seismic rate estimates, forecasts ad tests III) Data assimilatio Framework for ucertaities Recursive")
2 Outlie I) Motivatio: How do ucertaities impact earthquake forecasts? How ca we characterize magitude ucertaities? II) Magitude Noise i a Aftershock Model Impact o seismic rate estimates, forecasts ad tests III) Data assimilatio Framework for ucertaities Recursive Bayesia forecastig for temporal reewal process
3 Ucertaities: Pallett Creek Rhoades et al (1994) Ogata (1999, 2002)


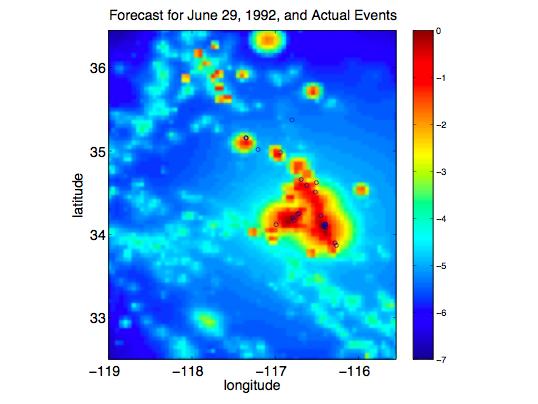

4 ETAS Forecast STEP: ETAS Hidcast ERS :
 For ANSS i Califoria, oly NCSN reports hypoiverse ucertaities INTER Ucertaity i the forecast magitude - Mf?")
5 Magitude Ucertaities What is the magitude ucertaity i forecast models? INTRA Ucertaity i measurig a particular magitude? Iversio process (e.g. hypoiverse - reports ucertaities) Velocity model, parameters, assumptios, istrumets Compare estimate of same type of magitude from differet methods or catalogs (e.g. CMT vs USGS momet magitude) For ANSS i Califoria, oly NCSN reports hypoiverse ucertaities INTER Ucertaity i the forecast magitude - Mf? Systematic ad radom differeces betwee differet magitudes reported i catalogs (e.g. CMT s Mw vs PDE mb ad Ms) CSEP s authorized data ANSS reports may differet magitudes E.g. NCSN reports two magitudes (Ms ad Md) Which is the forecast magitude?

6 Momet Magitude Ucertaity Kaga (2003)

7 Momet Magitude Ucertaities CMT vs USGS
8 ANSS: Magitude Ucertaity Withi Califoria, the oly (?) etwork i the ANSS that routiely reports ucertaities i magitude is the NCSN usig the hypoiverse format: Media Absolute Differece (MAD)
: differeces up to 0.4 usually 0.1 to 0.")
9 Forecast Magitude Ucertaity ANSS i CA reports may magitudes: Richter, momet, coda duratio, coda amplitude, S amplitude... NCSN reports amplitude magitude ad coda duratio magitude for the same evet (i the hypoiverse format): differeces up to 0.4 usually 0.1 to 0.2 CMT reports PDE mb ad/or Ms
10 Outlie I) Motivatio: How do ucertaities impact earthquake forecasts? How do we characterize magitude ucertaity? II) Magitude Noise i a Aftershock Model Impact o seismic rate estimates, forecasts ad tests III) Data assimilatio Framework for ucertaities Recursive Bayesia forecastig for temporal reewal process


11 Effects of Magitude Noise i a Aftershock Cluster Model Poisso Cluster Model: (maishock + aftershocks) Noisy magitudes: Queched weights: Radom variables: What are the fluctuatios i the seismic rate estimates?
12 Magitude Noise i Cluster Models What are the fluctuatios i the hazard due to oise? Sum of radom variables Strog fluctuatios i seismic rate estimates No cetral limit theorem for oise > 0.2 Queched weights strogly deped o catalog realizatio Averagig effects deped o parameter values
13 Simulatios of Perturbed Rates

14 Seismic Rate Estimatio: Power Law Tail Behavior
 Models / Forecasts : - perturb magitudes of catalog 1000s of times - calculate seismic rate")
15 Noisy Forecasts i RELM Likelihood Tests Truth / Observatios : - simulate a sythetic catalog with the Poisso cluster model ad GR law - calculate (true) rate at time steps usig kow parameters - geerate 1000s of modified observatios cosistet with the rate assumig Poisso process (as i RELM likelihood tests) Models / Forecasts : - perturb magitudes of catalog 1000s of times - calculate seismic rate for each perturbed catalog based o Poisso cluster model equatio with kow parameters - for each such model, geerate 1000s of simulated observatios cosistet with its calculated rate from perturbed catalog RELM Likelihood test / Evaluatio : - perform N ad L tests o models agaist observatios


16 Fractio of Models Rejected by N, L Tests vs Time Because of magitude oise, a good model ca be rejected. What are the implicatios for log term testig? Which parameter regime is adequate?
 III) Magitude Noise i a Aftershock Model Impact o seismic rate estimates, forecasts ad tests Data assimilatio Framework for ucertaities")
17 Outlie I) Motivatio: How do ucertaities impact earthquake forecasts? II) III) Magitude Noise i a Aftershock Model Impact o seismic rate estimates, forecasts ad tests Data assimilatio Framework for ucertaities Mathematical set up for poit processes Recursive Bayesia forecastig for temporal reewal process

18 Data Assimilatio Talagrad (1997): The purpose of data assimilatio is to determie as accurately as possible the state of the atmospheric (or oceaic) flow, usig all available iformatio Statistical combiatio of observatios ad short-rage forecasts produce iitial coditios used i model to forecast. (Bayes theorem) Advatages: Geeral framework for ucertaities Ukow iitial coditio estimatio Accout for observatioal oise, system oise, parameter ucertaities
19 Data Assimilatio
20 Data Assimilatio
21 Data Assimilatio
22 Data Assimilatio
23 Data Assimilatio
24 Data Assimilatio
25 Data Assimilatio
26 Data Assimilatio
27 Temporal Reewal Processes Noise : Reewal process:... Forecast: Likelihood (observatio): Aalysis / Posterior: Werer, Ide ad Sorette (2007), i prep

28 Coclusios Ucertaities ad oise are importat Observatioal oise ca be large Magitude ucertaities ot straight forward. Seismic rate estimates i aftershock model fluctuate Forecasts suffer Testig ad evaluatig eed to be robust Data assimilatio ca help Geeric framework for dealig with ucertaities
1.010 Uncertainty in Engineering Fall 2008
 MIT OpeCourseWare http://ocw.mit.edu.00 Ucertaity i Egieerig Fall 2008 For iformatio about citig these materials or our Terms of Use, visit: http://ocw.mit.edu.terms. .00 - Brief Notes # 9 Poit ad Iterval
Lecture 2: Monte Carlo Simulation
 STAT/Q SCI 43: Itroductio to Resamplig ethods Sprig 27 Istructor: Ye-Chi Che Lecture 2: ote Carlo Simulatio 2 ote Carlo Itegratio Assume we wat to evaluate the followig itegratio: e x3 dx What ca we do?
A statistical method to determine sample size to estimate characteristic value of soil parameters
 A statistical method to determie sample size to estimate characteristic value of soil parameters Y. Hojo, B. Setiawa 2 ad M. Suzuki 3 Abstract Sample size is a importat factor to be cosidered i determiig
Statistical Inference (Chapter 10) Statistical inference = learn about a population based on the information provided by a sample.
 Statistical inference = learn about a population based on the information provided by a sample.") Statistical Iferece (Chapter 10) Statistical iferece = lear about a populatio based o the iformatio provided by a sample. Populatio: The set of all values of a radom variable X of iterest. Characterized
Statistical Iferece (Chapter 10) Statistical iferece = lear about a populatio based o the iformatio provided by a sample. Populatio: The set of all values of a radom variable X of iterest. Characterized
Chapter 6 Sampling Distributions
 Chapter 6 Samplig Distributios 1 I most experimets, we have more tha oe measuremet for ay give variable, each measuremet beig associated with oe radomly selected a member of a populatio. Hece we eed to
A Simplified Derivation of Scalar Kalman Filter using Bayesian Probability Theory
 6th Iteratioal Workshop o Aalysis of Dyamic Measuremets Jue -3 0 Göteorg Swede A Simplified Derivatio of Scalar Kalma Filter usig Bayesia Proaility Theory Gregory Kyriazis Imetro - Electrical Metrology
ECE 8527: Introduction to Machine Learning and Pattern Recognition Midterm # 1. Vaishali Amin Fall, 2015
 ECE 8527: Itroductio to Machie Learig ad Patter Recogitio Midterm # 1 Vaishali Ami Fall, 2015 tue39624@temple.edu Problem No. 1: Cosider a two-class discrete distributio problem: ω 1 :{[0,0], [2,0], [2,2],
CEE 522 Autumn Uncertainty Concepts for Geotechnical Engineering
 CEE 5 Autum 005 Ucertaity Cocepts for Geotechical Egieerig Basic Termiology Set A set is a collectio of (mutually exclusive) objects or evets. The sample space is the (collectively exhaustive) collectio
ANALYSIS OF EXPERIMENTAL ERRORS
 ANALYSIS OF EXPERIMENTAL ERRORS All physical measuremets ecoutered i the verificatio of physics theories ad cocepts are subject to ucertaities that deped o the measurig istrumets used ad the coditios uder
Analysis of Experimental Data
 Aalysis of Experimetal Data 6544597.0479 ± 0.000005 g Quatitative Ucertaity Accuracy vs. Precisio Whe we make a measuremet i the laboratory, we eed to kow how good it is. We wat our measuremets to be both
Introductory statistics
 CM9S: Machie Learig for Bioiformatics Lecture - 03/3/06 Itroductory statistics Lecturer: Sriram Sakararama Scribe: Sriram Sakararama We will provide a overview of statistical iferece focussig o the key
- E < p. ˆ p q ˆ E = q ˆ = 1 - p ˆ = sample proportion of x failures in a sample size of n. where. x n sample proportion. population proportion
 1 Chapter 7 ad 8 Review for Exam Chapter 7 Estimates ad Sample Sizes 2 Defiitio Cofidece Iterval (or Iterval Estimate) a rage (or a iterval) of values used to estimate the true value of the populatio parameter
EXAMINATIONS OF THE ROYAL STATISTICAL SOCIETY
 EXAMINATIONS OF THE ROYAL STATISTICAL SOCIETY GRADUATE DIPLOMA, 016 MODULE : Statistical Iferece Time allowed: Three hours Cadidates should aswer FIVE questios. All questios carry equal marks. The umber
Sample Size Determination (Two or More Samples)
") Sample Sie Determiatio (Two or More Samples) STATGRAPHICS Rev. 963 Summary... Data Iput... Aalysis Summary... 5 Power Curve... 5 Calculatios... 6 Summary This procedure determies a suitable sample sie
Sample Sie Determiatio (Two or More Samples) STATGRAPHICS Rev. 963 Summary... Data Iput... Aalysis Summary... 5 Power Curve... 5 Calculatios... 6 Summary This procedure determies a suitable sample sie
On an Application of Bayesian Estimation
 O a Applicatio of ayesia Estimatio KIYOHARU TANAKA School of Sciece ad Egieerig, Kiki Uiversity, Kowakae, Higashi-Osaka, JAPAN Email: ktaaka@ifokidaiacjp EVGENIY GRECHNIKOV Departmet of Mathematics, auma
Statistical Analysis on Uncertainty for Autocorrelated Measurements and its Applications to Key Comparisons
 Statistical Aalysis o Ucertaity for Autocorrelated Measuremets ad its Applicatios to Key Comparisos Nie Fa Zhag Natioal Istitute of Stadards ad Techology Gaithersburg, MD 0899, USA Outlies. Itroductio.
FACULTY OF MATHEMATICAL STUDIES MATHEMATICS FOR PART I ENGINEERING. Lectures
 FACULTY OF MATHEMATICAL STUDIES MATHEMATICS FOR PART I ENGINEERING Lectures MODULE 5 STATISTICS II. Mea ad stadard error of sample data. Biomial distributio. Normal distributio 4. Samplig 5. Cofidece itervals
Random Variables, Sampling and Estimation
 Chapter 1 Radom Variables, Samplig ad Estimatio 1.1 Itroductio This chapter will cover the most importat basic statistical theory you eed i order to uderstad the ecoometric material that will be comig
Elementary manipulations of probabilities
 Elemetary maipulatios of probabilities Set probability of multi-valued r.v. {=Odd} = +3+5 = /6+/6+/6 = ½ X X,, X i j X i j Multi-variat distributio: Joit probability: X true true X X,, X X i j i j X X
Properties and Hypothesis Testing
 Chapter 3 Properties ad Hypothesis Testig 3.1 Types of data The regressio techiques developed i previous chapters ca be applied to three differet kids of data. 1. Cross-sectioal data. 2. Time series data.
Magnitude uncertainties impact seismic rate estimates, forecasts, and predictability experiments
 JOURNAL OF GEOPHYSICAL RESEARCH, VOL. 113,, doi:10.1029/2007jb005427, 2008 Magnitude uncertainties impact seismic rate estimates, forecasts, and predictability experiments Maximilian J. Werner 1 and Didier
Statistical Pattern Recognition
 Statistical Patter Recogitio Classificatio: No-Parametric Modelig Hamid R. Rabiee Jafar Muhammadi Sprig 2014 http://ce.sharif.edu/courses/92-93/2/ce725-2/ Ageda Parametric Modelig No-Parametric Modelig
11 Correlation and Regression
 11 Correlatio Regressio 11.1 Multivariate Data Ofte we look at data where several variables are recorded for the same idividuals or samplig uits. For example, at a coastal weather statio, we might record
The standard deviation of the mean
 Physics 6C Fall 20 The stadard deviatio of the mea These otes provide some clarificatio o the distictio betwee the stadard deviatio ad the stadard deviatio of the mea.. The sample mea ad variace Cosider
SDS 321: Introduction to Probability and Statistics
 SDS 321: Itroductio to Probability ad Statistics Lecture 23: Cotiuous radom variables- Iequalities, CLT Puramrita Sarkar Departmet of Statistics ad Data Sciece The Uiversity of Texas at Austi www.cs.cmu.edu/
R. van Zyl 1, A.J. van der Merwe 2. Quintiles International, University of the Free State
 Bayesia Cotrol Charts for the Two-parameter Expoetial Distributio if the Locatio Parameter Ca Take o Ay Value Betwee Mius Iity ad Plus Iity R. va Zyl, A.J. va der Merwe 2 Quitiles Iteratioal, ruaavz@gmail.com
Measurement uncertainty of the sound absorption
 Measuremet ucertaity of the soud absorptio coefficiet Aa Izewska Buildig Research Istitute, Filtrowa Str., 00-6 Warsaw, Polad a.izewska@itb.pl 6887 The stadard ISO/IEC 705:005 o the competece of testig
MOST PEOPLE WOULD RATHER LIVE WITH A PROBLEM THEY CAN'T SOLVE, THAN ACCEPT A SOLUTION THEY CAN'T UNDERSTAND.
 XI-1 (1074) MOST PEOPLE WOULD RATHER LIVE WITH A PROBLEM THEY CAN'T SOLVE, THAN ACCEPT A SOLUTION THEY CAN'T UNDERSTAND. R. E. D. WOOLSEY AND H. S. SWANSON XI-2 (1075) STATISTICAL DECISION MAKING Advaced
Lecture 33: Bootstrap
 Lecture 33: ootstrap Motivatio To evaluate ad compare differet estimators, we eed cosistet estimators of variaces or asymptotic variaces of estimators. This is also importat for hypothesis testig ad cofidece
Activity 3: Length Measurements with the Four-Sided Meter Stick
 Activity 3: Legth Measuremets with the Four-Sided Meter Stick OBJECTIVE: The purpose of this experimet is to study errors ad the propagatio of errors whe experimetal data derived usig a four-sided meter
Accuracy assessment methods and challenges
 Accuracy assessmet methods ad challeges Giles M. Foody School of Geography Uiversity of Nottigham giles.foody@ottigham.ac.uk Backgroud Need for accuracy assessmet established. Cosiderable progress ow see
MATH 320: Probability and Statistics 9. Estimation and Testing of Parameters. Readings: Pruim, Chapter 4
 MATH 30: Probability ad Statistics 9. Estimatio ad Testig of Parameters Estimatio ad Testig of Parameters We have bee dealig situatios i which we have full kowledge of the distributio of a radom variable.
Probability and MLE.
 10-701 Probability ad MLE http://www.cs.cmu.edu/~pradeepr/701 (brief) itro to probability Basic otatios Radom variable - referrig to a elemet / evet whose status is ukow: A = it will rai tomorrow Domai
Discrete Mathematics for CS Spring 2008 David Wagner Note 22
 CS 70 Discrete Mathematics for CS Sprig 2008 David Wager Note 22 I.I.D. Radom Variables Estimatig the bias of a coi Questio: We wat to estimate the proportio p of Democrats i the US populatio, by takig
Lectures on Stochastic System Analysis and Bayesian Updating
 Lectures o Stochastic System Aalysis ad Bayesia Updatig Jue 29-July 13 2005 James L. Beck, Califoria Istitute of Techology Jiaye Chig, Natioal Taiwa Uiversity of Sciece & Techology Siu-Kui (Iva) Au, Nayag
Chapter 6 Principles of Data Reduction
 Chapter 6 for BST 695: Special Topics i Statistical Theory. Kui Zhag, 0 Chapter 6 Priciples of Data Reductio Sectio 6. Itroductio Goal: To summarize or reduce the data X, X,, X to get iformatio about a
5. Likelihood Ratio Tests
 1 of 5 7/29/2009 3:16 PM Virtual Laboratories > 9. Hy pothesis Testig > 1 2 3 4 5 6 7 5. Likelihood Ratio Tests Prelimiaries As usual, our startig poit is a radom experimet with a uderlyig sample space,
Lecture 11 and 12: Basic estimation theory
 Lecture ad 2: Basic estimatio theory Sprig 202 - EE 94 Networked estimatio ad cotrol Prof. Kha March 2 202 I. MAXIMUM-LIKELIHOOD ESTIMATORS The maximum likelihood priciple is deceptively simple. Louis
This is an introductory course in Analysis of Variance and Design of Experiments.
 1 Notes for M 384E, Wedesday, Jauary 21, 2009 (Please ote: I will ot pass out hard-copy class otes i future classes. If there are writte class otes, they will be posted o the web by the ight before class
Lecture 6 Chi Square Distribution (χ 2 ) and Least Squares Fitting
 and Least Squares Fitting") Lecture 6 Chi Square Distributio (χ ) ad Least Squares Fittig Chi Square Distributio (χ ) Suppose: We have a set of measuremets {x 1, x, x }. We kow the true value of each x i (x t1, x t, x t ). We would
Lecture 6 Chi Square Distributio (χ ) ad Least Squares Fittig Chi Square Distributio (χ ) Suppose: We have a set of measuremets {x 1, x, x }. We kow the true value of each x i (x t1, x t, x t ). We would
If, for instance, we were required to test whether the population mean μ could be equal to a certain value μ
 STATISTICAL INFERENCE INTRODUCTION Statistical iferece is that brach of Statistics i which oe typically makes a statemet about a populatio based upo the results of a sample. I oesample testig, we essetially
UCLA STAT 110B Applied Statistics for Engineering and the Sciences
 UCLA TAT 110B Applied tatistics for Egieerig ad the cieces Istructor: Ivo Diov, Asst. Prof. I tatistics ad Neurology Teachig Assistats: Bria Ng, UCLA tatistics Uiversity of Califoria, Los Ageles, prig
Uncertainty. Variables. assigns to each sentence numerical degree of belief between 0 and 1. uncertainty
 Bayes Classificatio Ucertaity & robability Baye's rule Choosig Hypotheses- Maximum a posteriori Maximum Likelihood - Baye's cocept learig Maximum Likelihood of real valued fuctio Bayes optimal Classifier
Bayesian Methods: Introduction to Multi-parameter Models
 Bayesia Methods: Itroductio to Multi-parameter Models Parameter: θ = ( θ, θ) Give Likelihood p(y θ) ad prior p(θ ), the posterior p proportioal to p(y θ) x p(θ ) Margial posterior ( θ, θ y) is Iterested
Mechatronics. Time Response & Frequency Response 2 nd -Order Dynamic System 2-Pole, Low-Pass, Active Filter
 Time Respose & Frequecy Respose d -Order Dyamic System -Pole, Low-Pass, Active Filter R 4 R 7 C 5 e i R 1 C R 3 - + R 6 - + e out Assigmet: Perform a Complete Dyamic System Ivestigatio of the Two-Pole,
Goodness-of-Fit Tests and Categorical Data Analysis (Devore Chapter Fourteen)
") Goodess-of-Fit Tests ad Categorical Data Aalysis (Devore Chapter Fourtee) MATH-252-01: Probability ad Statistics II Sprig 2019 Cotets 1 Chi-Squared Tests with Kow Probabilities 1 1.1 Chi-Squared Testig................
Goodess-of-Fit Tests ad Categorical Data Aalysis (Devore Chapter Fourtee) MATH-252-01: Probability ad Statistics II Sprig 2019 Cotets 1 Chi-Squared Tests with Kow Probabilities 1 1.1 Chi-Squared Testig................
Lecture 6 Chi Square Distribution (χ 2 ) and Least Squares Fitting
 and Least Squares Fitting") Lecture 6 Chi Square Distributio (χ ) ad Least Squares Fittig Chi Square Distributio (χ ) Suppose: We have a set of measuremets {x 1, x, x }. We kow the true value of each x i (x t1, x t, x t ). We would
Lecture 6 Chi Square Distributio (χ ) ad Least Squares Fittig Chi Square Distributio (χ ) Suppose: We have a set of measuremets {x 1, x, x }. We kow the true value of each x i (x t1, x t, x t ). We would
Data Assimilation. Alan O Neill University of Reading, UK
 Data Assimilatio Ala O Neill Uiversity of Readig, UK he Kalma Filter Kalma Filter (expesive Use model equatios to propagate B forward i time. B B(t Aalysis step as i OI Evolutio of Covariace Matrices (
Lecture 1 Probability and Statistics
 Wikipedia: Lecture 1 Probability ad Statistics Bejami Disraeli, British statesma ad literary figure (1804 1881): There are three kids of lies: lies, damed lies, ad statistics. popularized i US by Mark
Statisticians use the word population to refer the total number of (potential) observations under consideration
 observations under consideration") 6 Samplig Distributios Statisticias use the word populatio to refer the total umber of (potetial) observatios uder cosideratio The populatio is just the set of all possible outcomes i our sample space
6 Samplig Distributios Statisticias use the word populatio to refer the total umber of (potetial) observatios uder cosideratio The populatio is just the set of all possible outcomes i our sample space
PSYCHOLOGICAL RESEARCH (PYC 304-C) Lecture 9
 Lecture 9") Hypothesis testig PSYCHOLOGICAL RESEARCH (PYC 34-C Lecture 9 Statistical iferece is that brach of Statistics i which oe typically makes a statemet about a populatio based upo the results of a sample. I
Hypothesis testig PSYCHOLOGICAL RESEARCH (PYC 34-C Lecture 9 Statistical iferece is that brach of Statistics i which oe typically makes a statemet about a populatio based upo the results of a sample. I
Last time: Moments of the Poisson distribution from its generating function. Example: Using telescope to measure intensity of an object
 6.3 Stochastic Estimatio ad Cotrol, Fall 004 Lecture 7 Last time: Momets of the Poisso distributio from its geeratig fuctio. Gs () e dg µ e ds dg µ ( s) µ ( s) µ ( s) µ e ds dg X µ ds X s dg dg + ds ds
11 THE GMM ESTIMATION
 Cotets THE GMM ESTIMATION 2. Cosistecy ad Asymptotic Normality..................... 3.2 Regularity Coditios ad Idetificatio..................... 4.3 The GMM Iterpretatio of the OLS Estimatio.................
II RecogniDon, CharacterizaDon, Risk EvaluaDon, Risk Assessment
 RECURRENCE INTERVALS AND PROBABILITY (18) I Mai Topics A RecogiDo, CharacterizaDo, Risk EvaluaDo, Risk Assessmet B Recurrece itervals C Simple empirical earthquake recurrece models D Seismic gaps E Probability
Kolmogorov-Smirnov type Tests for Local Gaussianity in High-Frequency Data
 Proceedigs 59th ISI World Statistics Cogress, 5-30 August 013, Hog Kog (Sessio STS046) p.09 Kolmogorov-Smirov type Tests for Local Gaussiaity i High-Frequecy Data George Tauche, Duke Uiversity Viktor Todorov,
Bayesian Control Charts for the Two-parameter Exponential Distribution
 Bayesia Cotrol Charts for the Two-parameter Expoetial Distributio R. va Zyl, A.J. va der Merwe 2 Quitiles Iteratioal, ruaavz@gmail.com 2 Uiversity of the Free State Abstract By usig data that are the mileages
Overview of Estimation
 Topic Iferece is the problem of turig data ito kowledge, where kowledge ofte is expressed i terms of etities that are ot preset i the data per se but are preset i models that oe uses to iterpret the data.
Statistics 511 Additional Materials
 Cofidece Itervals o mu Statistics 511 Additioal Materials This topic officially moves us from probability to statistics. We begi to discuss makig ifereces about the populatio. Oe way to differetiate probability
NO! This is not evidence in favor of ESP. We are rejecting the (null) hypothesis that the results are
 hypothesis that the results are") Hypothesis Testig Suppose you are ivestigatig extra sesory perceptio (ESP) You give someoe a test where they guess the color of card 100 times They are correct 90 times For guessig at radom you would expect
Hypothesis Testig Suppose you are ivestigatig extra sesory perceptio (ESP) You give someoe a test where they guess the color of card 100 times They are correct 90 times For guessig at radom you would expect
ECE 901 Lecture 12: Complexity Regularization and the Squared Loss
 ECE 90 Lecture : Complexity Regularizatio ad the Squared Loss R. Nowak 5/7/009 I the previous lectures we made use of the Cheroff/Hoeffdig bouds for our aalysis of classifier errors. Hoeffdig s iequality
Summary. Recap ... Last Lecture. Summary. Theorem
 Last Lecture Biostatistics 602 - Statistical Iferece Lecture 23 Hyu Mi Kag April 11th, 2013 What is p-value? What is the advatage of p-value compared to hypothesis testig procedure with size α? How ca
Chapter 9: Numerical Differentiation
 178 Chapter 9: Numerical Differetiatio Numerical Differetiatio Formulatio of equatios for physical problems ofte ivolve derivatives (rate-of-chage quatities, such as velocity ad acceleratio). Numerical
Resampling Methods. X (1/2), i.e., Pr (X i m) = 1/2. We order the data: X (1) X (2) X (n). Define the sample median: ( n.
, i.e., Pr (X i m) = 1/2. We order the data: X (1) X (2) X (n). Define the sample median: ( n.") Jauary 1, 2019 Resamplig Methods Motivatio We have so may estimators with the property θ θ d N 0, σ 2 We ca also write θ a N θ, σ 2 /, where a meas approximately distributed as Oce we have a cosistet estimator
Jauary 1, 2019 Resamplig Methods Motivatio We have so may estimators with the property θ θ d N 0, σ 2 We ca also write θ a N θ, σ 2 /, where a meas approximately distributed as Oce we have a cosistet estimator
Problem Set 4 Due Oct, 12
 EE226: Radom Processes i Systems Lecturer: Jea C. Walrad Problem Set 4 Due Oct, 12 Fall 06 GSI: Assae Gueye This problem set essetially reviews detectio theory ad hypothesis testig ad some basic otios
EECS564 Estimation, Filtering, and Detection Hwk 2 Solns. Winter p θ (z) = (2θz + 1 θ), 0 z 1
 = (2θz + 1 θ), 0 z 1") EECS564 Estimatio, Filterig, ad Detectio Hwk 2 Sols. Witer 25 4. Let Z be a sigle observatio havig desity fuctio where. p (z) = (2z + ), z (a) Assumig that is a oradom parameter, fid ad plot the maximum
EECS564 Estimatio, Filterig, ad Detectio Hwk 2 Sols. Witer 25 4. Let Z be a sigle observatio havig desity fuctio where. p (z) = (2z + ), z (a) Assumig that is a oradom parameter, fid ad plot the maximum
Lecture 1 Probability and Statistics
 Wikipedia: Lecture 1 Probability ad Statistics Bejami Disraeli, British statesma ad literary figure (1804 1881): There are three kids of lies: lies, damed lies, ad statistics. popularized i US by Mark
Statistical Theory; Why is the Gaussian Distribution so popular?
 Statistical Theory; Why is the Gaussia Distributio so popular? Rob Nicholls MRC LMB Statistics Course 2014 Cotets Cotiuous Radom Variables Expectatio ad Variace Momets The Law of Large Numbers (LLN) The
Provläsningsexemplar / Preview TECHNICAL REPORT INTERNATIONAL SPECIAL COMMITTEE ON RADIO INTERFERENCE
 TECHNICAL REPORT CISPR 16-4-3 2004 AMENDMENT 1 2006-10 INTERNATIONAL SPECIAL COMMITTEE ON RADIO INTERFERENCE Amedmet 1 Specificatio for radio disturbace ad immuity measurig apparatus ad methods Part 4-3:
Econ 325 Notes on Point Estimator and Confidence Interval 1 By Hiro Kasahara
 Poit Estimator Eco 325 Notes o Poit Estimator ad Cofidece Iterval 1 By Hiro Kasahara Parameter, Estimator, ad Estimate The ormal probability desity fuctio is fully characterized by two costats: populatio
A proposed discrete distribution for the statistical modeling of
 It. Statistical Ist.: Proc. 58th World Statistical Cogress, 0, Dubli (Sessio CPS047) p.5059 A proposed discrete distributio for the statistical modelig of Likert data Kidd, Marti Cetre for Statistical
POLS, GLS, FGLS, GMM. Outline of Linear Systems of Equations. Common Coefficients, Panel Data Model. Preliminaries
 Outlie of Liear Systems of Equatios POLS, GLS, FGLS, GMM Commo Coefficiets, Pael Data Model Prelimiaries he liear pael data model is a static model because all explaatory variables are dated cotemporaeously
Lesson 11: Simple Linear Regression
 Lesso 11: Simple Liear Regressio Ka-fu WONG December 2, 2004 I previous lessos, we have covered maily about the estimatio of populatio mea (or expected value) ad its iferece. Sometimes we are iterested
Hypothesis Testing. Evaluation of Performance of Learned h. Issues. Trade-off Between Bias and Variance
 Hypothesis Testig Empirically evaluatig accuracy of hypotheses: importat activity i ML. Three questios: Give observed accuracy over a sample set, how well does this estimate apply over additioal samples?
Error & Uncertainty. Error. More on errors. Uncertainty. Page # The error is the difference between a TRUE value, x, and a MEASURED value, x i :
 Error Error & Ucertaity The error is the differece betwee a TRUE value,, ad a MEASURED value, i : E = i There is o error-free measuremet. The sigificace of a measuremet caot be judged uless the associate
There is no straightforward approach for choosing the warmup period l.
 B. Maddah INDE 504 Discrete-Evet Simulatio Output Aalysis () Statistical Aalysis for Steady-State Parameters I a otermiatig simulatio, the iterest is i estimatig the log ru steady state measures of performace.
Continuous Data that can take on any real number (time/length) based on sample data. Categorical data can only be named or categorised
 based on sample data. Categorical data can only be named or categorised") Questio 1. (Topics 1-3) A populatio cosists of all the members of a group about which you wat to draw a coclusio (Greek letters (μ, σ, Ν) are used) A sample is the portio of the populatio selected for
Questio 1. (Topics 1-3) A populatio cosists of all the members of a group about which you wat to draw a coclusio (Greek letters (μ, σ, Ν) are used) A sample is the portio of the populatio selected for
PhD Preliminary Oral Exam CHARACTERIZATION AND PREDICTION OF CFD SIMULATION UNCERTAINITIES. by Serhat Hosder
 PhD Prelimiary Oral Exam CHARACTERIZATION AND PREDICTION OF CFD SIMULATION UNCERTAINITIES by Serhat Hosder Chair: Dr. Berard Grossma Committee Members: Dr. Raphael T. Haftka Dr. William H. Maso Dr. Reece
Chapter 11 Output Analysis for a Single Model. Banks, Carson, Nelson & Nicol Discrete-Event System Simulation
 Chapter Output Aalysis for a Sigle Model Baks, Carso, Nelso & Nicol Discrete-Evet System Simulatio Error Estimatio If {,, } are ot statistically idepedet, the S / is a biased estimator of the true variace.
Lecture Note 8 Point Estimators and Point Estimation Methods. MIT Spring 2006 Herman Bennett
 Lecture Note 8 Poit Estimators ad Poit Estimatio Methods MIT 14.30 Sprig 2006 Herma Beett Give a parameter with ukow value, the goal of poit estimatio is to use a sample to compute a umber that represets
Mathematical Statistics - MS
 Paper Specific Istructios. The examiatio is of hours duratio. There are a total of 60 questios carryig 00 marks. The etire paper is divided ito three sectios, A, B ad C. All sectios are compulsory. Questios
Computing Confidence Intervals for Sample Data
 Computig Cofidece Itervals for Sample Data Topics Use of Statistics Sources of errors Accuracy, precisio, resolutio A mathematical model of errors Cofidece itervals For meas For variaces For proportios
The AMSU Observation Bias Correction and Its Application Retrieval Scheme, and Typhoon Analysis
 The AMSU Observatio Bias Correctio ad Its Applicatio Retrieval Scheme, ad Typhoo Aalysis Chie-Be Chou, Kug-Hwa Wag Cetral Weather Bureau, Taipei, Taiwa, R.O.C. Abstract Sice most of AMSU chaels have a
Statistical Noise Models and Diagnostics
 L. Yaroslavsky: Advaced Image Processig Lab: A Tutorial, EUSIPCO2 LECTURE 2 Statistical oise Models ad Diagostics 2. Statistical models of radom iterfereces: (i) Additive sigal idepedet oise model: r =
MA238 Assignment 4 Solutions (part a)
") (i) Sigle sample tests. Questio. MA38 Assigmet 4 Solutios (part a) (a) (b) (c) H 0 : = 50 sq. ft H A : < 50 sq. ft H 0 : = 3 mpg H A : > 3 mpg H 0 : = 5 mm H A : 5mm Questio. (i) What are the ull ad alterative
(i) Sigle sample tests. Questio. MA38 Assigmet 4 Solutios (part a) (a) (b) (c) H 0 : = 50 sq. ft H A : < 50 sq. ft H 0 : = 3 mpg H A : > 3 mpg H 0 : = 5 mm H A : 5mm Questio. (i) What are the ull ad alterative
Study on Coal Consumption Curve Fitting of the Thermal Power Based on Genetic Algorithm
 Joural of ad Eergy Egieerig, 05, 3, 43-437 Published Olie April 05 i SciRes. http://www.scirp.org/joural/jpee http://dx.doi.org/0.436/jpee.05.34058 Study o Coal Cosumptio Curve Fittig of the Thermal Based
A PROCEDURE TO MODIFY THE FREQUENCY AND ENVELOPE CHARACTERISTICS OF EMPIRICAL GREEN'S FUNCTION. Lin LU 1 SUMMARY
 A POCEDUE TO MODIFY THE FEQUENCY AND ENVELOPE CHAACTEISTICS OF EMPIICAL GEEN'S FUNCTION Li LU SUMMAY Semi-empirical method, which divides the fault plae of large earthquake ito mets ad uses small groud
Generalized Semi- Markov Processes (GSMP)
") Geeralized Semi- Markov Processes (GSMP) Summary Some Defiitios Markov ad Semi-Markov Processes The Poisso Process Properties of the Poisso Process Iterarrival times Memoryless property ad the residual
Geeralized Semi- Markov Processes (GSMP) Summary Some Defiitios Markov ad Semi-Markov Processes The Poisso Process Properties of the Poisso Process Iterarrival times Memoryless property ad the residual
First Year Quantitative Comp Exam Spring, Part I - 203A. f X (x) = 0 otherwise
 = 0 otherwise") First Year Quatitative Comp Exam Sprig, 2012 Istructio: There are three parts. Aswer every questio i every part. Questio I-1 Part I - 203A A radom variable X is distributed with the margial desity: >
First Year Quatitative Comp Exam Sprig, 2012 Istructio: There are three parts. Aswer every questio i every part. Questio I-1 Part I - 203A A radom variable X is distributed with the margial desity: >
Sample Size Estimation in the Proportional Hazards Model for K-sample or Regression Settings Scott S. Emerson, M.D., Ph.D.
 ample ie Estimatio i the Proportioal Haards Model for K-sample or Regressio ettigs cott. Emerso, M.D., Ph.D. ample ie Formula for a Normally Distributed tatistic uppose a statistic is kow to be ormally
Research Article Health Monitoring for a Structure Using Its Nonstationary Vibration
 Hidawi Publishig Corporatio Advaces i Acoustics ad Vibratio Volume 2, Article ID 69652, 5 pages doi:.55/2/69652 Research Article Health Moitorig for a Structure Usig Its Nostatioary Vibratio Yoshimutsu
A Variational Approach to NWP Preprocessing and Quality Control
 A Variatioal Approach to NWP Preprocessig ad Quality Cotrol K. Garrett, S.-A. Boukabara 2, Q. Liu 3 8 th Iteratioal TOVS Study Coferece March 23, 202 Toulouse, Frace. Riverside Techology, Ic 2. Joit Ceter
Lecture 9: September 19
 36-700: Probability ad Mathematical Statistics I Fall 206 Lecturer: Siva Balakrisha Lecture 9: September 9 9. Review ad Outlie Last class we discussed: Statistical estimatio broadly Pot estimatio Bias-Variace
Outline. CSCI-567: Machine Learning (Spring 2019) Outline. Prof. Victor Adamchik. Mar. 26, 2019
 Outline. Prof. Victor Adamchik. Mar. 26, 2019") Outlie CSCI-567: Machie Learig Sprig 209 Gaussia mixture models Prof. Victor Adamchik 2 Desity estimatio U of Souther Califoria Mar. 26, 209 3 Naive Bayes Revisited March 26, 209 / 57 March 26, 209 2 /
Outlie CSCI-567: Machie Learig Sprig 209 Gaussia mixture models Prof. Victor Adamchik 2 Desity estimatio U of Souther Califoria Mar. 26, 209 3 Naive Bayes Revisited March 26, 209 / 57 March 26, 209 2 /
Lecture 4. Hw 1 and 2 will be reoped after class for every body. New deadline 4/20 Hw 3 and 4 online (Nima is lead)
") Lecture 4 Homework Hw 1 ad 2 will be reoped after class for every body. New deadlie 4/20 Hw 3 ad 4 olie (Nima is lead) Pod-cast lecture o-lie Fial projects Nima will register groups ext week. Email/tell
Lecture 4 Homework Hw 1 ad 2 will be reoped after class for every body. New deadlie 4/20 Hw 3 ad 4 olie (Nima is lead) Pod-cast lecture o-lie Fial projects Nima will register groups ext week. Email/tell
577. Estimation of surface roughness using high frequency vibrations
 577. Estimatio of surface roughess usig high frequecy vibratios V. Augutis, M. Sauoris, Kauas Uiversity of Techology Electroics ad Measuremets Systems Departmet Studetu str. 5-443, LT-5368 Kauas, Lithuaia
Exponential Families and Bayesian Inference
 Computer Visio Expoetial Families ad Bayesia Iferece Lecture Expoetial Families A expoetial family of distributios is a d-parameter family f(x; havig the followig form: f(x; = h(xe g(t T (x B(, (. where
Understanding Samples
 1 Will Moroe CS 109 Samplig ad Bootstrappig Lecture Notes #17 August 2, 2017 Based o a hadout by Chris Piech I this chapter we are goig to talk about statistics calculated o samples from a populatio. We
Lainiotis filter implementation. via Chandrasekhar type algorithm
 Joural of Computatios & Modellig, vol.1, o.1, 2011, 115-130 ISSN: 1792-7625 prit, 1792-8850 olie Iteratioal Scietific Press, 2011 Laiiotis filter implemetatio via Chadrasehar type algorithm Nicholas Assimais
November 2002 Course 4 solutions
 November Course 4 solutios Questio # Aswer: B φ ρ = = 5. φ φ ρ = φ + =. φ Solvig simultaeously gives: φ = 8. φ = 6. Questio # Aswer: C g = [(.45)] = [5.4] = 5; h= 5.4 5 =.4. ˆ π =.6 x +.4 x =.6(36) +.4(4)
Big Picture. 5. Data, Estimates, and Models: quantifying the accuracy of estimates.
 5. Data, Estimates, ad Models: quatifyig the accuracy of estimates. 5. Estimatig a Normal Mea 5.2 The Distributio of the Normal Sample Mea 5.3 Normal data, cofidece iterval for, kow 5.4 Normal data, cofidece