COMPOSITE MEANS AND ANOMALIES OF METEOROLOGICAL PARAMETERS FOR SUMMERTIME FLASH FLOODING IN THE NATIONAL WEATHER SERVICE EASTERN REGION
|
|
|
- Hilda Hill
- 5 years ago
- Views:
Transcription
1 COMPOSITE MEANS AND ANOLIES OF METEOROLOGICAL PARAMETERS FOR SUMMERTIME FLASH FLOODING IN THE NATIONAL WEATHER SERVICE EASTERN REGION Alan M. Cope and Lee Robertson NOAA/National Weather Service Mount Holly, New Jersey 1. Introduction The purpose of this study was to identify weather parameters associated with summertime flash flooding in the eastern United States, and more specifically, to investigate how these parameters may be similar or different across different parts of the Eastern Region of the National Weather Service (NWS-ER). Flash flooding in the NWS-ER is a very serious forecast and warning challenge. Over the past 10 years there were 99 flash flood events, or about 10 per year on average, that resulted in at least one fatality in NWS-ER (from Storm Data, ). In the same period there were 387 events, or nearly 40 per year, resulting in at least $1M damage. Flash flooding in the eastern U.S. can be produced by a variety of weather systems, both synoptic scale and meso-scale, as noted by Lapenta, et.al. (1995). Giordano and Fritsch (1991) examined warm-season flash-flood producing storms over an eight-state "Mid-Atlantic" area, and found significant differences between the East Coast and the Ohio Valley. Other studies have examined heavy rainfall events over various parts of the eastern U.S. For example, Konrad (1997) looked at synoptic patterns associated with heavy rainfall over the southern Appalachian region and vicinity, while Harnack, et.al. (1999) examined upper-air parameters before and during heavy rainfall events over New Jersey. Since many of those studies were published, two important new data sets have become available, namely the NCEP/NCAR global reanalysis (GR; Kalnay, et.al., 1996), and the North American Regional Reanalysis (NARR; Mesinger, et.al., 2006). These analyses greatly facilitate examination of weather parameters and patterns associated with specific phenomena or groups of related events. In particular, they allow for ready development of composite mean and anomaly charts of many different parameters at various levels throughout the atmosphere. The goal of this study was to use NARR and GR data to produce charts showing mean conditions associated with flash flood days over different parts of the NWS-ER and corresponding charts showing the departure from long-term means (anomalies). Section 2 describes the methods and criteria used to identify days with representative flash flood events. Section 3 describes the resulting mean and anomaly charts. Section 4 discusses similarities and differences among different parts of NWS-ER, and finally section 5 suggests some further avenues of research. 2. Data and Methodology 2.1 Heavy Rain and Flash Flooding This study is based on examination of flash flood (FF) events, whereas many previous studies have looked at cases based on heavy or intense rainfall reports. There is no universally accepted definition of a "flash flood"; however, the usual implication is that flooding occurs within six hours of the causative rainfall. It is recognized the flash flooding is not a purely meteorological event; hydrologic factors such as soil type, soil moisture and land use are very much in play. Thus the FF reports are something like a proxy for short-term heavy/intense rainfall. However, it is reasonable to believe that most warm-season flash flooding results from intense rainfall associated with deep moist convection (Doswell, et.al., 1996). Moreover, one might say that a
2 flash flood effectively "measures" the area-wide rainfall much better than any rain gage network, and integrates the combined effects of total rainfall amount and instantaneous rainfall intensity. Finally, FF events are the direct cause for loss of life and property, and it is for these events specifically that operational NWS meteorologists must issue timely and accurate watches and warnings. 2.2 Selection of Cases For this study, the NWS Eastern Region (NWS-ER) was divided up into four sub-regions: "New England", "Mid-Atlantic", Ohio Valley" and "South-Atlantic" (see Fig. 1.) The sub-region boundaries were based on NWS local office County Warning Areas (CWAs) and were chosen to be approximately equal in size, although they include anywhere from four CWAs ("Ohio Valley") to eight CWAs ("South-Atlantic"). The sub-region names do not quite correspond to traditional geographic regions; for example, Albany, NY (ALY) and Upton, NY (OKX) were included in the "New England" sub-region, because FF reports over the traditional New England area were relatively scarce. Orographically, the "Ohio Valley" sub-region is mainly west of the Appalachian Mountains, while the other sub-regions are mostly within or east of the mountains and closer to the Atlantic Ocean. These sub-regions correspond approximately to the regions in Lapenta, et.al. (1995), although they were looking primarily at synoptic-scale flooding. To identify significant flash flood days for each sub-region, all flash flood (FF) reports from June through August, , for all 23 NWS-ER offices, were obtained from the internal NWS verification web site. These reports were entered into a spreadsheet, and sorted by day, office and sub-region. Days with at least five FF reports in any sub-region were identified. The number of reports on each of those days was plotted on a map by CWA, to get a rough distribution of reports with the sub-region. From the days identified above, the most representative FF days were then selected according to the following criteria. First, for any sub-region, days with the most FF reports were selected, provided that the number of reports in that sub-region on the given day was greater than the combined total reports in the other three sub-regions. In other words, larger FF events focused on one sub-region were preferred. Hence, no FF day could be used for more than one sub-region. As a result of this criterion, numerous days with many FF reports in NWS-ER were omitted from the study, because the reports were more or less evenly distributed over two or more sub-regions. It was felt that inclusion of such days would tend to blur any possible distinctions in meteorological parameters among the sub-regions, thus defeating the main purpose. (From the local forecast and warning viewpoint, it is a relatively minor concern whether or not flash floods occur in other areas, so this criterion is likely not ideal for a local study.) Also, this method may tend to focus more on progressive systems that affect primarily one region on a given day, and another downstream region on the following day. Second, FF days for any sub-region could not be consecutive; a separation of one day or more was required between FF days. This was meant to provide some degree of independence among the sample days. Some multi-day events are represented in this study, by selection of one day from the event. In the final selection, most events were at least one week apart (see Appendix). Third, most days with FF reports in only one CWA were discarded. This was meant to avoid more localized FF events. However, a couple of single-cwa events were allowed for the "New England" sub-region because of the relative scarcity of reports there. Finally, days with a named tropical system in or near NWS-ER were discarded. Tropical systems were identified by examining 1200 UTC surface charts from the "Daily Weather Map" series. In a few cases there was a named storm over the Gulf of Mexico or over the offshore waters of the Atlantic Ocean. This criterion does not guarantee that all tropical influences were eliminated; in a few cases a tropical storm may have recently traversed an area leaving behind enhanced moisture. Furthermore, moisture plumes extending pole-ward from tropical systems may
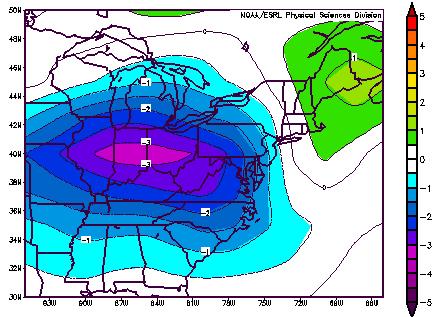
3 sometimes enhance flash flooding far ahead of the main center. Of course, some of the worst flooding in NWS-ER occurs with tropical systems. However, an approaching tropical storm often seems to "trump" other forecast considerations, and may be considered as a separate type of event (LaPenta, et.al., 1995). The end result of this process was four sets of flash-flood days representing the four sub-regions. These dates are listed in the appendix, and summary information for each set of FF days is given in Table 1. The dates in each list, taken together, are intended to represent the conditions associated with active flash flooding days in each sub-region. Note that the "Ohio Valley" subregion, with the fewest CWAs, had the greatest number of FF days (25), and the greatest average number of reports per FF day (23.3). "New England" ended up with the fewest FF days (21) and the lowest average number of reports per day (9.3). 2.3 Creation of Composite Charts Average meteorological conditions based on the dates in each list were examined using the GR and NARR re-analysis data sets. For general information on the GR data, see Kalnay, et.al. (1996); for more information about the NARR, see Mesinger, et.al. (2006). For this study, GR and NARR daily-mean data were accessed via web-based interfaces maintained by NOAA/ Earth System Research Laboratory (ESRL). NARR data is provided on a 32-km resolution grid at 25- mb pressure intervals from 1000 to 100 mb. However, daily composites from the NARR data were limited to basic fields: geo-potential height, temperature, specific humidity, zonal and meridional winds, vertical motion, and precipitation. The GR data is on a much coarser grid (about 210 km) and is available mainly at standard pressure levels. The GR data daily composites included the same basic fields as the NARR, but also certain derived fields such as precipitable water and lifted index, as well as the total vector wind. The NARR daily composite means are averages of three-hourly NARR data at 00, 03, 06, 09, 12, 15, 18 and 21 hours UTC, while the GR daily composites are averages of 00, 06, 12 and 18 UTC data. The NARR daily composite anomalies are based on long-term means from 1979 to 2001; the GR anomalies are based on means from 1968 to Composite anomalies are obtained by subtracting the long-term mean from each daily mean, and then averaging these daily anomalies. The long-term mean for each sub-region is based only on the dates in the list for that sub-region, so the means show minor differences from one sub-region to another. As an example, for long-term means of 850 mb temperature, the maximum difference among the four sub-regions is about 0.5 deg C at any point. The lists of FF days for each of the four sub-regions were supplied individually as input to webbased interfaces for the GR and the NARR data sets. From these web sites, composite daily mean and anomaly charts for each sub-region were created for geo-potential height, temperature, specific humidity, total vector wind, zonal wind, meridional wind, moisture transport and omega at 1000, 925, 850, 700, 500 and 250mb (moisture omitted at 250mb). Charts for mean sea-level pressure (MSLP), total precipitable water and lifted index were also generated. Total wind, MSLP, moisture transport and lifted index were based on GR data; all other fields were based on the NARR. 3. Results Figure 2a shows daily composite means for mean sea level pressure, while figure 2b shows the corresponding composite anomalies. Each sub-region has a unique pattern, but an MSLP anomaly minimum is found to the west or southwest in all four. The strongest negative anomaly is associated with the New England events, while the weakest occurs with events in the South- Atlantic. The 1000mb height patterns (not shown) showed negative anomalies similar to MSLP, as would be expected.
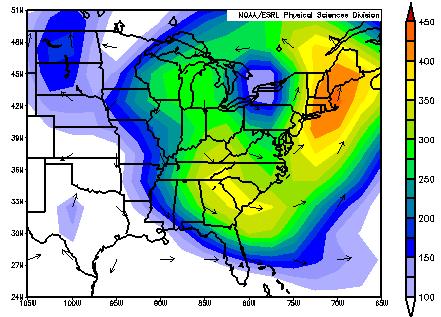
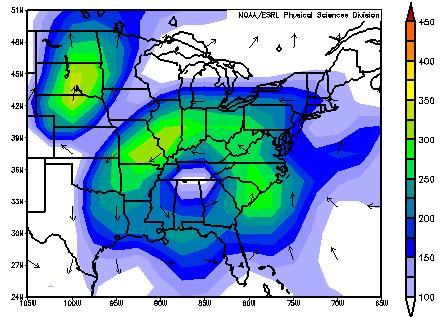
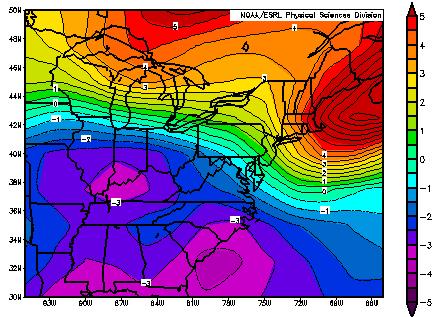
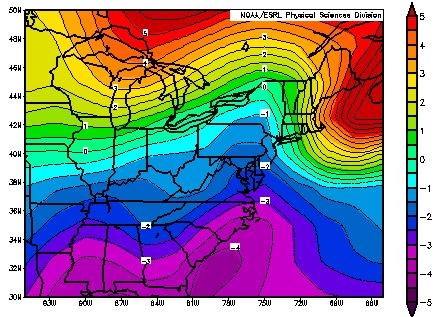
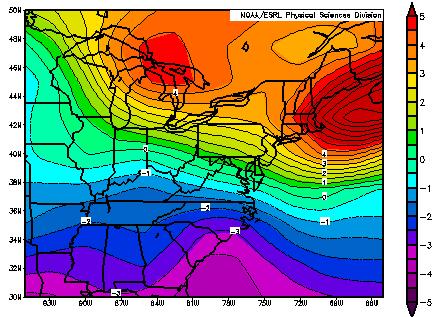
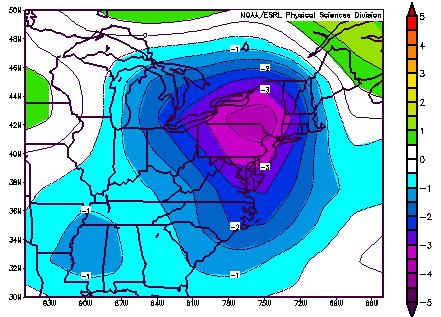
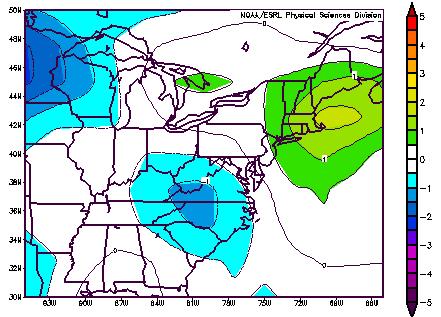
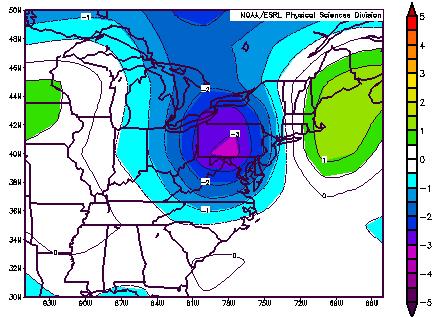
4 The negative height anomalies persist upward through mid and high levels, but tend to shift west or northwest and away from the sub-region. The exception is the Ohio Valley sub-region, where the anomaly switches completely from negative to positive between 850 and 700 mb. Figures 3a and 3b show daily composite means and anomalies of 500mb height. Again, mean troughs and anomaly minimums are found west of each sub-region, except the Ohio Valley, which is under a positive height anomaly, with the maximum over the East Coast. 925mb temperature, daily composite means and anomalies, are shown in figs 4a and 4b. In general, the mean charts show a thermal ridge axis south or west of each sub-region, but the Ohio ridge has a more west-east orientation. The anomaly charts show positive (warm) anomalies over New England and the Ohio Valley, but negative (cool) anomalies over the South- Atlantic and near neutral anomalies over the Mid-Atlantic sub-region. Temperature composite charts for other levels (not shown) indicate similar patterns through the lower half of the troposphere. Figures 5a shows daily composite means of specific humidity at 925 mb. The means show a moist axis over or near each sub-region, similar to the low-level thermal axis pattern. Higher up, e.g., at 500 mb (Fig. 6a), the moist axes become distinct moisture maxima centered over each sub-region. The corresponding daily composite anomaly charts (Figs. 5b and 6b) indicate distinct moist anomalies over at least part of each sub-region, tending to shift slightly toward the subregion center with height. In the South-Atlantic, the low-level positive anomaly is relatively weak, but at mid levels, e.g., 700mb (not shown) and 500mb (Fig. 6b), it becomes comparable with the other sub-regions. The wind patterns associated with flash flood days in each sub-region tend to agree qualitatively with the height patterns, as might be expected. Height troughs to the west result in southwesterly mean flow over the sub-region, except more westerly to slightly north of west over the Ohio Valley sub-region. Figure 7 shows daily composite means for the 250mb total vector wind. Each subregion is in the right entrance region of an anti-cyclonically curved speed maximum, though the curvature is less pronounced for the Ohio Valley events. Composite anomalies for the total wind showed cyclonic circulations centered west of each sub-region through all levels, except becoming anti-cyclonic above 700 mb over the Ohio Valley with the circulation center to the east. Figure 8 shows daily composite anomalies for the total vector wind at 850 mb. The circulation at 850mb is weaker over the South-Atlantic and Ohio Valley, and elongated east-to-west over the Ohio Valley. The 850mb wind anomalies are broken into their zonal and meridional components in figures 9a and 9b. The zonal wind anomalies (fig 9a) show a relatively sharp gradient from positive to negative over the southern part of each sub-region (except north from the Ohio Valley), suggesting a wind shift line or possibly a low-level boundary. The meridional wind anomalies (fig 9b) are positive for each sub-region, with stronger maxima over New England and the Mid- Atlantic. This pattern is evident at all levels. In fact, the meridional wind composite means (not shown) are also positive at all levels, except slightly negative (northerly) at mid levels over the Ohio Valley sub-region. Figures 10a and 10b show 850mb moisture transport, daily composite means and anomalies. Moisture transport is defined as the product of the vector wind with specific humidity; units are (g/kg)*(m/s). Maxima in the composite means tend to lie over or along the southern or western fringes of each sub-region. The composite anomalies (fig 10b) show the same circulation patterns as the 850mb vector wind anomalies (fig 7), but with maxima somewhat better focused over New England and the Mid-Atlantic, and a weaker maximum over the South-Atlantic. The anomaly maximum for the Ohio Valley is slightly upstream, to the southwest. Finally, daily composite means and anomalies for surface-based lifted index (LI) are shown in figures 11a and 11b. Each sub-region tends to be on the more unstable (or less stable) side of the strongest stability gradient, with more unstable air (LI = 0 to -3) to the south or west. Negative
5 (more unstable) lifted index anomalies are located over or near each sub-region (fig 11b), and are roughly equal in magnitude except weaker over the South-Atlantic. It should be noted that the daily composite values shown here are likely not indicative of the most unstable conditions that typically occur with afternoon heating of low levels during the summer. 4. Discussion 4.1 Similarities among sub-regions The daily composites showed negative anomalies in geo-potential height up to the 850mb level (and MSLP) for the FF cases from all four NWS-ER sub-regions. The anomalies were located generally west of the sub-region centers. The sub-region centers tended to be located in strong height-anomaly gradients, especially at higher levels. With cyclonic winds around the negative height anomalies, a southerly wind component resulted over each sub-region at low levels. At high levels (around 250 mb) an anti-cyclonically curved jet streak of m/s was located down wind and poleward from each sub-region. Thus each sub-region was in the right entrance region relative to the jet streak, a location well known to be favorable for large-scale upward motion and de-stabilization. Positive moisture anomalies of varying strengths were noted over each sub-region, from 1000 up to 500 mb. It is not clear whether this is a cause or an effect of deep moist convection; however, the NARR daily composites are an average of conditions from 00 UTC the prior evening through 21 UTC in the afternoon, the latter time being about the beginning of the diurnal FF maximum in summertime over the eastern U.S (Giordano and Fritsch, 1991). Thus the daily means should in general represent conditions prior to occurrence of most flash flooding. Finally, the MSLP anomalies, U-wind anomalies and LI composite means all suggest the presence of a low-level boundary to serve as a focusing mechanism for convection, although the orientation of the boundary (e.g., north-to-south or east-to-west) is unclear and no doubt varies from case to case. 4.2 Differences between sub-regions In regard to height and wind fields, the Ohio Valley sub-region tends to stand apart from the others, with a weaker and more elongated pattern at low levels, and a ridge axis (anti-cyclonic flow) instead of a trough (cyclonic flow) at mid to high levels. The flow at mid levels tends to be slightly north of west rather than southwest as with the other sub-regions. This is consistent with the results of Giordano and Fritsch (1991), who found that strong convective events over the upper Ohio Valley during summer occur predominantly with northwest flow aloft, which results from long-wave ridging over the central U.S. New England FF cases tended to occur with stronger negative height anomalies upstream and stronger positive meridional wind anomalies directly over the area. Examination of time-lagged anomaly charts (not shown) for days just before and after the FF events suggest that the New England events in this study were associated with progressive weather systems that resulted mainly in single-day FF events. This seems reasonable, since New England is the northernmost of the four sub-regions and closest to the mean summer position of the westerlies across the northern U.S. and southern Canada. Low-level moisture and instability associated with flash floods in the South-Atlantic seem to be less of an anomaly than for the other sub-regions. This suggests that sufficient moisture and instability for flash floods are typically present on any given day in the South-Atlantic, and the key to flooding there may be the presence of a focusing mechanism, possibly a stationary front or surface trough to enhance low-level convergence. The temperature anomalies are actually negative for the South-Atlantic compared to positive elsewhere. This deep cool anomaly, centered west of the Appalachians, results in increasingly negative height anomalies at mid to high levels, and ultimately stronger winds near the tropopause.
6 Overall, the Mid-Atlantic sub-region seems to be a hybrid of the two sub-regions to its north and south. It shares negative height anomaly patterns (though weaker) with New England and the South-Atlantic. Temperature anomalies tend toward neutral or negative like the South-Atlantic, but low-level positive moisture anomalies are intermediate in strength between the South-Atlantic (weaker) and New England (stronger). Total wind and meridional wind component anomalies at low to mid levels for the Mid-Atlantic tend to be as strong as over New England. 4.3 Moisture Sources The two major bodies of water that supply moisture for the NWS-ER are the Gulf of Mexico and the Atlantic Ocean. From figure 10a, 850mb moisture for the Ohio Valley sub-region appears to be transported entirely from the Gulf of Mexico (but perhaps by multiple trajectories), while the moisture source for the other regions is likely a combination of the Gulf and the Atlantic. The anomalies in figure 10b indicate that the moisture contribution from the Atlantic is significantly greater than normal during FF events in the three sub-regions east of the Appalachians. 5. Conclusions The results of this study rely on a relatively small number of days (21 to 25) when FF events occurred in each of the defined NWS-ER sub-regions. Even with these small samples, it is apparent from the individual surface and upper-air charts that significant FF events affecting multiple NWS local offices can occur with a variety of synoptic-scale patterns. The results from this study should be interpreted as atmospheric tendencies rather than necessary conditions for flash flooding. This study has looked at only a limited number of basic parameters at a few selected levels. Many additional derived parameters, including hydrologic variable, are available from the GR and NARR datasets. Vertical cross-sections and additional time-lag charts could also be created. Composite mean and anomaly charts for specific times, rather than daily means, could show more detail and perhaps reveal some diurnal trends leading up to flash floods. 6. Acknowledgments Very helpful reviews of this paper were provided by Frank Alsheimer, Science and Operations Officer (SOO) at NWS Charleston, SC, and by Michael Evans, the SOO at NWS Binghamton, NY. The re-analysis images shown in this paper were and provided by the NOAA/ESRL Physical Sciences Division, Boulder Colorado, from their Web site at " The specific web sites used to create the composite charts were Composites/Day for the GR data, and for the NARR data. Surface and 500mb maps from the "Daily Weather Map" series were obtained from the web sites and 7. References Doswell, C.A.III, H. E. Brooks, and R. A. Maddox, 1996: Flash flood forecasting: An ingredientsbased methodology. Wea. Forecasting, 11,
7 Giordano, L. and J.M. Fritsch, 1991: Strong Tornadoes and Flash-Flood Producing Rainstorms During the Warm Season in the Mid-Atlantic Region. Wea. Forecasting, 6, Harnack, R.P., K. Apffel and J. Cermak III, 1999: Heavy precipitation events in New Jersey: Attendant upper-air conditions. Wea. Forecasting, 14, Kalnay, E. and Coauthors, 1996: The NCEP/NCAR 40-year Reanalysis Project. Bull. Amer. Meteor. Soc., 77, Konrad, C. E., 1997: Synoptic-scale features associated with warm season heavy rainfall over the interior southeastern United States. Wea. Forecasting, 12, Lapenta, K. and Coauthors, 1995: The Challenge of Forecasting Heavy Rain and Flooding throughout the Eastern Region of the National Weather Service. Part I: Characteristics and Events. Wea. Forecasting, 10, Mesinger, F. and Coauthors, 2006: North American Regional Re-analysis, Bull. Amer. Meteor. Soc., 87,
8 Appendix Flash flood event dates used for each sub-region (year/month/day). Ohio Valley 1990/06/ /06/ /07/ /07/ /07/ /08/ /07/ /07/ /08/ /06/ /06/ /07/ /08/ /08/ /06/ /07/ /06/ /06/ /06/ /08/ /06/ /06/ /07/ /07/ /06/15 New England 1986/07/ /08/ /06/ /08/ /06/ /07/ /07/ /07/ /06/ /06/ /07/ /08/ /07/ /08/ /08/ /06/ /06/ /07/ /07/ /08/ /06/29 Mid-Atlantic 1989/06/ /06/ /07/ /06/ /07/ /06/ /07/ /08/ /06/ /06/ /07/ /08/ /08/ /07/ /07/ /08/ /06/ /08/ /06/ /06/ /07/ /07/ /07/ /06/25 South-Atlantic 1986/08/ /07/ /08/ /06/ /07/ /08/ /08/ /07/ /07/ /08/ /06/ /06/ /07/ /08/ /06/ /06/ /07/ /07/ /07/ /06/ /07/ /07/ /08/ /06/23
9 Table 1. Summary of flash-flood (FF) days in the study. All numbers refer to FF reports within each sub-region. ==================================================================== NWS-ER Sub-Region OhVly NewEng Mid-Atl South-Atl Number of WFO CWAs Number of FF Days Avg. No. FF Reports per Day Max No. FF Reports, Any Day Min No. FF Reports, Any Day Fraction of Total NWS-ER FF Reports In sub-region (all days) ====================================================================
, upper-right is \"New England\" (), lower-left is \"South-Atlantic\" (), and lower-right is \"Mid- Atlantic\" ().")
10 Fig 1. Four sub-regions within NWS Eastern Region, as defined for this study. The upper-left panel is "Ohio Valley" (), upper-right is "New England" (), lower-left is "South-Atlantic" (), and lower-right is "Mid- Atlantic" (). The panels in all the following images correspond to this arrangement.


11 Fig 2a. Mean sea-level pressure, daily composite means, from the NCEP/NCAR global re-analysis. The four panels correspond to the four sub-regions in fig 1. Fig 2b. As in fig 2a above, except daily composite anomalies.

,")


12 Fig 3a. 500 mb height (m), daily composite means, from the NARR. Fig 3b. As is fig 3a, except composite anomalies.

,")


13 Fig 4a. 925mb temperature (deg C), daily composite means, from the NARR Fig 4b. As in fig 4a, except temperature anomalies.


14 Fig 5a. 925mb specific humidity (g/kg), daily composite means, from the NARR. Fig 5b. As in fig 5a, except specific humidity anomalies.


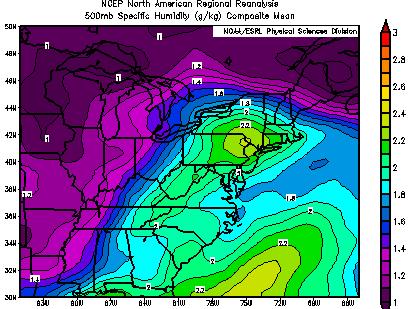
15 Fig 6a. 500 mb specific humidity (g/kg), daily composite means, from the NARR. Fig 6b. Same as fig 6a, except composite anomalies.
,")


,")

16 Fig mb total vector wind (m/s), daily composite means, from the NCEP/NCAR GR. Map area extends farther north and east than in previous figs. Fig mb total vector wind (m/s), daily composite anomalies, derived from the NCEP/NCAR global reanalysis. Color shading shows the anomaly magnitude, arrows show the direction.


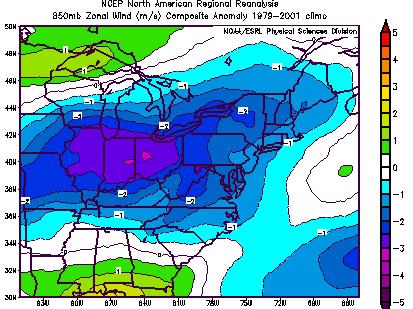
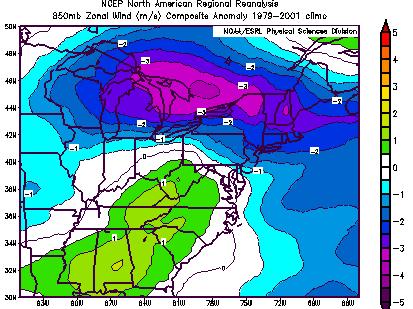
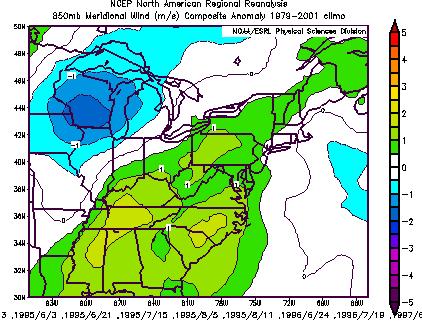
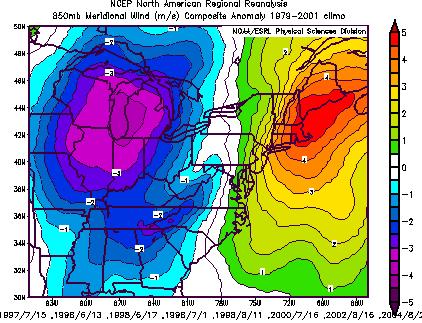
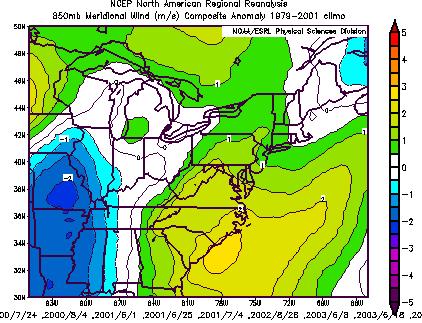
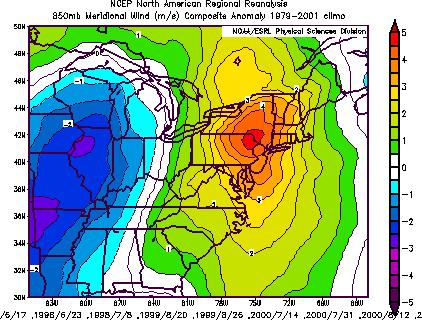
17 Fig 9a. 850mb zonal wind component, daily composite anomalies, from the NARR. Fig 9b. As in fig 9a, except meridional wind component.


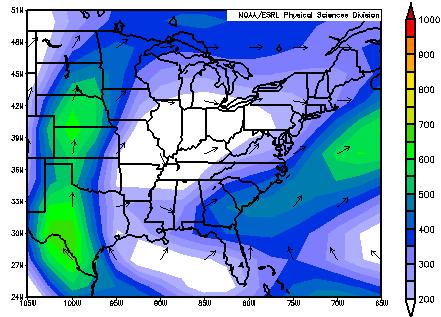
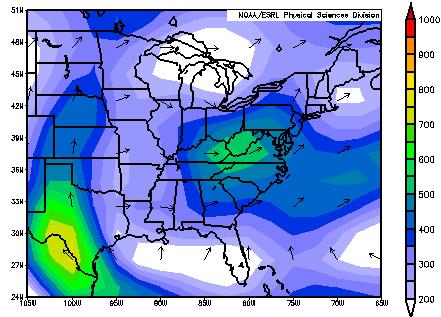
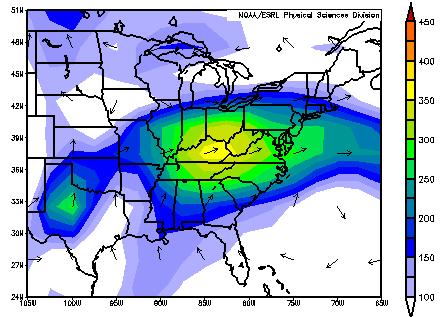
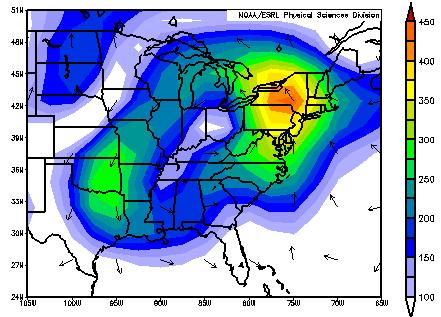
18 Fig 10a. 850mb moisture transport ((g/kg)*(m/s)), daily composite means, from the NCEP/NCAR GR. Note map area expanded south and west. Fig 10b. As in fig 10a, except composite anomalies.

19 Fig 11a. Surface-based lifted index (deg C), daily composite means, from the NCEP/NCAR global reanalysis. Fig 11b. As in fig 11a, except daily composite anomalies.
Impacts of the April 2013 Mean trough over central North America
 Impacts of the April 2013 Mean trough over central North America By Richard H. Grumm National Weather Service State College, PA Abstract: The mean 500 hpa flow over North America featured a trough over
Multi-day severe event of May 2013
 Abstract: Multi-day severe event of 18-22 May 2013 By Richard H. Grumm and Charles Ross National Weather Service State College, PA A relatively slow moving Trough over the western United States and a ridge
and 24 mm, hPa lapse rates between 3 and 4 K km 1, lifted index values
 3.2 Composite analysis 3.2.1 Pure gradient composites The composite initial NE report in the pure gradient northwest composite (N = 32) occurs where the mean sea level pressure (MSLP) gradient is strongest
5A.3 THE USE OF ENSEMBLE AND ANOMALY DATA TO ANTICIPATE EXTREME FLOOD EVENTS IN THE NORTHEASTERN U.S.
 5A.3 THE USE OF ENSEMBLE AND ANOMALY DATA TO ANTICIPATE EXTREME FLOOD EVENTS IN THE NORTHEASTERN U.S. Neil A. Stuart(1), Richard H. Grumm(2), John Cannon(3), and Walt Drag(4) (1)NOAA/National Weather Service,
Patterns of Heavy rainfall in the Mid-Atlantic Region 1. INTRODUCTION
 5A.2 Patterns of Heavy rainfall in the Mid-Atlantic Region by Richard H. Grumm * And Ron Holmes National Weather Service Office State College, PA 16802 1. INTRODUCTION The patterns associated with heavy
P1.20 AN ANALYSIS OF SYNOPTIC PATTERNS ASSOCIATED WITH STRONG NORTH TEXAS COLD FRONTS DURING THE COLD SEASON
 P1.20 AN ANALYSIS OF SYNOPTIC PATTERNS ASSOCIATED WITH STRONG NORTH TEXAS COLD FRONTS DURING THE 2005-06 COLD SEASON Stacie Hanes* and Gregory R. Patrick NOAA/NWS Weather Forecast Office Fort Worth, TX
Multiscale Analyses of Inland Tropical Cyclone Midlatitude Jet Interactions: Camille (1969) and Danny (1997)
 and Danny (1997)") Multiscale Analyses of Inland Tropical Cyclone Midlatitude Jet Interactions: Camille (1969) and Danny (1997) Matthew Potter, Lance Bosart, and Daniel Keyser Department of Atmospheric and Environmental
Multiscale Analyses of Inland Tropical Cyclone Midlatitude Jet Interactions: Camille (1969) and Danny (1997) Matthew Potter, Lance Bosart, and Daniel Keyser Department of Atmospheric and Environmental
New Zealand Heavy Rainfall and Floods
 New Zealand Heavy Rainfall and Floods 1. Introduction Three days of heavy rainfall associated with a deep upper-level low (Fig. 1) brought flooding to portions of New Zealand (Fig. 2). The flooding was
Appalachian Lee Troughs and their Association with Severe Thunderstorms
 Appalachian Lee Troughs and their Association with Severe Thunderstorms Daniel B. Thompson, Lance F. Bosart and Daniel Keyser Department of Atmospheric and Environmental Sciences University at Albany/SUNY,
daily (0000, 0600, 1200, and 1800 UTC) National Centers for Environmental
 National Centers for Environmental") 2. Data and Methodology 2.1 Data Sources A climatology of and categorization scheme for ALTs during the warm season (defined here as May September) were developed using gridded data from the four times
2. Data and Methodology 2.1 Data Sources A climatology of and categorization scheme for ALTs during the warm season (defined here as May September) were developed using gridded data from the four times
Indiana County Flash Flood of 22 June 2017
 Indiana County Flash Flood of 22 June 2017 By Richard H. Grumm National Weather Service State College, PA 1. Overview Slow moving thunderstorms brought 3 to 4 inches of rainfall to Indiana County, PA during
4/29/2011. Mid-latitude cyclones form along a
 Chapter 10: Cyclones: East of the Rocky Mountain Extratropical Cyclones Environment prior to the development of the Cyclone Initial Development of the Extratropical Cyclone Early Weather Along the Fronts
Charles A. Doswell III, Harold E. Brooks, and Robert A. Maddox
 Charles A. Doswell III, Harold E. Brooks, and Robert A. Maddox Flash floods account for the greatest number of fatalities among convective storm-related events but it still remains difficult to forecast
Pre-Christmas Warm-up December 2013-Draft
 Pre-Christmas Warm-up 21-23 December 2013-Draft By Richard H. Grumm National Weather Service State College, PA 1. Overview A large ridge over the west-central Atlantic (Fig.1) and trough moving into eastern
Investigation of the Arizona Severe Weather Event of August 8 th, 1997
 Investigation of the Arizona Severe Weather Event of August 8 th, 1997 Tim Hollfelder May 10 th, 2006 Abstract Synoptic scale forcings were very weak for these thunderstorms on August 7-8, 1997 over the
Heavy Rainfall and Flooding of 23 July 2009 By Richard H. Grumm And Ron Holmes National Weather Service Office State College, PA 16803
 Heavy Rainfall and Flooding of 23 July 2009 By Richard H. Grumm And Ron Holmes National Weather Service Office State College, PA 16803 1. INTRODUCTION Heavy rains fall over Pennsylvania and eastern New
Early May Cut-off low and Mid-Atlantic rains
 Abstract: Early May Cut-off low and Mid-Atlantic rains By Richard H. Grumm National Weather Service State College, PA A deep 500 hpa cutoff developed in the southern Plains on 3 May 2013. It produced a
MJO Influence in Continental United States Temperatures
 MJO Influence in Continental United States Temperatures An honors thesis presented to the Department of Atmospheric Science, University at Albany, State University Of New York in partial fulfillment of
Winter Storm of 15 December 2005 By Richard H. Grumm National Weather Service Office State College, PA 16803
 Winter Storm of 15 December 2005 By Richard H. Grumm National Weather Service Office State College, PA 16803 1. INTRODUCTION A complex winter storm brought snow, sleet, and freezing rain to central Pennsylvania.
Foundations of Earth Science, 6e Lutgens, Tarbuck, & Tasa
 Foundations of Earth Science, 6e Lutgens, Tarbuck, & Tasa Weather Patterns and Severe Weather Foundations, 6e - Chapter 14 Stan Hatfield Southwestern Illinois College Air masses Characteristics Large body
Chapter 24 Tropical Cyclones
 Chapter 24 Tropical Cyclones Tropical Weather Systems Tropical disturbance a cluster of thunderstorms about 250 to 600 km in diameter, originating in the tropics or sub-tropics Tropical depression a cluster
National Weather Service-Pennsylvania State University Weather Events
 National Weather Service-Pennsylvania State University Weather Events Heavy rainfall of 23 November 2011 by Richard H. Grumm National Weather Service State College PA 16803 Abstract:. A fast moving mid-tropospheric
Severe Weather Event of 13 July 2014
 Severe Weather Event of 13 July 2014 By Richard H. Grumm and Elyse M. Colbert National Weather Service State College, PA 1. Overview Severe weather affected the eastern United States (Fig. 1) from northwestern
Southern Heavy rain and floods of 8-10 March 2016 by Richard H. Grumm National Weather Service State College, PA 16803
 Southern Heavy rain and floods of 8-10 March 2016 by Richard H. Grumm National Weather Service State College, PA 16803 1. Introduction Heavy rains (Fig. 1) produced record flooding in northeastern Texas
Fronts in November 1998 Storm
 Fronts in November 1998 Storm Much of the significant weather observed in association with extratropical storms tends to be concentrated within narrow bands called frontal zones. Fronts in November 1998
Summary of High Wind Event of 7 March 2004
 Summary of High Wind Event of 7 March 2004 This event was characterized by a very strong jet streak that developed over North Carolina by 00 UTC 8 March, as seen in the Eta model analysis at 300 mb, with
Heavy rains and precipitable water anomalies August 2010 By Richard H. Grumm And Jason Krekeler National Weather Service State College, PA 16803
 Heavy rains and precipitable water anomalies 17-19 August 2010 By Richard H. Grumm And Jason Krekeler National Weather Service State College, PA 16803 1. INTRODUCTION Heavy rain fell over the Gulf States,
Satellites, Weather and Climate Module??: Polar Vortex
 Satellites, Weather and Climate Module??: Polar Vortex SWAC Jan 2014 AKA Circumpolar Vortex Science or Hype? Will there be one this year? Today s objectives Pre and Post exams What is the Polar Vortex
Synoptic Meteorology
 M.Sc. in Meteorology Synoptic Meteorology [MAPH P312] Prof Peter Lynch Second Semester, 2004 2005 Seminar Room Dept. of Maths. Physics, UCD, Belfield. Part 9 Extratropical Weather Systems These lectures
MET 3502 Synoptic Meteorology. Lecture 8: September 16, AIRMASSES, FRONTS and FRONTAL ANALYSIS (2)
") MET 3502 Synoptic Meteorology Lecture 8: September 16, 2010 AIRMASSES, FRONTS and FRONTAL ANALYSIS (2) Identifying a cold front on a surface weather map: 1. Surface front is located at the leading edge
MET 3502 Synoptic Meteorology Lecture 8: September 16, 2010 AIRMASSES, FRONTS and FRONTAL ANALYSIS (2) Identifying a cold front on a surface weather map: 1. Surface front is located at the leading edge
True or false: The atmosphere is always in hydrostatic balance. A. True B. False
 Clicker Questions and Clicker Quizzes Clicker Questions Chapter 7 Of the four forces that affect the motion of air in our atmosphere, which is to thank for opposing the vertical pressure gradient force
Southern Plains Heavy rain and Flooding
 Abstract: Southern Plains Heavy rain and Flooding By Richard H. Grumm National Weather Service State College, PA A severe weather event affected the southern Plains on 31 May 2013. The severe weather event
Mid Atlantic Severe Event of 1 May 2017 Central Pennsylvania QLCS event By Richard H. Grumm National Weather Service, State College, PA 16803
 1. Overview Mid Atlantic Severe Event of 1 May 2017 Central Pennsylvania QLCS event By Richard H. Grumm National Weather Service, State College, PA 16803 A strong upper-level wave (Fig.1) moving into a
NWS-PSU Case Study Site 2010 Severe Weather Case
 NWS-PSU Case Study Site 2010 Severe Weather Case New Years Eve Severe Weather Event of 31 December 2010 by Richard H. Grumm National Weather Service State College PA 16083 Abstract: A surge of warm humid
P0.98 Composite Analysis of Heavy-Rain-Producing Elevated Thunderstorms in the MO-KS-OK region of the United States
 P0.98 Composite Analysis of Heavy-Rain-Producing Elevated Thunderstorms in the MO-KS-OK region of the United States Laurel P. McCoy and Patrick S. Market Department of Soil, Environmental, and Atmospheric
Heat wave ending severe events of July 2010 By Richard H. Grumm National Weather Service Office State College, PA 16803
 Heat wave ending severe events of 23-25 July 2010 By Richard H. Grumm National Weather Service Office State College, PA 16803 1. INTRODUCTION A strong subtropical ridge (Fig. 1a) dominated the eastern
Tropical Storm Hermine: Heavy rainfall in western Gulf By Richard H. Grumm National Weather Service Office State College, PA 16803
 Tropical Storm Hermine: Heavy rainfall in western Gulf By Richard H. Grumm National Weather Service Office State College, PA 16803 1. INTRODUCTION Tropical storm Hermine, the eighth named tropical system
1. INTRODUCTION 3. VERIFYING ANALYSES
 1.4 VERIFICATION OF NDFD GRIDDED FORECASTS IN THE WESTERN UNITED STATES John Horel 1 *, Bradley Colman 2, Mark Jackson 3 1 NOAA Cooperative Institute for Regional Prediction 2 National Weather Service,
Deep Cyclone and rapid moving severe weather event of 5-6 June 2010 By Richard H. Grumm National Weather Service Office State College, PA 16803
 Deep Cyclone and rapid moving severe weather event of 5-6 June 2010 By Richard H. Grumm National Weather Service Office State College, PA 16803 1. INTRODUCTION A rapidly deepening surface cyclone raced
Air Masses, Fronts, Storm Systems, and the Jet Stream
 Air Masses, Fronts, Storm Systems, and the Jet Stream Air Masses When a large bubble of air remains over a specific area of Earth long enough to take on the temperature and humidity characteristics of
Global Wind Patterns
 Name: Earth Science: Date: Period: Global Wind Patterns 1. Which factor causes global wind patterns? a. changes in the distance between Earth and the Moon b. unequal heating of Earth s surface by the Sun
Where does precipitation water come from?
 Chapter II Climate and Meteorology Where does precipitation water come from? Introduction The source of water vapor existing over Mongolia has been considered to consist of evapotranspiration at several
General Circulation. Nili Harnik DEES, Lamont-Doherty Earth Observatory
 General Circulation Nili Harnik DEES, Lamont-Doherty Earth Observatory nili@ldeo.columbia.edu Latitudinal Radiation Imbalance The annual mean, averaged around latitude circles, of the balance between the
An Analysis of 500 hpa Height Fields and Zonal Wind: Examination of the Rossby Wave Theory
 An Analysis of 500 hpa Height Fields and Zonal Wind: Examination of the Rossby Wave Theory Justin Hayward, Chris MacIntosh, Katherine Meinig Department of Geologic and Atmospheric Sciences, Iowa State
Memorial Day Weekend 2013: Snow and Cold
 Abstract: Memorial Day Weekend 2013: Snow and Cold By Richard H. Grumm National Weather Service State College, PA A slow moving 500 hpa low and associated unseasonably cold air in the lower troposphere
1. Which weather map symbol is associated with extremely low air pressure? A) B) C) D) 2. The diagram below represents a weather instrument.
 B) C) D) 2. The diagram below represents a weather instrument.") 1. Which weather map symbol is associated with extremely low air pressure? 2. The diagram below represents a weather instrument. Which weather variable was this instrument designed to measure? A) air pressure
1. Which weather map symbol is associated with extremely low air pressure? 2. The diagram below represents a weather instrument. Which weather variable was this instrument designed to measure? A) air pressure
CASE STUDY OF THE NOVEMBER WINDSTORM IN SOUTH CENTRAL COLORADO
 32 CASE STUDY OF THE 12-13 NOVEMBER WINDSTORM IN SOUTH CENTRAL COLORADO Paul Wolyn * NOAA/NWS Pueblo, CO 1. INTRODUCTION During the evening and early morning of 12-13 November 2011, a damaging downslope
A COMPREHENSIVE 5-YEAR SEVERE STORM ENVIRONMENT CLIMATOLOGY FOR THE CONTINENTAL UNITED STATES 3. RESULTS
 16A.4 A COMPREHENSIVE 5-YEAR SEVERE STORM ENVIRONMENT CLIMATOLOGY FOR THE CONTINENTAL UNITED STATES Russell S. Schneider 1 and Andrew R. Dean 1,2 1 DOC/NOAA/NWS/NCEP Storm Prediction Center 2 OU-NOAA Cooperative
Convective Heavy rainfall event of 23 July 2013
 Convective Heavy rainfall event of 23 July 2013 By Richard H. Grumm and Charles Ross National Weather Service State College, PA Abstract: A record rain event affected southern Lebanon County on 23 July
JP 2.8 SPATIAL DISTRIBUTION OF TROPICAL CYCLONE INDUCED PRECIPITATION AND OPERATIONAL APPLICATIONS IN SOUTH CAROLINA
 JP 2.8 SPATIAL DISTRIBUTION OF TROPICAL CYCLONE INDUCED PRECIPITATION AND OPERATIONAL APPLICATIONS IN SOUTH CAROLINA R. Jason Caldwell *, Hope P. Mizzell, and Milt Brown South Carolina State Climatology
Hurricanes and Tropical Weather Systems:
 Hurricanes and Tropical Weather Systems: An influence on weather in parts of the USA Meteorology 411 Iowa State University Week 2 Bill Gallus Classification/Terminology Tropical Disturbance enhanced convection
A Comparison of Iowa Flash Flood Events and Eight Common Features of Excessive Rainfall for BRITTANY A. KONRADI 1
 1 A Comparison of Iowa Flash Flood Events and Eight Common Features of Excessive Rainfall for 2006-2011 BRITTANY A. KONRADI 1 Mentors: Melinda Beerends 2, Dr. Kristie Franz 1 Department of Geological and
Wind: Global Systems Chapter 10
 Wind: Global Systems Chapter 10 General Circulation of the Atmosphere General circulation of the atmosphere describes average wind patterns and is useful for understanding climate Over the earth, incoming
1. INTRODUCTION: 2. DATA AND METHODOLOGY:
 27th Conference on Hurricanes and Tropical Meteorology, 24-28 April 2006, Monterey, CA 3A.4 SUPERTYPHOON DALE (1996): A REMARKABLE STORM FROM BIRTH THROUGH EXTRATROPICAL TRANSITION TO EXPLOSIVE REINTENSIFICATION
ANSWER KEY. Part I: Synoptic Scale Composite Map. Lab 12 Answer Key. Explorations in Meteorology 54
 ANSWER KEY Part I: Synoptic Scale Composite Map 1. Using Figure 2, locate and highlight, with a black dashed line, the 500-mb trough axis. Also, locate and highlight, with a black zigzag line, the 500-mb
Paul Yura*, Frank Alsheimer, and Joseph Calderone NOAA, National Weather Service Forecast Office, Charleston South Carolina 1.
 7B.8 AN EXAMINATION OF THE SYNOPTIC AND MESOSCALE ENVIRONMENTS INVOLVED IN TORNADO OUTBREAKS FROM HURRICANES FRANCES (2004) AND JEANNE (2004) OVER NORTHEAST COASTAL GEORGIA AND SOUTHERN SOUTH CAROLINA
Mid-Atlantic Severe Weather Event of 23 June 2015
 Mid-Atlantic Severe Weather Event of 23 June 2015 By Richard H. Grumm National Weather Service State College, PA 1. Overview A widespread severe weather event occurred in the eastern United States on 23
NCEP Short-Range Ensemble forecasts of an historic rainfall event: The June 2006 East Coast Floods 1. INTRODUCTION
 NCEP Short-Range Ensemble forecasts of an historic rainfall event: The 23-27 June 2006 East Coast Floods By Richard H. Grumm National Weather Service Office, State College PA 16803 And Norman W. Junker
1 of 7 Thunderstorm Notes by Paul Sirvatka College of DuPage Meteorology. Thunderstorms
 1 of 7 Thunderstorm Notes by Paul Sirvatka College of DuPage Meteorology Thunderstorms There are three types of thunderstorms: single-cell (or air mass) multicell (cluster or squall line) supercell Although
2 July 2013 Flash Flood Event
 2 July 2013 Flash Flood Event By Richard H. Grumm and Charles Ross National Weather Service State College, PA 1. Overview A retrograding 500 hpa cyclone and anticyclone (Fig. 1) set up deep southerly flow
Convective Storm Structures and Ambient Conditions Associated with Severe Weather over the Northeast United States
 940 W E A T H E R A N D F O R E C A S T I N G VOLUME 26 Convective Storm Structures and Ambient Conditions Associated with Severe Weather over the Northeast United States KELLY A. LOMBARDO AND BRIAN A.
Flooding and Severe weather of 27 June 2013
 Flooding and Severe weather of 27 June 2013 By Richard H. Grumm National Weather Service State College, PA 1. Overview Flooding and severe weather affected Pennsylvania on 27 June 2013 (Fig 1). The severe
Lec 10: Interpreting Weather Maps
 Lec 10: Interpreting Weather Maps Case Study: October 2011 Nor easter FIU MET 3502 Synoptic Hurricane Forecasts Genesis: on large scale weather maps or satellite images, look for tropical waves (Africa
Recent Trends in Northern and Southern Hemispheric Cold and Warm Pockets
 Recent Trends in Northern and Southern Hemispheric Cold and Warm Pockets Abstract: Richard Grumm National Weather Service Office, State College, Pennsylvania and Anne Balogh The Pennsylvania State University
THE INFLUENCE OF THE GREAT LAKES ON NORTHWEST SNOWFALL IN THE SOUTHERN APPALACHIANS
 P2.18 THE INFLUENCE OF THE GREAT LAKES ON NORTHWEST SNOWFALL IN THE SOUTHERN APPALACHIANS Robbie Munroe* and Doug K. Miller University of North Carolina at Asheville, Asheville, North Carolina B. Holloway
The Long-lived eastern US tornadic supercell of 20 July 2017
 1. Overview The Long-lived eastern US tornadic supercell of 20 July 2017 By Richard H. Grumm and Elissa A Smith National Weather Service State College, PA A long lived supercell developed near the eastern
A summary of the heat episodes of June 2017
 A summary of the heat episodes of June 2017 By Richard H. Grumm and Elissa A. Smith National Weather Service State College, PA 1. Overview Over 1800 record high temperatures were set or tied during the
Cold frontal Rainband and Mid-Atlantic Severe Weather Event 28 September 2006 by Richard H. Grumm And Ron Holmes
 Cold frontal Rainband and Mid-Atlantic Severe Weather Event 28 September 2006 by Richard H. Grumm And Ron Holmes 1. INTRODUCTION A strong cold front moved across central Pennsylvania and the Mid-Atlantic
Mid Atlantic Heavy rainfall event 1. Overview 2. Methods and Data 3. Pattern
 1. Overview Mid Atlantic Heavy rainfall event With an inertial gravity wave? By Richard H. Grumm National Weather Service, State College, PA 16803 Contributions from the Albany MAP An unseasonably strong
National Weather Service-Pennsylvania State University Weather Events
 National Weather Service-Pennsylvania State University Weather Events Eastern United States Winter Storm and Severe Event of 28-29 February 2012 by Richard H. Grumm National Weather Service State College
P4.9 THE SEVERE THUNDERSTORM OUTBREAK IN FINLAND ON 5 JULY 2002
 P4.9 THE SEVERE THUNDERSTORM OUTBREAK IN FINLAND ON 5 JULY 2002 Ari-Juhani Punkka* and Jenni Teittinen Finnish Meteorological Institute, Helsinki, Finland 1. INTRODUCTION On 5 July 2002 a fast propagating
Eastern United States Wild Weather April 2014-Draft
 1. Overview Eastern United States Wild Weather 27-30 April 2014-Draft Significant quantitative precipitation bust By Richard H. Grumm National Weather Service State College, PA and Joel Maruschak Over
Name SOLUTIONS T.A./Section Atmospheric Science 101 Homework #6 Due Thursday, May 30 th (in class)
") Name SOLUTIONS T.A./Section Atmospheric Science 101 Homework #6 Due Thursday, May 30 th (in class) 1. General Circulation Briefly describe where each of the following features is found in the earth s general
Name SOLUTIONS T.A./Section Atmospheric Science 101 Homework #6 Due Thursday, May 30 th (in class) 1. General Circulation Briefly describe where each of the following features is found in the earth s general
Severe Weather with a strong cold front: 2-3 April 2006 By Richard H. Grumm National Weather Service Office State College, PA 16803
 Severe Weather with a strong cold front: 2-3 April 2006 By Richard H. Grumm National Weather Service Office State College, PA 16803 1. INTRODUCTION A strong cold front brought severe weather to much of
ESCI 344 Tropical Meteorology Lesson 8 Tropical Weather Systems
 ESCI 344 Tropical Meteorology Lesson 8 Tropical Weather Systems References: Tropical Climatology (2 nd Ed.), McGregor and Nieuwolt Climate and Weather in the Tropics, Riehl Climate Dynamics of the Tropics,
Chapter 1 Anatomy of a Cyclone
 Chapter 1 Anatomy of a Cyclone The Beast in the East 15-17 February 2003 Extra-tropical cyclone an area of low pressure outside of the tropics Other names for extra-tropical cyclones: Cyclone Mid-latitude
SUPPLEMENTARY INFORMATION
 Figure S1. Summary of the climatic responses to the Gulf Stream. On the offshore flank of the SST front (black dashed curve) of the Gulf Stream (green long arrow), surface wind convergence associated with
Air Masses of North America cp and ca air masses Air mass characterized by very cold and dry conditions
 Chapter 8: Air Masses, Fronts, and Middle-Latitude Cyclones Air masses Fronts Middle-latitude cyclones Air Masses Air mass an extremely large body of air whose properties of temperature and humidity are
The Pennsylvania Observer
 The Pennsylvania Observer October 1, 2015 September 2015 - Pennsylvania Weather Recap By: Quinn Lease The month of September will be remembered for its above normal temperatures and dry conditions that
Seasonal associations between mid-tropospheric height patterns and precipitation in the western Great Basin, USA
 Seasonal associations between mid-tropospheric height patterns and precipitation in the western Great Basin, USA By: Paul A. Knapp Knapp, P.A. (1994) Seasonal associations between mid-tropospheric pressure
Daniel J. Cecil 1 Mariana O. Felix 1 Clay B. Blankenship 2. University of Alabama - Huntsville. University Space Research Alliance
 12A.4 SEVERE STORM ENVIRONMENTS ON DIFFERENT CONTINENTS Daniel J. Cecil 1 Mariana O. Felix 1 Clay B. Blankenship 2 1 University of Alabama - Huntsville 2 University Space Research Alliance 1. INTRODUCTION
A LOOK AT TROPICAL STORM GASTON FLOODING IN VIRGINIA
 J12B.4 A LOOK AT TROPICAL STORM GASTON FLOODING IN VIRGINIA John Billet* and Keith Lynch NOAA/NWS Wakefield, VA 1. INTRODUCTION Hurricane Gaston made landfall north of Charleston, SC on Sunday morning
Climate. Annual Temperature (Last 30 Years) January Temperature. July Temperature. Average Precipitation (Last 30 Years)
 January Temperature. July Temperature. Average Precipitation (Last 30 Years)") Climate Annual Temperature (Last 30 Years) Average Annual High Temp. (F)70, (C)21 Average Annual Low Temp. (F)43, (C)6 January Temperature Average January High Temp. (F)48, (C)9 Average January Low Temp.
Climate Annual Temperature (Last 30 Years) Average Annual High Temp. (F)70, (C)21 Average Annual Low Temp. (F)43, (C)6 January Temperature Average January High Temp. (F)48, (C)9 Average January Low Temp.
National Weather Service-Pennsylvania State University Weather Events
 National Weather Service-Pennsylvania State University Weather Events Historic Ohio Valley January Severe weather and Tornado Event by Richard H. Grumm National Weather Service State College PA 16803 and
Joshua M. Boustead *1 NOAA/NWS WFO Omaha/Valley, NE. Philip N. Schumacher NOAA/NWS WFO Sioux Falls, SD
 11B.2 Influence of Diabatic Potential Vorticity Anomalies upon Warm Conveyor Belt Flow. Part II: 3-5 January 2005 Joshua M. Boustead *1 NOAA/NWS WFO Omaha/Valley, NE Philip N. Schumacher NOAA/NWS WFO Sioux
11B.1 INFLUENCE OF DIABATIC POTENTIAL VORTICITY ANOMALIES UPON WARM CONVEYOR BELT FLOW. PART I: FEBRUARY 2003
 INFLUENCE OF DIABATIC POTENTIAL VORTICITY ANOMALIES UPON WARM CONVEYOR BELT FLOW. PART I: 14-15 FEBRUARY 2003 Philip N. Schumacher, NOAA/NWS, Sioux Falls, SD Joshua M. Boustead, NOAA/NWS, Valley, NE Martin
CHAPTER 9 ATMOSPHERE S PLANETARY CIRCULATION MULTIPLE CHOICE QUESTIONS
 CHAPTER 9 ATMOSPHERE S PLANETARY CIRCULATION MULTIPLE CHOICE QUESTIONS 1. Viewed from above in the Northern Hemisphere, surface winds about a subtropical high blow a. clockwise and inward. b. counterclockwise.
Page 1. Name:
 Name: 1) As the difference between the dewpoint temperature and the air temperature decreases, the probability of precipitation increases remains the same decreases 2) Which statement best explains why
The Father s Day 2002 Severe Weather Outbreak across New York and Western New England
 P 1.5 22nd Conference on Severe Local Storms Hyannis, MA, 4-8 October 2004 The Father s Day 2002 Severe Weather Outbreak across New York and Western New England Thomas A. Wasula NOAA/National Weather Service,
1. INTRODUCTION. In addition to the severe weather, the
 Anomalous Low and its weather impacts 10-12 May 2008 By Richard Grumm National Weather Service Office State College, PA And Al Cope National Weather Service Office Mount Holly, NJ 1. INTRODUCTION An unusually
Northeastern United States Snowstorm of 9 February 2017
 Northeastern United States Snowstorm of 9 February 2017 By Richard H. Grumm and Charles Ross National Weather Service State College, PA 1. Overview A strong shortwave produced a stripe of precipitation
The Planetary Circulation System
 12 The Planetary Circulation System Learning Goals After studying this chapter, students should be able to: 1. describe and account for the global patterns of pressure, wind patterns and ocean currents
Winds and Global Circulation
 Winds and Global Circulation Atmospheric Pressure Winds Global Wind and Pressure Patterns Oceans and Ocean Currents El Nino How is Energy Transported to its escape zones? Both atmospheric and ocean transport
WEATHER FORECASTING Acquisition of Weather Information WFO Regions Weather Forecasting Tools Weather Forecasting Tools Weather Forecasting Methods
 1 2 3 4 5 6 7 8 WEATHER FORECASTING Chapter 13 Acquisition of Weather Information 10,000 land-based stations, hundreds of ships and buoys; four times a day, airports hourly Upper level: radiosonde, aircraft,
THE SUMMER STUDENT VOLUNTEER PROGRAM AT NWS WFO BALTIMORE/WASHINGTON
 THE SUMMER STUDENT VOLUNTEER PROGRAM AT NWS WFO BALTIMORE/WASHINGTON Matthew R. Kramar, Andrew B. Woodcock, Jared R. Klein and Steven M. Zubrick NOAA/National Weather Service Weather Forecast Office Baltimore/Washington
A Synoptic Climatology of Heavy Precipitation Events in California
 A Synoptic Climatology of Heavy Precipitation Events in California Alan Haynes Hydrometeorological Analysis and Support (HAS) Forecaster National Weather Service California-Nevada River Forecast Center
Anthony A. Rockwood Robert A. Maddox
 Anthony A. Rockwood Robert A. Maddox An unusually intense MCS produced large hail and wind damage in northeast Kansas and northern Missouri during the predawn hours of June 7 th, 1982. Takes a look at
(April 7, 2010, Wednesday) Tropical Storms & Hurricanes Part 2
 Tropical Storms & Hurricanes Part 2") Lecture #17 (April 7, 2010, Wednesday) Tropical Storms & Hurricanes Part 2 Hurricane Katrina August 2005 All tropical cyclone tracks (1945-2006). Hurricane Formation While moving westward, tropical disturbances
Lecture #17 (April 7, 2010, Wednesday) Tropical Storms & Hurricanes Part 2 Hurricane Katrina August 2005 All tropical cyclone tracks (1945-2006). Hurricane Formation While moving westward, tropical disturbances
A Preliminary Climatology of Extratropical Transitions in the Southwest Indian Ocean
 A Preliminary Climatology of Extratropical Transitions in the Southwest Indian Ocean Kyle S. Griffin Department of Atmospheric and Environmental Sciences, University at Albany, State University of New
Analysis of Fall Transition Season (Sept-Early Dec) Why has the weather been so violent?
 Why has the weather been so violent?") WEATHER TOPICS Analysis of Fall Transition Season (Sept-Early Dec) 2009 Why has the weather been so violent? As can be seen by the following forecast map, the Fall Transition and early Winter Season of
WEATHER TOPICS Analysis of Fall Transition Season (Sept-Early Dec) 2009 Why has the weather been so violent? As can be seen by the following forecast map, the Fall Transition and early Winter Season of