Heavy rains and precipitable water anomalies August 2010 By Richard H. Grumm And Jason Krekeler National Weather Service State College, PA 16803
|
|
|
- Lynne McDaniel
- 5 years ago
- Views:
Transcription
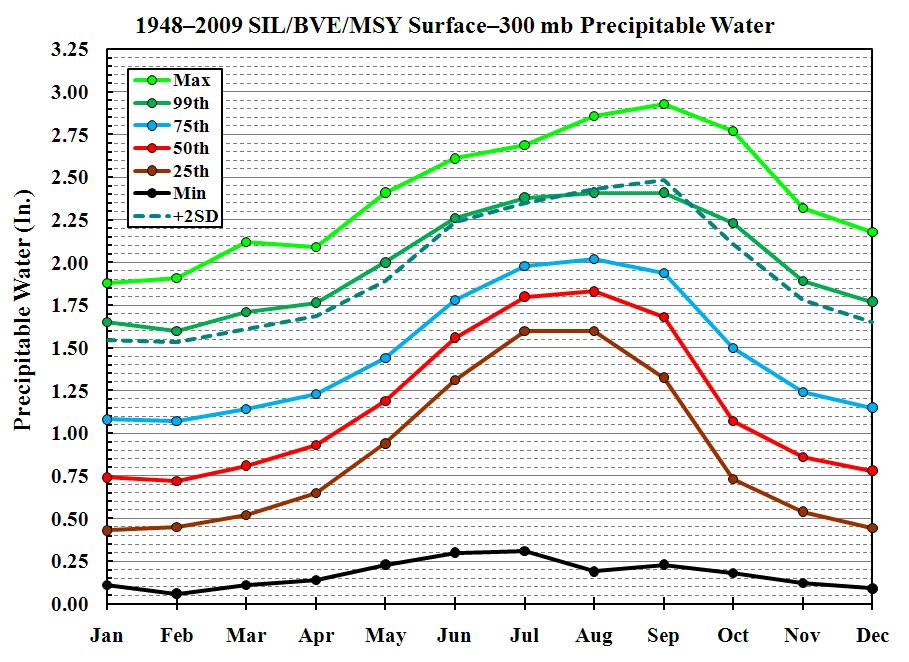
1 Heavy rains and precipitable water anomalies August 2010 By Richard H. Grumm And Jason Krekeler National Weather Service State College, PA INTRODUCTION Heavy rain fell over the Gulf States, into the Tennessee Valley and in the Mid-Atlantic region from August 2010 (Fig. 1). All three areas of heavy rainfall were associated with above normal precipitable water (PW). The rainfall over the Gulf and Ohio Valley was associated with a rejuvenated circulation of former Tropical Depression #5. The circulation was clearly evident as the system moved onshore late 16-7 August 2010 (Fig. 2). The heavy rainfall with the remnants of TD#5 fell mainly west of the track of the 850 hpa low but east of the surface cyclone over eastern Louisiana and western Mississippi (Fig. 1). Higher resolution data revealed a cyclonic pattern to the rainfall. The surge of high PW produced the second largest all-time PW (2.88 inches) value at Slidell, Louisiana on 1200 UTC 17 August 2010 and Jackson, MS set a new record high PW value (2.76 in) at 0000 UTC 18 August The old record was 2.57 inches set on 12 August Interesting all 10 of the record high PW values in Jackson were set in August (6) and July (4). The rainfall in the Tennessee Valley was also associated with the remnants of TD#5 as it interacted with a frontal system. The same general frontal system, with high PW air in it also produced the heavy rainfall in the Mid-Atlantic region. This paper will document the rainfall and the associated high PW which produced it. The goal here is to demonstrate the value of anomalies in forecasting heavy rainfall events. 2. METHOD The pattern was reconstructed used the NCEP GFS and NAM and were possible the JMA 1.25x1.25 data (Onogi et al. 2007). All data were plotted in GrADS (Doty and Kinter 1995). The severe weather data was overlaid on the JRA data. The higher resolution NCEP NAM is used to show the conditions during the event. The anomalies were computed from the NCEP/NCAR re-analysis data (Kalnay et al 1996) as describe by Hart and Grumm 2001 and Grumm and Hart Unless otherwise stated, the base data was the NAM and the means and standard deviations were computed by comparing the NAM to the NCEP/NCAR 30-year climatological values. For brevity times are referred to in the format of 18/1800 for 18 August UTC. 3. RESULTS i. Large scale pattern Figure 3 shows the 250 hpa winds (kts) and wind anomalies over the United States from 17/0000 through 19/1200 UTC. A strong jet stream was present over the Mid-West and Great Lakes early in the event with weak flow over the Gulf States. A weak trough over the United States and a strong
. ii.")
2 Figure 1. Total precipitation from Stage-IV data from 0000 UTC 17 to 1200 UTC 19 August Data begin at 8 m as indicated by the color scale on the right. subtropical ridge was present over the southeastern United States. The strong jet was in the tight gradient associated with this feature (Fig. 4). ii. Regional Patterns-South Figure 6 shows the mean-sea level pressure over the southern United States from 16/1800 through 18/1800 UTC. The circulation of TD#5 is clearly visible as is the attendant pressure anomaly as the system drifted westward across the Gulf and into eastern Texas before re-curving to the northeast. These data implied a weak surface cyclone. Despite the weak cyclone, the system was associated with PW values in the 60 to 70 mm range (Fig. 7) which produced +3 to +5SD PW anomalies over the region. PW values over 65 mm were associated with the +4 to +5SD PW anomalies. This lead to
 and total wind anomalies (standard deviations) valid at a) 1800 UTC 16 August 2010, b) 0000 UTC 17 August, c) 0600 UTC 17 August, d) 1200 UTC 17 August,")
3 Figure 2. GFS 00-hour forecasts of 850 hpa winds (kts) and total wind anomalies (standard deviations) valid at a) 1800 UTC 16 August 2010, b) 0000 UTC 17 August, c) 0600 UTC 17 August, d) 1200 UTC 17 August, e) 1800 UTC 17 August, f) 0000 UTC 18 August, g) 0600 UTC 18 August, h) 1200 UTC 18 August, i) 1800 UTC 18 August several Rawinsonde sites setting all-time or second all-time highest PW values. On a broader scale, the PW field in Figure 7 showed a sharp frontal boundary from Arkansas eastward across the Tennessee Valley which set up the second area of heavy rainfall as the high PW air eventually surged northward into the Tennessee Valley (Fig. 7f-i). Figure 2 showed the 850 hpa winds and wind anomalies. These data combined with the PW data show that the initial high PW air was associated with the cyclone. The circulation intensified and the southerly winds increased (Fig 2d-i) and surged northward. The winds peaked at +5SDs above normal with mainly southerly. This flow then interacted with the frontal boundary producing the heavy rainfall in the Tennessee Valley (Fig. 1).
4 iii. Regional Pattern-East Figure 8 shows the PW and anomalies over the eastern United States. The surge of high PW air into the Tennessee Valley is evident, peaking near 60mm and 3SDs above normal at 18/1200 UTC (Fig. 8d). At about this time the PW value over Maryland also peaked at 60 mm. The high PW air with 55 to 60 mm values remained over Tennessee from 18/1200 UTC through 19/0600 UTC. Drier air had moved over most of Kentucky after 19/0000 UTC. The 850 hpa winds and anomalies are shown in Figure 9. Clearly, the 3-4SD wind anomalies stayed just south of the heavy rainfall area in Tennessee but the PW plume did penetrate the region. With the exception of weak easterly wind anomalies, the winds were not exceptional over the Mid-Atlantic region. The 850 hpa moisture flux (MFLUX) and MFLUX anomalies (Fig. 11) showed some large anomalies over Mississippi (Fig. 11a-d) which moved over Alabama and into the Tennessee Valley. The period of high MFLUX over the Mid- Atlantic was around 18/1200 UTC. iv. Rainfall The overall rainfall pattern over the eastern United States was shown in Figure 1. These data showed 4 areas of heavy rainfall. The discussion here is limited to that rainfall associated with the remnants of TD#5 over the Gulf Coast and the Tennessee Valley and in the Mid-Atlantic region. The discussion is based on 6-hourly rainfall, the images in Figures 2-11 and radar images (not shown). The 6-hourly total rainfall at select times is shown in Figure 12 along with regional totals in Figure 13. In the Gulf States, the heavy rains began on the morning of the around 17/1200 UTC, primarily in the lower Mississippi River Valley. The remnants of TD#5 moved over the LA/MS border and moved slowly through the region (Fig. 4). This system and its attendant near record high PW values produced heavy rain over a 48 period. Between 25 to 50 mm of rain fell on the 17 th along the central LA/MS border. Overnight the intensity picked up and a large area of 25 to 50 mm fell with an area of mm just east of the LA/MS border. During the day on the 18 th the circulation remained stationary dropping heavy rains in the same areas as the previous day. A widespread area of 25 to 50 mm fell along the Mississippi river with areas of 150 mm. In total a maximum of 500 mm fell just west of the LA/MS border with widespread 50 to 100 mm totals across LA/ southwestern MS. In the Tennessee Valley, mainly over Tennessee and Kentucky, isolated heavy rains began on the morning of after 17/0000 UTC across southern TN and moved into northern TN and southern KY by the evening. Overnight a large band of 25 mm rainfall amounts fell across central TN with areas of north central TN with 75 to 150 mm. After 18/0600 UTC the heaviest rains moved into southern KY and north Central TN. Widespread 25 to 50 mm rain fell with isolated 150+ mm in north central TN. The rain began to wind down on the after 19/0600 UTC but another 25 to 50 mm fell across north central TN and southern KY. Rainfall reports suggest widespread area of 75 to 150 mm of rainfall over the region with a few isolated 250 mm amounts. The eastern edge of the stationary boundary which contributed to the heavy rainfall in the Tennessee Valley also produced heavy rainfall in the Mid-Atlantic region from the

5 Figure 3. As in Figure 2 except for 250 hpa winds and wind anomalies. 17 th to the evening on the 18 th. Heavy rains fell along this boundary along a line from south-central VA through southern MD and DE across southern NJ. On the 17 th a few isolated cells developed along the boundary and remained nearly stationary during the afternoon hours. Overnight a short wave through moved northeast along the boundary producing a steady heavy rain event. Total rainfall amounts of 25 to 75 mm fell across extreme northern NC and south central VA. The Washington, DC Metro area received 25 to 75 mm of rainfall and southern central DE received 50 to 125 mm of rainfall. v. Forecasts Three SREF QPF and probabilities are shown in Figure 14. Though not shown, the SREF and other NCEP systems predicted the surge of high PW air and the boundary shown in Figures 7 & 8. Longer ranges forecasts did not handle the boundary so well pushing it too far to the south.

6 Figure 4. As in Figure 2 except for 50 0 hpa heights and height anomalies. The QPF data suggests that the SREF did reasonably well with the QPF and high QPF threat over the Mid-Atlantic region. However, other than the pattern the SREF under predicted the rainfall and rainfall potential over the Gulf States and the Tennessee Valley. As shown in Figure 15, the GEFS faired little better. Similar to the SREF it got the pattern right after 15 August and seemed to have a signal over the Mid-Atlantic region. The higher resolution GFS forecasts from 9 forecast runs are shown in Figure 16 over the south-central United States. These data indicate that several GFS runs showed potential for heavy rainfall in the Gulf States. There was considerable run-to-run variation between models forecast cycles. Shorter range forecasts appeared to show the potential for heavy rainfall over the Tennessee Valley too.
7 Figure 17 shows the accumulated GFS rainfall over the Mid-Atlantic region. These forecasts showed that the GFS was forecasting 50 to 100 mm at times over the Mid-Atlantic region. These values, on such a scale were high though some areas did see near 100 mm of rainfall. Not forecasts of PW or winds are shown. These precipitation data suggest that the GFS had high PW values and large anomalies and thus the data outcome of the high PW air, the large QPF is a sufficient proxy. 4. Discussion/Conclusions The remnants of TD#5 drifted into Louisiana and Mississippi producing heavy rains from August As this system and it s moisture plume interacted with a mid-latitude trough, the moisture surged into the Tennessee Valley producing heavy rainfall in that region. The same general boundary between warm moist tropical air and above normal PW air produced heavy rains in the Mid-Atlantic region. It should be stated that the Mid- Atlantic region received less rainfall than the other two locations. The pattern indicated high PW air over the southern Gulf States. Models and ensembles also predicated high values of PW and thus high PW anomalies. Rawinsonde data verified that indeed there was high PW air associated with this system. Record PW values were set for the date at several locations and many locations had a top 10 all-time PW value record in rawinsonde data to included: Slidell, LA reached a PW of 2.88 on the 17/1200 UTC which is the 2 nd highest all-time value. Jackson, MS reached a PW of 2.76 on the 18/0000 UTC which set a new alltime record value. Nashville, TN reached a PW of 2.56 on the 18/0000 UTC which is 3 rd all-time. Lake Charles, LA reached a PW of 2.81 on the 18/1200 UTC which is 2 nd alltime Surge in LLJ (Fig. 2) and PW (Fig. 5) may relate to the tropical system interacting with the jet entrance to the north. Clearly, the surge of high PW air and areas of large PW anomalies aligned with the regions of heavy rainfall. Despite a relatively well predicted pattern, the QPF was not so well predicted by the EFS s. As shown in Figures 14 & 15 there was a high probability of 2 inches of rainfall in the Mid-Atlantic region. The overall QPF pattern was well predicted. However, the GEFS and SREF under predicted the heavy rainfall over the southern Gulf States and the Tennessee Valley. These poor forecasts suggest sub-grid scale processes and thus the importance of pattern recognition. The high PW air and near record PW anomalies indicated the potential for extremely heavy rainfall. The models and EFS predicted this but did not produce the requisite QPF. Higher resolution deterministic models such as the NAM and GFS (Fig ) did show areas of heavy rainfall over Louisiana and the Tennessee Valley. There was considerable run-to-run variation with the heavy rainfall over both Louisiana and Mississippi. At times as much as 256 mm of QPF was predicted. Other forecasts were less robust. This suggests that there were convective parameterization and model uncertainty issues.
8 The GFS predicted 50 to 75mm of rainfall over the Tennessee Valley (Fig. 16). This is a significant amount of QPF in the correct region. Lower than many locally observed maximum. Similar to along the Gulf Coast, the QPF was low. The GFS did better, in terms of consistency with the rainfall over the Mid-Atlantic region. However, it appeared to over predict the high end amounts and coverage. Why did the GFS perform more consistently over the Mid-Atlantic region? The high PW values and strong winds in the Gulf and Tennessee Valley were clues to heavy rainfall. In the East the high PW as a good signal for heavy rain. In each area, the models suggested rainfall. However, lacking model climatology, it is hard to know if the models were forecast record or near record rainfall, this would be an important piece of additional forecast information. Though not shown, these models also predicted much above normal PW values and the potential for near record high values. Events such as this, with high PW values and strong winds are indicators of the potential for heavy rainfall. When convective processes may play a significant role, higher resolution ensembles may under predicted the heavy rainfall potential. Higher resolution models may offer better clues as to the potential for heavy rainfall. Optimally, an ensemble of high resolution regional ensembles may be the best forecast tool in situations such as these.

9 Figure 6. As in Figure 6 except for mean sea-level pressure and anomalies valid at a) 1800 UTC 16 August-i) 1800 UTC 18 August 2010.

10 Figure 7. As in Figure 6 except for PW and PW anomalies.
 1800 UTC 17 August 2010, b) 0000 UTC 18 August, c) 0600 UTC 18 August, d)")
11 Figure 8. GFS PW and PW anomalies over the eastern United States valid at a) 1800 UTC 17 August 2010, b) 0000 UTC 18 August, c) 0600 UTC 18 August, d) 1200 UTC 18 August, e) 1800 UTC 18 August, f) 0000 UTC 19 August, g) 0600 UTC 19 August, h) 1200 UTC 19 August, i) 1800 UTC 19 August 2010.

12 Figure 10. As in Figure 9 except 850 hpa winds and wind anomalies.
13 Figure 11. As in Figure 9 except 850 hpa moisture flux and anomalies.
 for the 6 hour periods ending at a) 1800 UTC 17 August, b)")
14 Figure 12. Stage-IV QPE (mm) for the 6 hour periods ending at a) 1800 UTC 17 August, b) August, d) 0600 UTC 18 August and d) 1200 UTC 18 August 2010.


 as in color code.")
15 Figure 13. Total estimated rainfall from the Stage-IV data valid for the period of 0000 UTC 17 through 1200 UTC 19 August Values (mm) as in color code. Images are regionalized. Figure 13-b offers an other anlaysis.


16 Figure 13-b. National Mosaic QPE focused over the southern US and Tennessee Valleys. Experimental rainfall products.

 0900 UTC 16 August and c) 0900 17 August 2010.")

17 J Figure 14. SREF forecasts of 2.00 inches of QPF for 36 hour periods valid at the time indicated from forecasts initialized at a) 0900 UTC 15 August, b) 0900 UTC 16 August and c) August Upper panels show the probability of 2 inches in the 36 hour period and lower panels show the ensemble mean QPF and each member 2 inch contour.


 0000 UTC 15 August, b) 0000 UTC")
18 Figure 15. As in Figure 14 except for GEFS forecasts of 2 inches of QPF in 24 hours ending at 0600 UTC 19 August 2010 from forecasts initialized at a) 0000 UTC 15 August, b) 0000 UTC 16 August and c) 0000 UTC 17 August.
 0000 UTC 15 August, b) 1200 UTC 15 August, c) 0000 UTC 16 August, d)")
19 Figure 16. GFS accumulated QPF from the start of the model cycle ending at 1200 UTC 19 August 2010 from GFS forecasts initialized at a) 0000 UTC 15 August, b) 1200 UTC 15 August, c) 0000 UTC 16 August, d) 0600 UTC 16 August, e) 1200 UTC 16 August, f) 1800 UTC 16 August 2010, g) 0000 UTC 17 August, h) 0600 UTC 17 August and i) 1200 UTC 17 August Values in mm as per color bar to right.

20 Figure 17. As in Figure 16 except over the Mid-Atlantic region.
21
1. INTRODUCTION. For brevity times are referred to in the format of 20/1800 for 20 August UTC. 3. RESULTS
 Heavy rains and precipitable water anomalies 20-23 August 2010-Draft By Jason Krekeler And Richard Grumm National Weather Service State College, PA 16803 1. INTRODUCTION Heavy rain fell across the central
Heavy Rainfall Event of June 2013
 Heavy Rainfall Event of 10-11 June 2013 By Richard H. Grumm National Weather Service State College, PA 1. Overview A 500 hpa short-wave moved over the eastern United States (Fig. 1) brought a surge of
National Weather Service-Pennsylvania State University Weather Events
 National Weather Service-Pennsylvania State University Weather Events Heavy rainfall of 23 November 2011 by Richard H. Grumm National Weather Service State College PA 16803 Abstract:. A fast moving mid-tropospheric
Tropical Storm Hermine: Heavy rainfall in western Gulf By Richard H. Grumm National Weather Service Office State College, PA 16803
 Tropical Storm Hermine: Heavy rainfall in western Gulf By Richard H. Grumm National Weather Service Office State College, PA 16803 1. INTRODUCTION Tropical storm Hermine, the eighth named tropical system
New Zealand Heavy Rainfall and Floods
 New Zealand Heavy Rainfall and Floods 1. Introduction Three days of heavy rainfall associated with a deep upper-level low (Fig. 1) brought flooding to portions of New Zealand (Fig. 2). The flooding was
Mid-West Heavy rains 18 April 2013
 Abstract: Mid-West Heavy rains 18 April 2013 By Richard H. Grumm and Charles Ross National Weather Service State College, PA The relatively wet conditions during the first 16 days of April 2013 set the
Impacts of the April 2013 Mean trough over central North America
 Impacts of the April 2013 Mean trough over central North America By Richard H. Grumm National Weather Service State College, PA Abstract: The mean 500 hpa flow over North America featured a trough over
Northeastern United States Snowstorm of 9 February 2017
 Northeastern United States Snowstorm of 9 February 2017 By Richard H. Grumm and Charles Ross National Weather Service State College, PA 1. Overview A strong shortwave produced a stripe of precipitation
Winter Storm of 15 December 2005 By Richard H. Grumm National Weather Service Office State College, PA 16803
 Winter Storm of 15 December 2005 By Richard H. Grumm National Weather Service Office State College, PA 16803 1. INTRODUCTION A complex winter storm brought snow, sleet, and freezing rain to central Pennsylvania.
Winter Storm of February 2008 By Richard H. Grumm National Weather Service Office State College PA 16803
 1. INTRODUCTION Winter Storm of 11-13 February 2008 By Richard H. Grumm National Weather Service Office State College PA 16803 A potent winter storm brought snow, sleet, freezing rain, and rain to the
The southern express: Winter storm of January 2010 By Richard H. Grumm National Weather Service
 The southern express: Winter storm of 28-30 January 2010 By Richard H. Grumm National Weather Service 1. INTRODUCTION A storm system of Pacific origin tracked across the southern United States from 27-31
Pre-Christmas Warm-up December 2013-Draft
 Pre-Christmas Warm-up 21-23 December 2013-Draft By Richard H. Grumm National Weather Service State College, PA 1. Overview A large ridge over the west-central Atlantic (Fig.1) and trough moving into eastern
Southern Heavy rain and floods of 8-10 March 2016 by Richard H. Grumm National Weather Service State College, PA 16803
 Southern Heavy rain and floods of 8-10 March 2016 by Richard H. Grumm National Weather Service State College, PA 16803 1. Introduction Heavy rains (Fig. 1) produced record flooding in northeastern Texas
Heavy Rainfall and Flooding of 23 July 2009 By Richard H. Grumm And Ron Holmes National Weather Service Office State College, PA 16803
 Heavy Rainfall and Flooding of 23 July 2009 By Richard H. Grumm And Ron Holmes National Weather Service Office State College, PA 16803 1. INTRODUCTION Heavy rains fall over Pennsylvania and eastern New
2 July 2013 Flash Flood Event
 2 July 2013 Flash Flood Event By Richard H. Grumm and Charles Ross National Weather Service State College, PA 1. Overview A retrograding 500 hpa cyclone and anticyclone (Fig. 1) set up deep southerly flow
Early May Cut-off low and Mid-Atlantic rains
 Abstract: Early May Cut-off low and Mid-Atlantic rains By Richard H. Grumm National Weather Service State College, PA A deep 500 hpa cutoff developed in the southern Plains on 3 May 2013. It produced a
Minor Winter Flooding Event in northwestern Pennsylvania January 2017
 1. Overview Minor Winter Flooding Event in northwestern Pennsylvania 12-13 January 2017 By Richard H. Grumm National Weather Service State College, PA A combination of snow melt, frozen ground, and areas
Southern United States Heavy rain and flood event 6-8 April 2014
 Southern United States Heavy rain and flood event 6-8 April 2014 By Richard H. Grumm National Weather Service State College, PA 1. Overview Heavy rainfall (Fig. 1) affected the southern United States from
Eastern United States Wild Weather April 2014-Draft
 1. Overview Eastern United States Wild Weather 27-30 April 2014-Draft Significant quantitative precipitation bust By Richard H. Grumm National Weather Service State College, PA and Joel Maruschak Over
Snow, freezing rain, and shallow arctic Air 8-10 February 2015: NCEP HRRR success story
 Snow, freezing rain, and shallow arctic Air 8-10 February 2015: NCEP HRRR success story By Richard H. Grumm National Weather Service State College, PA 1. Overview A short-wave (Fig. 1) moved over the strong
Hurricane Harvey the Name says it all. by Richard H. Grumm and Charles Ross National Weather Service office State College, PA
 Hurricane Harvey the Name says it all by Richard H. Grumm and Charles Ross National Weather Service office State College, PA 16803. 1. Overview Hurricane Harvey crossed the Texas coast (Fig. 1) as a category
Heat wave ending severe events of July 2010 By Richard H. Grumm National Weather Service Office State College, PA 16803
 Heat wave ending severe events of 23-25 July 2010 By Richard H. Grumm National Weather Service Office State College, PA 16803 1. INTRODUCTION A strong subtropical ridge (Fig. 1a) dominated the eastern
This paper will document the pattern which produced the record rainfall of 30 September The goal is to show the pattern the
 The Historic Synoptic-Hybrid rainfall event 30 September 2010 By Richard Grumm And Michael Kozar National Weather Service State College, PA 16803 1. INTRODUCTION A slow moving north-south oriented frontal
1. INTRODUCTION. In addition to the severe weather, the
 Anomalous Low and its weather impacts 10-12 May 2008 By Richard Grumm National Weather Service Office State College, PA And Al Cope National Weather Service Office Mount Holly, NJ 1. INTRODUCTION An unusually
1. INTRODUCTION. The super storm of March 1993 produced severe weather and tornadoes as it s trailing cold front pushed through Florida (Kocin eta 1l
 1. INTRODUCTION Super Tuesday and awful Wednesday: the 5-6 February 2008 Severe Weather Outbreak By Richard H. Grumm National Weather Service State College, PA And Seth Binau National Weather Service,
Mid Atlantic Severe Event of 1 May 2017 Central Pennsylvania QLCS event By Richard H. Grumm National Weather Service, State College, PA 16803
 1. Overview Mid Atlantic Severe Event of 1 May 2017 Central Pennsylvania QLCS event By Richard H. Grumm National Weather Service, State College, PA 16803 A strong upper-level wave (Fig.1) moving into a
National Weather Service-Pennsylvania State University Weather Events
 National Weather Service-Pennsylvania State University Weather Events Eastern United States Winter Storm and Severe Event of 28-29 February 2012 by Richard H. Grumm National Weather Service State College
Deep Cyclone and rapid moving severe weather event of 5-6 June 2010 By Richard H. Grumm National Weather Service Office State College, PA 16803
 Deep Cyclone and rapid moving severe weather event of 5-6 June 2010 By Richard H. Grumm National Weather Service Office State College, PA 16803 1. INTRODUCTION A rapidly deepening surface cyclone raced
NCEP Short-Range Ensemble forecasts of an historic rainfall event: The June 2006 East Coast Floods 1. INTRODUCTION
 NCEP Short-Range Ensemble forecasts of an historic rainfall event: The 23-27 June 2006 East Coast Floods By Richard H. Grumm National Weather Service Office, State College PA 16803 And Norman W. Junker
Indiana County Flash Flood of 22 June 2017
 Indiana County Flash Flood of 22 June 2017 By Richard H. Grumm National Weather Service State College, PA 1. Overview Slow moving thunderstorms brought 3 to 4 inches of rainfall to Indiana County, PA during
National Weather Service-Pennsylvania State University Weather Events
 National Weather Service-Pennsylvania State University Weather Events Heavy Rain 7-8 December 2011 by Richard H. Grumm National Weather Service State College PA 16803 Abstract:. A mid-level short-wave
NWS-PSU Case Study Site 2010 Severe Weather Case
 NWS-PSU Case Study Site 2010 Severe Weather Case New Years Eve Severe Weather Event of 31 December 2010 by Richard H. Grumm National Weather Service State College PA 16083 Abstract: A surge of warm humid
Orographically enhanced heavy rainfall of 23 May 2010 By Richard H. Grumm National Weather Service Office State College, PA 16803
 Orographically enhanced heavy rainfall of 23 May 2010 By Richard H. Grumm National Weather Service Office State College, PA 16803 1. INTRODUCTION During the overnight hours and into the early morning of
Memorial Day Weekend 2013: Snow and Cold
 Abstract: Memorial Day Weekend 2013: Snow and Cold By Richard H. Grumm National Weather Service State College, PA A slow moving 500 hpa low and associated unseasonably cold air in the lower troposphere
Thanksgiving Eve snow of November 2014
 1. Overview Thanksgiving Eve snow of 26-27 November 2014 By Richard H. Grumm National Weather Service State College, PA An early season east coast winter storm (ECWS: DeGaetano et al. 2002) brought snow
National Weather Service-Pennsylvania State University Weather Events
 National Weather Service-Pennsylvania State University Weather Events The southern Express: High Impact Spring Storm of 14-17 April 2011 by Richard H. Grumm National Weather Service State College PA 16803
Hurricane Alex: Heavy rainfall and anomalous precipitable water By Richard H. Grumm National Weather Service Office State College, PA 16803
 Hurricane Alex: Heavy rainfall and anomalous precipitable water By Richard H. Grumm National Weather Service Office State College, PA 16803 1. INTRODUCTION Hurricane Alex ambled across the Gulf of Mexico
Eastern United States Winter Storm of 1-2 February 2015-DRAFT Northeast Ground Hog Storm
 Eastern United States Winter Storm of 1-2 February 2015-DRAFT Northeast Ground Hog Storm By Richard H. Grumm National Weather Service State College, PA 1. Overview A major Winter Storm brought precipitation
National Weather Service-Pennsylvania State University Weather Events
 National Weather Service-Pennsylvania State University Weather Events Abstract: West Coast Heavy Precipitation Event of January 2012 by Richard H. Grumm National Weather Service State College PA 16803
National Weather Service-Pennsylvania State University Weather Events
 National Weather Service-Pennsylvania State University Weather Events Historic Ohio Valley January Severe weather and Tornado Event by Richard H. Grumm National Weather Service State College PA 16803 and
National Weather Service-Pennsylvania State University Weather Events
 National Weather Service-Pennsylvania State University Weather Events Abstract: Tropical Storm Debbie, standardized anomalies and heavy rainfall by Richard H. Grumm National Weather Service State College
East Coast Heavy Rainfall of January 2010 By Richard H. Grumm National Weather Service
 1. INTRODUCTION A strong storm moved across the United States from 21 January through 25 January 2010 (Fig. 1). This storm produced record rainfall and snowfall in the western United States from 20-22
The Spring Storm of April 2007 By Richard H. Grumm National Weather Service Office State College PA 16803
 The Spring Storm of 13-16 April 2007 By Richard H. Grumm National Weather Service Office State College PA 16803 1. INTRODUCTION A major spring storm struck the eastern United States from 13 through 16
Eastern United States Ice Storm of December 2008 By Richard H. Grumm National Weather Service State College, PA 16803
 Eastern United States Ice Storm of 11-12 December 2008 By Richard H. Grumm National Weather Service State College, PA 16803 1. INTRODUCTION A significant ice storm affected the eastern United States on
Eastern United States Anafrontal Snow 4-5 March 2015-Draft
 Eastern United States Anafrontal Snow 4-5 March 2015-Draft By Richard H. Grumm National Weather Service State College, PA 1. Overview A 500 hpa ridge over the western Atlantic (Fig. 1) and an approaching
Multi-day severe event of May 2013
 Abstract: Multi-day severe event of 18-22 May 2013 By Richard H. Grumm and Charles Ross National Weather Service State College, PA A relatively slow moving Trough over the western United States and a ridge
The Deep South snowfall of February 2010 By Richard H. Grumm National Weather Service Office, State College, PA 16803
 The Deep South snowfall of 11-13 February 2010 By Richard H. Grumm National Weather Service Office, State College, PA 16803 1. INTRODUCTION A surface cyclone tracked across Mexico and the Gulf of Mexico
Mid Atlantic Heavy rainfall event 1. Overview 2. Methods and Data 3. Pattern
 1. Overview Mid Atlantic Heavy rainfall event With an inertial gravity wave? By Richard H. Grumm National Weather Service, State College, PA 16803 Contributions from the Albany MAP An unseasonably strong
A summary of the heat episodes of June 2017
 A summary of the heat episodes of June 2017 By Richard H. Grumm and Elissa A. Smith National Weather Service State College, PA 1. Overview Over 1800 record high temperatures were set or tied during the
Thanksgiving Snow and Arctic Front 25 November 2005 By Richard H. Grumm National Weather Service State College, PA 16801
 Thanksgiving Snow and Arctic Front 25 November 2005 By Richard H. Grumm National Weather Service State College, PA 16801 1. INTRODUCTION An approaching arctic front brought light snow to most of western
Southern United States Winter Storm of 28 January 2014-v1. High Impact Snow on Edge of Forecast Precipitation Shield
 Southern United States Winter Storm of 28 January 2014-v1 High Impact Snow on Edge of Forecast Precipitation Shield by Richard H. Grumm National Weather Service State College, PA 16803 and 1. Introduction
The enduring Louisiana rain and flooding of August 2016 by Richard H. Grumm National Weather Service State College, PA 16803
 1. Introduction The enduring Louisiana rain and flooding of August 2016 by Richard H. Grumm National Weather Service State College, PA 16803 Historic flooding impacted Louisiana on 12-15 August 2016 (TWC
1. INTRODUCTION. March. Local time used in text to define dates. 1 Due to UTC time the went passed 0000 UTC 31
 New England Record Maker Rain Event of 29-30 March 2010 By Richard H. Grumm National Weather Service Contributions by Frank Nocera National Weather Service Office Taunton, MA 1. INTRODUCTION The second
Flooding and Severe weather of 27 June 2013
 Flooding and Severe weather of 27 June 2013 By Richard H. Grumm National Weather Service State College, PA 1. Overview Flooding and severe weather affected Pennsylvania on 27 June 2013 (Fig 1). The severe
Southern Plains Heavy rain and Flooding
 Abstract: Southern Plains Heavy rain and Flooding By Richard H. Grumm National Weather Service State College, PA A severe weather event affected the southern Plains on 31 May 2013. The severe weather event
The Devastating Western European Winter Storm February 2010 By Richard H. Grumm National Weather Service
 The Devastating Western European Winter Storm 27-28 February 2010 By Richard H. Grumm National Weather Service 1. INTRODUCTION A strong late winter storm, called Xynthia 1, raced across Western Europe
Mid-Atlantic Ice Storm 4 March 2015
 1. Overview Mid-Atlantic Ice Storm 4 March 2015 By Richard H. Grumm National Weather Service State College, PA A large 500 hpa ridge over the southern United States (Fig. 1a-e)) built into the Mid-Atlantic
Warm Episode over Indian Sub-continent March 2010 By Richard Grumm National Weather Service State College Contributions by Lance Bosart SUNY Albany
 Warm Episode over Indian Sub-continent March 2010 By Richard Grumm National Weather Service State College Contributions by Lance Bosart SUNY Albany 1. INTRODUCTION A massive subtropical ridge formed over
Low-end derecho of 19 August 2017
 Low-end derecho of 19 August 2017 By Richard H. Grumm and Charles Ross National Weather Service State College, PA 1. Overview A cluster of thunderstorms developed in eastern Ohio around 1800 UTC on 19
Mid-Atlantic Severe Weather Event of 23 June 2015
 Mid-Atlantic Severe Weather Event of 23 June 2015 By Richard H. Grumm National Weather Service State College, PA 1. Overview A widespread severe weather event occurred in the eastern United States on 23
The Long-lived eastern US tornadic supercell of 20 July 2017
 1. Overview The Long-lived eastern US tornadic supercell of 20 July 2017 By Richard H. Grumm and Elissa A Smith National Weather Service State College, PA A long lived supercell developed near the eastern
Historic Eastern United States Winter Storm of January 2016: Record snow along the megalopolitan corridor 1. Introduction
 Historic Eastern United States Winter Storm of 22-24 January 2016: Record snow along the megalopolitan corridor by Richard H. Grumm National Weather Service State College, PA 16803 1. Introduction An historic
09 December 2005 snow event by Richard H. Grumm National Weather Service Office State College, PA 16803
 09 December 2005 snow event by Richard H. Grumm National Weather Service Office State College, PA 16803 1. INTRODUCTION A winter storm produced heavy snow over a large portion of Pennsylvania on 8-9 December
1. INTRODUCTION * Figure 1. National Weather Service Storm Prediction Center (SPC) storm reports for December 1, 2006.
 storm reports for December 1, 2006.") P1.14 FORECAST ISSUES RELATED TO THE UNPRECEDENTED SEVERE AND HIGH WIND EVENT OF DECEMBER 2006 by Greg A. DeVoir* and Richard H. Grumm National Weather Service Office State College, PA 16803 1. INTRODUCTION
P1.14 FORECAST ISSUES RELATED TO THE UNPRECEDENTED SEVERE AND HIGH WIND EVENT OF DECEMBER 2006 by Greg A. DeVoir* and Richard H. Grumm National Weather Service Office State College, PA 16803 1. INTRODUCTION
The Devastating Mid-Mississippi Valley Floods of 1-2 May 2010 By Richard H. Grumm National Weather Service
 The Devastating Mid-Mississippi Valley Floods of 1-2 May 2010 By Richard H. Grumm National Weather Service 1. INTRODUCTION A devastating heavy rainfall event affected the Mid-Mississippi Valley (MMV) from
5A.3 THE USE OF ENSEMBLE AND ANOMALY DATA TO ANTICIPATE EXTREME FLOOD EVENTS IN THE NORTHEASTERN U.S.
 5A.3 THE USE OF ENSEMBLE AND ANOMALY DATA TO ANTICIPATE EXTREME FLOOD EVENTS IN THE NORTHEASTERN U.S. Neil A. Stuart(1), Richard H. Grumm(2), John Cannon(3), and Walt Drag(4) (1)NOAA/National Weather Service,
2. Methods and data. 1 NWS Reno, NV report circulated in the LA Times story maximum wind was observed at 0900 AM 8 January 2017.
 The California Extreme Precipitation Event of 8-10 January 2017 By Richard H. Grumm and Charles Ross National Weather Service State College, PA 16803 1. Introduction A strong Pacific jet and a surge of
Severe Weather with a strong cold front: 2-3 April 2006 By Richard H. Grumm National Weather Service Office State College, PA 16803
 Severe Weather with a strong cold front: 2-3 April 2006 By Richard H. Grumm National Weather Service Office State College, PA 16803 1. INTRODUCTION A strong cold front brought severe weather to much of
Convective Heavy rainfall event of 23 July 2013
 Convective Heavy rainfall event of 23 July 2013 By Richard H. Grumm and Charles Ross National Weather Service State College, PA Abstract: A record rain event affected southern Lebanon County on 23 July
New England Record Maker Rain Event of March 2010
 National Weather Association, Electronic Journal of Operational Meteorology, 2011-EJ4 New England Record Maker Rain Event of 29-30 March 2010 RICHARD H. GRUMM National Weather Service, State College, PA
Arkansas Flash Floods and heavy rainfall-draft By Richard H. Grumm National Weather Service State College PA 16803
 Arkansas Flash Floods and heavy rainfall-draft By Richard H. Grumm National Weather Service State College PA 16803 1. INTRODUCTION Training convection associated with deep moisture and a strongly southerly
National Weather Service-Pennsylvania State University Weather Events
 National Weather Service-Pennsylvania State University Weather Events New Zealand heavy rain and flood event-draft by Richard H. Grumm National Weather Service State College PA 16803 Abstract:. A record
Ensemble Forecasts of the Blizzard of January 2005 By Richard H. Grumm National Weather Service State College Pennsylvania
 Ensemble Forecasts of the Blizzard of 22-23 January 2005 By Richard H. Grumm National Weather Service State College Pennsylvania 1. Introduction A fast moving upper-level disturbance produced a wide area
Patterns of Heavy rainfall in the Mid-Atlantic Region 1. INTRODUCTION
 5A.2 Patterns of Heavy rainfall in the Mid-Atlantic Region by Richard H. Grumm * And Ron Holmes National Weather Service Office State College, PA 16802 1. INTRODUCTION The patterns associated with heavy
WEATHER NOTIFICATION STATEMENT
 WEATHER NOTIFICATION STATEMENT NEW DATA SHOWS SNOWSTORM THREAT FOR JAN 13-14 LOOKS MUCH HEAVIER BIGGER COVERAGE northwest NC (ice) ALL OF VA (Except Hampton Roads) all of MD/ DEL eastern southern PA southern
Cold frontal Rainband and Mid-Atlantic Severe Weather Event 28 September 2006 by Richard H. Grumm And Ron Holmes
 Cold frontal Rainband and Mid-Atlantic Severe Weather Event 28 September 2006 by Richard H. Grumm And Ron Holmes 1. INTRODUCTION A strong cold front moved across central Pennsylvania and the Mid-Atlantic
HRRR and the Mid-Mississippi Valley Severe and Heavy rainfall event of October 2014
 HRRR and the Mid-Mississippi Valley Severe and Heavy rainfall event of 13-14 October 2014 By Richard H. Grumm National Weather Service State College, PA contributions by Charles Ross 1. Overview A deep
1995 and 1980 (exact dates would be useful). 1. INTRODUCTION
. 1. INTRODUCTION") Alaskan Autumn Storm of 22-24 November 2010 By Richard Grumm National Weather Service State College, PA 16803 and Rick Thoman and James A. Nelson National Weather Service Alaska Region 1. INTRODUCTION
Alaskan Autumn Storm of 22-24 November 2010 By Richard Grumm National Weather Service State College, PA 16803 and Rick Thoman and James A. Nelson National Weather Service Alaska Region 1. INTRODUCTION
Early Summer Heat Waves of 2013
 Early Summer Heat Waves of 2013 Abstract: By Richard H. Grumm National Weather Service State College, PA And Trevor Alcott National Weather Service, Salt Lake City Utah From late June into mid-july large
National Weather Service-Pennsylvania State University Weather Events
 National Weather Service-Pennsylvania State University Weather Events Southern Express 18-19 February 2012: Probabilities, Potentials and uncertainty by Richard H. Grumm National Weather Service State
National Weather Service-Pennsylvania State University Weather Events
 National Weather Service-Pennsylvania State University Weather Events March Madness: The 2 March 2012 super outbreak-draft by Richard H. Grumm National Weather Service State College PA 16803 and Kyle Imhoff
Severe Weather Event of 13 July 2014
 Severe Weather Event of 13 July 2014 By Richard H. Grumm and Elyse M. Colbert National Weather Service State College, PA 1. Overview Severe weather affected the eastern United States (Fig. 1) from northwestern
Anticipating record events using patterns and pattern forecast: Mid-Mississippi Valley floods of April 2011
 Anticipating record events using patterns and pattern forecast: Mid-Mississippi Valley floods of April 2011 Richard H. Grumm National Weather Service State College, PA Abstract: A persistent pattern produced
Warm Episode of December 2015:
 Warm Episode of 11-16 December 2015: Record Warmth over Mid-Atlantic Region By Richard H. Grumm National Weather Service State College, PA 1. Overview A strong 500 hpa ridge over the eastern United States
The abrupt end of the Persistent Subtropical Ridge of the autumn of 2016
 The abrupt end of the Persistent Subtropical Ridge of the autumn of 2016 1. Introduction by Richard H. Grumm National Weather Service State College, PA 16803 Contributions by Elyse Hagner National Weather
11B.1 INFLUENCE OF DIABATIC POTENTIAL VORTICITY ANOMALIES UPON WARM CONVEYOR BELT FLOW. PART I: FEBRUARY 2003
 INFLUENCE OF DIABATIC POTENTIAL VORTICITY ANOMALIES UPON WARM CONVEYOR BELT FLOW. PART I: 14-15 FEBRUARY 2003 Philip N. Schumacher, NOAA/NWS, Sioux Falls, SD Joshua M. Boustead, NOAA/NWS, Valley, NE Martin
Alaskan heat episode of June 2013-Draft
 Alaskan heat episode of 16-19 June 2013-Draft Abstract: By Trevor Alcott National Weather Service Western Region, Salt Lake City UT And Richard H. Grumm National Weather Service State College, PA A strong
National Weather Service-Pennsylvania State University Weather Events
 National Weather Service-Pennsylvania State University Weather Events The February Thaw 17-19 February 2011 by Richard H. Grumm National Weather Service State College PA 16803 Abstract: After a cold January
Historic Ellicott City Flood of 30 July Introduction
 Historic Ellicott City Flood of 30 July 2016 by Richard H. Grumm and Norman W. Junker Satellite Contributions by Sheldon Kusselson National Weather Service State College, PA 16803 1. Introduction Intense
National Weather Service-Pennsylvania State University Weather Events
 National Weather Service-Pennsylvania State University Weather Events The record eastern United States Severe Weather event of 3-4 April 2011-Draft by Richard H. Grumm National Weather Service State College
Summary of November Central U.S. Winter Storm By Christopher Hedge
 Summary of November 12-13 2010 Central U.S. Winter Storm By Christopher Hedge Event Overview The first significant snowfall of the 2010-2011 season affected portions of the plains and upper Mississippi
The Impact of the strong subtropical ridge of 2010
 The Impact of the strong subtropical ridge of 2010 by Richard H. Grumm and Jason Krekeler National Weather Service Office, State College, Pennsylvania And Kevin Lipton National Weather Service Office Albany,
The St Patrick s Snow Storm of March 2007 By Richard H. Grumm National Weather Service Office State College PA 16803
 The St Patrick s Snow Storm of 16-17 March 2007 By Richard H. Grumm National Weather Service Office State College PA 16803 1. INTRODUCTION A complex March snowstorm struck the eastern United States on
The North American Heat Wave of July 2011-Draft
 The North American Heat Wave of July 2011-Draft By Richard H. Grumm And Jason Krekeler 328 Innovation Blvd Suite 330 National Weather Service Office State College, PA 16803 The meteorological conditions
Eastern Derecho June 2013-Draft
 Abstract: Eastern Derecho 12-13 June 2013-Draft Richard H. Grumm National Weather Service Office State College, PA 16803 A strong mid-tropospheric short-wave coming over a sharp 500 hpa ridge produced
Devastating Tornadoes of 22 May 2011-Draft by Richard H. Grumm National Weather Service State College, PA
 Abstract: Devastating Tornadoes of 22 May 2011-Draft by Richard H. Grumm National Weather Service State College, PA A series of tornadoes struck the central United States on Sunday 22 May 2011. Tornadoes
A LOOK AT TROPICAL STORM GASTON FLOODING IN VIRGINIA
 J12B.4 A LOOK AT TROPICAL STORM GASTON FLOODING IN VIRGINIA John Billet* and Keith Lynch NOAA/NWS Wakefield, VA 1. INTRODUCTION Hurricane Gaston made landfall north of Charleston, SC on Sunday morning
Eastern United States Winter Storm of February Dealing with Divergent Model and Ensemble Forecast Systems
 Eastern United States Winter Storm of 12-14 February 2014 Dealing with Divergent Model and Ensemble Forecast Systems By Richard H. Grumm National Weather Service State College, PA 16803 1. Introduction
TROPICAL STORM HARVEY BRIEFING
 TROPICAL STORM HARVEY BRIEFING 10:00 AM CDT Sunday, August 27, 2017 Prepared by: NWS LIX NWSNewOrleans www.weather.gov/neworleans Situation Overview New Information Tropical Storm Winds 40mph Immediate
Eastern United States Synoptic Rain Event May 2014-Draft
 1. Overview Eastern United States Synoptic Rain Event 15-16 May 2014-Draft heavy rain and flooding event By Richard H. Grumm National Weather Service State College, PA A deep 500 hpa trough with -4σ height