Natural Event Documentation
|
|
|
- Theodore Rice
- 5 years ago
- Views:
Transcription
1 Natural Event Documentation Bakersfield and Corcoran, California May 21 and 22, 2008 San Joaquin Valley Unified Air Pollution Control District June 24, 2008 Natural Event Documentation
2 San Joaquin Valley Unified Air Pollution Control District June 24, 2008 Prepared By Shawn R. Ferreria, Senior Air Quality Specialist Jennifer Ridgway, Air Quality Specialist Jon Klassen, Air Quality Specialist Documentation Provided By The Compliance Department and Air Monitoring Section Staff Reviewed By Scott Nester, Director of Planning Stephen Shaw, Supervising Air Quality Specialist San Joaquin Valley Unified Air Pollution Control District 1990 E. Gettysburg Avenue Fresno, California (559) Natural Event Document
3 TABLE OF CONTENTS 1. Summary Framework for Exceptional event determination NEAP Criteria for High Wind Events in the San Joaquin Valley Air basin NEAP Criteria - Meteorological Data Summary of Natural Event PM10 Data Summary Analysis of PM10 NAAQS Exceedance Emissions Sources and Activity Data Historical PM10 Primary Monitor Values for the Month of May A Review of May 21 and 22, 2008 in Consideration of the Exceptional Event Criteria Exceptional Event Criteria Summary for May 21, Exceptional Event Criteria Summary for May 22, References Appendix A... 1 A.1 District Press Release on May 20, 2008 for high winds A.2 District Press Release on May 22, 2008 for high winds A.3 Air Quality Alert Message... 4 A.4 Routine Inspections from May 21 and 22, A.5 Climate Summaries... 9 A.6 Wind Profiles A.7 Weather Charts A.8 Surface Weather Observations A.9 Newspaper Articles A.10 Television News Coverage A.11 District Compliance Event Coverage A.12 Preliminary Fresno and Bakersfield Climatological Data for May A.13 May 20, 2002 High Wind Documentation List of Figures Figure 1. Central California Annual Average Precipitation in Inches Figure 2. Wind Advisory issued by the National Weather Service in Hanford, CA on May 20, Figure 3. Wind Advisory issued by the National Weather Service in Sacramento, CA on May 21, Figure 4. Wind Advisory issued by the National Weather Service in Sacramento, CA on May 22, Figure 5. Short Term Forecast issued by the National Weather Service in Hanford, CA on May 22, Figure 6. Short Term Forecast issued by the National Weather Service in Hanford, CA on May 22, i SJVUAPCD
4 Figure 7. Short Term Forecast issued by the National Weather Service in Hanford, CA on May 22, Figure 8. San Joaquin Valley PM10 monitors Figure 9. Hourly PM10 concentrations at Corcoran and hourly wind speed at Lemoore Naval Air Station on May 21, All times in PST Figure 10. Hourly PM10 concentrations at Bakersfield and hourly wind speed at Bakersfield Meadows Field Airport on May 21, All times in PST Figure 11. Hourly PM10 concentrations at Corcoran and hourly wind speed at Lemoore Naval Air Station on May 22, All times in PST Figure 12. Historical Analysis of PM10 from 1986 to LIST OF TABLES Table 1. PM10 daily averages in μg/m 3 recorded by samplers. 13 Table 2. May 21, 2008 hourly PM10, wind speed, wind direction and weather observations. 16 Table 3. May 21, 2008 hourly PM10, wind speed, wind direction and weather observations. 17 Table 4. May 22, 2008 hourly PM10, wind speed, wind direction and weather observations. 18 Table 5. Maximum Primary PM10 Values in the Month of May by year since ii SJVUAPCD
5 1. SUMMARY The PM10 exceedances recorded in the San Joaquin Valley on May 21 and 22, 2008 meet the criteria for natural events as defined by federal policies. A high wind event occurred throughout the San Joaquin Valley, entraining dust from the dessicated soil in the area for a period of four days, May 20 through 23, The valley-wide high wind event caused elevated PM10 levels everywhere in the District. This report will focus on the exceedance locations. This report demonstrates that without the high wind event, there would not have been the exceedances of the PM10 National Ambient Air Quality Standard (NAAQS) on May 21 and 22, Both Corcoran and Bakersfield had experienced a dry Spring, with seasonal precipitation totals running well below normal. A very strong, dry cold front passed over the region on May 20 through 21 that caused the high wind event. In Bakersfield the high maximum temperature on May 20 was 97 degrees Fahrenheit. The following day on May 21 the temperature dropped 20 degrees showing a significant weather pattern change. This change ushered in stronger winds which led to the May 21 and 22, 2008 exceedances. Strong northwesterly winds caused blowing dust to occur throughout the San Joaquin Valley. These strong winds were illustrated in the local observations near the exceedance locations. The Lemoore Naval Air Station reported NNW wind gusts of 31 mph or greater from 8:00 AM to 7:00 PM Pacific Standard Time (PST) on May 21, 2008, with peak winds gusting to 48 miles per hour (MPH) at 3:56 PM PST. The Bakersfield Meadows Field Airport reported NW to NNW wind gusts of 20 MPH or greater from 08:00 AM to 07:00 PM PST on May 21, 2008, with peak winds gusting to 33 MPH at 04:54 PM PST. The Lemoore Naval Air Station reported NW wind gusts of 29 MPH or greater from 12:00 AM to 07:00 PM PST on May 22, 2008, with peak winds gusting to 48 MPH at 08:56 AM PST. District Compliance Inspectors and television news coverage from May 21 and 22, 2008 confirmed the blowing dust as an exceptional event with video footage, pictures, and eyewitness accounts. The District investigated emission-generating activities during the episode, and found PM10 emissions for BACM controlled sources were approximately constant before, during and after the event. The District concludes that the PM10 exceedance would not have occurred without the high winds and windentrained dust. Image near Fresno, CA on May 22, SJVUAPCD
6 2. FRAMEWORK FOR EXCEPTIONAL EVENT DETERMINATION The San Joaquin Valley Unified Air Pollution Control District (District) adopted its Natural Events Action Plan (NEAP) for High Wind Events in the San Joaquin Valley Air Basin in February The 1996 EPA memorandum, Areas Affected by PM10 Natural Events, describes the requirements for natural event data flagging as well as the requirements for a NEAP. The policy allows air quality data to be flagged so that it does not count toward an area s attainment status if it can be shown that there was a clear, causal relationship between the data and one of three categories of natural events: volcanic and seismic activity, unwanted wildland fires, and high wind events. EPA notes that natural events, which are one form of exceptional events according to this definition, may recur, sometimes frequently (e.g., western wildfires). For the purposes of this rule, EPA defines "natural event'' as an event in which human activity plays little or no direct causal role to the event in question. The EPA recognizes that over time, certain human activities may have had some impact on the conditions which later give rise to a "natural'' air pollution event. However, EPA does not believe that small historical human contributions should preclude an event from being deemed "natural.'' In March 22, 2007, EPA adopted a rule that superseded all previous flagging and excluding data documentation. The March 22, 2007 EPA Final Rule, Treatment of Data Influenced by Exceptional Events, finalized the rule to govern the review and handling of air quality monitoring data influenced by exceptional events. In this rule, the demonstration to exclude data included a clear casual relationship between the measurement under consideration and the event that is claimed to have affected air quality in the area and there would have been no exceedance or violation but for the event. Exceptional events are events for which the normal planning and regulatory process established by the Clean Air Act (CAA) is not appropriate. In this rulemaking action, EPA finalized the proposal to: Implement section 319(b)(3)(B) and section 107(d)(3) authority to exclude air quality monitoring data from regulatory determinations related to exceedances or violations of the NAAQS; and, Avoid designating an area as nonattainment, redesignating an area as nonattainment, or reclassifying an existing nonattainment area to a higher classification if a State adequately demonstrates that an exceptional event has caused an exceedance or violation of a NAAQS. 2 SJVUAPCD
7 The EPA requires states to take reasonable measures to mitigate the impacts of an exceptional event. In accordance with the language in section 319, EPA defines the term "exceptional event'' to mean an event that: (i) Affects air quality; (ii) Is not reasonably controllable or preventable; (iii) Is an event caused by human activity that is unlikely to recur at a particular location or a natural event; and (iv) Is determined by EPA through the process established in the regulations to be an exceptional event. This report demonstrates that there was a clear, causal relationship between the exceedances of the PM10 standard on May 21 and 22, 2008 in the San Joaquin Valley Air Basin and a high wind and blowing dust event. The evidence presented shows that there would not have been an exceedance of the PM10 NAAQS in Corcoran on May 21 and 22, 2008 and Bakersfield on May 21, 2008, but for the presence of high winds. Data flagging serves multiple purposes. The major thrust of a data flagging system is information exchange, and data flags are meant to prevent the misuse of data. Flagging the May 21 and 22, 2008 exceedances will ensure that the data is not misinterpreted as being caused by regulated activities or relevant for determining compliance with the air quality standards. 3 SJVUAPCD
8 3. NEAP CRITERIA FOR HIGH WIND EVENTS IN THE SAN JOAQUIN VALLEY AIR BASIN The NEAP requires the District to forecast a high wind episode if criteria five and most or all of criteria one through four are met: 1. There has been no recent, measurable precipitation in the potential source region for fugitive dust 2. The National Weather Service in Hanford and/or Sacramento has issued either a High Wind Warning, Wind Advisory, or Blowing Dust Advisory for certain parts of the San Joaquin Valley, and the predicted duration of high winds is sufficient to establish a NEAP episode 3. The surface weather maps show a potential for high winds to occur in the near future 4. Strong winds exist higher in the atmosphere in conjunction with other weather phenomena that can drive the higher wind speeds closer to the surface 5. The 24-hour average PM10 level is forecast to be above the National Ambient Air Quality Standard at one or more San Joaquin Valley sites On May 21, 2008 all of the NEAP criteria were met: Criteria 1. No measureable precipitation had been reported in Bakersfield and Hanford for 86 consecutive days prior to the May 21, 2008 event. Criteria 2. The National Weather Service in Hanford and Sacramento issued a Wind Advisory for the San Joaquin Valley. Criteria 3. The morning and afternoon surface weather maps showed a strong pressure gradient between Oakland and Las Vegas of millibars (mb) and +18 mb, respectively over California. This strong pressure gradient caused peak wind gusts at Lemoore of 48 MPH at 03:56 PM PST and at Bakersfield of 33 MPH at 4:54 PM PST. Criteria 4. A strong 140 MPH Jet-stream at 300 mb was positioned over California through the day transferring stronger winds toward the surface. 300 mb is located approximately 30,000 feet above ground level. Criteria 5. The PM10 NAAQS was exceeded in Bakersfield and Corcoran. The District forecast a NAAQS exceedance for Corcoran, on May 21, A press release was issued on May 20, 2008 describing the potential for high winds and blowing dust. The press release included the following, Winds in the San Joaquin Valley may produce areas of localized blowing dust throughout the 4 SJVUAPCD
9 Valley. Blowing dust can result in unhealthy concentrations of particulate matter 10 microns and smaller, or PM10. On May 22, 2008 all of the NEAP criteria were met: Criteria 1. No measureable precipitation had been reported in Hanford for 87 consecutive days prior to the May 22, 2008 event. Criteria 2. The National Weather Service in Sacramento issued a Wind Advisory for the northern San Joaquin Valley. Criteria 3. The morning and afternoon surface weather maps showed a strong pressure gradient between Oakland and Las Vegas of mb and mb, respectively over California. This moderately strong pressure gradient caused peak wind gusts at Lemoore of 48 MPH at 08:56 AM PST. Criteria 4. A strong 160 MPH Jet-stream at 300 MB was positioned over California in the morning and afternoon transferring stronger winds toward the surface. Criteria 5. The PM10 NAAQS was exceeded in Corcoran. The District forecast a NAAQS exceedance for Corcoran and Bakersfield, on May 22, A press release was issued on May 20, 2008 describing the potential for high winds and blowing dust. The press release included the following, Winds in the San Joaquin Valley may produce areas of localized blowing dust throughout the Valley. Blowing dust can result in unhealthy concentrations of particulate matter 10 microns and smaller, or PM NEAP Criteria - Meteorological Data The following meteorological information is presented to demonstrate that the NEAP meteorological flagging criteria were met. Criteria 1 - No recent, measurable precipitation in the potential source region for fugitive dust Precipitation data showed that the period preceding the blowing dust event was not wet enough in the Bakersfield and Corcoran area to limit blowing dust. Moisture content of soils is a very significant factor in a blowing dust event. Soils that have lower than normal moisture content during the driest time of the year would be more easily entrained by strong winds. Precipitation During the 86 consecutive days prior to the May 21, 2008 event, Bakersfield and Hanford (Corcoran) received no measurable precipitation. Because precipitation in the 5 SJVUAPCD


10 Central and Southern San Joaquin Valley was minimal before the dust event, soils were dry enough to become entrained into the atmosphere during the high winds. Figure 1 is a map of annual precipitation for the San Joaquin Valley Air Basin. The map demonstrates that the west side of the Central and Southern San Joaquin Valley has the lowest annual precipitation of any area west of the desert areas of Owens Valley, Mojave Desert and Antelope Valley. Since the west side of Kern County has the lowest annual precipitation in the San Joaquin Valley, the undisturbed soils, on the average, are drier than other parts of the valley. Figure 1. Central California Annual Average Precipitation in Inches. The San Joaquin Valley Air Basin is outlined in black. Criteria 2 Wind Advisory issued by the National Weather Service The National Weather Service in Hanford, CA issued a Wind Advisory at 2:44 PM PDT on May 20, 2008 to notify the public of gusty winds throughout the central and southern San Joaquin Valley and surrounding mountains and deserts (see Figure 2). The National Weather Service in Sacramento, CA issued a Wind Advisory at 4:48 AM PDT on May 21, 2008 to notify the public of gusty winds throughout the northern San Joaquin 6 SJVUAPCD
11 Valley (see Figure 3). The National Weather Service in Sacramento, CA continued the Wind Advisory at 5:35 AM PDT on May 22, 2008 (see Figure 4). The National Weather Service in Hanford, CA covered the wind event on May 22, 2008 with three short term forecasts that were issued at 06:05 AM, 08:08 AM, and 11:57 AM (see Figure 5, 6, and 7). Figure 2. Wind Advisory issued by the National Weather Service in Hanford, CA on May 20, URGENT - WEATHER MESSAGE NATIONAL WEATHER SERVICE SAN JOAQUIN VALLEY - HANFORD CA 244 PM PDT TUE MAY CAZ089> /O.EXB.KHNX.WI.Y T0100Z T2300Z/ WEST CENTRAL SAN JOAQUIN VALLEY-EAST CENTRAL SAN JOAQUIN VALLEY- SOUTHWESTERN SAN JOAQUIN VALLEY-SOUTHEASTERN SAN JOAQUIN VALLEY- 244 PM PDT TUE MAY WIND ADVISORY IN EFFECT FROM 6 PM THIS EVENING TO 4 PM PDT WEDNESDAY FOR THE CENTRAL AND SOUTHERN SAN JOAQUIN VALLEY... THE NATIONAL WEATHER SERVICE IN HANFORD HAS ISSUED A WIND ADVISORY FOR THE CENTRAL AND SOUTHERN SAN JOAQUIN VALLEY...WHICH IS IN EFFECT FROM 6 PM THIS EVENING TO 4 PM PDT WEDNESDAY. SUSTAINED NORTHWEST WINDS OF 15 TO 25 MPH WILL OCCUR TONIGHT AND WEDNESDAY. OCCASIONAL GUSTS OF 35 TO 40 MPH ARE POSSIBLE AT TIMES...ESPECIALLY ON THE WEST SIDE OF THE VALLEY. AREAS OF BLOWING DUST WILL OCCUR...AND THERE COULD BE SOME LOCAL VISIBILITIES OF 2 TO 3 MILES AT TIMES ALONG THE I-5 CORRIDOR. A WIND ADVISORY MEANS THAT SUSTAINED WIND SPEEDS OF AT LEAST 25 MPH OR GUSTS OF 35 MPH OR MORE ARE EXPECTED. WINDS THIS STRONG CAN MAKE DRIVING DIFFICULT...ESPECIALLY FOR HIGH PROFILE VEHICLES. USE EXTRA CAUTION. 7 SJVUAPCD
12 Figure 3. Wind Advisory issued by the National Weather Service in Sacramento, CA on May 21, Wind Advisory URGENT - WEATHER MESSAGE NATIONAL WEATHER SERVICE SACRAMENTO CA 448 AM PDT WED MAY GUSTY NORTH WINDS THROUGH THE CENTRAL VALLEY AND DELTA TODAY...A WEATHER SYSTEM MOVED THROUGH NORTHERN CALIFORNIA ON TUESDAY AND TUESDAY NIGHT BRINGING SHOWERS TO THE NORTHERN CALIFORNIA MOUNTAINS WITH CLOUDS AND MUCH COOLER TEMPERATURES ELSEWHERE.PRESSURE PATTERNS DEVELOPING BEHIND THIS WEATHER SYSTEM WILL BRING ANOTHER PERIOD OF GUSTY NORTH WINDS TO INTERIOR NORTHERN CALIFORNIA. THE WINDS ARE EXPECTED TO INCREASE THROUGH THE MORNING HOURS WITH STRONG WINDS DOWN THE CENTRAL VALLEY AND THROUGH THE DELTA THIS AFTERNOON AND EVENING. THE WINDS ARE EXPECTED TO DECREASE SLIGHTLY TONIGHT BEFORE PICKING BACK UP AGAIN POSSIBLY EVEN STRONGER ON THURSDAY. IT IS THEREFORE LIKELY THAT ANOTHER WIND ADVISORY WILL BE ISSUED FOR THURSDAY IF PRESSURE PATTERNS CONTINUE TO DEVELOP AS FORECAST. Figure 4. Wind Advisory issued by the National Weather Service in Sacramento, CA on May 22, URGENT - WEATHER MESSAGE NATIONAL WEATHER SERVICE SACRAMENTO CA 535 AM PDT THU MAY Wind Advisory...STRONG WIND TO CONTINUE OVER INTERIOR NORTHERN CALIFORNIA TODAY....FLOW BETWEEN HIGH PRESSURE OVER THE EASTERN PACIFIC AND LOW PRESSURE OVER THE GREAT BASIN IS BRINGING STRONG NORTHERLY WINDS TO MUCH OF INTERIOR NORTHERN CALIFORNIA. BREEZY NORTH WINDS EARLY THIS MORNING WILL STRENGTHEN THROUGH THE LATER MORNING HOURS AS STRONGER WINDS FROM ALOFT MIX DOWN TO THE GROUND. THE WIND WILL BE STRONGEST IN THE CENTRAL VALLEY AND SURROUNDING FOOTHILLS WHERE THE NORTHERLY WINDS ARE CHANNELED. WIND ADVISORY CRITERIA SHOULD BE MET AT MOST VALLEY AND FOOTHILL LOCATIONS MID MORNING THROUGH MUCH OF THE DAY AND INTO THE EVENING HOURS. DECREASING WINDS ARE EXPECTED LATE THIS EVENING AND OVERNIGHT. 8 SJVUAPCD
13 Figure 5. Short Term Forecast issued by the National Weather Service in Hanford, CA on May 22, CAZ089> WEST CENTRAL SAN JOAQUIN VALLEY-EAST CENTRAL SAN JOAQUIN VALLEY- SOUTHWESTERN SAN JOAQUIN VALLEY- 605 AM PDT THU MAY NOW...NORTHWEST WINDS OF 15 TO 25 MPH WITH LOCAL GUSTS TO AROUND 35 MPH WILL CONTINUE TO AFFECT PARTS OF THE CENTRAL SAN JOAQUIN VALLEY AND THE WEST SIDE OF THE SOUTH VALLEY THROUGH 800 AM PDT. THESE WINDS WILL AFFECT PORTIONS OF THE I-5 AND HIGHWAY 99 CORRIDORS WHERE AREAS OF BLOWING DUST WILL BE POSSIBLE. MOTORISTS SHOULD REMAIN ALERT FOR REDUCED VISIBILITIES IN BLOWING DUST. Figure 6. Short Term Forecast issued by the National Weather Service in Hanford, CA on May 22, NATIONAL WEATHER SERVICE SAN JOAQUIN VALLEY - HANFORD CA 808 AM PDT THU MAY CAZ089> WEST CENTRAL SAN JOAQUIN VALLEY-EAST CENTRAL SAN JOAQUIN VALLEY- SOUTHWESTERN SAN JOAQUIN VALLEY- 808 AM PDT THU MAY NOW... NORTHWEST WINDS OF 15 TO 25 MPH WITH GUSTS TO AROUND 35 MPH WILL CONTINUE TO AFFECT PARTS OF THE CENTRAL SAN JOAQUIN VALLEY AND THE WEST SIDE OF THE SOUTH VALLEY THROUGH 1000 AM PDT. THESE WINDS WILL AFFECT PORTIONS OF THE I-5 AND HIGHWAY 99 CORRIDORS WHERE AREAS OF BLOWING DUST WILL BE POSSIBLE. MOTORISTS SHOULD REMAIN ALERT FOR REDUCED VISIBILITIES IN BLOWING DUST. BEAN 9 SJVUAPCD
14 Figure 7. Short Term Forecast issued by the National Weather Service in Hanford, CA on May 22, WEATHER.GOV/HANFORD SHORT TERM FORECAST NATIONAL WEATHER SERVICE SAN JOAQUIN VALLEY - HANFORD CA 1157 AM PDT THU MAY CAZ089> WEST CENTRAL SAN JOAQUIN VALLEY-EAST CENTRAL SAN JOAQUIN VALLEY- SOUTHWESTERN SAN JOAQUIN VALLEY AM PDT THU MAY NOW......GUSTY WINDS AND AREAS OF BLOWING DUST CONTINUE ACROSS PARTS OF THE SAN JOAQUIN VALLEY... NORTHWEST WINDS OF 20 TO 25 MPH WITH GUSTS UP TO 40 MPH WILL CONTINUE TO AFFECT PARTS OF THE SAN JOAQUIN VALLEY...ESPECIALLY ALONG THE WEST SIDE OF THE VALLEY...THROUGH 3 PM PDT. THESE WINDS WILL AFFECT PORTIONS OF THE I-5 AND HIGHWAY 99 CORRIDORS WHERE AREAS OF BLOWING DUST WILL CONTINUE TO OCCUR. THESE STRONG WINDS WILL DIMINISH AFTER 3 PM THIS AFTERNOON. MOTORISTS SHOULD REMAIN ALERT FOR REDUCED VISIBILITY IN BLOWING DUST...AND KEEP A FIRM GRIP ON THE STEERING WHEEL IF YOU ARE DRIVING A HIGH-PROFILE VEHICLE. JMB Criteria 3 and 4 - Strong winds As shown in Table 2, 3, and 4, strong gusty winds occurred in Bakersfield and Lemoore during the May 21 and 22, 2008 blowing dust event. Observations at Bakersfield Meadows Field Airport on May 21 indicate 9 hours of sustained winds greater than 18 mph and 10 hours with gusts greater than 23 mph. The highest recorded gust was 33 mph. Observations at Lemoore Naval Air Station on May 21 indicate 13 hours of sustained winds greater than 18 mph and 11 hours with gusts greater than 31 mph. The highest recorded gust was 46 mph. Observations at Lemoore Naval Air Station on May 22 indicate 19 hours of sustained winds greater than 18 mph and 16 hours with gusts greater than 26 mph. Some of the wind data from Lemoore is not available for May 22, The highest recorded gust was 48 mph. The high wind event resulted in entrainment of dust and reports of blowing dust throughout the San Joaquin Valley. Television news coverage and Compliance Inspector visual reports from May 21 and 22, 2008 documented the high winds with video footage, photographs, and eyewitness reports. Wind profiles documenting strong winds aloft in the San Joaquin Valley on May 21 and 22, 2008 are provided in the appendix. 10 SJVUAPCD
15 Surface weather maps for the event are provided in the Appendix. Closely packed isobars, which are indicators of strong surface winds, are evident on these maps. Criteria 5 PM10 level is forecast to be above the NAAQS The District issued a press release on May 20 and May 22 highlighting the potential for blowing dust and elevated PM10 levels due to high winds. The agricultural burn allocation was set to 0 tons of PM10 for both May 21 and May 22 in anticipation of high PM10 concentrations. 11 SJVUAPCD

16 4. SUMMARY OF NATURAL EVENT 4.1 PM10 Data Summary On May 21 and 22, Federal Equivalent Method (FEM) samplers recorded concentrations in excess of the 24-hour NAAQS for PM10 in the San Joaquin Valley. The NAAQS is 150 μg/m 3 rounded to the nearest 10 μg/m 3, which equates to 155 μg/m 3. A map of San Joaquin Valley monitoring stations is provided in Figure 8. Figure 8. San Joaquin Valley PM10 monitors. The District and ARB collect hourly PM10 concentrations recorded by PM10 Tapered Element Oscillating Microbalance (TEOM) type monitors and Beta Attenuation Mass (BAM) type monitors. PM10 concentrations recorded by these types of monitors are shown in Table 1. On May 21, 2008, the 24-hour averaged PM10 concentration reached 264 μg/m 3 at Corcoran and 174 μg/m 3 at Bakersfield Golden State Highway TEOM type monitor. On May 22, 2008, the 24-hour averaged PM10 concentration reached 196 μg/m 3 at Corcoran for a TEOM type monitor. 12 SJVUAPCD
17 The District also collects Federal Reference Method (FRM) filter based 24-hour PM10 concentrations using Grasby Andersen / GMW Model 1200 High Volume Air Sampler. PM10 concentrations recorded by filter-based samplers on May 21 are presented in Table 1. On May 21, 2008, the 24-hour averaged PM10 concentration reached 208 μg/m 3 at Corcoran FRM type monitor. This type of monitor uses one filter for each day and the sampler is operated once every three days. EPA certifies TEOM type monitors to be equivalent to Federal Reference Method (FRM) samplers making them Federal Equivalent Method (FEM) samplers (EQPM ). TEOM monitors are located at Tracy, Corcoran and Bakersfield-Golden State. A BAM monitor is operated by CARB at the Fresno-First Street monitoring station (EQPM ). Table 1 shows that PM10 was low in Bakersfield and Corcoran from May 18 to May 19 due to good dispersion conditions. A frontal passage on May 20 accompanied by high winds, created blowing dust in the San Joaquin Valley. The high wind event continued through May 23. The high wind event was widespread and caused elevated PM10 levels at other monitoring locations across the San Joaquin Valley on May 21 and 22 as is evident in Table 1. Table 1. PM10 daily averages in μg/m 3 recorded by samplers. Station Type May 18 May 19 May 20 May 23 May 24 Tracy TEOM Fresno - BAM First Street Fresno- FRM * * First Street Corcoran TEOM Corcoran FRM * * Bakersfield Golden State Bakersfield Golden State TEOM FRM * * * - Filter analysis not available at this time. 1 Filter based measurements take precedence on real-time FEM sites when both FRM and FEM data are available. 13 SJVUAPCD
18 4.2 Analysis of PM10 NAAQS Exceedance As described in the District s NEAP and in EPA Rule, the following sources of documentation, if available, may be used to establish a clear, causal relationship between an exceedance and a natural event: Meteorological data (e.g., wind speed and wind direction to support a source receptor relationship) Modeling and receptor analysis Videos and/or photographs of the event and the resulting emissions Maps of the areas showing sources of emissions and the area affected by the event News accounts of the event Filter analysis In the case of high-wind events, states must document that BACM were required for anthropogenic sources at the time of the high-wind event The District compiled documentation of the causal relationship between the PM10 NAAQS exceedance and the natural event. The District has determined that the cause of this PM10 event was wind-entrained dust from local sources. The high wind event was widespread and caused blowing dust and elevated PM10 levels throughout the entire San Joaquin Valley. PM10 activity related emissions for BACM controlled sources were approximately constant before, during and after the event, indicating the significant increase in PM10 concentrations was caused by the wind entrained dust. This report provides evidence of high winds in the San Joaquin Valley on May 21 and 22, 2008, coinciding with observations of blowing dust and an increase in PM10 at Bakersfield and Corcoran. PM10 at Corcoran rapidly increased from 45 μg/m 3 at hour 7 to 256 μg/m 3 at hour 9 on May 21, 2008, as shown in Table 2 and Figure 9. The increase in Corcoran PM10 concentrations coincided with a significant increase in wind speed at Lemoore, which reported NNW wind gusts of 31 mph or greater starting during hour 8 and continuing to hour 18. Lemoore was chosen as the meteorology site because it is approximately 25 miles upwind of Corcoran and is an official weather observation station. A peak wind gust of 44 mph was reported during hour 13. With afternoon heating, strong winds aloft mixed to the surface causing gusty winds and areas of blowing dust. The Lemoore Naval Air Station reported weather observations of blowing dust from hour 9 to hour 17. PM10 concentrations then decreased to 26 μg/m 3 by hour SJVUAPCD
19 PM10 at Bakersfield increased from 81 μg/m 3 at hour 8 to 142 μg/m 3 at hour 12 on May 21, 2008, as shown in Table 3 and Figure 10. Upwind at Lemoore (approximately 47 miles away), the winds were 23 mph and gusty. At the surface, the dust would arrive approximately two hours later in Bakersfield. In addition, gusty winds at Bakersfield caused PM10 levels to climb. At hour 11 on May 21, 2008, the PM10 concentrations climbed to 107 μg/m 3. NNW winds at Bakersfield Meadows Field Airport were gusting above 23 MPH from hour 8 and continuing to hour 18. A peak wind gust of 33 mph was reported during hour 17. The Bakersfield Meadows Field Airport observation showed reduced visibilities (haze) between hours 16 and 18. PM10 concentrations at Corcoran on May 22, 2008, lowered during the overnight hours when a weak surface temperature inversion formed. This inversion was present in the lower air profiler at Lost Hills (see Appendix). With the sunrise around 5:45 PDT, the surface inversion began to disappear. The absence of the surface inversion along with the presence of strong northwesterly winds caused the PM10 levels to climb from 53 μg/m 3 at hour 3 to 198 μg/m 3 at hour 5 on May 22, 2008, as shown in Table 4 and Figure 11. Lemoore reported NW to NNW wind gusts of 28 mph or greater starting during hour 1 and continuing to hour 18. A peak wind gust of 48 mph was reported during hour 9. The Lemoore Naval Air Station reported weather observations of blowing dust from hour 9 to hour 15. Meteorological data from Lemoore during hours 7, 8, 11, and 23 on May 22, 2008 are not available. Television and news paper coverage and District Compliance inspector reports confirmed high winds and blowing dust through pictures, video documentation and eyewitness accounts from across the San Joaquin Valley. These reports verified that high winds were widespread and causing blowing dust on May 20 through 23. The PM10 monitors measured PM10 exceedances in Corcoran on May 21 and 22 and in Bakersfield on May SJVUAPCD
20 Table 2. May 21, 2008 hourly PM10, wind speed, wind direction and weather observations. Hour (PST) Corcoran PM10 (μg/m 3 ) TEOM Monitor Wind Speed (mph) Lemoore, Naval Air Station Wind Direction Wind Gust (mph) Weather Observation Calm - Clear WNW - Clear Calm - Clear NNW - Clear NNW - Clear NW - Clear NNW - Clear NNW - Clear NNW 31 Clear NNW 35 Blowing Dust NNW 39 Blowing Dust NNW 39 Blowing Dust NNW 40 Blowing Dust NW 44 Blowing Dust NNW 41 Blowing Dust NNW 46 Blowing Dust NNW 48 Blowing Dust NNW 40 Blowing Dust NW 43 Clear NNW - Clear NW - Clear WNW - Clear WNW - Clear NNW - Clear Avg. 264 Hour 0 is Midnight to 12:59:59 AM, Pacific Standard Time. Data is preliminary. Gust is a peak 3 second average and wind speed is a 10 minute average ending on the hour. Weather data at Lemoore Naval Air Station was obtained from the Mesowest website and the National Weather Service. A dash indicates data was not available. 16 SJVUAPCD
21 Table 3. May 21, 2008 hourly PM10, wind speed, wind direction and weather observations. Hour (PST) Bakersfield Golden State PM10 (μg/m 3 ) TEOM Monitor Wind Speed (mph) Bakersfield Meadows Field Airport Wind Direction Wind Gust (mph) Weather Observation NNW - Clear NW - Clear NNW - Clear N - Clear 4-13 N - Clear N - Clear N - Clear NNW - Clear NW 28 Clear NNW 25 Clear NW 25 Clear WNW 24 Clear NW 23 Clear NNW 24 Clear NNW 23 Clear NW - Clear NNW 25 Haze NNW 33 Haze N 31 Haze NNW - Clear NNW - Clear NNW - Clear NW - Clear NW - Clear Avg. 174 Hour 0 is Midnight to 12:59:59 AM, Pacific Standard Time. Data is preliminary. Gust is a peak 3 second average and wind speed is a 10 minute average ending on the hour. Weather data at Bakersfield- Meadows was obtained from the Mesowest website and the National Weather Service. A dash indicates data was not available. 17 SJVUAPCD
22 Table 4. May 22, 2008 hourly PM10, wind speed, wind direction and weather observations. Hour (PST) Corcoran PM10 (μg/m 3 ) TEOM Monitor Wind Speed (mph) Lemoore, Naval Air Station Wind Direction Wind Gust (mph) Weather Observation NW - Clear NW 37 Clear NW 32 Clear NW 40 Clear NW 41 Clear NNW 33 Clear NNW 33 Clear NNW 48 Blowing Dust NNW 41 Blowing Dust NNW 36 Blowing Dust NNW 39 Blowing Dust NW 35 Blowing Dust NW 29 Blowing Dust NW 28 Partly Cloudy NW 32 Partly Cloudy NW 29 Partly Cloudy WNW - Partly Cloudy WNW - Partly Cloudy WNW 26 Partly Cloudy WNW - Partly Cloudy Avg. 196 Hour 0 is Midnight to 12:59:59 AM, Pacific Standard Time. Data is preliminary. Gust is a peak 3 second average and wind speed is a 10 minute average ending on the hour. Weather data at Lemoore Naval Air Station was obtained from the Mesowest website and the National Weather Service. A dash indicates data was not available. 18 SJVUAPCD
23 Corcoran PM-10 ug/m3 Lemoore NAS Wind Speed (mph) Corcoran on May 21, PM-10 Concentration (ug/m3) Wind Speed (mph) :00 3:00 5:00 7:00 9:00 11:00 13:00 15:00 17:00 19:00 21:00 23:00 Time 0 Figure 9. Hourly PM10 concentrations at Corcoran and hourly wind speed at Lemoore Naval Air Station on May 21, All times in PST Bakersfield PM-10 ug/m3 Bakersfield Meadows Airport Wind Speed (mph) Bakersfield on May 21, PM-10 Concentration (ug/m3) Wind Speed (mph) :00 3:00 5:00 7:00 9:00 11:00 13:00 15:00 17:00 19:00 21:00 23:00 Time 0 Figure 10. Hourly PM10 concentrations at Bakersfield and hourly wind speed at Bakersfield Meadows Field Airport on May 21, All times in PST. 19 SJVUAPCD
24 Corcoran PM-10 ug/m3 Lemoore NAS Wind Speed (mph) Corcoran on May 22, PM-10 Concentration (ug/m3) Wind Speed (mph) :00 3:00 5:00 7:00 9:00 11:00 13:00 15:00 17:00 19:00 21:00 23:00 Time 0 Figure 11. Hourly PM10 concentrations at Corcoran and hourly wind speed at Lemoore Naval Air Station on May 22, All times in PST. Note some wind data was missing from Lemoore on May 22, SJVUAPCD
25 5. EMISSIONS SOURCES AND ACTIVITY DATA The District has best available control measures (BACM) in place as described in the 2006 PM10 Plan, the NEAP, and previous plans. Most notable among the District s dust controls are Regulation VIII (the fugitive dust rules, which were last amended in August 2004), and Conservation Management Practices (CMPs, District Rule 4550, adopted May 2004 and re-adopted August 2004), through which the District has documented CMPs on over three million acres of agricultural land in the San Joaquin Valley Air Basin. A summary of the District-wide routine inspections reported on May 21 and 22, 2008 in the San Joaquin Valley Air Basin is shown in the Appendix. Agricultural burning was not permitted in the San Joaquin Valley on May 21 and 22, 2008 as part of the District s Smoke Management Allocation System (Rule 4103). Zero tons of PM10 emissions occurred for the entire San Joaquin Valley for those days from agricultural burning. Based on a survey of the available information, there is no evidence of unusual emissions on May 21 and 22, 2008, other than the blowing dust event. However, several fires were reported occurring in various locations of the District those days. BACM controls were in place during the event. PM10 was emitted from BACM controlled sources because BACM controls were overwhelmed by the high winds. Activities that generated anthropogenic fugitive PM10 were approximately constant before, during and after the event. The significant increase in PM10 concentrations was caused by the wind entrained dust. 21 SJVUAPCD
26 6. HISTORICAL PM10 PRIMARY MONITOR VALUES FOR THE MONTH OF MAY Historically, 24-Hour PM10 primary monitor concentrations have been relatively low in the month of May. The following table shows the maximum 24-Hour PM10 concentration during the month of May for the years 1986 through Table 5. Maximum Primary PM10 Values in the Month of May by year since 1986 Year Max PM10 Value (μg/m 3 ) Location Date May Merced, 18th 5/14/1986 May Madera-Library 5/7/1987 May Oildale 5/12/1988 May Visalia-Church 5/4/1989 May Oildale 5/23/1990 May Corcoran-Van Dorsten 5/30/1991 May Kettleman City-CalTrans 5/30/1992 May Visalia-Church 5/1/1993 May Fresno-Drummond 5/14/1994 May Oildale 5/27/1995 May Bakersfield-Gold 5/9/1996 May Bakersfield-Calif 5/19/1997 May Bakersfield-Gold 5/23/1998 May Fresno-Drummond 5/6/1999 May Visalia-Church 5/6/2000 May Hanford 5/1/2001 May * Bakersfield-Gold 5/20/2002 May Bakersfield-Gold 5/27/2003 May Bakersfield-Calif 5/3/2004 May Bakersfield-Gold 5/28/2005 May Bakersfield-Gold 5/17/2006 May Santa Rosa Rancheria 5/1/2007 May Corcoran 5/21/2008 * Documentation of the wind blown dust event causing this exceedance can be found in the appendix of this document. As the table shows, there has only been one exceedance of the Federal 24-Hour PM10 standard in the month of May over the past 22 years, from 1986 to This exceedance occurred on May 20, 2002, when a concentration of 189 μg/m 3 was recorded at the Bakersfield-Golden monitoring site. This high value was due to a wind blown dust event that occurred in the San Joaquin Valley on May 19-20, A weather discussion was written up on this event on December 31, 2002, and can be found in the appendix section of this document. The second highest 24-Hour PM10 concentration in May of 2002 was only 65 μg/m 3, which was also measured on May 20 th, Since 1986, there have only been three exceedances of the Federal 24-Hour PM10 standard during the month of May (May 20, 22 SJVUAPCD
27 2002, May 21, 2008 and May 22, 2008). Therefore, the San Joaquin Valley clearly does not have a history of high PM10 events during the month of May, and this recent exceedance on May 21-22, 2008 is certainly an uncommon incident. As represented in the previous table, the following chart shows the maximum 24-Hour PM10 concentration per year during the month of May. Figure 12. Historical Analysis of PM10 from 1986 to 2008 Max 24-Hour PM10 Concentration per May per Year 250 Maximum Federal 24-Hour PM10 Standard Concentration (ug/m3) May '86 May ' May '88 May '89 May '90 May '91 May '92 May '93 May '94 May '95 May ' Year and Month 116 May '97 May '98 May '99 May '00 May '01 May ' May '03 May '04 May '05 May '06 May '07 May ' SJVUAPCD
28 7. A REVIEW OF MAY 21 AND 22, 2008 IN CONSIDERATION OF THE EXCEPTIONAL EVENT CRITERIA The following discussion examines the circumstances of events on May 21 and 22, 2008, and why the District believes this should be classified as an exceptional event. The District must review air quality monitoring data for regulatory determinations related to exceedances or violations of the NAAQS and demonstrate that an exceptional event has caused an exceedance or violation of the NAAQS. As described in Section 2 in this document, the EPA requires states to take reasonable measures to mitigate the impacts of an exceptional event. In accordance with the language in section 319, EPA defines the term "exceptional event'' to mean an event that: (i) Affects air quality; (ii) Is not reasonably controllable or preventable; (iii) Is an event caused by human activity that is unlikely to recur at a particular location or a natural event; and (iv) Is determined by EPA through the process established in the regulations to be an exceptional event. 7.1 Exceptional Event Criteria Summary for May 21, 2008 The District demonstrated that the exceedance of the PM10 NAAQS in Bakersfield and Corcoran on May 21, 2008 satisfied the following exceptional event criteria referenced in the previous section: 1) The event affected air quality. Table 1 shows that PM10 concentrations in Bakersfield and Corcoran were low on days before and after the high wind event. Table 2 & 3 and Figure 9 & 10 show that PM10 concentrations increased with the arrival of high winds. 2) The event is not reasonably controllable or preventable. As described in Section 6 there were no unusual emission activities on May 21, 2008 that if controlled would have prevented the event. The event overcame BACM controls. 3) There is a clear causal connection between the exceedances and the claimed exceptional event. The causal connection was demonstrated by showing the dramatic increase in hourly PM10 concentrations that coincided with high winds. 4) The event is associated with measured concentration in excess of normal historical fluctuations including background. 24 SJVUAPCD
29 The 24-hour average PM10 concentration of 208 μg/m 3 at Corcoran and 174 μg/m 3 at Bakersfield on May 21, 2008 were the 1 st and 4 th highest 24-hour average PM10 concentration recorded for the month of May in the San Joaquin Valley Air Basin for the period 1986 to The 3 rd highest concentration recorded was a wind event that occurred May 20, 2002, where Bakersfield recorded a 189 μg/m 3 measurement. The District concludes that the natural event was unusual because the concentration was the 1 st and 4 th highest 24-hour average PM10 concentration recorded during the month of May in a 23-year period. There would have been no exceedance but for the event. The evidence presented in this report shows that there would not have been an exceedance of the PM10 NAAQS in Corcoran and Bakersfield on May 21, 2008, but for the presence of high winds. Data presented in this report presents the impact of high winds on air quality on May 21, PM10 concentrations in Corcoran and Bakersfield were low until winds began to increase in the area beginning on May 20 and peaking on May 21 and 22. Based on the data provided in this report, the District concludes that there would not have been an exceedance of the PM10 NAAQS in Bakersfield and Corcoran on May 21, 2008 if high winds were not present. 7.2 Exceptional Event Criteria Summary for May 22, 2008 The District demonstrated that the exceedance of the PM10 NAAQS in Corcoran on May 22, 2008 satisfied the following exceptional event criteria referenced in the previous section: 1) The event affected air quality. Table 1 shows that PM10 concentrations in Corcoran were low on days before and after the high wind event. Table 4 and Figure 11 show that PM10 concentrations increased with the continuation of the high winds. 2) The event is not reasonably controllable or preventable. As described in Section 6 there were no unusual emission activities on May 22, 2008 that if controlled would have prevented the event. The event overcame BACM controls. 3) There is a clear causal connection between the exceedances and the claimed exceptional event. 25 SJVUAPCD
30 The causal connection was demonstrated by showing the dramatic increase in hourly PM10 concentrations that coincided with high winds. 4) The event is associated with measured concentration in excess of normal historical fluctuations including background. The 24-hour average PM10 concentration of 196 μg/m 3 at Corcoran on May 22, 2008 was the 2 nd highest 24-hour average PM10 concentration recorded for the month of May in the San Joaquin Valley Air Basin for the period 1986 to The District concludes that the natural event was unusual because the concentration was the 2 nd highest 24-hour average PM10 concentration recorded during the month of May in a 23-year period. There would have been no exceedance but for the event. The evidence presented in this report shows that there would not have been an exceedance of the PM10 NAAQS in Corcoran on May 22, 2008, but for the presence of high winds. Data presented in this report presents the impact of high winds on air quality on May 22, PM10 concentrations in Corcoran were low until winds began to increase in the area beginning on May 20 and peaking on May 21 and 22. Based on the data provided in this report, the District concludes that there would not have been an exceedance of the PM10 NAAQS in Corcoran on May 22, 2008 if high winds were not present. 8. REFERENCES Desert Research Institute (DRI), Western Regional Climate Center, Western Climate Summaries Environmental Protection Agency (EPA). Guideline on the Identification and Use of Air Quality Data Affected by Exceptional Events. July Environmental Protection Agency (EPA). Memorandum: Areas Affected by PM10 Natural Events. May Environmental Protection Agency (EPA). Treatment of Data Influenced by Exceptional Events; Final Rule. March Mesowest historical meteorological data, Mesowest, National Oceanic and Atmospheric Administration (NOAA): ESRL/Physical Sciences Division, Profiler Data 26 SJVUAPCD
31 Department of Earth and Atmospheric Sciences, University at Albany, State University of New York, : Surface weather maps National Oceanic and Atmospheric Administration (NOAA): Weather data, Naval Postgraduate School, Department of Meteorology, Profiler Data, KFSN Channel 30 (ABC), Fresno: Television news coverage KGET Channel 17 (NBC), Bakersfield: Television news coverage 27 SJVUAPCD
32 APPENDIX A SUPPORTING DOCUMENTS A-1 SJVUAPCD

33 A.1 District Press Release on May 20, 2008 for high winds. A-2 SJVUAPCD
34 A.2 District Press Release on May 22, 2008 for high winds. A-3 SJVUAPCD
35 A.3 Air Quality Alert Message SAN JOAQUIN VALLEY AIR POLLUTION CONTROL DISTRICT RELAYED BY NATIONAL WEATHER SERVICE SAN JOAQUIN VALLEY CA 350 AM PDT WED MAY THE SAN JOAQUIN VALLEY AIR POLLUTION CONTROL DISTRICT HAS ISSUED AN AIR QUALITY ALERT FOR THE VALLEY PORTIONS OF FRESNO...KERN... KINGS...MADERA...MERCED...AND TULARE COUNTIES THROUGH WEDNESDAY EVENING MAY 21 DUE TO BLOWING DUST CAUSED BY WINDY CONDITIONS. EXPOSURE TO PARTICLE POLLUTION CAN CAUSE SERIOUS HEALTH PROBLEMS...AGGRAVATE LUNG DISEASE...CAUSE ASTHMA ATTACKS AND ACUTE BRONCHITIS AND INCREASE RISK OF RESPIRATORY INFECTIONS. IN PEOPLE WITH HEART DISEASE...SHORT-TERM EXPOSURE TO PARTICLE POLLUTION HAS BEEN LINKED TO HEART ATTACKS AND ARRHYTHMIAS... ACCORDING TO THE U.S. ENVIRONMENTAL PROTECTION AGENCY. CHILDREN AND ELDERLY PEOPLE ARE ALSO MORE SUSCEPTIBLE TO CONSEQUENCES OF HIGH PARTICULATE LEVELS. A.4 Routine Inspections from May 21 and 22, 2008 For May 21, 2008 there were a total of 85 inspections. Activity Project Type Region Required Compliance Inspection - Field Title V South Required Compliance Inspection - Field Title V South Required Compliance Inspection - Field Title V South Required Compliance Inspection - Field Title V South Required Compliance Inspection - Field Minor Source Central Required Compliance Inspection - Field Minor Source North Required Compliance Inspection - Field Minor Source North Required Compliance Inspection - Field Minor Source North Required Compliance Inspection - Field Minor Source North Required Compliance Inspection - Field Minor Source North Required Compliance Inspection - Field Minor Source North Required Compliance Inspection - Field Minor Source North Required Compliance Inspection - Field Minor Source North Required Compliance Inspection - Field Minor Source South Required Compliance Inspection - Field Minor Source South Required Compliance Inspection - Field Minor Source South Required Compliance Inspection - Field Minor Source South Required Compliance Inspection - Field Minor Source South A-4 SJVUAPCD
36 Required Compliance Inspection - Field Minor Source South Required Compliance Inspection - Field Minor Source Ag Central Required Compliance Inspection - Field Minor Source Ag South Required Compliance Inspection - Field Minor Source Ag South Required Compliance Inspection - Field Automotive Coating Central Required Compliance Inspection - Field State PERP South Required Compliance Inspection - Field Gasoline Vapor Recovery Central Required Compliance Inspection - Field Gasoline Vapor Recovery Central Required Compliance Inspection - Field Gasoline Vapor Recovery Central Required Compliance Inspection - Field Gasoline Vapor Recovery North Required Compliance Inspection - Field Gasoline Vapor Recovery North Required Compliance Inspection - Field CMP Ag Central Other Compliance Inspection - Field Title V South Other Compliance Inspection - Field Minor Source Central Other Compliance Inspection - Field Gasoline Vapor Recovery Central Other Compliance Inspection - Field Gasoline Vapor Recovery Central Other Compliance Inspection - Field Gasoline Vapor Recovery Central Other Compliance Inspection - Field Gasoline Vapor Recovery Central Other Compliance Inspection - Field Gasoline Vapor Recovery North Other Compliance Inspection - Field Gasoline Vapor Recovery North Other Compliance Inspection - Field Non-Permitted Sources Central Other Compliance Inspection - Field Asbestos Central Other Compliance Inspection - Field Asbestos North Follow-up/Reinspections - Field Minor Source South Follow-up/Reinspections - Field Minor Source Ag South Follow-up/Reinspections - Field Minor Source Ag South Follow-up/Reinspections - Field District Portable Equipment P Follow-up/Reinspections - Field Grant Program Inspections Ag Central Follow-up/Reinspections - Field Open Burning Central Complaint Investigation - Field Title V South Complaint Investigation - Field Minor Source North Complaint Investigation - Field Non-Permitted Sources North Complaint Investigation - Field Regulation 8 Central Complaint Investigation - Field Regulation 8 North Complaint Investigation - Field Open Burning Central Source Test/Performance Test - Field Title V Central Source Test/Performance Test - Field Title V North Source Test/Performance Test - Field Title V South Source Test/Performance Test - Field Minor Source Central Source Test/Performance Test - Field Gasoline Vapor Recovery Central Surveillance/Survey - Field Minor Source North Surveillance/Survey - Field Non-Permitted Sources North Surveillance/Survey - Field Regulation 8 North Breakdown Investigation - Field Title V North Breakdown Investigation - Field Title V South Breakdown Investigation - Field Minor Source North A-5 SJVUAPCD
37 Legal Action - Field Activity Minor Source South Service/Info - Field Minor Source Central Service/Info - Field Other South ATC/PTO Startup - Field Title V South ATC/PTO Startup - Field Minor Source South ATC/PTO Startup - Field Minor Source Ag South ATC/PTO Startup - Field Gasoline Vapor Recovery North ATC/PTO Startup - Field Gasoline Vapor Recovery North ATC/PTO Startup - Field Gasoline Vapor Recovery South Training - Field Title V South Training - Field Minor Source South Training - Field Minor Source South Training - Field Minor Source Ag South Training - Field Minor Source Ag South Training - Field Gasoline Vapor Recovery Central Training - Field Gasoline Vapor Recovery South Special Project - Field Other North Special Project - Field Other South Meeting - Field Title V South Meeting - Field Other South District Conducted Testing - Field Non-Permitted Sources South For May 22, 2008 there were a total of 90 inspections. Activity Project Type Region Required Compliance Inspection - Field Title V North Required Compliance Inspection - Field Title V South Required Compliance Inspection - Field Title V South Required Compliance Inspection - Field Title V South Required Compliance Inspection - Field Title V South Required Compliance Inspection - Field Minor Source Central Required Compliance Inspection - Field Minor Source Central Required Compliance Inspection - Field Minor Source North Required Compliance Inspection - Field Minor Source North Required Compliance Inspection - Field Minor Source North Required Compliance Inspection - Field Minor Source North Required Compliance Inspection - Field Minor Source North Required Compliance Inspection - Field Minor Source North Required Compliance Inspection - Field Minor Source South Required Compliance Inspection - Field Minor Source South Required Compliance Inspection - Field Minor Source South Required Compliance Inspection - Field Minor Source Ag Central Required Compliance Inspection - Field Minor Source Ag Central Required Compliance Inspection - Field Minor Source Ag North Required Compliance Inspection - Field Minor Source Ag South Required Compliance Inspection - Field State PERP South A-6 SJVUAPCD
38 Required Compliance Inspection - Field Gasoline Vapor Recovery Central Required Compliance Inspection - Field Gasoline Vapor Recovery Central Required Compliance Inspection - Field Gasoline Vapor Recovery Central Required Compliance Inspection - Field Gasoline Vapor Recovery North Required Compliance Inspection - Field Grant Program Inspections Ag Central Required Compliance Inspection - Field CMP Ag Central Required Compliance Inspection - Field CMP Ag South Other Compliance Inspection - Field Title V Central Other Compliance Inspection - Field Title V South Other Compliance Inspection - Field Title V South Other Compliance Inspection - Field Title V South Other Compliance Inspection - Field Minor Source North Other Compliance Inspection - Field Minor Source South Other Compliance Inspection - Field Minor Source Ag Central Other Compliance Inspection - Field State PERP North Other Compliance Inspection - Field Gasoline Vapor Recovery Central Other Compliance Inspection - Field Gasoline Vapor Recovery Central Other Compliance Inspection - Field Gasoline Vapor Recovery North Other Compliance Inspection - Field Grant Program Inspections Ag Central Other Compliance Inspection - Field Grant Program Inspections Ag Central Other Compliance Inspection - Field Grant Program Inspections Ag North Other Compliance Inspection - Field Open Burning North Other Compliance Inspection - Field Asbestos Central Other Compliance Inspection - Field Asbestos North Follow-up/Reinspections - Field Title V South Follow-up/Reinspections - Field Title V South Follow-up/Reinspections - Field Minor Source North Follow-up/Reinspections - Field Minor Source North Follow-up/Reinspections - Field Minor Source North Follow-up/Reinspections - Field Minor Source South Follow-up/Reinspections - Field Minor Source Ag South Follow-up/Reinspections - Field Gasoline Vapor Recovery Central Follow-up/Reinspections - Field Gasoline Vapor Recovery North Follow-up/Reinspections - Field Gasoline Vapor Recovery South Follow-up/Reinspections - Field Gasoline Vapor Recovery South Follow-up/Reinspections - Field Non-Permitted Sources North Follow-up/Reinspections - Field Grant Program Inspections North Follow-up/Reinspections - Field Grant Program Inspections South Follow-up/Reinspections - Field Asbestos North Complaint Investigation - Field Title V South Complaint Investigation - Field Minor Source A Complaint Investigation - Field Minor Source North Complaint Investigation - Field Minor Source South Complaint Investigation - Field Minor Source South Complaint Investigation - Field Non-Permitted Sources North Complaint Investigation - Field Non-Permitted Sources Ag North A-7 SJVUAPCD
39 Complaint Investigation - Field Regulation 8 Central Complaint Investigation - Field Regulation 8 North Complaint Investigation - Field Regulation 8 South Complaint Investigation - Field Open Burning South Complaint Investigation - Field Asbestos North Complaint Investigation - Field Other Central Source Test/Performance Test - Field Title V Central Source Test/Performance Test - Field Gasoline Vapor Recovery Central Source Test/Performance Test - Field Gasoline Vapor Recovery North Surveillance/Survey - Field Regulation 8 Central Surveillance/Survey - Field Regulation 8 North Legal Action - Field Activity Title V North Service/Info - Field Asbestos North ATC/PTO Startup - Field Minor Source Central ATC/PTO Startup - Field Minor Source South ATC/PTO Startup - Field Minor Source Ag Central ATC/PTO Startup - Field Minor Source Ag South ATC/PTO Startup - Field Gasoline Vapor Recovery South Training - Field Title V South Training - Field Other Central Special Project - Field Other South District Conducted Testing - Field Non-Permitted Sources South Supervision/Lead Duties - Field Title V South A-8 SJVUAPCD
40 A.5 Climate Summaries BAKERSFIELD WSO AIRPORT, CALIFORNIA (040442) Period of Record Monthly Climate Summary Period of Record: 10/1/1937 to 12/31/2005 Average Max. Temperature (F) Average Min. Temperature (F) Average Total Precipitation (in.) Average Total SnowFall (in.) Average Snow Depth (in.) Jan Feb Mar Apr May Jun Jul Aug Sep Oct Nov Dec Annual Percent of possible observations for period of record: Max. Temp.: 99.6% Min. Temp.: 99.6% Precipitation: 99.7% Snowfall: 92.4% Snow Depth: 92.2% Source: Western Regional Climate Center FRESNO WSO AIRPORT, CALIFORNIA (043257) Period of Record Monthly Climate Summary Period of Record: 7/ 1/1948 to 12/31/2005 Average Max. Temperature (F) Average Min. Temperature (F) Average Total Precipitation (in.) Average Total SnowFall (in.) Average Snow Depth (in.) Jan Feb Mar Apr May Jun Jul Aug Sep Oct Nov Dec Annual Percent of possible observations for period of record: Max. Temp.: 100% Min. Temp.: 100% Precipitation: 100% Snowfall: 91.2% Snow Depth: 91.3% Source: Western Regional Climate Center A-9 SJVUAPCD
41 HANFORD 1 S, CALIFORNIA (043747) Period of Record Monthly Climate Summary Period of Record: 12/1/1927 to 12/31/2005 Average Max. Temperature (F) Average Min. Temperature (F) Average Total Precipitation (in.) Average Total SnowFall (in.) Average Snow Depth (in.) Jan Feb Mar Apr May Jun Jul Aug Sep Oct Nov Dec Annual Percent of possible observations for period of record Max. Temp.: 98.4% Min. Temp.: 98.1% Precipitation: 98.8% Snowfall: 98.2% Snow Depth: 98.2% Source: Western Regional Climate Center A-10 SJVUAPCD
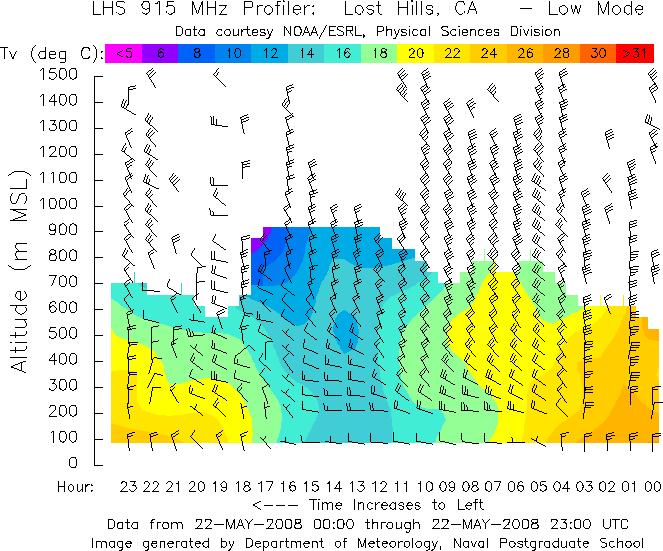
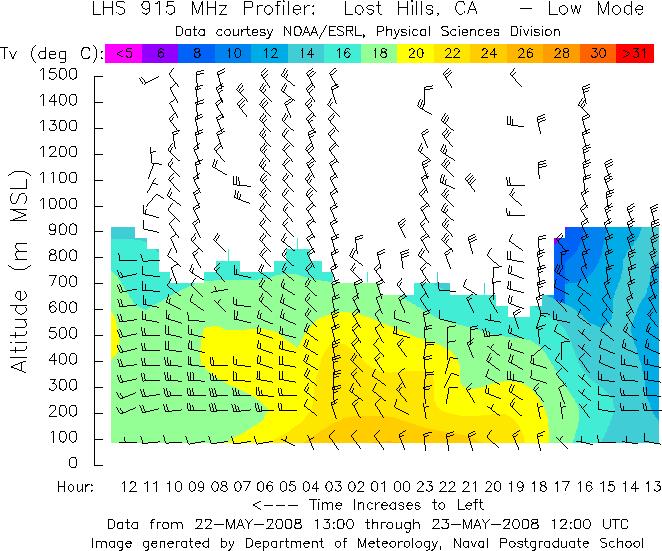
42 A.6 Wind Profiles Time in UTC (Coordinated Universal Time, also abbreviated with "Z" or "GMT") is also called Greenwich Mean Time (Mean Solar Time at the Royal Observatory in Greenwich, England). Greenwich Mean Time is seven hours ahead of Pacific Daylight Time (PDT). For example, 12 UTC or 12 Z is 4 AM PST or 5 AM PDT. The lower air profilers were located in Tracy, Chowchilla, and Lost Hills. Wind barbs point in the direction "from" which the wind is blowing. A circle represents calm conditions. Flags (straight lines) attached at the end of the wind barbs indicate wind speed. Each short flag represents 5 knots, and each long flag represents 10 knots. A long flag and a short flag represent 15 knots, simply by adding the value of each flag together (10 knots + 5 knots = 15 knots). The color-coded speed scale is also provided on top of the plot. A triangular flag at the end of a wind barb represents a 50- knot wind. This wind barb is color-coded orange in the plot shown above. A-11 SJVUAPCD
43 A-12 SJVUAPCD


44 A-13 SJVUAPCD


45 A-14 SJVUAPCD

46 A-15 SJVUAPCD


47 A-16 SJVUAPCD

48 A-17 SJVUAPCD

49 A-18 SJVUAPCD
 on May 21, 2008 The upper air analysis showed an unseasonably")

50 A.7 Weather Charts Upper-air analysis (approximately 18,000 feet above ground level) on May 21, 2008 The upper air analysis showed an unseasonably strong trough over the Great Basin. Strong winds were evident on the left-side of the trough over northern California. 5:00 am PDT 5:00 pm PDT A-19 SJVUAPCD
51 Surface Analysis on May 21, 2008 The surface analysis charts from May 21, 2008 showed packed isobars, which indicated strong winds over the San Joaquin Valley. 5:00 am PDT 11:00 am PDT A-20 SJVUAPCD
52 5:00 pm PDT Surface Analysis on May 21, :00 pm PDT A-21 SJVUAPCD


53 Upper-air analysis (approximately 18,000 feet above ground level) on May 22, 2008 The upper air analysis showed an unseasonably strong trough over the Great Basin. Strong winds were evident on the left-side of the trough over northern California. 5:00 am PDT 5:00 pm PDT A-22 SJVUAPCD
54 Surface Analysis on May 22, 2008 The surface analysis charts from May 22, 2008 showed packed isobars, which indicated strong winds over the San Joaquin Valley. 5:00 am PDT 11:00 am PDT A-23 SJVUAPCD
55 5:00 pm PDT Surface Analysis on May 22, :00 pm PDT A-24 SJVUAPCD
56 A.8 Surface Weather Observations Weather Conditions for: Bakersfield, Meadows Field Airport, CA (KBFL) Elev: 509 ft; Latitude: ; Longitude: Time Temp. Dew Relative Wind Wind Visibility WX Clouds Sea Level Altimeter Station 6 Hr 6 Hr 24 Hr 24 Hr Quality Point Humidity Direction Speed Pressure Setting Pressure Max Min Max Min Control (PDT) (f) (f) (%) (mph) (miles) (mb) (inches) (inches) Temp Temp Temp Temp 11:54 pm NW CLR OK 10:54 pm WNW CLR OK 9:54 pm CALM CLR OK 8:54 pm CALM CLR OK 7:54 pm WNW CLR OK 6:54 pm NW SCT OK 5:54 pm NW CLR OK 4:54 pm NW CLR OK 3:54 pm NW CLR OK 2:54 pm NW 13G HZ CLR OK 1:54 pm NNW 10G HZ CLR OK 12:54 pm WNW 9G CLR OK 11:54 am CALM CLR OK 10:54 am WNW CLR OK 9:54 am NNW 13G CLR OK 8:54 am NNW CLR OK 7:54 am WNW CLR OK 6:54 am CALM CLR OK 5:54 am CALM CLR OK 4:54 am NW CLR OK 3:54 am CALM CLR OK 2:54 am CALM CLR OK 1:54 am CALM CLR OK 12:54 am 11:54 pm N CLR OK NW CLR OK A-25 SJVUAPCD
57 Time Temp. Dew Relative Wind Wind Visibility WX Clouds Sea Level Altimeter Station 6 Hr 6 Hr 24 Hr 24 Hr Quality Point Humidity Direction Speed Pressure Setting Pressure Max Min Max Min Control (PDT) (f) (f) (%) (mph) (miles) (mb) (inches) (inches) Temp Temp Temp Temp 10:54 pm NW CLR OK 9:54 pm NNW CLR OK 8:54 pm NNW CLR OK 7:54 pm NNW CLR OK 6:54 pm N 22G HZ CLR OK 6:16 pm NNW 29G HZ CLR OK 6:04 pm NNW 24G HZ CLR OK 5:54 pm NNW 20G HZ CLR OK 4:54 pm NNW 21G HZ CLR OK 3:54 pm NW CLR OK 2:54 pm NNW 18G CLR OK 1:54 pm NNW 14G CLR OK 12:54 pm NW 13G CLR OK 11:54 am WNW 16G CLR OK 10:54 am NW 13G CLR OK 9:54 am NNW 16G CLR OK 8:54 am NW 18G CLR OK 7:54 am NNW CLR OK 6:54 am N CLR OK 5:54 am N CLR OK 4:54 am N CLR OK 3:54 am N CLR OK 2:54 am NNW CLR OK 1:54 am NW CLR OK 12:54 am NNW CLR OK 20 May 11:54 pm NNW CLR OK A-26 SJVUAPCD
58 Weather Conditions for: Lemoore, Naval Air Station, CA (KNLC) Elev: 233 ft; Latitude: ; Longitude: Time Temp. Dew Relative Wind Wind Visibility WX Clouds Sea Level Altimeter Station 6 Hr 6 Hr 24 Hr 24 Hr Quality Point Humidity Direction Speed Pressure Setting Pressure Max Min Max Min Control (PDT) (f) (f) (%) (mph) (miles) (mb) (inches) (inches) Temp Temp Temp Temp 23 May 12:56 am CALM CLR OK 11:56 pm missing 10:56 pm WNW FEW OK 9:56 pm WNW 16G FEW OK 8:56 pm WNW FEW OK FEW WNW :56 pm SCT OK FEW NW 18G :56 pm SCT OK FEW NW 24G :56 pm SCT OK OK NW 22G SCT :56 pm 3:56 pm NW 22G BLDU FEW OK 2:56 pm NW 25G BLDU FEW OK 1:56 pm NNW 23G BLDU FEW OK 12:56 pm NNW 29G BLDU FEW OK 11:56 am missing 10:56 am NNW 28G BLDU CLR OK 9:56 am NNW 40G BLDU CLR OK 8:56 am missing 7:56 am Missing 3:56 pm NW 22G BLDU FEW OK 2:56 pm NW 25G BLDU FEW OK 1:56 pm NNW 23G BLDU FEW OK 12:56 pm NNW 29G BLDU FEW OK 11:56 am missing 10:56 am NNW 28G BLDU CLR OK A-27 SJVUAPCD
59 Sea Time Temp. Dew Relative Wind Wind Visibility WX Clouds Altimeter Station 6 Hr 6 Hr 24 Hr 24 Hr Quality Level Point Humidity Direction Speed Pressure Setting Pressure Max Min Max Min Control (PDT) (f) (f) (%) (mph) (miles) (mb) (inches) (inches) Temp Temp Temp Temp 9:56 am NNW 40G BLDU CLR OK 8:56 am missing 7:56 am missing 6:56 am NNW 28G CLR OK 6:46 am NNW 24G CLR OK 5:56 am NNW 24G CLR OK 4:56 am NW 29G CLR OK 3:56 am NW 30G CLR OK 2:56 am NW 24G CLR OK 1:56 am NW 29G CLR OK 12:56 am NW CLR OK 11:56 pm NW CLR OK 10:56 pm WNW CLR OK 9:56 pm WNW CLR OK 8:56 pm NW CLR OK 7:56 pm NNW 26G CLR OK 6:56 pm NW 35G CLR OK 5:56 pm 5:12 pm 4:56 pm 3:56 pm 2:56 pm 1:56 pm 12:56 pm 11:56 am 10:56 am 9:56 am 8:56 am NNW 32G BLDU CLR OK NNW 28G BLDU CLR OK NNW 38G BLDU CLR OK NNW 38G BLDU CLR OK NNW 31G BLDU CLR OK NW 33G BLDU CLR OK NNW 29G BLDU CLR OK NNW 31G BLDU CLR OK NNW 30G BLDU CLR OK NNW 29G VCBLDU CLR OK NNW 23G CLR OK A-28 SJVUAPCD
60 Time Temp. Dew Relative Wind Wind Visibility WX Clouds Sea Level Altimeter Station 6 Hr 6 Hr 24 Hr 24 Hr Quality Point Humidity Direction Speed Pressure Setting Pressure Max Min Max Min Control (PDT) (f) (f) (%) (mph) (miles) (mb) (inches) (inches) Temp Temp Temp Temp 7:56 am NNW CLR OK 6:56 am NNW CLR OK 6:42 am NNW CLR OK 5:56 am NW CLR OK 4:56 am NNW CLR T OK 3:56 am NNW CLR OK 2:56 am CALM CLR OK 1:56 am WNW CLR T OK 12:56 am CALM CLR OK 12:20 am NW CLR OK 20 May 11:56 pm WNW CLR OK A-29 SJVUAPCD

61 A.9 Newspaper Articles Articles from May 21, 2008 Winds kick up dust in valley, topple tree branches in Modesto By BEE STAFF REPORTS last updated: May 21, :37:39 PM High winds knocked a large branch off an ash tree in downtown Modesto this morning and tore a big limb from a tree on the Modesto High School campus. No injuries were reported. The branch at the high school fell across one of the main campus walkways, which was empty because students were in class. A mile away, a limb from a large Modesto ash fell into morning traffic on H street between 13th and 12th streets. City workers passing by cleared the street quickly. Meanwhile, pollution control officials are warning people to limit exposure to blowing dust and heavy exertion or strenuous activities outdoors. The San Joaquin Valley Air Pollution Control District issued a cautionary statement active through this evening. Dust and other pollution in the air can cause health problems, increase the risk of respiratory infections, exacerbate lung diseases and spark asthma attacks and acute bronchitis, according to the district. Those with heart or lung diseases are urged by the district to follow doctors advice, and children and seniors are advised to avoid prolonged exposure, strenuous activity or heavy exertion. They can also make driving difficult, and the National Weather Service has issued a wind advisory through 11 p.m. The winds were expected to reach up to 30 mph by late morning, according to the weather service. It advises motorists to use extra caution, especially while driving taller vehicles and to secure any items that could be blown away. The winds are expected to drop back down to mph by late this evening before picking back up again tomorrow, according to the weather service. Wind, dust create dangerous driving conditions, CHP warns The Bakersfield Californian, Wednesday, May 21, 2008 The California Highway Patrol has put out a warning for all drivers in the south end of Kern County. The advisory warns that high winds are kicking up dust, causing low visibility. Drivers are specifically warned not to travel on Highway 99 between Highway 119 and Highway 223 where visibility has been declared zero. The advisory will last until at least midnight. A-30 SJVUAPCD

62 Winds fan flames in loose hay, grass in burst of local fires BY DAVID CASTELLON MAY 21, 2008 Wind gusts that blew across the Valley Tuesday afternoon started or fanned the flames of fires in west Visalia, including a series of small fires that briefly threatened homes and a business. "I think the wind played havoc with a lot of people today," said Tulare County Fire battalion chief Jeff Newton, incident commander for one of the fires that burned through about 100 tons of loose hay at the Milky Way Dairy north of Goshen. The cause of the blaze hadn't been determined Tuesday night, but Newton said strong gusts that began that afternoon helped the flames spread across the loose hay and at times it threatened to blow burning embers into a large stack of baled hay nearby. Fire dispatchers first received a report of the hay fire near Road 80 and Avenue 320 about 4:15 p.m., and more than four hours later, fire crews still were trying to put it out using fire-retardant foam, "which is the only way to put it out," Newton said. "I think we've got a handle on it." Newton was also on the scene for a 7 p.m. grass fire in Orosi that was put out by Tulare County crews after burning about 300 square yards but before it spread to nearby structures. "It's been like this all day," Newton said. "The winds have subsided but it has been very busy." Newton said the cause of the Orosi flareup is being investigated. "Nobody's talked to us about it," he said. Newton said that Tulare County also assisted CAL FIRE in calls Tuesday in the Yokohl Valley area, and Horse Creek in the eastern Tulare County hill country. Some Visalia firefighters initially called in to help fight the hay fire not a manure fire, as originally reported were redirected to help fight another fire that broke out in a vacant lot on Bollinger Street north of Mineral King Avenue. On Tuesday, firefighters were trying to determine if a lawn mower cutting dry grass on the lot about 5 p.m. may have struck a rock or other object that triggered a spark and ignited the fire that quickly burned through the lot and up a tall Italian cypress tree. Wind gusts blew hot embers over about a 100-yard area setting off four other small fires on more vacant land behind homes on Bollinger and along nearby Mill Creek, said Visalia battalion Chief Danny Wristen. Peggy Tristao said she walked outside her Bollinger Street home and saw smoke blowing from down the street, where the first fire apparently started. And before firefighters arrived, she spotted flames burning through the brush near her home. "So the fire department knocked down my fence and put it out. Before that, we were fighting it with hoses," she said. A-31 SJVUAPCD
63 About 6:30 p.m., CAL FIRE firefighters received a report of a brush fire at Lake Kaweah's Horse Creek Campground. Battalion Chief Paul Marquez said fire crews put the flames out quickly. Tulare County Fire Department battalion chief Jeff Newton, left, surveys the result of a Tuesday evening grass fire that narrowly missed burning structures in Orosi. (GERALD CARROLL) Wicked Wind Tracy Press, Late Wednesday, May 21, 2008 The wind came in like a lion today and never stopped, leaving Tracy with fallen tree limbs, sheets of dust, out-of-control steering wheels and, well, a bad-hair day. The National Weather Service reported strong, gusty north winds throughout the Central Valley. The strong winds are expected to continue into the evening hours. The good news is that the triple-digit temperature has dropped to a high of 76 degrees and a low of 50 degrees. The bad news is that the winds are stirring up unhealthy concentrations of particulate pollution. The county Air Pollution Control District warned this afternoon that people suffering from lung disease or allergies are encouraged to stay inside or avoid prolonged exposure to dust kicked up from today s gusty winds, which have kicked up because of a northern cold front that hit warm Central Valley air sometime this afternoon. The stagnant conditions quickly came to an end (today), said air district analyst Shawn Ferreira in a statement issued around 2 today. Older adults and children with asthma, bronchitis or other respiratory problems should also take extra care to avoid strenuous activities today, the statement said. The winds are expected to decrease by Thursday night. A low-pressure system backing westward over Northern California also may bring showers and thunderstorms in the foothills and Sierra. Articles from May 22, 2008 Winds kick up misery, danger around county Merced Sun-Star, Thursday, May. 22, 2008 ATWATER -- High winds made conditions miserable for Merced County firefighters Wednesday as they battled grass fires in the Atwater, Livingston and Winton areas. Winds also toppled trees and tree branches throughout the county. Forty acres of dry grass was consumed about 12:53 p.m. at Preston and Buhach roads in the Atwater area in a fire of undetermined origin. About 15 firefighters responded in seven trucks from Gurr Road, Castle, Winton, Snelling, Merced, Livingston and McKee stations. No injuries were reported and no structures involved, according to Merced County spokeswoman Katie Albertson. A-32 SJVUAPCD

64 Fire destroyed six tons of oat hay and three acres of baled oat hay remaining in the field at Oakdale and Amsterdam roads in the Winton area. Firefighters said it is likely the 1:52 p.m. fire began as the newly delivered hay was being unloaded by equipment. Another 50 acres of dry grass and grazing land was destroyed in a 2:10 p.m. fire at Highway 140 and Lincoln Boulevard in the Livingston area. Battalion Chief Kevin Lawson said winds played a big role in this fire which was contained about 4 p.m. About 10 acres of the grass was on U.S. Fish and Wildlife Service property. The cause of this fire remains under investigation. -- Doane Yawger High winds bring trouble for tree, cattle farmers Merced Sun-Star, Thursday, May. 22, 2008 By CAROL REITER creiter@mercedsun-star.com Heavy winds caused almond trees in this orchard on Lincoln Boulevard to be uprooted Wednesday afternoon (photo by Marci Stenberg, Merced Sun-Star). The high winds Wednesday brought more than itchy eyes and dusty skies. It also means more trouble for farmers. The National Weather Service had a wind advisory in effect until 9 p.m. Wednesday, but that is little comfort to some growers. "Some almond trees are going down," said Mark Smith, a Winton almond grower and biologist for the Merced County Agricultural Commissioner. Almond trees are grafted onto peach stock to get better tasting almonds, he said. Peaches have a shallow root system, and trees planted in sandy soil are very susceptible in the wind. "With the trees all leafed out, they are like a big umbrella," Smith said. The winds that played havoc with the almond trees should slack off tonight, but the weather should stay cooler, said Brian Ochs, an intern at the National Weather Service in Hanford. Ochs said that a dry cold front brought the winds to the Valley. But there's good weather in the making for people celebrating the holiday weekend this week. Ochs said Saturday's temperatures should be in the 70s, and Sunday and Monday in the 80s. The blustery day that brought agony to almond growers is just the latest in a series of weather-related disasters that have hit local farmers and ranchers. On Tuesday, David Robinson, ag commissioner for the county, asked for a disaster declaration by the county supervisors. The declaration was approved, and is on its way to the state for review. A-33 SJVUAPCD
65 If the declaration is approved there, it will then go to the U.S. Department of Agriculture for approval, and cattle ranchers, or other growers who lost at least 30 percent of their crop because of the drought, can apply for low-interest loans from the government. The disaster declaration is because of lack of rainfall and no feed for cattle that spend the winter in the foothills. The dry winter has resulted in a significant loss in feed value in the native grasses on the rangeland. Estimates are 65 to 80 percent loss on about 560,000 acres. The value of the lost forage is set at about $7 million. A disaster declaration is done when there is at least a 30 percent reduction in the crop's value. Smith said the grasses actually got good rain at the beginning of the year, but the timing was wrong. "After January we haven't had much rain, and the grasses didn't grow much," Smith said. Because of the lack of foothill feed, cattle ranchers are scrambling to buy supplemental feed. That feed is seeing record-breaking high prices, so some cattle owners are selling their stock. Merced County isn't the only county to see rangeland dry up too early. Mariposa County, where cattle are king, the rangeland is as sparse as it is in Merced County. Cathi Boze, Mariposa County's ag commissioner, said she is asking for a disaster declaration for Mariposa County at next Tuesday's supervisors meeting. Boze said she estimates about a 75 percent loss, which is $5.3 million lost in rangeland. But it's not just the feed that has been hit hard by the drought, Boze said. "Some creeks and springs have gone completely dry. Cattlemen are carrying water to their cows," Boze said. Some cattle ranchers have resorted to selling their stock before they want, because of the scarcity and price of feed, Boze said. Good alfalfa hay is costing growers about $240 a ton. "These guys are hoping for some help. Hopefully, a disaster declaration will help them out," Boze said. Reporter Carol Reiter can be reached at (209) or creiter@mercedsun-star.com. Windstorm plans to stay for holiday The Madera Tribune, Thursday, May 22, 2008 By Ramona Frances - and John Rieping Just in time for the Memorial Day weekend, an enormous windstorm is expected to affect more than a fifth of the nation and will likely drop rain in some areas according to a valley weather expert. "It has arrived unseasonably late in the San Joaquin Valley," said meteorologist Steve Johnson. "As of Wednesday, the large low pressure center has settled in the Great Basin area, east of the Sierras. In the next four or five days, it will encompass 11 western states, going all the way from Washington to Mexico." Johnson - son of former Senior Farmer of the Year Richard Johnson of Madera - provides weather information and forecasts in the San Joaquin Valley. He describes the growing storm as having a very large center of "low pressure" - in which the A-34 SJVUAPCD
 is very large.")

66 atmospheric pressure is lower in relation to the surrounding area. Low-pressure areas are frequently associated with cloud cover and stronger winds. Winds from west by northwest in the Madera Municipal Airport blew 23 mph, gusting to 38 mph, Wednesday according to the National Weather Service. "It (the storm) is very large. It is what we call, a large upper level devil. It's cut off from the main jet stream, which means it's difficult to forecast. It will wobble around, near St. George, Utah. What's weird is it will retrograde near Las Vegas - maybe Reno or Elko, Saturday or Sunday. We could have rain and thunder showers, possibly rain and snow in the mountains," Johnson said. Cloudy or overcast skies, which often form in low pressure areas, tend to reduce daily temperature ranges regardless of the season. Days tend to be cooler and nights tend to be warmer. "We had record heat over the weekend and now it's anywhere from 25 to 30 degrees cooler - from one Saturday to the next," Johnson said. "With weather, there is always a new twist. That is what makes this so interesting." This latest weather twist might put a damper on upcoming holiday activities. "Tioga Pass just opened for the summer yesterday. Now, this late season storm will affect travel into Yosemite," he said. "I am very concerned about public safety. This storm will not be a gulley washer but it will affect outdoor activity and Memorial Day outdoor services." Of more lasting significance might be the wind storm's agricultural impact... To read the rest of the story... you'll have to have an online subscription to The Madera Tribune. Grass fire breaks out east of Hanford Thursday May 22, 2008, 3:15 p.m. Firefighters were quickly gaining control on a grass fire which broke out just after 2:30 p.m. today on the south side of Highway 198 near Seventh Avenue east of Hanford. Fire officials haven't determined the cause of the wind-blown blaze, which covered approximately 25 acres and was in the vicinity of radio station KIGS just off the highway. Flames surrounded the transmitting towers, and came within 20 or 30 feet of the building. Kings County Fire, Hanford Fire and Lemoore Fire personnel all responded to fight the blaze. More details on the blaze will be in Friday's Sentinel. A Kings County firefighter wets down an area of grass near Sixth Avenue and Highway 198 earlier today after a winddriven fire blacked approximately 25 acres. (Gary Feinstein/The Sentinel) A-35 SJVUAPCD
67 Fires spark in area; high winds don't help Blazes burn on freeway near Salida, gusts wreak havoc around Modesto By Inga Miller and Susan Herendeen Modesto Bee, Thursday, May 22, 2008 High winds mixed with dry conditions turned grassy freeway strips into tinderboxes Wednesday, with firefighters spending the day dousing flames around the region. Among them were two fires that tied up midday traffic along northbound Highway 99 near Pelandale Avenue. A fire reported at about 9:30 a.m. was doused, but came back stronger as a second blaze threatened a home on Bangs Avenue. Modesto Fire Battalion Chief Hugo Patino could not pinpoint a cause, but he suggested that sparks from equipment or cigarettes tossed out by passing motorists could have ignited blazes that picked up steam due to high winds. "On a normal day, more than likely, the fires would have stayed much smaller and the crews would have been able to put them out much quicker," Patino said. "Because of the wind, it takes longer." Fire crews get to work early Dale Skiles, chief of the Salida Fire District, said the first fire reported at 9:30 a.m. appeared to start on the north side of Pelandale Road, then jump to the south side. Firefighters from Modesto and Salida had those blazes out by about 11:15 a.m., but the flames were back 15 minutes later. The California Highway Patrol closed the Pelandale Road off-ramp from 11:47 a.m. to 1:28 p.m., prompting traffic tie-ups on the northbound side of the highway and along Kiernan Avenue. "We don't know if it was a rekindle or if it was a new ignition," Skiles said. The second fire was stronger, igniting oleander bushes and brushing up toward businesses on Sisk Road. Some buildings suffered exterior damage, including a broken window and damage to utility meters, but crews were able to stop the flames before they caused more serious damage. A home in the 2900 block of Bangs Avenue also was spared. Firefighters were called into action again at 1:39 p.m., when a blaze broke out near Claus and Van Dusen roads north of the Riverbank Army Ammunition Plant. The grass fire burned nearly 10 acres, endangering a home that escaped the flames but causing minor damage to six or seven recreational vehicles stored at the plant. Firefighters from Modesto, Escalon and Oakdale joined the Stanislaus Consolidated Fire Protection District to douse the fire, which was contained by 3 p.m., according to Battalion Chief Richard Boyd. They also quelled smaller blazes at Wellsford Road and Dusty Lane, and at Albers and Milnes roads. Gusts pose threat, too High winds prompted a warning from the San Joaquin Valley Air Pollution Control District because dust and pollution in the air can increase the risk of respiratory infections, exacerbate lung diseases and spark asthma attacks. A-36 SJVUAPCD
68 Windy conditions produced extra work for city workers, too, by ripping a limb off a tree at Modesto High School and knocking a limb off a Modesto ash tree on H Street between 12th and 13th streets. Fire departments increased their staffing ratios today, Boyd said, because an advisory from the National Weather Service predicts gusts of up to 41 mph through the evening. Meanwhile, grassy medians are parched because March and April were the driest on record in the Northern San Joaquin Valley. The weather service recorded only 0.02 inches of rain in Modesto, the least amount of precipitation since "We've got an early fire season," Boyd said. "It just really multiplies the danger of fires this time of year." The Worst is over By Eric Firpo Tracy Press, late Thursday, May 22, 2008 Tracy s police department had to use a backup generator for about three hours today after a second day of fierce wind downed lines that knocked out power in spots all over the city and for a time blotted out the sun with a cloud of dust. Swirling gale-force gusts shoved over trees in parks and next to streets throughout town, snapped limbs and branches, and were partly responsible for power failures as they cut through lines like a karate chop, said Pacific Gas and Electric spokeswoman Nicole Tam. Power was lost when lines slapped together, she said. At about 9:30 a.m., the police department fired up a backup generator to keep on the electricity and stay open for business. The Lolly Hansen Senior Center and the parks department next door were less fortunate, as offices went dark for about three hours before electricity was restored. The Grand Theatre Center for the Arts also lost power for a few hours. Tam said about 745 customers in Tracy lost power because of the windstorm, and about 4,400 customers were without power countywide. The debris sent city workers scrambling, with about 25 or 30 people in crews for the public works department scurrying around to clean up detritus from the powerful windstorm. Fourteen trees had to be taken out after they fell over, said Public Works Director Kevin Tobek, and countless more limbs were cleared from streets, sidewalks and parks. But the downfalls caused surprisingly little wreckage. We don t have any reports of property damage or bodily damage, he said. Everything fell in the right place. While whipping winds sent limbs crashing to the ground, it also lifted clouds of dust so large and thick that by mid-morning, it turned a blue sky brown and left the taste of dirt on tongues. A lot of dust was being picked up everywhere, said Anthony Presto, spokesman for the San Joaquin Valley Air Pollution Control District. What s most important is that people really limit their exposure to it. It s not a good time for kids to be out playing. The National Weather Service predicts the end of the windstorm is in sight, though gusts are still expected Friday morning. By tomorrow afternoon, things will start to calm down, said Jared Leighton of the weather service. A-37 SJVUAPCD


69 ARTICLES FROM MAY 23, 2008 Raging winds wreak havoc UOP tower loses window; 45-mph gusts topple trees, spill rig cargoes By Zachary K. Johnson Record Staff Writer May 23, :00 AM STOCKTON - An ill wind kicked up dust, knocked down branches and turned out the lights as it tore through the Central Valley on Thursday. Winds also played havoc with big rigs carrying goods through San Joaquin County, including a truck that lost a large concrete pipe on the Crosstown Freeway, blocking a lane of traffic for two hours in the morning. "In that wind tunnel, he just overcorrected and lost it," said Adrian Quintero, a California Highway Patrol spokesman, of the driver. It wasn't the only report of the wind causing a truck to lose its cargo, either, Quintero said. "It's been very busy for us today." In Stockton, gusts topped out at 45 mph at about 11 a.m., according to the National Weather Service. That gust blew through the city more than three hours after the wind blew a 20-foot-tall window out of the iconic Burns Tower at University of the Pacific. The stained-glass window on the west face of the tower was part of the building when it was completed in Work crews Thursday were reanchoring the rest of the long windows that encircle the uppermost reaches of the tower, which houses an old water tank, university spokesman Patrick Giblin said. Employees were evacuated from offices inside the tower, and the area outside the building was roped off, he said. Not long after, a pedestrian on the street in front of the campus was struck by a falling tree branch at 8 a.m., Giblin said. Dry dust went airborne, according to the San Joaquin Valley Air Pollution Control District, which warned that even the healthy should avoid the air for prolonged periods of time Thursday. A cloud of topsoil darkened the sky around Tracy. "It was a dark, dusty haze that took over this morning," city A-38 SJVUAPCD


70 spokesman Matt Robinson said. It also knocked out power to about 2,100 customers downtown until about 11:30 a.m., he said. Trees hitting wires and wires slapping into each other caused power outages, said Nicole Tam, spokeswoman for Pacific Gas and Electric Co. At a late-morning peak, 4,400 customers in and around Stockton were without power from the wind, but that number was less than 900 by 2 p.m., she said. In Lodi, thousands of residents lost power Thursday morning, and about two dozen trees are now tagged as perilously close to falling and in need of removal. At about 8:45 a.m., a tree fell on a power line in Hale Park, knocking out electricity to about 4,000 customers for about two hours, city spokesman Jeff Hood said. The city shut down Lodi Lake Park on Wednesday after strong winds felled a large oak tree believed to be more than 120 years old. came from central and south Stockton, older areas of the city with larger trees, she said. Before the end of the workday on Thursday, the city of Stockton had received 225 calls to remove fallen trees and branches, city spokeswoman Connie Cochran said. Supervisors were doing "triage" to clean up the most-pressing disruptions, and work crews were out in force, she said. Most of the calls Winds stoked a grass fire near Linden and shook fruit from county orchards. Area cherry growers worry the winds may bruise or scar their rapidly maturing fruit, but damage may be limited because it is still early in the crop season, officials said. "The wind's not good," said Tom Gotelli, a principal at O-G Packing in Stockton, one of the state's largest cherry growers and packers. "We're pretty concerned about it." The full impact won't be known until the harvest begins in earnest in local orchards and wholesale buyers decide what percentage of wind-scarred or -discolored fruit they will accept, he said. Staff writers Reed Fujii and Daniel Thigpen contributed to this report. Contact reporter Zachary K. Johnson at (209) or zjohnson@recordnet.com. Winds cause trees to topple throughout city Los Banos Enterprise, Friday, May. 23, 2008 Weather plays havoc in rest of county as fires flare up on Eastside By Corey Pride / cpride@losbanosenterprise.com A-39 SJVUAPCD
71 Los Baños' Parks and Recreation division and its fire department have been busy the past three days trying to clear public areas of fallen trees and branches. "I can't say we've had three successive days of wind like this," Parks and Recreation Operations Manager Paul Cardoza said, recalling his 16 years of on-the-job experience. "Because of the wind trees are splitting and toppling over, and not just in the parks." Parks and Recreation crews were at work until late in the night on Wednesday. Cardoza said he tries to monitor weather reports. Originally the high winds were forcasted to calm down by Thursday, but by 5:30 a.m. Thursday morning Cardoza had to call his employees in to work because of swirling winds. The fire department also pitched in. Fire Chief Chet Guintini said his department was inundated with calls from residents reporting down trees. Guintini said his personnel concentrated on the incidents that involved public rights of way. Giving Parks and Recreation most of the credit, Guintini said the fire department did about 15 percent of the work. He said his crews most encountered large branches that had fallen. Residents who need to report down trees should call Park and Recreation during business hours at and, after 5 p.m., the police department at High winds also made conditions miserable for Merced County firefighters Wednesday as they battled grass fires in the Atwater, Livingston and Winton areas. Forty acres of dry grass were consumed by about 12:53 p.m. at Preston and Buhach roads in the Atwater area in a fire of undetermined origin. About 15 firefighters responded in seven trucks from Gurr Road, Castle, Winton, Snelling, Merced, Livingston and McKee stations. No injuries were reported, according to Merced County spokeswoman Katie Albertson. Fire destroyed six tons of oat hay and three acres of baled oat hay remaining in the field at Oakdale and Amsterdam roads in the Winton area. Firefighters said it is likely the 1:52 p.m. fire began as the hay was being unloaded. Another 50 acres of dry grass and grazing land was destroyed in a 2:10 p.m. fire at Highway 140 and Lincoln Boulevard in the Livingston area. Battalion Chief Kevin Lawson said winds played a big role in this fire which was contained at about 4 p.m. About 10 acres of the grass was on U.S. Fish and Wildlife Service property. The cause of this fire remains under investigation. Merced Sun-Star associate editor Doane Yawger contributed to this article. Wind wreaks havoc with highway travelers Merced Sun-Star, Friday, May. 23, 2008 Fatal crash near Highway 99 brings traffic to a halt. by VICTOR A. PATTON vpatton@mercedsun-star.com A-40 SJVUAPCD
72 Firefighters battled more than four fires throughout Merced County on Thursday, as heavy winds and dry conditions created optimal conditions for the fires to spread. Wind-whipped grass fires in Turlock and a fatal van crash also closed Highway 99 in both directions most of the afternoon and early evening between the Keyes-Ceres area to south of Turlock. This forced many motorists to detour along back roads in Merced and Stanislaus counties between 2 and 7 p.m. Also Thursday, a team of 10 firefighters from several Merced County departments departed to assist with firefighting efforts near Santa Cruz. Around 8 a.m., firefighters from the Cal Fire/Merced County Fire Department began battling a almond hull fire in Le Grand. Battalion Chief Brian Neely said about 20 firefighters arrived at Minturn Road, near the Madera/Merced County border, where about 1,000 tons of almond hulls were ablaze. Firefighters also fought rural grass and haystack fires in Livingston and Delhi, Neely said. During the afternoon, firefighters were dispatched to a grass fire at Highway 140 near Cunningham Road east of Planada, consuming about 20 acres. In addition, Cal Fire/Merced Fire Department firefighters also battled a house fire in the 4200 block of Lincoln Boulevard around 2:19 p.m. The cause of that fire is still being investigated. Cal Fire/Merced County Fire Department reported no injuries. Merced Fire Chief Ken Mitten said local firefighters will join with a team from Fresno County to fight the Santa Cruz fire. According to the Associated Press, gusty winds fanned a wildfire in the Santa Cruz Mountains, burning at least 10 homes and more than 2,500 acres. About 1,400 homes have been evacuated of them under mandatory orders -- as the fire, first reported around 5:30 a.m., has continued to grow despite more than 500 firefighters and a swarm of tanker planes and helicopters dousing the area. Thus far, no injuries have been reported. Santa Clara and Santa Cruz county officials said more than 60 residents had been evacuated, as well as 200 students from a summer camp in the mountains. Some were being taken to an evacuation center in Watsonville set up by the Red Cross. Heavy brush and timber and winds gusting up to 50 mph were complicating efforts to fight the blaze. Officials estimated the fire would grow to 10,000 acres before being contained, the Associated Press reported. Turlock police asked motorists to avoid the Highway 99 corridor between Keyes Road and Lander Avenue as fire crews battled a wildfire. The fire burned grass along the freeway and burned around the Best Western Orchard Inn on Taylor Road. Eight passengers in a van from WIS International were involved in the single-vehicle rollover. One died at the scene and three had major injuries. The accident happened just a few minutes after a wildfire broke out along the freeway. Highway traffic remained backed up for miles, only inching forward, in both directions from Turlock and Keyes hours after the fatal wreck and wildfires along the freeway. A-41 SJVUAPCD
73 The fire destroyed many of the 30 mobile homes in a storage yard on Taylor Road. Several homes and businesses in and around the Monte Vista shopping center were evacuated. Fierce winds in Lodi knock down trees, knock out power By Layla Bohm - News-Sentinel Staff Writer Lodi news Sentinel, Friday, May 23, 2008 Last week, Lodi sweltered through triple-digit heat. This week, it's howling winds. Does that mean next week will bring rain? Well, no, but the wind will die down, forecasters say. The strong winds knocked down several large trees, including a well-recognized one at Lodi Lake and another that knocked out power to 4,001 customers Thursday morning. A city wind gauge clocked gusts at 38 mph, and that was the cause of Thursday's power outage that began at 8:44 a.m., said Rob Lechner, customer service manager for Lodi Electric Utility. The culprit, he said, was a tree at Hale Park, at Stockton and Locust streets. The locust tree had split years ago, and half of it blew into power lines and came to rest against a power pole. The power lines actually held the tree up, and the only actual damage was a bent bolt on the pole and a broken glass encasing, both minor issues, Lechner said. Electric crews isolated the problem and began rerouting electricity, restoring it to 2,000 customers by 9:02 a.m., Lechner said. Another 1,300 got power at 10:07 a.m., and the remaining 701 customers had electricity at 10:23 a.m. Areas affected by the power outage included neighborhoods between the Mokelumne River and Kettleman Lane, and from Hutchins Street to Highway 99, Lechner said. Meanwhile, Lodi residents pulled branches from yards and dodged blowing leaves and dust. Despite the power outage that temporarily blackened some traffic signals, no vehicle collisions were attributed to the signal lights, according to police. Around 10:15 a.m., a large tree branch broke loose across from the Lodi Public Library, 201 W. Locust St., and landed on a Toyota pick-up truck. Owner Mike Sudderth walked out of the library to find that the roof was dented and a side mirror was mostly demolished. He'd almost parked one space back when arriving at the library, and he wondered what would have happened if an elderly woman had instead parked in his spot. "That's a lot of weight," he said of the large tree limb. "It could have killed somebody if they'd been walking by." Tree branches, large and small, littered the city, but they were all small compared to the giant tree that fell at Lodi Lake. Countless visitors who travel around trees in the middle of the road to the nature area will no longer see one of them it fell across the northbound part of the road. By 7 a.m., city workers had assessed the damage and checked the nature area. On North Sacramento Street, a tree limb broke loose, just missed a telephone line and came to rest in a small pond in Dennis Norton's front yard. Next door, at Llantera Paz Tire Shop, a metal roof flapped in the wind, and Francisco Cuen was soon put to work, using an electric drill to keep his uncle's roof from flying away. A-42 SJVUAPCD
74 And at University of the Pacific in Stockton, wind knocked out an entire section of the stained glass in Burns Tower. The frame landed in a tree, glass shards scattered and the building was evacuated. The wind is expected to die down by today, according to a spokesman with private forecasting firm AccuWeather, with winds from the west at 6 to 12 mph today, and 7 to 14 mph through the rest of the Memorial Day weekend. Temperatures should be around 70 today, and in the low 70s this weekend. In the meantime, the San Joaquin Valley Air Pollution Control District warned residents to avoid lengthy exposure to blowing dust. It especially affects those with breathing problems, and can raise the risk of heart attacks for those with heart troubles, spokesman Anthony Presto said. Winds whipped waves in the Delta, where no boating incidents were reported, according to the U.S. Coast Guard, which issued a wind and wave advisory. The warning, which extends through this afternoon, affected Point Reyes to Pigeon Point. High winds cause power outages in Tracy By Jennifer Gokhman Tri-Valley Herald, Friday, May 23, 2008 TRACY Students sat in darkened classrooms with light coming through the windows on Thursday at South/West Park School in Tracy, where the electricity was out. Every time the doors opened, gusts of wind blew in, causing papers to flutter. Winds blew at 15 to 25 mph with gusts over 30 mph Thursday, following a windy Wednesday, said Steve Anderson, a forecaster with the National Weather Service. The winds caused tree branches to fall, and a brown cloud of dust hung over Tracy. The wind is expected to be lighter today and will die down to a breeze with temperatures in the 70s for the Memorial Day weekend, according to the National Weather Service. The Tracy Public Works department removed 14 trees, some of which had fallen and some that were too risky to leave in place, as well as fallen branches throughout the day, said Kevin Tobeck, director of public works. The trees did not cause property damage. "We were very fortunate," he said. Power was out in several areas throughout town, said Nicole Tam, PG&E spokeswoman, leaving nearly 750 customers without power. "It was all wind-related," Tam said. "Some areas, I heard, have record-breaking winds." Wind knocked trees into power lines, and lines were hitting one another, Tam added. Students at South/West Park School happened to be studying pioneer activities such as churning butter that did not require electricity. The school was set on a rainy-day schedule to keep the students indoors and out of the wind, said Principal Ramona Soto. "Because of the air quality "... when it's so windy like this, we keep kids inside," she said. This is the first time this year the school has been on a rainy-day schedule because of wind, though it has happened in previous years, Soto added. The air quality in Tracy was moderate as of Thursday afternoon, said Anthony Presto, San Joaquin Valley Air Pollution Control District spokesperson. "Areas (with) gusty winds were kicking up fine particulate matter," he said, suggesting that on days where there are high winds, people should limit their time outside. A-43 SJVUAPCD
75 Particulate matter can cause lung damage, asthma problems and harm people with heart disease, he added. If the wind dies down today, as forecast, the dust should settle. If not, the amount of particulate matter in the air will be high again, he said. Mighty winds wallop West Side Written by Jonathan Partridge Patterson Irrigator, Friday, May 23, 2008 Powerful winds rocked the West Side on Wednesday and Thursday, keeping city staff workers busy removing tree limbs and leaving much of Crows Landing without power for several hours. The National Weather Service recorded wind speeds of up to 44 mph at nearby Modesto City-County Airport and wind speeds as high as 54 mph at Travis Air Force Base near Fairfield. It s definitely been a busy day, said Monica Sandoval, Patterson s public works management analyst, on Thursday. She said the city had responded to about 50 to 60 calls Thursday regarding wind-related incidents and several on Wednesday as well, as high gusts toppled several large branches to the ground. A few of the streets north of downtown, which were hit hard by the winds, looked like a lumberjack s haven, with giant tree limbs scattered along the roadside near where branches had fallen. North Fifth Street resident Susana Araisa, whose sister s van suffered $3,000 worth of damage after limbs fell on top of it Wednesday, said another limb fell in front of her home Thursday morning. Araisa noted that many of the homes in her neighborhood were built in the 1940s, and she estimated the trees are just as old. Her family also dealt with fallen tree limbs last year, and she feared they may be a safety hazard for children playing nearby. We just want to get rid of the oldest trees, she said. Though fallen tree limbs were common, Sandoval noted that no road signs were damaged in Patterson this week as they have been in the past. And though the fire department responded to a downed phone line Wednesday, the city did not report any power line problems. Crows Landing was not so fortunate. A damaged Turlock Irrigation District power line left several residents without power for as long as 6½ hours Thursday. TID initially received a report of a power failure in Crows Landing at 5:45 a.m. that day. Workers restored power to about half of the 350 residents affected by 10:15 a.m. and restored power to remaining customers by 12:15 p.m. TID spokeswoman Jill GeRue said the district responded to several sporadic outages throughout its coverage area Wednesday and Thursday as a result of high winds. Because of dry conditions, the air was filled with dust, leading the San Joaquin Valley Air Pollution Control District to issue a health cautionary statement through late Thursday. Blowing dust can result in unhealthy concentrations of particulate matter 10 microns and smaller, PM10, valley air district officials explained. Exposure to dust and other particle pollution can cause serious health problems, aggravate lung disease, cause asthma attacks and acute bronchitis, and increase risk of respiratory infections. Though the winds were moving quickly, the storm system that caused it was not, leading to the long periods of windy conditions, explained Jared Leighton, a meteorologist with the National Weather Service. The eastward-moving winds, which also led to stormy weather in Colorado and the Midwest, were expected to remain calm after Friday afternoon. A-44 SJVUAPCD


76 Images from the Modesto Bee Video Footage (May 21, 2008) A-45 SJVUAPCD


")
 A-46")
77 Assorted Photographs These photos were taken near Lamont, CA, which is just southwest of Bakersfield, CA Stockton, CA Skycam (May 21, 2008) Fresno, CA Skycam (May 21, 2008) Grapevine (May 21, 2008) Fresno, CA Skycam (May 22, 2008) A-46 SJVUAPCD


 in Fresno, on May 20-22, 2008.")
78 A.10 Television News Coverage The SJVAPCD has collected news coverage of the wind event, and the images below are from video shown during the broadcasts. The coverage is from KGET Channel 17 (NBC) in Bakersfield and KFSN Channel 30 (ABC) in Fresno, on May 20-22, May 20, 2008 (Bakersfield area) A-47 SJVUAPCD


")
")


79 May 21, 2008 (Kerman area West Fresno County) May 22, 2008 (Fresno area) A-48 SJVUAPCD

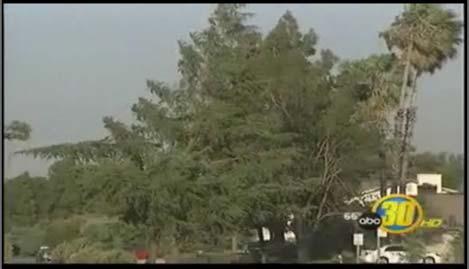
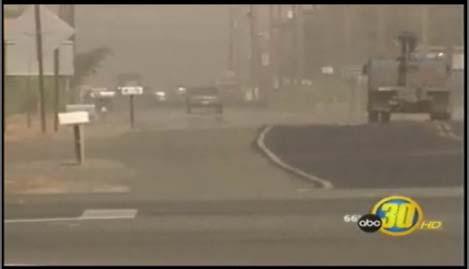

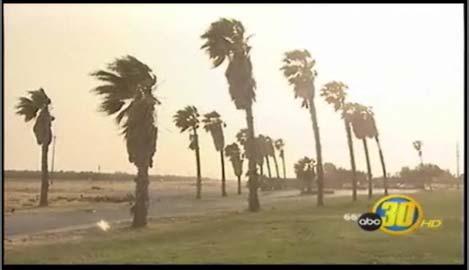

80 A-49 SJVUAPCD


81 A.11 District Compliance Event Coverage The following photographs and video images were taken by SJVAPCD Compliance staff during the May 21-22, 2008 blowing dust event. Compliance Photographs (Bakersfield area) A-50 SJVUAPCD


82 A-51 SJVUAPCD

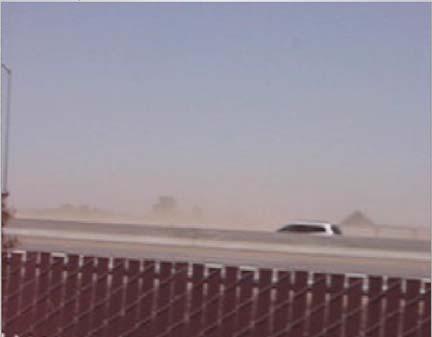

83 Images from Compliance Video Footage A-52 SJVUAPCD
84 A.12 Preliminary Fresno and Bakersfield Climatological Data for May Fresno, CA - May 2008 CXUS56 KHNX CF6FAT PRELIMINARY LOCAL CLIMATOLOGICAL DATA (WS FORM: F-6) STATION: FRESNO MONTH: MAY YEAR: 2008 LATITUDE: N LONGITUDE: W TEMPERATURE IN F: :PCPN: SNOW: WIND :SUNSHINE: SKY :PK WND ================================================================================ A 6B AVG MX 2MIN DY MAX MIN AVG DEP HDD CDD WTR SNW DPTH SPD SPD DIR MIN PSBL S-S WX SPD DR ================================================================================ M M M M M M M M M M M M M M M M M M M M M M M M M M M M M M M M M M M M M M M M M M M M T M M M M M M M M M M M M M M M M M M ================================================================================ SM M 103 A-53 SJVUAPCD
85 ================================================================================ AV FASTST PSBL % 3 MAX(MPH) MISC ----> # # ================================================================================ NOTES: # LAST OF SEVERAL OCCURRENCES COLUMN 17 PEAK WIND IN M.P.H. PRELIMINARY LOCAL CLIMATOLOGICAL DATA (WS FORM: F-6), PAGE 2 STATION: FRESNO MONTH: MAY YEAR: 2008 LATITUDE: N LONGITUDE: W [TEMPERATURE DATA] [PRECIPITATION DATA] SYMBOLS USED IN COLUMN 16 AVERAGE MONTHLY: 70.3 TOTAL FOR MONTH: = FOG OR MIST DPTR FM NORMAL: 1.5 DPTR FM NORMAL: = FOG REDUCING VISIBILITY HIGHEST: 103 ON 19,18 GRTST 24HR 0.17 ON TO 1/4 MILE OR LESS LOWEST: 45 ON 1 3 = THUNDER SNOW, ICE PELLETS, HAIL 4 = ICE PELLETS TOTAL MONTH: 0.0 INCH 5 = HAIL GRTST 24HR = FREEZING RAIN OR DRIZZLE GRTST DEPTH: 0 7 = DUSTSTORM OR SANDSTORM: VSBY 1/2 MILE OR LESS 8 = SMOKE OR HAZE [NO. OF DAYS WITH] [WEATHER - DAYS WITH] 9 = BLOWING SNOW X = TORNADO MAX 32 OR BELOW: INCH OR MORE: 4 MAX 90 OR ABOVE: INCH OR MORE: 1 MIN 32 OR BELOW: INCH OR MORE: 0 MIN 0 OR BELOW: INCH OR MORE: 0 [HDD (BASE 65) ] TOTAL THIS MO. 20 CLEAR (SCALE 0-3) 19 DPTR FM NORMAL -17 PTCLDY (SCALE 4-7) 9 TOTAL FM JUL CLOUDY (SCALE 8-10) 3 DPTR FM NORMAL -197 [CDD (BASE 65) ] TOTAL THIS MO. 192 DPTR FM NORMAL 22 [PRESSURE DATA] TOTAL FM JAN HIGHEST SLP ON 29 DPTR FM NORMAL 33 LOWEST SLP ON 22 [REMARKS] #FINAL-05-08# A-54 SJVUAPCD
86 Bakersfield, CA - May 2008 CXUS56 KHNX CF6BFL PRELIMINARY LOCAL CLIMATOLOGICAL DATA (WS FORM: F-6) STATION: BAKERSFIELD MONTH: MAY YEAR: 2008 LATITUDE: N LONGITUDE: W TEMPERATURE IN F: :PCPN: SNOW: WIND :SUNSHINE: SKY :PK WND ================================================================================ A 6B AVG MX 2MIN DY MAX MIN AVG DEP HDD CDD WTR SNW DPTH SPD SPD DIR MIN PSBL S-S WX SPD DR ================================================================================ M M M M M M M M M M M M M M M M M M M M M M M M M M M M M M M M M M M M M M M M M M M M 0 8 M M M M M M T M M T M M M M M M M M M M M M ================================================================================ SM M 30 ================================================================================ AV FASTST PSBL % 1 MAX(MPH) MISC ----> # # A-55 SJVUAPCD
87 ================================================================================ NOTES: # LAST OF SEVERAL OCCURRENCES COLUMN 17 PEAK WIND IN M.P.H. PRELIMINARY LOCAL CLIMATOLOGICAL DATA (WS FORM: F-6), PAGE 2 STATION: BAKERSFIELD MONTH: MAY YEAR: 2008 LATITUDE: N LONGITUDE: W [TEMPERATURE DATA] [PRECIPITATION DATA] SYMBOLS USED IN COLUMN 16 AVERAGE MONTHLY: 70.7 TOTAL FOR MONTH: = FOG OR MIST DPTR FM NORMAL: 0.4 DPTR FM NORMAL: = FOG REDUCING VISIBILITY HIGHEST: 103 ON 16 GRTST 24HR 0.08 ON TO 1/4 MILE OR LESS LOWEST: 48 ON 1 3 = THUNDER SNOW, ICE PELLETS, HAIL 4 = ICE PELLETS TOTAL MONTH: 0.0 INCH 5 = HAIL GRTST 24HR = FREEZING RAIN OR DRIZZLE GRTST DEPTH: 0 7 = DUSTSTORM OR SANDSTORM: VSBY 1/2 MILE OR LESS 8 = SMOKE OR HAZE [NO. OF DAYS WITH] [WEATHER - DAYS WITH] 9 = BLOWING SNOW X = TORNADO MAX 32 OR BELOW: INCH OR MORE: 1 MAX 90 OR ABOVE: INCH OR MORE: 0 MIN 32 OR BELOW: INCH OR MORE: 0 MIN 0 OR BELOW: INCH OR MORE: 0 [HDD (BASE 65) ] TOTAL THIS MO. 18 CLEAR (SCALE 0-3) 26 DPTR FM NORMAL -13 PTCLDY (SCALE 4-7) 4 TOTAL FM JUL CLOUDY (SCALE 8-10) 1 DPTR FM NORMAL -48 [CDD (BASE 65) ] TOTAL THIS MO. 203 DPTR FM NORMAL -2 [PRESSURE DATA] TOTAL FM JAN HIGHEST SLP ON 29 DPTR FM NORMAL 3 LOWEST SLP ON 23 [REMARKS] #FINAL-05-08# A-56 SJVUAPCD
88 A.13 May 20, 2002 High Wind Documentation May 19 and 20, 2002 Episode Synoptic Discussion (12/31/2002) May 19, 2002 A wind blown dust event occurred across parts of the central and southern San Joaquin Valley on May 19, At McFarland, a 24-hour PM 10 (Particulate Matter) concentration of 407 μg/m 3 was measured. The McFarland measurement was taken 8AM to 8AM daily, whereas all other sites are measured midnight to midnight daily. Table 1 outlines the Peak and Daily Average Particulate Matter Measurements at McFarland, Corcoran, Clovis, and Fresno-1 st. In order to understand the variability of these measurements, an in depth examination of the synoptic pattern and surface winds and observations, aircraft soundings, pibal (balloon) wind measurement, and lower air profiler measurements leading to the episode were analyzed. TABLE 1: Peak and Daily Average Particulate Matter Measurements for sites across the SJV for May 19, 2002 PM 10-Teom PM 10-BAM PM 2.5-BAM Site Name Peak 24-Avg. Peak 24-Avg. Peak 24-Avg. McFarland * 407 # * * * * Corcoran Clovis * * * * Fresno-1st * * * * 8 4 *-N/A units in μg/m 3 The meteorological synoptic analysis showed that an unseasonably, deep trough developed across the eastern Pacific, the morning of the 19 th. The trough slowly pushed southeastward across California during the afternoon hours. The morning surface charts depicted a surface high pressure ridge draped across central California to Reno, with a thermal low near Las Vegas. The 12Z surface pressure gradient was +9.4 millibars from San Francisco (SFO) to Las Vegas (LAS). A +9.4 millibars pressure gradient means onshore or down-valley flow, which results in strong northwesterly winds across the San Joaquin Valley. A developing cold front curved southward into the eastern Pacific from a moderate low 600 NM west of Eureka. The morning temperature soundings over Fresno showed an isothermal (slightly stable) layer up to 4,000 feet. At Bakersfield the temperature sounding showed a similar isothermal layer up to 3,000 feet. The morning pibal wind measurement from Fresno, depicted strong northwesterly flow decoupled from the surface at 37 knots at 1,000 feet continuing northwesterly up to 4,000 feet, then shifting westerly up to 5,000 feet, and then backing southerly above 5,000 feet. A-57 SJVUAPCD
89 Upper level charts indicated a strong low 750 NM west of Eureka, with a trough digging southward across the eastern Pacific. A strong temperature gradient (packing) at 850 MB and an intense upper level (300 MB) jet were evident across northwestern California on the 12Z analysis maps. The strong temperature gradient aloft, along with an intense upper level jet, manifested the surface pressure gradient, resulting in strong to gusty winds measured at several hourly-surface meteorological monitoring sites and aloft at the Visalia and Lost Hills lower air profiler sites. Table 2 shows the 24 hour daily average wind speeds at SJVAPCD air monitoring, ASOS, and CIMIS sites for May 19, Table 2: 24 hour average wind speeds at SJVAPCD air monitoring, ASOS, and CIMIS sites for May 19, SJVAPCD Air Monitor ASOS CIMIS WS WS WS WS mph mph mph mph BFLD-Gold 6.8 BFLD Meadows 11.6 FivePoints 11.2 Famoso 5.2 Clovis 7.5 Fresno YI 9.4 Shafter/USDA 6.3 Orange Cove 5.5 Fresno SSP 4.4 Hanford 9 Firebaugh/Telles 5.9 Madera 7.2 Madera Pump 7.5 Madera-AP 10.2 Stratford 7.5 Belridge 6.8 Maricopa 9.2 Merced-AP 8.7 Kettleman 5.2 Merced 4.4 Merced-Coffee 6.2 Modesto-AP 6.7 Visalia/Americas 5.1 Patterson 6.8 Parlier 8.4 Stockton-AP 6.6 Parlier 6.6 Lodi West 2.2 Tracy 9.0 Blackwells Corner 14 Tracy 7.3 Turlock 4.8 Los Banos 8.6 Porterville 4.9 Visalia LAP 6.8 Manteca 4.6 Lost Hills 9.1 Modesto 6.4 Delano 6.1 Fresno State 6.7 Westlands 8.1 Lindcove 3.9 Panoche 6.8 Kesterson 6.1 Arvin-Edison 6.1 Lower air profiler data from Visalia and Lost Hills showed that with solar insulation (heating) the stable isothermal layer present in the morning began to mix out by PDT (18Z-19Z), resulting in strong winds aloft mixing to the surface (Figure 1 and 2). The ASOS hourly observations showed northwesterly flow across the San Joaquin Valley (down-valley). At Bakersfield, Hanford, and Lemoore, winds were light and variable in the morning. As the strong temperature gradient aloft and upper level jet began to nose into the region, combined with the strong surface gradient and afternoon heating, gusty northwesterly winds developed across the southern San Joaquin Valley during the afternoon; with Hanford ASOS reporting winds at 10.4 mph gusting to 20 mph and Lemoore with winds at 12.7 mph gusting to 23 mph at the 13:55 PDT observation. Reduced visibilities of 5 miles were later noted at Hanford around 16:53 PDT when winds were at 17.3 mph gusting to 26.5 mph. Gusty winds continued into the early evening hours and began diminishing after 21:00 PDT. TEOM and BAM hourly measurements, at Corcoran immediately showed the diminishing wind speeds, by measurements lowering to 20 μg/m 3. A-58 SJVUAPCD


90 Figure 1: Visalia Lower Air Profiler image for May 19-May 20 th, Figure 2: Lost Hill Lower Air Profiler Image for May 19-May 20 th, 2002 A-59 SJVUAPCD
Natural Event Documentation
 ADDENDUM Natural Event Documentation Corcoran, Oildale and Bakersfield, California September 22, 2006 San Joaquin Valley Unified Air Pollution Control District May 23, 2007 Natural Event Documentation
SAN JOAQUIN VALLEY AIRSHED
 SAN JOAQUIN VALLEY AIRSHED INTRODUCTION This chapter describes the naturally occurring determinants of air quality in the San Joaquin Valley Air Basin (SJVAB) relative to PM10. There are numerous factors
Issued by: National Weather Service San Joaquin Valley - Hanford CA. Issue time: 409 AM PST Wed Jan
 Forecast Information Location: New_Exchequer_Dam Updated: January 16, 2019, 11:45 am NWS Weather Discussion: Issued by: National Weather Service San Joaquin Valley - Hanford CA Issue time: 409 AM PST Wed
Natural Event Documentation
 Natural Event Documentation Corcoran and Bakersfield, California December 8, 2006 San Joaquin Valley Unified Air Pollution Control District June 6, 2007 Natural Event Documentation San Joaquin Valley Unified
National Wildland Significant Fire Potential Outlook
 National Wildland Significant Fire Potential Outlook National Interagency Fire Center Predictive Services Issued: September, 2007 Wildland Fire Outlook September through December 2007 Significant fire
DEPARTMENT OF EARTH & CLIMATE SCIENCES Name SAN FRANCISCO STATE UNIVERSITY Nov 29, ERTH 360 Test #2 200 pts
 DEPARTMENT OF EARTH & CLIMATE SCIENCES Name SAN FRANCISCO STATE UNIVERSITY Nov 29, 2018 ERTH 360 Test #2 200 pts Each question is worth 4 points. Indicate your BEST CHOICE for each question on the Scantron
Central Ohio Air Quality End of Season Report. 111 Liberty Street, Suite 100 Columbus, OH Mid-Ohio Regional Planning Commission
 217 218 Central Ohio Air Quality End of Season Report 111 Liberty Street, Suite 1 9189-2834 1 Highest AQI Days 122 Nov. 217 Oct. 218 July 13 Columbus- Maple Canyon Dr. 11 July 14 London 11 May 25 New Albany
Arizona Department of Environmental Quality Air Quality Division Air Assessment Section March 17, 2005
 Assessment of Qualification for Treatment Under the Arizona Natural and Exceptional Events Policy for the High Particulates (PM 10 ) Concentration Event in the Buckeye Area on September 18, 2004 Arizona
Colorado Front Range Wildfires Situation Report #7 Monday, July 02, :15 AM (MDT)
") Colorado Front Range Wildfires Situation Report #7 Monday, July 02, 2012 10:15 AM (MDT) Mandatory evacuations for the Waldo Canyon fire have been reduced from 35,000 to 3,000. Remaining evacuations are
Colorado Front Range Wildfires Situation Report #7 Monday, July 02, 2012 10:15 AM (MDT) Mandatory evacuations for the Waldo Canyon fire have been reduced from 35,000 to 3,000. Remaining evacuations are
MULTI-AGENCY COORDINATION SYSTEM PUBLICATION CALIFORNIA FIRE WEATHER PROGRAM RISK PREPAREDNESS GUIDE MACS 410-3
 MULTI-AGENCY COORDINATION SYSTEM PUBLICATION CALIFORNIA FIRE WEATHER PROGRAM RISK PREPAREDNESS GUIDE MACS 410-3 August 26, 2013 California Fire Weather Program Risk Preparedness Guide Table of Contents
Addendum to the. Submitted to U.S. EPA Region 9 March 17, Prepared by:
 Addendum to the Exceptional Events Demonstration for 2015 Ozone Exceedance in Washoe County from the 2015 California Wildfires August 21, 2015 Submitted to U.S. EPA Region 9 March 17, 2017 Prepared by:
Arizona Climate Summary May 2012
 Arizona Climate Summary May 2012 Summary of conditions for April 2012 April 2012 Temperature and Precipitation Summary April 1 st 16 th : Although April began with another low pressure system sweeping
DEPARTMENT OF EARTH & CLIMATE SCIENCES SAN FRANCISCO STATE UNIVERSITY. Metr Fall 2014 Test #1 September 30, 2014
 DEPARTMENT OF EARTH & CLIMATE SCIENCES SAN FRANCISCO STATE UNIVERSITY NAME Metr 302.02 Fall 2014 Test #1 September 30, 2014 200 pts (4 pts each answer) Part I. Surface Chart Interpretation. Questions 1
2007 Area Source Emissions Inventory Methodology 670 RANGE IMPROVEMENT
 San Joaquin Valley AIR POLLUTION CONTROL DISTRICT 2007 Area Source Emissions Inventory Methodology 670 RANGE IMPROVEMENT I. Purpose This document describes the Area Source Methodology used to estimate
Weather History on the Bishop Paiute Reservation
 Weather History on the Bishop Paiute Reservation -211 For additional information contact Toni Richards, Air Quality Specialist 76 873 784 toni.richards@bishoppaiute.org Updated 2//214 3:14 PM Weather History
CASE STUDY OF THE NOVEMBER WINDSTORM IN SOUTH CENTRAL COLORADO
 32 CASE STUDY OF THE 12-13 NOVEMBER WINDSTORM IN SOUTH CENTRAL COLORADO Paul Wolyn * NOAA/NWS Pueblo, CO 1. INTRODUCTION During the evening and early morning of 12-13 November 2011, a damaging downslope
Arizona Climate Summary February 2012
 Arizona Climate Summary February 2012 Summary of conditions for January 2012 January 2012 Temperature and Precipitation Summary January 1 st 20 th : The New Year has started on a very dry note. The La
TFS WEATHER BRIEF. Monday, March 25
 TFS WEATHER BRIEF Monday, March 25 Review: The leading edge of cooler and drier air was pushing through Central and East TX this morning. A few lingering thunderstorms were in progress south of I-20 in
2011 National Seasonal Assessment Workshop for the Eastern, Southern, & Southwest Geographic Areas
 2011 National Seasonal Assessment Workshop for the Eastern, Southern, & Southwest Geographic Areas On January 11-13, 2011, wildland fire, weather, and climate met virtually for the ninth annual National
California OES Weather Threat Briefing
 California OES Weather Threat Briefing Wednesday, January 16, 2019 9:00 AM PST Day 1: Strong winds, heavy mountain snow and heavy rain with isolated thunderstorms across much of the state through Thursday
W I N T E R STORM HAZARD DESCRIPTION
 W I N T E R STORM HAZARD DESCRIPTION... 1 LOCATION... 2 EXTENT... 2 HISTORICAL OCCURRENCES... 4 SIGNIFICANT PAST EVENTS... 4 PROBABILITY OF FUTURE EVENTS... 5 VULNERABILITY AND IMPACT... 5 HAZARD DESCRIPTION
PUBLIC SAFETY POWER SHUTOFF POLICIES AND PROCEDURES
 PACIFIC GAS AND ELECTRIC COMPANY PUBLIC SAFETY POWER SHUTOFF POLICIES AND PROCEDURES SEPTEMBER 2018 1 PACIFIC GAS AND ELECTRIC COMPANY PUBLIC SAFETY POWER SHUTOFF POLICIES AND PROCEDURES SEPTEMBER 2018
J4.2 ASSESSMENT OF PM TRANSPORT PATTERNS USING ADVANCED CLUSTERING METHODS AND SIMULATIONS AROUND THE SAN FRANCISCO BAY AREA, CA 3.
 J4.2 ASSESSMENT OF PM TRANSPORT PATTERNS USING ADVANCED CLUSTERING METHODS AND SIMULATIONS AROUND THE SAN FRANCISCO BAY AREA, CA Scott Beaver 1*, Ahmet Palazoglu 2, Angadh Singh 2, and Saffet Tanrikulu
National Wildland Significant Fire Potential Outlook
 National Wildland Significant Fire Potential Outlook National Interagency Fire Center Predictive Services Issued: April 1, 2008 Next Issue: May 1, 2008 Wildland Fire Outlook April 2008 through July 2008
Page 1. Name:
 Name: 1) As the difference between the dewpoint temperature and the air temperature decreases, the probability of precipitation increases remains the same decreases 2) Which statement best explains why
Weekly Weather Briefing. NWS Albuquerque. Severe Threat Central & East through Tonight, then Drying. NWS Albuquerque September 29, 2014
 Severe Threat Central & East through Tonight, then Drying September 29, 2014 Today s Max Temp Departure from Normal Notable Severe Weather Events in September* September 30, 1998 Los Lunas: 4.5 Hail*
The hydrologic service area (HSA) for this office covers Central Kentucky and South Central Indiana.
 for this office covers Central Kentucky and South Central Indiana.") January 2012 February 13, 2012 An X inside this box indicates that no flooding occurred within this hydrologic service area. January 2012 continued the string of wet months this winter. Rainfall was generally
January 2012 February 13, 2012 An X inside this box indicates that no flooding occurred within this hydrologic service area. January 2012 continued the string of wet months this winter. Rainfall was generally
Weather and Climate of the Rogue Valley By Gregory V. Jones, Ph.D., Southern Oregon University
 Weather and Climate of the Rogue Valley By Gregory V. Jones, Ph.D., Southern Oregon University The Rogue Valley region is one of many intermountain valley areas along the west coast of the United States.
Comparison of Particulate Monitoring Methods at Fort Air Partnership Monitoring Stations
 Comparison of Particulate Monitoring Methods at Fort Air Partnership Monitoring Stations Melanie Larsen Harry Benders RS Environmental (Tom Dann) March 13, 2014 Executive Summary Historically FAP has acquired
Arizona Climate Summary February 2016 Summary of conditions for January 2016
 January 2016 Temperature and Precipitation Summary Arizona Climate Summary February 2016 Summary of conditions for January 2016 January 1 st 14 th : The new year began with high pressure over the southwest
Arizona Climate Summary March 2013
 Arizona Climate Summary March 2013 Summary of conditions for February 2013 February 2013 Temperature and Precipitation Summary February 1 st 16 th : February began with a ridge of high pressure over the
APPENDIX V VALLEYWIDE REPORT
 APPENDIX V VALLEYWIDE REPORT Page Intentionally Left Blank 1.2 San Joaquin Valley Profile Geography The San Joaquin Valley is the southern portion of the Great Central Valley of California (Exhibit 1-1).
The Climate of Payne County
 The Climate of Payne County Payne County is part of the Central Great Plains in the west, encompassing some of the best agricultural land in Oklahoma. Payne County is also part of the Crosstimbers in the
Technical Support Document For the Alamosa Exceptional Events Occurring on April 8, 2013, April 23, 2013, May 1, 2013 and May 31, 2013
 Technical Support Document For the Alamosa Exceptional Events Occurring on April 8, 2013, April 23, 2013, May 1, 2013 and May 31, 2013 Prepared by the Technical Services Program Air Pollution Control Division
HAZARD DESCRIPTION... 1 LOCATION... 1 EXTENT... 1 HISTORICAL OCCURRENCES...
 WINTER STORM HAZARD DESCRIPTION... 1 LOCATION... 1 EXTENT... 1 HISTORICAL OCCURRENCES... 3 SIGNIFICANT PAST EVENTS... 4 PROBABILITY OF FUTURE EVENTS... 5 VULNERABILITY AND IMPACT... 5 Hazard Description
Weather Practice. 4. As wind velocity decreases, the distance between isobars on a weather map will A) decrease B) increase C) remain the same
 decrease B) increase C) remain the same") 1. The chart below shows the air temperature and the dewpoint temperature near the ground at a given location for four consecutive days. All temperatures were recorded at noon. Which statement is best
1. The chart below shows the air temperature and the dewpoint temperature near the ground at a given location for four consecutive days. All temperatures were recorded at noon. Which statement is best
Arizona Climate Summary
 Arizona Climate Summary June 2012 Summary of conditions for May 2012 May 2012 Temperature and Precipitation Summary May 1 st 16 th : May began with a surface cold front sweeping across the western states
An upper to mid level circulation (Low) in the NW Caribbean is
 in the NW Caribbean is") WEEKLY WEATHER OUTLOOK BELIZE, CENTRAL AMERICA PERIOD: Monday-Monday, Oct. 1 October 8, 2012 DATE ISSUED: Monday, Oct 1, 2012 6:00 am RFrutos EcoSolutions & Services SYNOPSIS: An upper to mid level circulation
WEEKLY WEATHER OUTLOOK BELIZE, CENTRAL AMERICA PERIOD: Monday-Monday, Oct. 1 October 8, 2012 DATE ISSUED: Monday, Oct 1, 2012 6:00 am RFrutos EcoSolutions & Services SYNOPSIS: An upper to mid level circulation
NIDIS Intermountain West Drought Early Warning System February 12, 2019
 NIDIS Intermountain West Drought Early Warning System February 12, 2019 Precipitation The images above use daily precipitation statistics from NWS COOP, CoCoRaHS, and CoAgMet stations. From top to bottom,
INSURANCE CLAIMS PAST WEATHER INVESTIGATION
 INSURANCE CLAIMS PAST WEATHER INVESTIGATION Prepared For: John Smith ABC Insurance Company RE: Claim No.: 123456 Bryn Mawr, PA Prepared By: Your Weather Experts (800) 427-3456 PO Box 7100 Hackettstown,
WINTER STORM Annex II
 WINTER STORM Annex II I. PURPOSE A. This annex has been prepared to ensure a coordinated response by state agencies to requests from local jurisdictions to reduce potential loss of life and to ensure essential
The Climate of Bryan County
 The Climate of Bryan County Bryan County is part of the Crosstimbers throughout most of the county. The extreme eastern portions of Bryan County are part of the Cypress Swamp and Forest. Average annual
Using Temperature and Dew Point to Aid Forecasting Springtime Radiational Frost and/or Freezing Temperatures in the NWS La Crosse Service Area
 Using Temperature and Dew Point to Aid Forecasting Springtime Radiational Frost and/or Freezing Temperatures in the NWS La Crosse Service Area WFO La Crosse Climatology Series #21 The formation of radiational
MPERIAL COUNTY AIR POLLUTION CONTROL DISTRICT
 MPERIAL COUNTY AIR POLLUTION CONTROL DISTRICT PHOTO COURTESY OF NASA NASA LANDSAT-5 (LDCM) satellite picture April 15, 2013 and April 16, 2013 Exceptional Event Documentation For the Imperial County PM
Office of the Washington State Climatologist
 Office of the Washington State Climatologist October 2017 Report and Outlook October 5, 2017 http://www.climate.washington.edu/ September Event Summary Average September temperatures were above normal
IWT Scenario 1 Integrated Warning Team Workshop National Weather Service Albany, NY October 31, 2014
 Integrated Warning Team Workshop National Weather Service Albany, NY October 31, 2014 23 24 25 26 27 Scenario 1 Timeline November 23-27 Sun Mon Tue Wed Thu Thanksgiving Day Sunday, Nov. 23 @ 430 pm NWS
The number of events satisfying the heat wave definition criteria varies widely
 1 III. Discussion of Results A. Event Identification The number of events satisfying the heat wave definition criteria varies widely between stations. For the unfiltered data following the definition requiring
Fort Lewis, Washington (47 05'N, 'W)
") Fort Lewis, Washington (47 05'N, 122 35'W) Full Year Climatology CONVENTIONS: The spelling of place names and geographical features are those used by the National Imagery and Mapping Agency (NIMA). All
Fort Lewis, Washington (47 05'N, 122 35'W) Full Year Climatology CONVENTIONS: The spelling of place names and geographical features are those used by the National Imagery and Mapping Agency (NIMA). All
1. Which weather map symbol is associated with extremely low air pressure? A) B) C) D) 2. The diagram below represents a weather instrument.
 B) C) D) 2. The diagram below represents a weather instrument.") 1. Which weather map symbol is associated with extremely low air pressure? 2. The diagram below represents a weather instrument. Which weather variable was this instrument designed to measure? A) air pressure
1. Which weather map symbol is associated with extremely low air pressure? 2. The diagram below represents a weather instrument. Which weather variable was this instrument designed to measure? A) air pressure
IMPERIAL COUNTY AIR POLLUTION CONTROL DISTRICT. September 25, 2013 Exceptional Event Documentation For the Imperial County PM 10 Nonattainment Area
 IMPERIAL COUNTY AIR POLLUTION CONTROL DISTRICT September 25, 2013 Exceptional Event Documentation For the Imperial County PM 10 Nonattainment Area DRAFT FINAL REPORT November 9, 2015 Table of Contents
4. Which map best represents the type of fronts and direction of movement of these fronts in relation to the low-pressure center?
 1. Adjacent water and landmasses are heated by the morning Sun on a clear, calm day. After a few hours, a surface wind develops. Which map best represents this wind's direction? 2. An air pressure of 29.47
Appendix A Public Notification that a potential event was occurring (40 CFR 50.14(c)(1)(i))
(1)(i))") Public Notification that a potential event was occurring (40 CFR 50.14(c)(1)(i)) FIGURE A-1 National Weather Service Public Zones Fig. A-1: Illustrates the public zones that are serviced by the National
Public Notification that a potential event was occurring (40 CFR 50.14(c)(1)(i)) FIGURE A-1 National Weather Service Public Zones Fig. A-1: Illustrates the public zones that are serviced by the National
The Climate of Texas County
 The Climate of Texas County Texas County is part of the Western High Plains in the north and west and the Southwestern Tablelands in the east. The Western High Plains are characterized by abundant cropland
End of Ozone Season Report
 End of Ozone Season Report Central Ohio: April 1 through October 31, 2016 The Mid-Ohio Regional Planning Commission (MORPC) is part of a network of agencies across the country that issues daily air quality
California 120 Day Precipitation Outlook Issued Tom Dunklee Global Climate Center
 California 120 Day Precipitation Outlook Issued 11-01-2008 Tom Dunklee Global Climate Center This is my second updated outlook for precipitation patterns and amounts for the next 4 s of the current rainy
UPDATE OF REGIONAL WEATHER AND SMOKE HAZE (February 2018)
") UPDATE OF REGIONAL WEATHER AND SMOKE HAZE (February 2018) 1. Review of Regional Weather Conditions for January 2018 1.1 The prevailing Northeast monsoon conditions over Southeast Asia strengthened in January
UPDATE OF REGIONAL WEATHER AND SMOKE HAZE (February 2018) 1. Review of Regional Weather Conditions for January 2018 1.1 The prevailing Northeast monsoon conditions over Southeast Asia strengthened in January
Technical Support Document For the April 3, 2011, Alamosa and Lamar Exceptional Event
 Technical Support Document For the April 3, 2011, Alamosa and Lamar Exceptional Event Prepared by the Technical Services Program Air Pollution Control Division Colorado Department of Public Health and
MPCA Forecasting Summary 2010
 MPCA Forecasting Summary 2010 Jessica Johnson, Patrick Zahn, Natalie Shell Sonoma Technology, Inc. Petaluma, CA Presented to Minnesota Pollution Control Agency St. Paul, MN June 3, 2010 aq-ppt2-01 907021-3880
Arizona Climate Summary April 2018 Summary of conditions for March 2018
 Arizona Climate Summary April 2018 Summary of conditions for March 2018 March 2018 Temperature and Precipitation Summary March 1 st 16 th : March began with rainfall in southeastern Arizona as the tail
The Climate of Marshall County
 The Climate of Marshall County Marshall County is part of the Crosstimbers. This region is a transition region from the Central Great Plains to the more irregular terrain of southeastern Oklahoma. Average
Arizona Climate Summary September 2014 Summary of conditions for August 2014
 Arizona Climate Summary September 2014 Summary of conditions for August 2014 August 2014 Temperature and Precipitation Summary August 1 st 16 th : The first 5 days of August were quite wet with high pressure
The Climate of Kiowa County
 The Climate of Kiowa County Kiowa County is part of the Central Great Plains, encompassing some of the best agricultural land in Oklahoma. Average annual precipitation ranges from about 24 inches in northwestern
Arizona Climate Summary May 2018 Summary of conditions for April 2018
 April 2018 Temperature and Precipitation Summary Arizona Climate Summary May 2018 Summary of conditions for April 2018 April 1 st 16 th : April was a very dry month across Arizona. Several low pressure
The Climate of Grady County
 The Climate of Grady County Grady County is part of the Central Great Plains, encompassing some of the best agricultural land in Oklahoma. Average annual precipitation ranges from about 33 inches in northern
Tropical Update. 5 PM EDT Tuesday, September 5, 2017 Hurricane Irma, Tropical Storm Jose, and Tropical Depression Thirteen
 Tropical Update 5 PM EDT Tuesday, September 5, 2017 Hurricane Irma, Tropical Storm Jose, and Tropical Depression Thirteen This update is intended for government and emergency response officials, and is
Elements of the National Weather Service Fire Weather Forecast By Casey Sullivan, National Weather Service, Chicago
 Elements of the National Weather Service Fire Weather Forecast By Casey Sullivan, National Weather Service, Chicago Today s Presentation Begins at 12 pm CST, 1 pm EST Please Take Our One Question Survey
The Climate of Murray County
 The Climate of Murray County Murray County is part of the Crosstimbers. This region is a transition between prairies and the mountains of southeastern Oklahoma. Average annual precipitation ranges from
ATMOSPHERIC CIRCULATION AND WIND
 ATMOSPHERIC CIRCULATION AND WIND The source of water for precipitation is the moisture laden air masses that circulate through the atmosphere. Atmospheric circulation is affected by the location on the
Arizona Climate Summary May 2013
 Arizona Climate Summary May 2013 Summary of conditions for April 2013 April 2013 Temperature and Precipitation Summary April 1 st 16 th : The first week of April featured a ridge of high pressure over
Storm Summary for Hurricane Joaquin
 Storm Summary for Hurricane Joaquin Wednesday, September 30, 2015 at 5 PM EDT (Output from Hurrevac, based on National Hurricane Center Forecast Advisory #12) Joaquin is currently a Category 1 hurricane
Custom Weather Forecast
 1 of 23 Custom Weather Forecast 2018 Chicago Yacht Club s Race To Mackinac- Cruising Division Disclaimer: The user assumes all risk related to the use of this Custom Weather Forecast. The crew of the participating
Weather and Climate Summary and Forecast January 2018 Report
 Weather and Climate Summary and Forecast January 2018 Report Gregory V. Jones Linfield College January 5, 2018 Summary: A persistent ridge of high pressure over the west in December produced strong inversions
SAMPLE. SITE SPECIFIC WEATHER ANALYSIS Wind Report. Robinson, Smith & Walsh. John Smith REFERENCE:
 SAMPLE SITE SPECIFIC WEATHER ANALYSIS Wind Report PREPARED FOR: Robinson, Smith & Walsh John Smith REFERENCE: JACK HIGGINS / 4151559-01 CompuWeather Sample Report Please note that this report contains
CropCast Corn and Soybean Report Kenny Miller Tuesday, March 14, 2017
 Accumulated Rainfall (inches) Accumulated GDDs Temperature ( F)/Wind Speed (mph) Precipitation (inches) CropCast Corn and Soybean Report Kenny Miller Tuesday, March 14, 2017 Peoria, IL Regional Forecast
Spring Water Supply and Weather Outlook How about that near Miracle March?
 Spring Water Supply and Weather Outlook How about that near Miracle March? tim.bardsley@noaa.gov NWS Reno 4.10.18 1 Out the Window March and early April have been Boom not Bust Key Points Up Front Wet
Arizona Climate Summary
 August 2015 Temperature and Precipitation Summary Arizona Climate Summary September 2015 Summary of conditions for August 2015 August 1 st 16 th : August was a wet month across the state with only 3 days
Arizona Climate Summary October 2013
 Arizona Climate Summary October 2013 Summary of conditions for September 2013 September 2013 Temperature and Precipitation Summary September 1 st 16 th : With moist conditions still present throughout
Climate Outlook through 2100 South Florida Ecological Services Office Vero Beach, FL January 13, 2015
 Climate Outlook through 2100 South Florida Ecological Services Office Vero Beach, FL January 13, 2015 Short Term Drought Map: Short-term (
A Prepared Marylander Creates a Resilient Maryland
 Maryland Emergency Management Agency Operations Directorate Hazardous Winter Weather Outlook Briefing March 5, 2013 0800 A Prepared Marylander Creates a Resilient Maryland A strong low pressure will track
CropCast Corn and Soybean Report Kenny Miller Friday, March 17, 2017
 Accumulated Rainfall (inches) Accumulated GDDs Temperature ( F)/Wind Speed (mph) Precipitation (inches) CropCast Corn and Soybean Report Kenny Miller Friday, March 17, 2017 Peoria, IL Regional Forecast
Arizona Climate Summary April 2013
 Arizona Climate Summary April 2013 Summary of conditions for March 2013 March 2013 Temperature and Precipitation Summary March 1 st 16 th : March began as a ridge of high pressure progressed across the
GC Briefing. Weather Sentinel Hurricane Florence. Status at 5 PM EDT (21 UTC) Today (NHC) Discussion. September 13, 2018
 Today (NHC) Discussion. September 13, 2018") GC Briefing September 13, 2018 Weather Sentinel Hurricane Florence Tropical storm conditions have been reported for areas of North Carolina and will continue to spread inland to the west and south. Hurricane
GC Briefing September 13, 2018 Weather Sentinel Hurricane Florence Tropical storm conditions have been reported for areas of North Carolina and will continue to spread inland to the west and south. Hurricane
Inflow and Outflow through the Sea-to-Sky Corridor in February 2010: Lessons Learned from SNOW-V10 *
 Inflow and Outflow through the Sea-to-Sky Corridor in February 2010: Lessons Learned from SNOW-V10 * Ruping Mo National Laboratory for Coastal and Mountain Meteorology, Environment Canada, Vancouver, BC,
Severe Weather Watches, Advisories & Warnings
 Severe Weather Watches, Advisories & Warnings Tornado Watch Issued by the Storm Prediction Center when conditions are favorable for the development of severe thunderstorms and tornadoes over a larger-scale
The Pennsylvania Observer
 The Pennsylvania Observer January 5, 2009 December 2008 Pennsylvania Weather Recap The final month of 2008 was much wetter than average and a bit colder than normal. In spite of this combination, most
Who is polluting the Columbia River Gorge?
 Who is polluting the Columbia River Gorge? Final report to the Yakima Nation Prepared by: Dan Jaffe, Ph.D Northwest Air Quality, Inc. 7746 Ravenna Avenue NE Seattle WA 98115 NW_airquality@hotmail.com December
Climates of NYS. Definitions. Climate Regions of NYS. Storm Tracks. Climate Controls 10/13/2011. Characteristics of NYS s Climates
 Definitions Climates of NYS Prof. Anthony Grande 2011 Weather and Climate Weather the state of the atmosphere at one point in time. The elements of weather are temperature, air pressure, wind and moisture.
Arizona Climate Summary
 Arizona Climate Summary April 2014 Summary of conditions for March 2014 March 2014 Temperature and Precipitation Summary March 1 st 16 th : We started off the month of March with a significant precipitation
DEPARTMENT OF GEOSCIENCES SAN FRANCISCO STATE UNIVERSITY. Metr Fall 2012 Test #1 200 pts. Part I. Surface Chart Interpretation.
 DEPARTMENT OF GEOSCIENCES SAN FRANCISCO STATE UNIVERSITY NAME Metr 356.01 Fall 2012 Test #1 200 pts Part I. Surface Chart Interpretation. Figure 1. Surface Chart for 1500Z 7 September 2007 1 1. Pressure
Arizona Climate Summary June 2013
 Arizona Climate Summary June 2013 Summary of conditions for May 2013 May 2013 Temperature and Precipitation Summary May 1 st 16 th : May began with above normal daily temperatures and breezy conditions
Potentially Wet Wed-Fri
 Potentially Wet Wed-Fri August 18, 2014 Last Week s Lightning Trends TUE 8/12 WED 8/13 THU 8/14 FRI 8/15 t SAT 8/16 SUN 8/17 August 1-16 Precipitation Anomaly: 2013 VS. 2014 AUG 1-16, 2013 AUG 1-16, 2014
The Climate of Haskell County
 The Climate of Haskell County Haskell County is part of the Hardwood Forest. The Hardwood Forest is characterized by its irregular landscape and the largest lake in Oklahoma, Lake Eufaula. Average annual
WEATHER SYSTEMS IMPACTING THE CAYMAN ISLANDS Prepared by the staff of the Cayman Islands National Weather Service
 WEATHER SYSTEMS IMPACTING THE CAYMAN ISLANDS 2008 Prepared by the staff of the Cayman Islands National Weather Service TROPICAL STORM DOLLY Formed 194 miles west of Grand Cayman July 19 th. The tropical
Preliminary Conceptual Model Development
 Preliminary Conceptual Model Development Develop preliminary conceptual models regarding the sources of haze at every Class I area in the WRAP region Site-specific summaries of the descriptive material
Baton Rouge Climate Summary: July 2014
 Baton Rouge Climate Summary: July 2014 (based on available data as of 07 August 2014) July Weather Highlights: - 2014 s run of cooler-than-normal weather continues - three July cool fronts very uncommon
Arizona Climate Summary
 April 2016 Temperature and Precipitation Summary Arizona Climate Summary May 2016 Summary of conditions for April 2016 April 1 st 15 th : April 1 st saw the tail end of a low pressure system move out of
1.Introduction 2.Relocation Information 3.Tourism 4.Population & Demographics 5.Education 6.Employment & Income 7.City Fees & Taxes 8.
 1.Introduction 2.Relocation Information 3.Tourism 4.Population & Demographics 5.Education 6.Employment & Income 7.City Fees & Taxes 8.Recreation & Activities 9.Climate Data 10.Economic Development History
NIDIS Intermountain West Drought Early Warning System October 17, 2017
 NIDIS Drought and Water Assessment NIDIS Intermountain West Drought Early Warning System October 17, 2017 Precipitation The images above use daily precipitation statistics from NWS COOP, CoCoRaHS, and
NIDIS Intermountain West Drought Early Warning System April 18, 2017
 1 of 11 4/18/2017 3:42 PM Precipitation NIDIS Intermountain West Drought Early Warning System April 18, 2017 The images above use daily precipitation statistics from NWS COOP, CoCoRaHS, and CoAgMet stations.
Weather and Climate Summary and Forecast Winter
 Weather and Climate Summary and Forecast Winter 2016-17 Gregory V. Jones Southern Oregon University February 7, 2017 What a difference from last year at this time. Temperatures in January and February