The purpose of the experiment - demonstration of the possibility for local clouds creation only and not for generation a rain at this stage.
|
|
|
- Linda Stokes
- 5 years ago
- Views:
Transcription

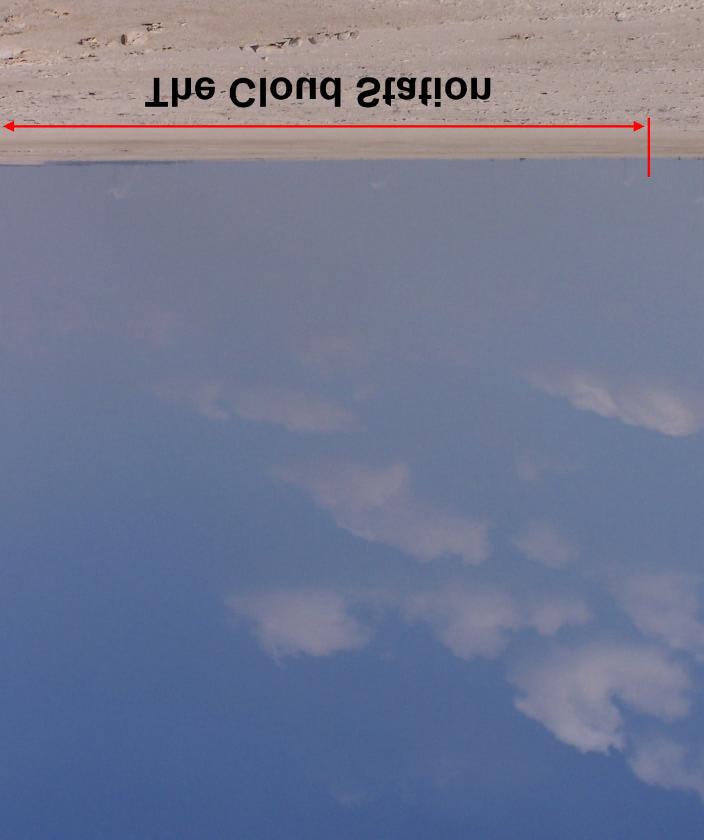
1 THE CLOUD STATION Magnettiic Technollogiiess LLC UAE 2008
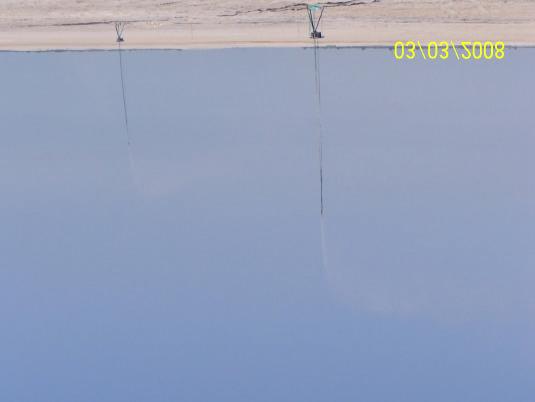
2 The purpose of the experiment - demonstration of the possibility for local clouds creation only and not for generation a rain at this stage. The Place of the experiment realization was on the small island of Aryam, approximately in 30 kms western of Abu Dhabi. The station for generation of local clouds (further referred to as "the station") was constructed during the period June 2007 to January 2008 and in its structure incorporated 12 fountains, 44 water sprays (on the basis of high pressure pumps), the ions generator, 8 water sprays for the ions generator, 12 bore holes, water network (incorporating special magnetic systems), electrical networks, and also a service road. The total area of the station being approximately 1 square kilometer. The demonstration station was purposely reduced in size to 10% of original station size for the reason of budget limitation. The specified structure of station essentially differed from that which was originally envisaged/required, which assumed: 24 fountains, 104 water sprays (on the basis of high pressure pumps), and 5 solar heaters of water (total productivity 1.5 cub m per hour with temperature ºC). Besides, the original outline which as was requested the sites for the Ions generator should been covered with black asphalt. On November 10, 2007 the ion generator began operating in a test mode. With the connection of this ion generator to an above ground electrical distribution network its regular work began. The actual starting date for the commencement of experiments is to be considered as December 15, 2007, when the fountains pumps were finally connected to the electrical network. The closing date of the experiment is April 1, 2008.
3

4

5


6

7

8
9 WORK OF THE STATION S EQUIPMENT DURING THE EXPERIMENT Because of discrepancy between the envisaged electrical equipment: - from 12 fountains down to 6-8 (and without required nozzles); - from 44 water sprays within several days worked 6; - 8 water sprays for the ions generator did not work during all the experiments, as the pump were not connected to the electrical network. Thus, during the initial experiments only a small proportion of the originally designed station s actual potential was utilized with its full capabilities much below that required by our team. It is very important factor for estimate the results of the experiment, particularly in adverse conditions of the atmosphere.
10

11 WAYS OF OBSERVATION Observations in regard to the occurrence of clouds, which were generated, and their further movement, we carried out visually, following formation of clouds by the car. For documenting and observation a camera was used. Besides since January 12 the stationary camera constantly fixed records the actual condition of an atmosphere direct above station. The received photos were compared to the images from radars and space satellites and found to match. Depending on a condition of an atmosphere the first seen results of active station influence were observed at heights of meters, at a distance of approximately kilometers from the station following the direction of air movement. As a rule, it occurred in the sectors limited by directions from Aryam - Shweib and Aryam Um Zumol.
12 FORMATION OF LOCAL CLOUDS In conditions of relative humidity more than 50 % at heights up to 500m first symptoms of occurrence of clouds was found out already on distance 0.5-5km from the station. On distance of kilometers, the clouds were appreciably integrated and rose, getting the form of cumulous clouds. The greatest development of clouds under favorable atmospheric conditions achieved on distance approximately kilometers from a place of occurrence. In some cases these clouds gave some slight rain, but basically they disappeared or left the territory of Emirates without shedding their rain. But, non-the-less they demonstrated the ability of the equipment to create rain and valuable cloud cover over parched areas of desert which in itself is a great achievement. At the moment of the greatest development the strip of local clouds reached from the north to the south for approximately kilometers. On days of low atmospheric moisture which accounted for 30% of the observation time, the local clouds did not arise. As a rule, it occurred those days, when dry southern, southeast or east wind prevailed. The relative humidity on these days, at near the ground layer of an atmosphere, and at heights of more than 3000m did not exceed %.

13

14

15
16

17

18

19

20

21
22

23
24 INFLUENCE UPON NATURAL CLOUDS In January, often weak, low level clouds came in from Gulf side. After the passage of clouds above the station they were appreciably integrated, and developed into the form of cumulus clouds and further repeatedly released slight rain. The rain fell approximately at a distance of some kilometers from the station. In the period between the 13th to the 17th of January inclusive in the station area began to approach rain clouds. Within all these days we observed the brightly expressed growth of clouds in an operative range of the station. Thus in many cases the rain began to fall directly in the vicinity of the station, and the rains did not stop, and clouds were increased in the process of moving away from the rain station. It is necessary to notice, that the clouds, which did not come into operative range of the station, gave, as a rule, much smaller precipitation.
25
26

27

28

29
30 INFLUENCE UPON FOG During the trial period practical experiments proved that the station actively influences the process of fog formation, and this influence, depending on mode of operations of the equipment it can, both stimulate the formation of fog, and or prevent its formation and/or disperse patches of existing fog valuable for airports and sections of motorway susceptible to fog. The equipment in its mode of fog stimulation of fog amplification directly in the territory surrounding the station, and in significant territories beyond was marked. In some cases the radius of the foggy spot exceeded some 50 kms. Following the switch on of the equipment into its fog dispersal mode the increase in visibility came within minutes even in conditions of very dense, thick fog, when the visibility at the moment of switch on of the equipment was no more than 50 meters. The preliminary start of the equipment in a mode of dispersion of fog in conditions of high probability of fog formation has allowed avoidance of fog formation in a radius of not less than 5 kms around of the station. Note: mist or fog irrigation of Tea Plantations is of considerable interest in Tea Growing Regions of the world.
31 INFLUENCE UPON DUST POLLUTION OF THE ATMOSPHERE In conditions of strong dust content in ground layers of the atmosphere at the presence of witnesses the possibility of removal or grounding of dust pollution was demonstrated. Within 30 minutes of starting the ions generator there was a definite increase in vertical visibility; within one hour the horizontal range of visibility also increased appreciably. The conditions of dust pollution in the atmosphere before commencing the demonstration and approximately with these three hours are well visible in the satellite photos which we have catalogued for verification (
32
33
34 THE CONCLUSION In spite of the fact, that during this brief experiment the significant part of the station s potential was not used, the received results confirm expediency of works continuation. We propose during April by common efforts to provide work of the station s equipment as designed and to continue the experiment in May - December Also, we are deep convinced that construction of the second station (in area of lines Aryam - Shweib and Gahantoot - Shweihan crossing) will allow greatly to increase lifetime and scale of local clouds, and also to raise probability and volume of precipitation in the zone of the stations activity. Scientific Director Yuri Tkachenko Director of Analytical Department Oleksandr Sokolov
Plan for operational nowcasting system implementation in Pulkovo airport (St. Petersburg, Russia)
") Plan for operational nowcasting system implementation in Pulkovo airport (St. Petersburg, Russia) Pulkovo airport (St. Petersburg, Russia) is one of the biggest airports in the Russian Federation (150
Plan for operational nowcasting system implementation in Pulkovo airport (St. Petersburg, Russia) Pulkovo airport (St. Petersburg, Russia) is one of the biggest airports in the Russian Federation (150
1. What influence does the Coriolis force have on pressure gradient wind direction in the Northern Hemisphere?
 1. What influence does the Coriolis force have on pressure gradient wind direction in the Northern Hemisphere? A. Pushes wind to the left B. Pushes wind to the right C. Pushes wind up D. Pushes wind backwards
A PRELIMINARY REPORT UNIQUE HAIL AND TORNADIC STORM OBSERVATIONS CENTRAL ILLINOIS AND EASTERN INDIANA 3 APRIL 1974
 A PRELIMINARY REPORT ON UNIQUE HAIL AND TORNADIC STORM OBSERVATIONS IN CENTRAL ILLINOIS AND EASTERN INDIANA ON 3 APRIL 1974 Prepared by the Senior Staff of the Illinois Program to DESIGN AN EXPERIMENT
Page 1. Name:
 Name: 1) As the difference between the dewpoint temperature and the air temperature decreases, the probability of precipitation increases remains the same decreases 2) Which statement best explains why
Baton Rouge Climate Summary: July 2014
 Baton Rouge Climate Summary: July 2014 (based on available data as of 07 August 2014) July Weather Highlights: - 2014 s run of cooler-than-normal weather continues - three July cool fronts very uncommon
Wind direction measures in degrees Occasion described with codes, when is calm or variable wind. Explanation
 Introduction The searching results explanations of meteorological data Depending on the parameter, the instrumental measuring or visual observation method is used for the meteorological observations. Instrumentally
Weather Compass Webquest: Lab/Activity Edition
 Weather Compass Webquest: Lab/Activity Edition www.weathercompass.webs.com 1 Name: Date: Welcome to the Weather Compass Webquest: Activity/Lab Edition. This webquest was created by the National Oceanic
Chapter 12 Section 12.1 The causes of weather
 Chapter 12 Section 12.1 The causes of weather Main Idea: Air masses have different temperatures and amounts of moisture because of the uneven heating of earth's surface. What is Meteorology The study of
25.1 Air Masses. Section 25.1 Objectives
 Section 25.1 Objectives Explain how an air mass forms. List the four main types of air masses. Describe how air masses affect the weather of North America. Air Masses 25.1 Air Masses Differences in air
1st Annual Southwest Ohio Snow Conference April 8, 2010 Abner F. Johnson, Office of Maintenance - RWIS Coordinator
 1st Annual Southwest Ohio Snow Conference April 8, 2010 Abner F. Johnson, Office of Maintenance - RWIS Coordinator The Ohio Department of Transportation ODOT has approximately 5500 full-time employees
Weather Related Factors of the Adelaide floods ; 7 th to 8 th November 2005
 Weather Related Factors of the Adelaide floods ; th to th November 2005 Extended Abstract Andrew Watson Regional Director Bureau of Meteorology, South Australian Region 1. Antecedent Weather 1.1 Rainfall
1. Base your answer to the following question on the weather map below, which shows a weather system that is affecting part of the United States.
 1. Base your answer to the following question on the weather map below, which shows a weather system that is affecting part of the United States. Which sequence of events forms the clouds associated with
Science 1206 Chapter 1 - Inquiring about Weather
 Science 1206 Chapter 1 - Inquiring about Weather 1.1 - The Atmosphere: Energy Transfer and Properties (pp. 10-25) Weather and the Atmosphere weather the physical conditions of the atmosphere at a specific
Module 11: Meteorology Topic 5 Content: Weather Maps Notes
 Introduction A variety of weather maps are produced by the National Weather Service and National Oceanographic Atmospheric Administration. These maps are used to help meteorologists accurately predict
Ch. 3: Weather Patterns
 Ch. 3: Weather Patterns Sect. 1: Air Mass & Fronts Sect. 2: Storms Sect. 3: Predicting the Weather Sect. 4: Weather forecasters use advanced technologies Ch. 3 Weather Fronts and Storms Objective(s) 7.E.1.3
November 28, 2017 Day 1
 November 28, 2017 Day 1 Air Masses & Fronts Teachers- please out the sheet (right) for the students to fill in as we go! Review: Clouds & Precipitation? What are the 4 different clouds? Status, Cumulus,
CHARACTERISTICS OF TRAFFIC ACCIDENTS IN COLD, SNOWY HOKKAIDO, JAPAN
 CHARACTERISTICS OF TRAFFIC ACCIDENTS IN COLD, SNOWY HOKKAIDO, JAPAN Motoki ASANO Director Traffic Engineering Division Civil Engineering Research Institute of 1-3 Hiragishi, Toyohira-ku, Sapporo, 062-8602,
1. Which weather map symbol is associated with extremely low air pressure? A) B) C) D) 2. The diagram below represents a weather instrument.
 B) C) D) 2. The diagram below represents a weather instrument.") 1. Which weather map symbol is associated with extremely low air pressure? 2. The diagram below represents a weather instrument. Which weather variable was this instrument designed to measure? A) air pressure
1. Which weather map symbol is associated with extremely low air pressure? 2. The diagram below represents a weather instrument. Which weather variable was this instrument designed to measure? A) air pressure
STUDY ON PHOTOELECTRIC CONFRONTATION OF WATER MIST SCREEN SYSTEM
 2013 WJTA-IMCA Conference and Expo September 9-11, 2013 Houston, Texas Paper STUDY ON PHOTOELECTRIC CONFRONTATION OF WATER MIST SCREEN SYSTEM B. Ren, HJ. Zhang, HG. Xu, M. Guan Xi'an Dongfeng Instrument
Fog Hazards in Punjab
 Pakistan Journal of Meteorology Vol. 8, Issue 16: Jan, 2012 Fog Hazards in Punjab Aslam, M. 1 Abstract Using 30-year (1976-2005) real meteorological data of 10-weather stations, four dense fog years (1998-1999,
DEPARTMENT OF EARTH & CLIMATE SCIENCES Name SAN FRANCISCO STATE UNIVERSITY Nov 29, ERTH 360 Test #2 200 pts
 DEPARTMENT OF EARTH & CLIMATE SCIENCES Name SAN FRANCISCO STATE UNIVERSITY Nov 29, 2018 ERTH 360 Test #2 200 pts Each question is worth 4 points. Indicate your BEST CHOICE for each question on the Scantron
SEVERE WEATHER AND FRONTS TAKE HOME QUIZ
 1. Most of the hurricanes that affect the east coast of the United States originally form over the A) warm waters of the Atlantic Ocean in summer B) warm land of the southeastern United States in summer
AMDAR Forecast Applications. Richard Mamrosh NWS Green Bay, Wisconsin, USA
 AMDAR Forecast Applications Richard Mamrosh NWS Green Bay, Wisconsin, USA AMDAR has many applications Aviation Low level wind shear Ceilings and visibilities Icing and turbulence Winter Storms Precipitation
January 2006 Climate Summary
 Ashley Brooks (765) 494-6574 Feb 9, 2006 http://www.iclimate.org January 1-3 January 2006 Climate Summary Unseasonably warm conditions welcomed in the New Year with highs in the 40s across the northern
ATS 351, Spring 2010 Lab #11 Severe Weather 54 points
 ATS 351, Spring 2010 Lab #11 Severe Weather 54 points Question 1 (10 points): Thunderstorm development a) Sketch and describe the stages of development of a single cell thunderstorm. About how long does
Range Cattle Research and Education Center January CLIMATOLOGICAL REPORT 2012 Range Cattle Research and Education Center.
 1 Range Cattle Research and Education Center January 2013 Research Report RC-2013-1 CLIMATOLOGICAL REPORT 2012 Range Cattle Research and Education Center Brent Sellers Weather conditions strongly influence
Tuesday, September 13, 16
 Weather Weather State Objectives 4.c, 4.d, 4.h. Discussion What are some ways in which weather affects your everyday life? Discussion What are some ways in which weather affects your everyday life? What
September 2005 Climate Summary
 Ashley Brooks (765) 494-6574 Oct 5, 2005 http://iclimate.org September 2005 Climate Summary September 1-7 A cold front came through on the 1 st of the month, however little moisture was associated with
Natural Event Documentation
 ADDENDUM Natural Event Documentation Corcoran, Oildale and Bakersfield, California September 22, 2006 San Joaquin Valley Unified Air Pollution Control District May 23, 2007 Natural Event Documentation
ARUBA CLIMATOLOGICAL SUMMARY 2017 PRECIPITATION
 ARUBA CLIMATOLOGICAL SUMMARY 2017 PRECIPITATION The total amount of rainfall recorded at Reina Beatrix International Airport for the year 2017 was 391.0 mm. This is 17.1 % below normal ( Figure 1 ). During
The Transfer of Heat
 The Transfer of Heat Outcomes: S2-4-03 Explain effects of heat transfer within the atmosphere and hydrosphere on the development and movement of wind and ocean currents. Coriolis Effect In our ecology
Weather, Air Masses, Fronts and Global Wind Patterns. Meteorology
 Weather, Air Masses, Fronts and Global Wind Patterns Meteorology Weather is what conditions of the atmosphere are over a short period of time. Climate is how the atmosphere "behaves" over long periods
Mechanical Turbulence Wind forms eddies as it blows around hanger, stands of trees or other obstructions
 Turbulence Low-level Turbulence below 15,000 feet consists of Mechanical Turbulence Convective Turbulence Frontal Turbulence Wake Turbulence Mechanical Turbulence Wind forms eddies as it blows around hanger,
Mid-Latitude Cyclones and Fronts. Lecture 12 AOS 101
 Mid-Latitude Cyclones and Fronts Lecture 12 AOS 101 Homework 4 COLDEST TEMPS GEOSTROPHIC BALANCE Homework 4 FASTEST WINDS L Consider an air parcel rising through the atmosphere The parcel expands as it
Road Weather: The Science Behind What You Know
 The Weather Road Weather: The Science Behind What You Know Jon Tarleton Global Roads Marketing Manager Meteorologist Jon.tarleton@vaisala.com Page 2 / date / name / Internal use / Vaisala Weather and Our
Complex Terrain (EDUCT) experiment, conducted by the National Center for Atmospheric
 experiment, conducted by the National Center for Atmospheric") Alex Ameen Shenandoah Trip Paper I visited Shenandoah National Park on April 11, 2009 to investigate the Education in Complex Terrain (EDUCT) experiment, conducted by the National Center for Atmospheric
Alex Ameen Shenandoah Trip Paper I visited Shenandoah National Park on April 11, 2009 to investigate the Education in Complex Terrain (EDUCT) experiment, conducted by the National Center for Atmospheric
FORENSIC WEATHER CONSULTANTS, LLC
 MOST INFORMATION HAS BEEN CHANGED FOR THIS SAMPLE REPORT FORENSIC WEATHER CONSULTANTS, LLC Howard Altschule Certified Consulting Meteorologist 1971 Western Avenue, #200 Albany, New York 12203 518-862-1800
Application of microwave radiometer and wind profiler data in the estimation of wind gust associated with intense convective weather
 Application of microwave radiometer and wind profiler data in the estimation of wind gust associated with intense convective weather P W Chan 1 and K H Wong 2 1 Hong Kong Observatory, 134A Nathan Road,
Definitions Weather and Climate Climates of NYS Weather Climate 2012 Characteristics of Climate Regions of NYS NYS s Climates 1.
 Definitions Climates of NYS Prof. Anthony Grande 2012 Weather and Climate Weather the state of the atmosphere at one point in time. The elements of weather are temperature, t air pressure, wind and moisture.
WESTERN GRAY WHALE ADVISORY PANEL WGWAP 5/18 5 th Meeting December 2008 ENGLISH. Comparison of shore-based scan counts WGWAP 5/18
 WESTERN GRAY WHALE ADVISORY PANEL WGWAP 5/18 5 th Meeting December 2008 ENGLISH Comparison of shore-based scan counts WGWAP 5/18 Comparison of Shore-Based Scan Counts Background As part of the recommendations
Arizona Climate Summary May 2012
 Arizona Climate Summary May 2012 Summary of conditions for April 2012 April 2012 Temperature and Precipitation Summary April 1 st 16 th : Although April began with another low pressure system sweeping
severe VOLUME 5, NUMBER 1, FEBRUARY 1980
 severe VOLUME 5, NUMBER 1, FEBRUARY 1980 TORNADIC THUNDERSTORM DEVELOPMENT IN WEST TEXAS 27 MAY 1978 by Richard E. Peterson Atmospheric Science Group Texas University Lubbock, TX and Alan Johnson National
Reprint 850. Within the Eye of Typhoon Nuri in Hong Kong in C.P. Wong & P.W. Chan
 Reprint 850 Remote Sensing Observations of the Subsidence Zone Within the Eye of Typhoon Nuri in Hong Kong in 2008 C.P. Wong & P.W. Chan 8 th International Symposium on Tropospheric Profiling: Integration
MAURITIUS METEOROLOGICAL SERVICES
 MAURITIUS METEOROLOGICAL SERVICES CLIMATE SEPTEMBER 2018 Introduction Synoptic weather pattern over the region portrayed September as a transition month. The month started with wintry characteristics.
Use the terms from the following list to complete the sentences below. Each term may be used only once.
 Skills Worksheet Directed Reading Section: Air Masses Use the terms from the following list to complete the sentences below. Each term may be used only once. high pressure poles low pressure equator wind
Weather - is the state of the atmosphere at a specific time & place
 Weather Section 1 Weather - is the state of the atmosphere at a specific time & place Includes such conditions as air pressure, wind, temperature, and moisture in the air The Sun s heat evaporates water
Application and verification of ECMWF products 2016
 Application and verification of ECMWF products 2016 Icelandic Meteorological Office (www.vedur.is) Bolli Pálmason and Guðrún Nína Petersen 1. Summary of major highlights Medium range weather forecasts
Atmosphere, Weather & Climate Review for Unit Assessment (Can be taken on Study Island Due Mon., 11/26/12)
") Name Class Period Atmosphere, Weather & Climate Review for Unit Assessment (Can be taken on Study Island Due Mon., 11/26/12) 1. When hot and cold air meet, the hot air rises to the top. Which process causes
Name Class Period Atmosphere, Weather & Climate Review for Unit Assessment (Can be taken on Study Island Due Mon., 11/26/12) 1. When hot and cold air meet, the hot air rises to the top. Which process causes
November outlook for haze over Indonesia November 4, 2015 For more information, please contact Dr. Robert Field
 November outlook for haze over Indonesia November 4, 2015 For more information, please contact Dr. Robert Field (robert.field@columbia.edu) The following is an interpretation of current NOAA Climate Prediction
Unit 4 Review Guide: Weather
 Unit 4 Review Guide: Weather Weather: The condition of the atmosphere at a specific time and place. Freezing: To become hardened into ice or into a solid body Deposition: The change in state of matter
ANSWER KEY. Part I: Synoptic Scale Composite Map. Lab 12 Answer Key. Explorations in Meteorology 54
 ANSWER KEY Part I: Synoptic Scale Composite Map 1. Using Figure 2, locate and highlight, with a black dashed line, the 500-mb trough axis. Also, locate and highlight, with a black zigzag line, the 500-mb
AEROSOL-CLOUD INTERACTIONS AND PRECIPITATION IN A GLOBAL SCALE. SAHEL Conference April 2007 CILSS Ouagadougou, Burkina Faso
 AEROSOL-CLOUD INTERACTIONS AND PRECIPITATION IN A GLOBAL SCALE SAHEL Conference 2007 2-6 April 2007 CILSS Ouagadougou, Burkina Faso The aerosol/precipitation connection Aerosol environment has changed
Weather and Climate 1. Elements of the weather
 Weather and Climate 1 affect = to have an effect on, influence, change altitude = the height of a place above the sea axis = the line around which an object rotates certain = special consist of = to be
Strategic Radar Enhancement Project (SREP) Forecast Demonstration Project (FDP) The future is here and now
 Forecast Demonstration Project (FDP) The future is here and now") Strategic Radar Enhancement Project (SREP) Forecast Demonstration Project (FDP) The future is here and now Michael Berechree National Manager Aviation Weather Services Australian Bureau of Meteorology
Strategic Radar Enhancement Project (SREP) Forecast Demonstration Project (FDP) The future is here and now Michael Berechree National Manager Aviation Weather Services Australian Bureau of Meteorology
Chapter 1 Anatomy of a Cyclone
 Chapter 1 Anatomy of a Cyclone The Beast in the East 15-17 February 2003 Extra-tropical cyclone an area of low pressure outside of the tropics Other names for extra-tropical cyclones: Cyclone Mid-latitude
ARUBA CLIMATOLOGICAL SUMMARY 2014 PRECIPITATION
 ARUBA CLIMATOLOGICAL SUMMARY 2014 PRECIPITATION The total amount of rainfall recorded at Reina Beatrix International Airport for the year 2014 was 309.2 mm. This is 34.4 % below normal ( Figure 1 ). During
Sample Q4. Name: Class: Date: Multiple Choice Identify the letter of the choice that best completes the statement or answers the question.
 Name: Class: Date: Sample Q4 Multiple Choice Identify the letter of the choice that best completes the statement or answers the question. 1. The Fujita scale pertains to a. the size of a tornado producing
Lecture #14 March 29, 2010, Monday. Air Masses & Fronts
 Lecture #14 March 29, 2010, Monday Air Masses & Fronts General definitions air masses source regions fronts Air masses formation types Fronts formation types Air Masses General Definitions a large body
MET Lecture 34 Downbursts
 MET 4300 Lecture 34 Downbursts Downbursts A strong downdraft that originates within the lower part of a cumulus cloud or thunderstorms and spreads out at the surface Downbursts do not require strong thunderstorms
THE SEPTEMBER 24,1987, YUMA PROVING GROUND TORNADO
 Volume 14 Number February, 1989 13 THE SEPTEMBER 24,1987, YUMA PROVNG GROUND TORNADO Paul R. Vukits (1) ASL Yuma Met Team ABSTRACT Numerous reports of a tornado on the Yuma Proving Grounds (YPG), Arizona
Anticipation Guide #2
 Weather Systems Anticipation Guide #2 Density differences in the atmosphere are responsible for redistributing earth s heat When air is heated it rises, cools and expands releasing energy mt air masses
ATS 351, Spring 2010 Lab #9 Weather Radar - 55 points
 ATS 351, Spring 2010 Lab #9 Weather Radar - 55 points 1. (5 points) If a radar has a maximum unambiguous range of 300km, what is its PRF? (The speed of light, c, is equal to 3x10 8 m/s) 2. (5 points) Explain
DEPARTMENT OF GEOSCIENCES SAN FRANCISCO STATE UNIVERSITY. Metr Fall 2012 Test #1 200 pts. Part I. Surface Chart Interpretation.
 DEPARTMENT OF GEOSCIENCES SAN FRANCISCO STATE UNIVERSITY NAME Metr 356.01 Fall 2012 Test #1 200 pts Part I. Surface Chart Interpretation. Figure 1. Surface Chart for 1500Z 7 September 2007 1 1. Pressure
Wind data collected by a fixed-wing aircraft in the vicinity of a typhoon over the south China coastal waters
 Wind data collected by a fixed-wing aircraft in the vicinity of a typhoon over the south China coastal waters P.W. Chan * and K.K. Hon Hong Kong Observatory, Hong Kong, China Abstract: The fixed-wing aircraft
Unit: Weather Study Guide
 Name: Period: Unit: Weather Study Guide Define each vocabulary word on a separate piece of paper or index card. Weather Climate Temperature Wind chill Heat index Sky conditions UV index Visibility Wind
Heavy Rain/Flooding September 8-10 Associated with Tropical Storm Etau
 Heavy Rain/Flooding September 8-10 Associated with Tropical Storm Etau Wx Files Vol.32 September 24, 2015 Tropical Storm Etau made landfall over the Chita Peninsula in Aichi just after 10:00 AM on September
but 2012 was dry Most farmers pulled in a crop
 After a winter that wasn t, conditions late in the year pointed to a return to normal snow and cold conditions Most farmers pulled in a crop but 2012 was dry b y M i k e Wr o b l e w s k i, w e a t h e
The hydrologic service area (HSA) for this office covers Central Kentucky and South Central Indiana.
 for this office covers Central Kentucky and South Central Indiana.") January 2012 February 13, 2012 An X inside this box indicates that no flooding occurred within this hydrologic service area. January 2012 continued the string of wet months this winter. Rainfall was generally
January 2012 February 13, 2012 An X inside this box indicates that no flooding occurred within this hydrologic service area. January 2012 continued the string of wet months this winter. Rainfall was generally
AROME Nowcasting - tool based on a convective scale operational system
 AROME Nowcasting - tool based on a convective scale operational system RC - LACE stay report Supervisors (ZAMG): Yong Wang Florian Meier Christoph Wittmann Author: Mirela Pietrisi (NMA) 1. Introduction
The Atmosphere of Earth
 The Atmosphere of Earth The probability of a storm can be predicted, but nothing can be done to stop or slow a storm. Understanding the atmosphere may help in predicting weather changes, but it is doubtful
RR#4 - Multiple Choice
 1. The map below shows the amount of snowfall, in inches, produced by a lake-effect snowstorm in central New York State. The wind that produced this snowfall pattern most likely came from the 1) northeast
Weather Maps. Name:& & &&&&&Advisory:& & 1.! A&weather&map&is:& & & & 2.! Weather&fronts&are:& & & & & &
 Name: Advisory: Weather Maps 1. Aweathermapis: 2. Weatherfrontsare: a. Labelthefrontsbelow: 1. 2. 3. 4. 3. Clovercoversymbols 4. Precipitationsymbols 5. 6. 7. 8. 5. RadarEchoIntensityshows 6. Isobarsare
The Climatology of Clouds using surface observations. S.G. Warren and C.J. Hahn Encyclopedia of Atmospheric Sciences.
 The Climatology of Clouds using surface observations S.G. Warren and C.J. Hahn Encyclopedia of Atmospheric Sciences Gill-Ran Jeong Cloud Climatology The time-averaged geographical distribution of cloud
Weather Studies Introduction to Atmospheric Science
 Weather Studies Introduction to Atmospheric Science American Meteorological Society Chapter 1 Monitoring The Weather Credit: This presentation was prepared for AMS by Michael Leach, Professor of Geography
ISSUED BY KENDRIYA VIDYALAYA - DOWNLOADED FROM
 CHAPTER -11 WATER IN THE ATMOSPHERE This chapter deals with Humidity, types of humidity, relative humidity, absolute humidity, specific humidity, dew point, condensation, saturated air, types of precipitation
Weather and Climate Summary and Forecast November 2017 Report
 Weather and Climate Summary and Forecast November 2017 Report Gregory V. Jones Linfield College November 7, 2017 Summary: October was relatively cool and wet north, while warm and very dry south. Dry conditions
MAURITIUS METEOROLOGICAL SERVICES
 MAURITIUS METEOROLOGICAL SERVICES CLIMATE FEBRUARY 2019 Introduction February 2019 was in mostly warm and dry. ENSO conditions and the Indian Ocean Dipole were neutral. However, the Inter Tropical Convergence
RR#5 - Free Response
 Base your answers to questions 1 through 3 on the data table below and on your knowledge of Earth Science. The table shows the area, in million square kilometers, of the Arctic Ocean covered by ice from
ATS 351, Spring 2010 Lab #9 Weather Radar - 55 points
 ATS 351, Spring 2010 Lab #9 Weather Radar - 55 points 1. (5 points) If a radar has a maximum unambiguous range of 300km, what is its PRF? (The speed of light, c, is equal to 3x10 8 m/s) The equation to
The Atmosphere EVPP 110 Lecture Fall 2003 Dr. Largen
 1 Physical Environment: EVPP 110 Lecture Fall 2003 Dr. Largen 2 Physical Environment: Atmosphere Composition Heat transfer Atmospheric moisture Atmospheric circulation Weather and climate 3 Physical Environment:
TCC News 1 No. 29 Summer 2012
 No. 29 Summer 2012 Contents Upgrade of JMA s Supercomputer System Summary of Kosa (Aeolian dust) Events over Japan in 2012 Sea Ice in the Sea of Okhotsk for the 2011/2012 Winter Season BMKG expert visit
1 What Is Climate? TAKE A LOOK 2. Explain Why do areas near the equator tend to have high temperatures?
 CHAPTER 17 1 What Is Climate? SECTION Climate BEFORE YOU READ After you read this section, you should be able to answer these questions: What is climate? What factors affect climate? How do climates differ
Sensitivity of precipitation forecasts to cumulus parameterizations in Catalonia (NE Spain)
") Sensitivity of precipitation forecasts to cumulus parameterizations in Catalonia (NE Spain) Jordi Mercader (1), Bernat Codina (1), Abdelmalik Sairouni (2), Jordi Cunillera (2) (1) Dept. of Astronomy and
Sensitivity of precipitation forecasts to cumulus parameterizations in Catalonia (NE Spain) Jordi Mercader (1), Bernat Codina (1), Abdelmalik Sairouni (2), Jordi Cunillera (2) (1) Dept. of Astronomy and
NATIONAL WEATHER SERVICE
 January 2016 February 9, 2016 This was a dry month across the HSA despite one large and several smaller snowfalls. Most locations ended up 1-2 inches below normal for the month. The driest locations at
Chapter 12: Meteorology
 Chapter 12: Meteorology Section 1: The Causes of Weather 1. Compare and contrast weather and climate. 2. Analyze how imbalances in the heating of Earth s surface create weather. 3. Describe how and where
Weather and Climate Summary and Forecast October 2017 Report
 Weather and Climate Summary and Forecast October 2017 Report Gregory V. Jones Linfield College October 4, 2017 Summary: Typical variability in September temperatures with the onset of fall conditions evident
Ryan K. Decker * NASA Marshall Space Flight Center, Huntsville, Alabama. Lee Burns Raytheon, Huntsville, Alabama
 P.7 THE 006 CAPE CANAVERAL AIR FORCE STATION RANGE REFERENCE ATMOSPHERE MODEL VALIDATION STUDY AND SENSITIVITY ANALYSIS TO THE NATIONAL AERONAUTICS AND SPACE ADMINISTRATION'S SPACE SHUTTLE Ryan K. Decker
Winter Storm of 15 December 2005 By Richard H. Grumm National Weather Service Office State College, PA 16803
 Winter Storm of 15 December 2005 By Richard H. Grumm National Weather Service Office State College, PA 16803 1. INTRODUCTION A complex winter storm brought snow, sleet, and freezing rain to central Pennsylvania.
(Country Report) Saudi Arabia
 Saudi Arabia") The 5th Meeting of the Coordinating Group of the RA II WIGOS Satellite Project 21 October, Vladivostok city, Russky Island, Russia Far Eastern Federal University (Country Report) Saudi Arabia General Authority
The 5th Meeting of the Coordinating Group of the RA II WIGOS Satellite Project 21 October, Vladivostok city, Russky Island, Russia Far Eastern Federal University (Country Report) Saudi Arabia General Authority
CONVECTION-ALLOWING SIMULATIONS OF COLD POOLS IN THE NORTHWESTERN SAHARA
 COSMO User Seminar, Langen, 4th March 2008 CONVECTION-ALLOWING SIMULATIONS OF COLD POOLS IN THE NORTHWESTERN SAHARA 1 Peter Knippertz, 1 Jörg Trentmann & 2 Axel Seifert 1 Institute for Atmospheric Physics,
Foundations of Earth Science, 6e Lutgens, Tarbuck, & Tasa
 Foundations of Earth Science, 6e Lutgens, Tarbuck, & Tasa Weather Patterns and Severe Weather Foundations, 6e - Chapter 14 Stan Hatfield Southwestern Illinois College Air masses Characteristics Large body
Forecasting of Optical Turbulence in Support of Realtime Optical Imaging and Communication Systems
 Forecasting of Optical Turbulence in Support of Realtime Optical Imaging and Communication Systems Randall J. Alliss and Billy Felton Northrop Grumman Corporation, 15010 Conference Center Drive, Chantilly,
Sensitivity Analysis of WRF Forecasts in Arizona During the Monsoon Season Case Study: August 2, 2005 to August 3, 2005
 Sensitivity Analysis of WRF Forecasts in Arizona During the Monsoon Season Case Study: August 2, 2005 to August 3, 2005 Christopher L. Castro and Stephen Bieda III University of Arizona Susanne Grossman-Clarke
Weather. Describing Weather
 Weather Describing Weather What is weather? Weather is the atmospheric conditions, along with short-term changes, of a certain place at a certain time. Have you ever been caught in a rainstorm on what
Warm Up 1: Atmosphere LT I can describe dew point, condensation nuclei and explain the difference between relative and absolute humidity.
 Warm Up 1: Atmosphere 2-8-17 LT I can describe dew point, condensation nuclei and explain the difference between relative and absolute humidity. Q1 List as many layers of the atmosphere as you can remember.
POSTER PRESENTATION: Comparison of manual precipitation observations with automatic observations in Oslo and Utsira
 POSTER PRESENTATION: Comparison of manual precipitation observations with automatic observations in Oslo and Utsira Utsira: An island at the western coast of Norway. Annual precipitation: 1165 mm Oslo
Fort Lewis, Washington (47 05'N, 'W)
") Fort Lewis, Washington (47 05'N, 122 35'W) Full Year Climatology CONVENTIONS: The spelling of place names and geographical features are those used by the National Imagery and Mapping Agency (NIMA). All
Fort Lewis, Washington (47 05'N, 122 35'W) Full Year Climatology CONVENTIONS: The spelling of place names and geographical features are those used by the National Imagery and Mapping Agency (NIMA). All
10.1 TEMPERATURE, THERMAL ENERGY AND HEAT Name: Date: Block: (Reference: pp of BC Science 10)
") 10.1 TEMPERATURE, THERMAL ENERGY AND HEAT Name: Date: Block: (Reference: pp. 424-435 of BC Science 10) kinetic molecular theory: explains that matter is made up of tiny that are constantly. These atoms
10.1 TEMPERATURE, THERMAL ENERGY AND HEAT Name: Date: Block: (Reference: pp. 424-435 of BC Science 10) kinetic molecular theory: explains that matter is made up of tiny that are constantly. These atoms
Regression Models for Forecasting Fog and Poor Visibility at Donmuang Airport in Winter
 Regression Models for Forecasting Fog and Poor Visibility at Donmuang Airport in Winter S. Ruangjun 1,* and R. H. B. Exell 2 1 Weather Division (Beside Military Airport, Wing 6), Paholyothin Road, Donmuang,
2016 EXPLANATION OF OBSERVATIONS BY REFERENCE NUMBER
 S 2016 EXPLANATION OF OBSERVATIONS BY REFERENCE NUMBER tation was moved to 10905 Virginia Forest Court Glen Allen, Virginia in Henrico County on June 10, 2008. Latitude 37 39' 18.87" (37.65537) Longitude