Fog Hazards in Punjab
|
|
|
- Cathleen Gallagher
- 5 years ago
- Views:
Transcription
1 Pakistan Journal of Meteorology Vol. 8, Issue 16: Jan, 2012 Fog Hazards in Punjab Aslam, M. 1 Abstract Using 30-year ( ) real meteorological data of 10-weather stations, four dense fog years ( , , and ) were investigated. Daily, ten-days and monthly temperature and moisture data of these four years showed significant changes during the fog events. It is observed that day time temperature decreases and night time temperature increases during fog events but the mean temperature remains below 15.5 degrees Celsius, mean relative humidity examined more than 80% for the north Punjab and more than 70% for the south Punjab and throughout the fog period, daily saturation vapour pressure deficit found below 1 hpa. The synoptic charts for these years showed that moist currents continuously penetrate into Punjab from Bay of Bengal and a trough forms over this region. At the same time a high pressure area develops near the foot of Himalayas. Similarly, 850 hpa charts revealed that a trough persists over this area and also a ridge is present to the north east of this region. This work would be helpful to understand the reasons of fog development during winter season in Punjab and to predict the phenomenon before time to minimize the impacts on daily public life and agriculture. Introduction Fog is a natural phenomenon and is formed when water vapours in the air begin to condense into liquid water near the surface. Like other parts of the world, Pakistan also has a fog season which starts from November and ends in January. This fog is classified as radiation fog. The fog does not occur across the whole country but only plain areas experience this hazard, particularly Punjab, which is the most affected area that is situated in the north-east of Pakistan. The frequency of fog has increased in this area after mid 1990s; it is an unusual phenomenon and lasts many days without any break, sometimes sun is not to be seen for many days. Sometimes it is so dense that one cannot see more than a few meters ahead. Because the population and industrialization has increased rapidly in Punjab during the study period, it has to be a polluted atmosphere as well providing extra nuclei for fog droplets to form upon. It affects every field of life. Aviation, road and rail traffics are badly affected by this prolonged fog and the country has to face big economic losses by this hazard. Roach (1995) illustrated that radiation fog occurs in moist air under clear skies, the rapid loss of longwave radiation to space allowing the formation of a marked surface-based temperature inversion that captures air near to the surface Air pollution has strong interactions with fogs and clouds (Acker et al., 2002). The lower layer of the troposphere is rich in aerosols and gases, and therefore it gives an opportunity for fog to develop. Because fog droplets are much smaller (nearly 100 times) than rain drops, they are more concentrated than rain and mass transfer does not limit the kinetics of fog droplet reactions (Lange et al., 2003). The financial and human losses related to fog and low visibility became comparable to the losses from other weather events, e.g., tornadoes or, in some situations, even hurricanes (Gultepe et al., 2007). Data and Methodology: The data set of 30-years between 1976 and 2005 was compiled from the Regional Meteorological Centre Lahore, sub-office of the Pakistan Meteorological Department, which was provided after careful quality control. In Punjab, fog occurs only in the winter months of November, December and January but normally the peak fog months are December and January. Maximum temperature, minimum temperature, relative humidity and visibility data was collected for 10-observational weather stations, i.e. Lahore, Faisalabad, Sargodha, Sialkot, Islamabad, Murree, Jhelum, Multan, Bahawalpur and Khanpur. These stations were selected taking into account the length and completeness of records, so that most of the 1 chmas64@hotmail.com, Pakistan Meteorological Department. 1
2 Fog Hazards in Punjab Vol. 8 region was covered by the corresponding data. Daily data of 10 stations has been analysed in this study to detect the number of days and period of fog in the study area (Figure 1) NCEP/NCAR re-analysis 1 project has also been used to find the changes in the atmosphere for the period November 1976-January Results After analysing the 30-years ( ) of mean monthly maximum and mean monthly minimum temperatures for the months of November, December and January for all the 10 stations of Punjab, a decreasing trend is found in the mean monthly maximum temperature while an increasing trend is observed in the mean monthly minimum temperature. The 15-year temperature time series indicated that during the last 15-years ( ), the mean monthly maximum temperature decreased and the mean monthly minimum temperature increased. Almost same results were found for all stations considered in this study. In this paper, the results of only one station (Lahore) have been presented. Figure 1: A Map of weather stations of Pakistan, the highlighted area is the Punjab observatories (Pakistan Meteorological Department) Daily (NDJ) Mean Temperature Analysis (Lahore): During this study, four years of dense fog ( , , and ) have been examined and the daily mean temperatures for the months of November, December and January for these years for Lahore centre are plotted shown in Figure-2 (a, b, c, d) and shaded areas are the fog days. The starting days of these four fog years are as follows; during fog started from 12th December (42nd day) 1998; fog began on 1st January (62 nd day) 2000 during the year; fog commenced on 26th December (56th day) 2001 during year; and fog started from 1st January (62 nd day) 2003 during the year. This time series indicates the chances of fog development would be high when the daily mean temperature drops below 15.5 degrees Celsius. 10-Day Normal Temperature Analysis: The 10-day mean temperature (NDJ) normal ( ) and daily mean temperature (NDJ) (dashed line) for the years , , and are plotted in Figure-3 (a, b, c, d) below and shaded areas are the fog days. Figure-3 (a, b, c, d) indicates that 10-day daily mean temperature (NDJ) for all the four fog seasons remained below the 10-day mean temperature normal ( ) during fog days. Daily (NDJ) Mean Relative Humidity (RH) Analysis (Lahore): Time series of daily mean relative humidity of November, December and January for four fog years is demonstrated in Figure-4(a, b, c, and d) and fog days are shaded. This analysis indicates that when daily mean relative humidity gets near to 80%, then fog may occur. 2
 Figure")
 10-day temp-normal (1976-2005) and daily")
 10-day temp-normal")
3 Issue 16 Aslam, M. Figure 2: Daily mean temperatures ( ) Figure 3: 10-day temp-normal ( ) and daily mean temp ( ) 10-day temp-normal ( ) and daily mean temp ( ) 10-day temp-normal ( ) and daily mean temp ( ) 10-day temp-normal ( ) and daily mean temp ( ) 3

 and daily")
 10-day RH")
 4")
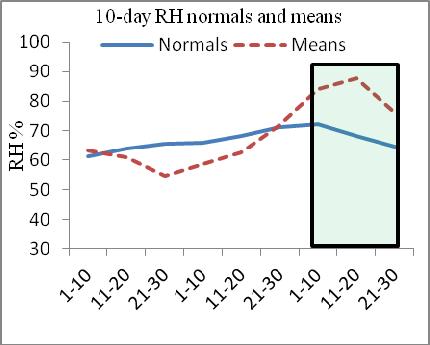
4 Fog Hazards in Punjab Vol. 8 Figure 4: Daily Mean Relative Humidity Figure 5: 10-day RH normal ( ) and daily mean RH ( ) 10-day RH normal ( ) and daily mean RH ( ) 10-day RH normal ( ) and daily mean RH ( ) 10-day RH normal ( ) and daily mean RH ( ) 4
 normal for the months of November, December and January (1976-2005) and daily mean relative humidity (dashed")
.")
5 Issue 16 Aslam, M. 10-Day Normal Relative Humidity Analysis: Time series of 10-day relative humidity (RH) normal for the months of November, December and January ( ) and daily mean relative humidity (dashed line) of these months for all the four fog years is plotted in Figure-5(a, b, c, d) and fog days are shaded. This analysis shows that during the fog days for all the four years 10-day mean relative humidity remained above the 10-day relative humidity normal ( ). It means that the atmosphere is more saturated during the fog days. Daily (NDJ) Vapour Pressure Analysis (Lahore): The time series of daily vapour pressure deficit for the months of November, December and January for four detected fog years is represented in Figure-6(a, b, c, d) and fog days are shaded. From this analysis, it is clear that fog may form when the daily vapour pressure deficit falls below 1hPa. Figure 6: Daily vapour pressure deficit 30-Year Surface and 850 hpa Pressure Charts: To see the general pattern of atmosphere, re-analysis of surface and 850 hpa pressure charts from NCEP-NCAR for a period of November 1976 to January 2005 has done and is shown in Figure-7(a, b). The 30-years ( ) averaged surface pressure chart for the months of November, December and January is shown in Figure-7a. This chart shows that a low pressure area exists over central and northern India; its trough is extending up to northern Punjab (Pakistan). A high pressure area persists near the foot of Himalayas and the ridge of this high stretches up to northern Pakistan. Another trough 5
.")
 30-year averaged 850 hpa level November 1976 to January 2005 (NCEP-NCAR) Anomalous pressure plots:")
6 Fog Hazards in Punjab Vol. 8 lies over Uzbekistan and spreading up to north-west Afghanistan. A high over the Caspian Sea exists and its ridge extends up to some parts of the northern Iran. Figure-7b is the averaged chart of 850 hpa from November to January for a period of 30-years ( ). It is clear from this chart that a low pressure area exists to the north-east India and another low pressure area lies over north and north-east Pakistan. Figure 7: 30-year averaged mean sea level pressure November 1976 to January 2005 (NCEP-NCAR) 30-year averaged 850 hpa level November 1976 to January 2005 (NCEP-NCAR) Anomalous pressure plots: Anomalous plots of sea level pressure (slp) and 850 hpa for dense fog year (November- January) from NCEP-NCAR are shown in Figure-8 (a, b). These anomalous plots reveal that during fog months a trough or low pressure persisted over Punjab (Pakistan) and also strong high pressure existed to the west of Himalayas. 6
 fog year (1998-1999) anomaly (NCEP-NCAR) 850 hpa level (November-January) fog year (1998-1999) anomaly (NCEP-NCAR) Discussion Meteorological conditions")

7 Issue 16 Aslam, M. Figure 8: sea level pressure (November-January) fog year ( ) anomaly (NCEP-NCAR) 850 hpa level (November-January) fog year ( ) anomaly (NCEP-NCAR) Discussion Meteorological conditions associated with fog: This analysis indicates that during all the four dense fog years, the maximum temperature has decreased because of the reduced solar light and minimum temperature has increased due to the blanket of this fog. It also reveals that fog occurred only when the daily mean temperature and the daily mean relative humidity had a certain threshold value. The daily mean temperatures for all the weather stations of the whole Punjab have a fog threshold value lower than 15.5 degrees Celsius, but the threshold value of daily mean relative humidity for both the north and the south Punjab is different. For the north Punjab, the daily mean relative humidity has a threshold value 80% while that for the south Punjab is 70%. It has also been examined that during the fog days for all the four dense fog years, the 10-day daily mean temperatures have been found to be less than the 10-day normal temperatures ( ). From this result, it is clear that the atmosphere is cooled more during the fog periods. Also it is found that the 10-day daily mean relative humidity remained above the 10-day 7
8 Fog Hazards in Punjab Vol. 8 normal relative humidity ( ) indicating increased moisture during all the four fog years (10- day normal RMC Lahore). From the meteorological parameters discussed above, it has been shown that during the fog days the value of daily mean relative humidity is found to be slightly higher in the north Punjab and the value of daily mean temperature is slightly higher in the south Punjab. The north Punjab is located in the higher latitudes and is close to the great Himalayas. The moisture availability is in abundance in this region due to various rivers, vast canal network and also from irrigated water over vast cultivated wheat fields during winter. In the south Punjab, the Cholistan desert covers a large area. There is a shortage of water, therefore the area under cultivation is small and most of the land lies barren. Some of its parts did not receive rain for a long time. These are the main reasons for the difference between the temperature and the relative humidity of the two parts of the Punjab. Synoptic features associated with fog: For the development of fog many meteorological processes operate on different scales and no single process dominates. In addition, fog formation also depends on local features of topography. The mean sea level pressure charts and 850 hpa charts are also helpful for the prediction of fog in Pakistan. The anomalous mean sea level pressure chart for three months of November, December and January reveals that during the winter months of fog persistence, a low is present over the Bay of Bengal and over southern India and its trough extends up to Punjab. A high lies in the north-east of Pakistan and its ridge stretches towards the west/north-west direction and covers some areas of the northern Pakistan. Another trough lies over Uzbekistan spreading up to north-west Afghanistan. A high over the Caspian Sea exists and its ridge extends up to some parts of the northern Iran. This re-analysis shows that during the foggy months cold and dry air from north-west penetrates into Pakistan through Afghanistan and it stagnates there because of the prominent high pressure present to the west of the foot of the Himalayas where it mixes with the warm moist air coming from the south-east direction. From the above discussion it is clear that for the formation of fog, a trough of low pressure area should prevail over the Punjab and at the same time, a high pressure area must be present to the west of Himalayas. The anomalous pressure chart of 850 hpa shows that over the Bay of Bengal and some south-east parts of India, a low pressure area exists and its trough extends up to Punjab. In the west of Himalayas and to the north-east of Pakistan a strong high pressure area lies and its ridge stretches to the southwest of Pakistan. An area of discontinuity is found over the Punjab. Another ridge also penetrates through Iran and Afghanistan into Pakistan from the Caspian Sea. In such conditions some deflected moisture at low level ( ) m above sea level penetrates into Punjab through the foothills of the Himalayas. Conclusions Four out of 30-years have shown dense prolonged fog events, which are 1998 to 1999, 1999 to 2000, 2001 to 2002 and 2002 to The dense fog in the study area was observed to be more frequent during the late 1990 s, because the population and industrialization has increased rapidly in Punjab during this period. These man-made factors have polluted the atmosphere which also alters regional climate change (Singh et al., 2007). Data analysis of these four winter seasons highlighted the following results during dense fog events; Mean temperature analysis of all major meteorological stations examined in this study indicates that fog develops when the daily mean temperature drops below 15.5 degrees Celsius. 8
9 Issue 16 Aslam, M. Daily mean relative humidity analysis of all the stations of the north Punjab shows that fog occurs when the daily mean relative humidity attains the value of 80%, and for the south Punjab, the analysis of all the stations reveals that fog develops when the daily mean relative humidity acquires the value of 70%. The analysis of vapour pressure deficit of all the stations of Punjab reveals that fog forms when its value falls below 1hPa. A low pressure type circulation (or trough) develops at 1000 to 850 mb over the study area (Punjab). References Acker, K., Mertes, S., Moeller, D., Wieprecht, W., Auel, R., & Kalass, D. (2002): Case study of cloud physical and chemical processes in low clouds at Mt. Brocken, Atmospheric Research, 64, pp I. Gultepe, R. Tardif, S. C. Michaelides,J. Cermak,A. Bott, J. Bendix, M. D. Muller, M. Pagowski, B. hansen,1 G. Ellrod, W. Jacobs, G. Toth, and S. G. Cober, (2007): Fog Research: A Review of Past Achievements and Future Perspectives, Pure appl. geophys. 164, PP Lange, C. A. Matschullat, J. Zimmermann, F. Sterzik, G. Wienhaus, O. (2003): Fog frequency and chemical composition of fog water-a relevant contribution to atmospheric deposition in the eastern Erzgebirge, Germany, Atmospheric Environment 37, PP Roach, W. T. (1995): Back to basics: Fog. Part-2, the formation and dissipation of land fog, weather, 50, pp.7-11 Singh, S., Singh, D. and Rao, V. U. M. (2007): Fog and Dew Analysis at Hisar, India Journal of Agrometeorology, 9(1), pp
Atmosphere and Weather Revision Notes
 Atmosphere and Weather Revision Notes Atmosphere The blanket of gases that surrounds the Earth is called the atmosphere. The main gases are nitrogen (78 %), oxygen (21 %), water vapour, ozone and carbon
according to and water. High atmospheric pressure - Cold dry air is other air so it remains close to the earth, giving weather.
 EARTH'S ATMOSPHERE Composition of the atmosphere - Earth's atmosphere consists of nitrogen ( %), oxygen ( %), small amounts of carbon dioxide, methane, argon, krypton, ozone, neon and other gases such
Guided Notes: Atmosphere Layers of the Atmosphere
 Guided Notes: Atmosphere Layers of the Atmosphere Atmosphere: Absorbs solar radiation, Burns up meteors, transports and recycles water, and other chemicals, and moderates climate Main Components: o Meteorology
25.1 Air Masses. Section 25.1 Objectives
 Section 25.1 Objectives Explain how an air mass forms. List the four main types of air masses. Describe how air masses affect the weather of North America. Air Masses 25.1 Air Masses Differences in air
Northern New England Climate: Past, Present, and Future. Basic Concepts
 Northern New England Climate: Past, Present, and Future Basic Concepts Weather instantaneous or synoptic measurements Climate time / space average Weather - the state of the air and atmosphere at a particular
Climatic Extreme Events over Iran: Observation and Future Projection
 3rd Meeting of COMSATS International Thematic Research Group on Climate Change and Environmental Protection (22nd January 2014, Islamabad, Pakistan) Climatic Extreme Events over Iran: Observation and Future
Mid-Latitude Cyclones and Fronts. Lecture 12 AOS 101
 Mid-Latitude Cyclones and Fronts Lecture 12 AOS 101 Homework 4 COLDEST TEMPS GEOSTROPHIC BALANCE Homework 4 FASTEST WINDS L Consider an air parcel rising through the atmosphere The parcel expands as it
DEPARTMENT OF EARTH & CLIMATE SCIENCES Name SAN FRANCISCO STATE UNIVERSITY Nov 29, ERTH 360 Test #2 200 pts
 DEPARTMENT OF EARTH & CLIMATE SCIENCES Name SAN FRANCISCO STATE UNIVERSITY Nov 29, 2018 ERTH 360 Test #2 200 pts Each question is worth 4 points. Indicate your BEST CHOICE for each question on the Scantron
Chapter 1 Anatomy of a Cyclone
 Chapter 1 Anatomy of a Cyclone The Beast in the East 15-17 February 2003 Extra-tropical cyclone an area of low pressure outside of the tropics Other names for extra-tropical cyclones: Cyclone Mid-latitude
Topic 1 The Atmosphere and Atmospheric Variables
 Name Notes: Topic 1 The Atmosphere Regents Earth Science Topic 1 The Atmosphere and Atmospheric Variables What is the atmosphere? Meteorology is the study of A. Structure of the Atmosphere: What two gases
General Circulation. Nili Harnik DEES, Lamont-Doherty Earth Observatory
 General Circulation Nili Harnik DEES, Lamont-Doherty Earth Observatory nili@ldeo.columbia.edu Latitudinal Radiation Imbalance The annual mean, averaged around latitude circles, of the balance between the
THE ATMOSPHERE IN MOTION
 Funding provided by NOAA Sectoral Applications Research Project THE ATMOSPHERE IN MOTION Basic Climatology Oklahoma Climatological Survey Factor 1: Our Energy Source Hi, I m the Sun! I provide 99.9999+
A. Weather - the conditions of the variables of the atmosphere for any short period of time
 WEATHER & THE ATMOSPHERE A. Weather - the conditions of the variables of the atmosphere for any short period of time Meteorology - the study of weather and weather related variables - the variables: Topic
Seasonal Climate Outlook for South Asia (June to September) Issued in May 2014
 Issued in May 2014") Ministry of Earth Sciences Earth System Science Organization India Meteorological Department WMO Regional Climate Centre (Demonstration Phase) Pune, India Seasonal Climate Outlook for South Asia (June
Ministry of Earth Sciences Earth System Science Organization India Meteorological Department WMO Regional Climate Centre (Demonstration Phase) Pune, India Seasonal Climate Outlook for South Asia (June
WEATHER. Review Note Cards
 WEATHER Review Note Cards Thermometer Weather instrument that measures air temperature Units include F, C, and K ESRT 13 Sling Psychrometer Weather instrument that measures relative humidity and dewpoint
ENSO: Recent Evolution, Current Status and Predictions. Update prepared by: Climate Prediction Center / NCEP 30 October 2017
 ENSO: Recent Evolution, Current Status and Predictions Update prepared by: Climate Prediction Center / NCEP 30 October 2017 Outline Summary Recent Evolution and Current Conditions Oceanic Niño Index (ONI)
CLIMATE. UNIT TWO March 2019
 CLIMATE UNIT TWO March 2019 OUTCOME 9.2.1Demonstrate an understanding of the basic features of Canada s landscape and climate. identify and locate major climatic regions of Canada explain the characteristics
Forecasting Local Weather
 Forecasting Local Weather Sea/Land Breeze Temperature Dew Fog Frost Snow Thunderstorms Tropical Cyclones Temperatures: Radiation Balance Typical Diurnal Variation of Temperature Min soon after dawn Temp
IV. Atmospheric Science Section
 EAPS 100 Planet Earth Lecture Topics Brief Outlines IV. Atmospheric Science Section 1. Introduction, Composition and Structure of the Atmosphere Learning objectives: Understand the basic characteristics
Impacts of the April 2013 Mean trough over central North America
 Impacts of the April 2013 Mean trough over central North America By Richard H. Grumm National Weather Service State College, PA Abstract: The mean 500 hpa flow over North America featured a trough over
ENSO Cycle: Recent Evolution, Current Status and Predictions. Update prepared by Climate Prediction Center / NCEP 11 November 2013
 ENSO Cycle: Recent Evolution, Current Status and Predictions Update prepared by Climate Prediction Center / NCEP 11 November 2013 Outline Overview Recent Evolution and Current Conditions Oceanic Niño Index
Evidence for Weakening of Indian Summer Monsoon and SA CORDEX Results from RegCM
 Evidence for Weakening of Indian Summer Monsoon and SA CORDEX Results from RegCM S K Dash Centre for Atmospheric Sciences Indian Institute of Technology Delhi Based on a paper entitled Projected Seasonal
Eurasian Snow Cover Variability and Links with Stratosphere-Troposphere Coupling and Their Potential Use in Seasonal to Decadal Climate Predictions
 US National Oceanic and Atmospheric Administration Climate Test Bed Joint Seminar Series NCEP, Camp Springs, Maryland, 22 June 2011 Eurasian Snow Cover Variability and Links with Stratosphere-Troposphere
Science 1206 Chapter 1 - Inquiring about Weather
 Science 1206 Chapter 1 - Inquiring about Weather 1.1 - The Atmosphere: Energy Transfer and Properties (pp. 10-25) Weather and the Atmosphere weather the physical conditions of the atmosphere at a specific
Lecture 07 February 10, 2010 Water in the Atmosphere: Part 1
 Lecture 07 February 10, 2010 Water in the Atmosphere: Part 1 About Water on the Earth: The Hydrological Cycle Review 3-states of water, phase change and Latent Heat Indices of Water Vapor Content in the
Nonlinear atmospheric response to Arctic sea-ice loss under different sea ice scenarios
 Nonlinear atmospheric response to Arctic sea-ice loss under different sea ice scenarios Hans Chen, Fuqing Zhang and Richard Alley Advanced Data Assimilation and Predictability Techniques The Pennsylvania
COMPOSITION OF THE ATMOSPHERE
 Name Air COMPOSITION OF THE ATMOSPHERE 1. What are the two most abundant gases in the atmospherere? 2. Why do you think the percentage of water vapor in the air varies? 3. Would you classify carbon dioxide
KUALA LUMPUR MONSOON ACTIVITY CENT
 T KUALA LUMPUR MONSOON ACTIVITY CENT 2 ALAYSIAN METEOROLOGICAL http://www.met.gov.my DEPARTMENT MINISTRY OF SCIENCE. TECHNOLOGY AND INNOVATIO Introduction Atmospheric and oceanic conditions over the tropical
ENSO Cycle: Recent Evolution, Current Status and Predictions. Update prepared by Climate Prediction Center / NCEP 15 July 2013
 ENSO Cycle: Recent Evolution, Current Status and Predictions Update prepared by Climate Prediction Center / NCEP 15 July 2013 Outline Overview Recent Evolution and Current Conditions Oceanic Niño Index
Meteorology. Circle the letter that corresponds to the correct answer
 Chapter 3 Worksheet 1 Meteorology Name: Circle the letter that corresponds to the correct answer 1) If the maximum temperature for a particular day is 26 C and the minimum temperature is 14 C, the daily
Climate. Annual Temperature (Last 30 Years) January Temperature. July Temperature. Average Precipitation (Last 30 Years)
 January Temperature. July Temperature. Average Precipitation (Last 30 Years)") Climate Annual Temperature (Last 30 Years) Average Annual High Temp. (F)70, (C)21 Average Annual Low Temp. (F)43, (C)6 January Temperature Average January High Temp. (F)48, (C)9 Average January Low Temp.
Climate Annual Temperature (Last 30 Years) Average Annual High Temp. (F)70, (C)21 Average Annual Low Temp. (F)43, (C)6 January Temperature Average January High Temp. (F)48, (C)9 Average January Low Temp.
ESCI 344 Tropical Meteorology Lesson 7 Temperature, Clouds, and Rain
 ESCI 344 Tropical Meteorology Lesson 7 Temperature, Clouds, and Rain References: Forecaster s Guide to Tropical Meteorology (updated), Ramage Tropical Climatology, McGregor and Nieuwolt Climate and Weather
Week: Dates: 3/2 3/20 Unit: Climate
 clementaged.weebly.com Name: EVEN Period: Week: 28 30 Dates: 3/2 3/20 Unit: Climate Monday Tuesday Wednesday Thursday Friday 2 O 3 E *Vocabulary *Water in the Atmosphere and Clouds Notes *Cloud Drawings
ENSO Cycle: Recent Evolution, Current Status and Predictions. Update prepared by Climate Prediction Center / NCEP 23 April 2012
 ENSO Cycle: Recent Evolution, Current Status and Predictions Update prepared by Climate Prediction Center / NCEP 23 April 2012 Outline Overview Recent Evolution and Current Conditions Oceanic Niño Index
California 120 Day Precipitation Outlook Issued Tom Dunklee Global Climate Center
 California 120 Day Precipitation Outlook Issued 11-01-2008 Tom Dunklee Global Climate Center This is my second updated outlook for precipitation patterns and amounts for the next 4 s of the current rainy
Chapter outline. Reference 12/13/2016
 Chapter 2. observation CC EST 5103 Climate Change Science Rezaul Karim Environmental Science & Technology Jessore University of science & Technology Chapter outline Temperature in the instrumental record
Mid-latitude Cyclones & Air Masses
 Lab 9 Mid-latitude Cyclones & Air Masses This lab will introduce students to the patterns of surface winds around the center of a midlatitude cyclone of low pressure. The types of weather associated with
also known as barometric pressure; weight of the air above the surface of the earth; measured by a barometer air pressure, high
 Weather Vocabulary Vocabulary Term Meaning/Definition air mass * large bodies of air that have the similar properties throughout such as temperature, humidity, and air pressure; causes most of the weather
The Atmospheric Circulation
 The Atmospheric Circulation Vertical structure of the Atmosphere http://www.uwsp.edu/geo/faculty/ritter/geog101/textbook/atmosphere/atmospheric_structure.html The global heat engine [courtesy Kevin Trenberth,
4/29/2011. Mid-latitude cyclones form along a
 Chapter 10: Cyclones: East of the Rocky Mountain Extratropical Cyclones Environment prior to the development of the Cyclone Initial Development of the Extratropical Cyclone Early Weather Along the Fronts
LAB J - WORLD CLIMATE ZONES
 Introduction LAB J - WORLD CLIMATE ZONES The objective of this lab is to familiarize the student with the various climates around the world and the climate controls that influence these climates. Students
Practical Atmospheric Analysis
 Chapter 12 Practical Atmospheric Analysis With the ready availability of computer forecast models and statistical forecast data, it is very easy to prepare a forecast without ever looking at actual observations,
Assessment Schedule 2017 Earth and Space Science: Demonstrate understanding of processes in the atmosphere system (91414)
") NCEA Level 3 Earth and Space Science (91414) 2017 page 1 of 6 Assessment Schedule 2017 Earth and Space Science: Demonstrate understanding of processes in the atmosphere system (91414) Evidence Statement
NCEA Level 3 Earth and Space Science (91414) 2017 page 1 of 6 Assessment Schedule 2017 Earth and Space Science: Demonstrate understanding of processes in the atmosphere system (91414) Evidence Statement
Prediction of western disturbances and associated weather over Western Himalayas
 Prediction of western disturbances and associated weather over Western Himalayas H. R. Hatwar*, B. P. Yadav and Y. V. Rama Rao India Meteorological Department, Lodi Road, New Delhi 110 003, India Two cases
ENSO Cycle: Recent Evolution, Current Status and Predictions. Update prepared by Climate Prediction Center / NCEP 5 August 2013
 ENSO Cycle: Recent Evolution, Current Status and Predictions Update prepared by Climate Prediction Center / NCEP 5 August 2013 Outline Overview Recent Evolution and Current Conditions Oceanic Niño Index
Wind: Global Systems Chapter 10
 Wind: Global Systems Chapter 10 General Circulation of the Atmosphere General circulation of the atmosphere describes average wind patterns and is useful for understanding climate Over the earth, incoming
The Transfer of Heat
 The Transfer of Heat Outcomes: S2-4-03 Explain effects of heat transfer within the atmosphere and hydrosphere on the development and movement of wind and ocean currents. Coriolis Effect In our ecology
Unit 4 Review Guide: Weather
 Unit 4 Review Guide: Weather Weather: The condition of the atmosphere at a specific time and place. Freezing: To become hardened into ice or into a solid body Deposition: The change in state of matter
The Atmosphere of Earth
 The Atmosphere of Earth The probability of a storm can be predicted, but nothing can be done to stop or slow a storm. Understanding the atmosphere may help in predicting weather changes, but it is doubtful
1. Which weather map symbol is associated with extremely low air pressure? A) B) C) D) 2. The diagram below represents a weather instrument.
 B) C) D) 2. The diagram below represents a weather instrument.") 1. Which weather map symbol is associated with extremely low air pressure? 2. The diagram below represents a weather instrument. Which weather variable was this instrument designed to measure? A) air pressure
1. Which weather map symbol is associated with extremely low air pressure? 2. The diagram below represents a weather instrument. Which weather variable was this instrument designed to measure? A) air pressure
UPDATE OF REGIONAL WEATHER AND SMOKE HAZE (December 2017)
") UPDATE OF REGIONAL WEATHER AND SMOKE HAZE (December 2017) 1. Review of Regional Weather Conditions for November 2017 1.1 In November 2017, Southeast Asia experienced inter-monsoon conditions in the first
UPDATE OF REGIONAL WEATHER AND SMOKE HAZE (December 2017) 1. Review of Regional Weather Conditions for November 2017 1.1 In November 2017, Southeast Asia experienced inter-monsoon conditions in the first
Energy Systems, Structures and Processes Essential Standard: Analyze patterns of global climate change over time Learning Objective: Differentiate
 Energy Systems, Structures and Processes Essential Standard: Analyze patterns of global climate change over time Learning Objective: Differentiate between weather and climate Global Climate Focus Question
Synoptic Analysis of Total Rainfall Patterns at Azerbaijan District.
 Synoptic Analysis of Total Rainfall Patterns at Azerbaijan District Samad Vahdati 1, Shahrokh Shahrokhi Shirvani 2, Abolfazl Nazari Giglou 3 1,3 Department of Civil Engineering, Parsabad Moghan Branch,
Weather and Climate Summary and Forecast December 2017 Report
 Weather and Climate Summary and Forecast December 2017 Report Gregory V. Jones Linfield College December 5, 2017 Summary: November was relatively cool and wet from central California throughout most of
Weather. Describing Weather
 CHAPTER 13 Weather LESSON 1 Describing Weather What do you think? Read the two statements below and decide whether you agree or disagree with them. Place an A in the Before column if you agree with the
True or false: The atmosphere is always in hydrostatic balance. A. True B. False
 Clicker Questions and Clicker Quizzes Clicker Questions Chapter 7 Of the four forces that affect the motion of air in our atmosphere, which is to thank for opposing the vertical pressure gradient force
1 What Is Climate? TAKE A LOOK 2. Explain Why do areas near the equator tend to have high temperatures?
 CHAPTER 17 1 What Is Climate? SECTION Climate BEFORE YOU READ After you read this section, you should be able to answer these questions: What is climate? What factors affect climate? How do climates differ
Climate and the Atmosphere
 Climate and Biomes Climate Objectives: Understand how weather is affected by: 1. Variations in the amount of incoming solar radiation 2. The earth s annual path around the sun 3. The earth s daily rotation
The Atmosphere EVPP 110 Lecture Fall 2003 Dr. Largen
 1 Physical Environment: EVPP 110 Lecture Fall 2003 Dr. Largen 2 Physical Environment: Atmosphere Composition Heat transfer Atmospheric moisture Atmospheric circulation Weather and climate 3 Physical Environment:
5 Atmospheric Disturbances 7 1.Cyclones- tropical and temperate and associated weather conditions. 2.Anticyclones and associated weather conditions.
 5 Atmospheric Disturbances 7 1.Cyclones- tropical and temperate and associated weather conditions. 2.Anticyclones and associated weather conditions. atmospheric disturbances (weather systems) that are
Guided Notes Weather. Part 1: Weather Factors Temperature Humidity Air Pressure Winds Station Models
 Guided Notes Weather Part 1: Weather Factors Temperature Humidity Air Pressure Winds Station Models. 1. What is weather? Weather: short-term atmospheric conditions in a specific area at a specific time
Go With the Flow From High to Low Investigating Isobars
 Go With the Flow From High to Low Investigating Isobars Science 10 Mrs. Purba Air Masses The air over a warm surface can be heated, causing it to rise above more dense air. The result is the formation
Meteorology. I. The Atmosphere - the thin envelope of gas that surrounds the earth.
 Meteorology I. The Atmosphere - the thin envelope of gas that surrounds the earth. A. Atmospheric Structure - the atmosphere is divided into five distinct layers that are based on their unique characteristics.
What factors affect climate? Dr. Michael J Passow
 What factors affect climate? Dr. Michael J Passow Energy from the Sun (mostly light and heat) radiates to Earth SUN 150 x 10 6 km (92 x 10 6 mi) EARTH Challenge: If the speed of light is 300,000 km/sec,
GEOGRAPHY AND HISTORY
 GEOGRAPHY AND HISTORY YEAR 1, PART 1 www.vicensvives.es Contents 01 Our planet Earth 02 The representation of the Earth: maps 03 The Earth s relief 04 Rivers and seas 05 Weather and climate 06 Climates
Tropical Storm Hermine: Heavy rainfall in western Gulf By Richard H. Grumm National Weather Service Office State College, PA 16803
 Tropical Storm Hermine: Heavy rainfall in western Gulf By Richard H. Grumm National Weather Service Office State College, PA 16803 1. INTRODUCTION Tropical storm Hermine, the eighth named tropical system
MAURITIUS METEOROLOGICAL SERVICES
 MAURITIUS METEOROLOGICAL SERVICES CLIMATE SEPTEMBER 2018 Introduction Synoptic weather pattern over the region portrayed September as a transition month. The month started with wintry characteristics.
1) What is the theory of plate tectonics? a. The lithosphere (top layer) floats on top of the partially molten layer under it (asthenosphere).
 What is the theory of plate tectonics? a. The lithosphere (top layer) floats on top of the partially molten layer under it (asthenosphere).") 1) What is the theory of plate tectonics? a. The lithosphere (top layer) floats on top of the partially molten layer under it (asthenosphere). Convection currents underneath are the main cause for the
1) What is the theory of plate tectonics? a. The lithosphere (top layer) floats on top of the partially molten layer under it (asthenosphere). Convection currents underneath are the main cause for the
p = ρrt p = ρr d = T( q v ) dp dz = ρg
 dp dz = ρg") Chapter 1: Properties of the Atmosphere What are the major chemical components of the atmosphere? Atmospheric Layers and their major characteristics: Troposphere, Stratosphere Mesosphere, Thermosphere
Chapter 1: Properties of the Atmosphere What are the major chemical components of the atmosphere? Atmospheric Layers and their major characteristics: Troposphere, Stratosphere Mesosphere, Thermosphere
3. As warm, moist air moves into a region, barometric pressure readings in the region will generally 1. decrease 2. increase 3.
 Teacher: Mr. Prizzi Castle Learning Review 1 1. Which process most directly results in cloud formation? 1. condensation 3. precipitation 2. transpiration 4. radiation 2. An air mass originating over north
ENSO: Recent Evolution, Current Status and Predictions. Update prepared by: Climate Prediction Center / NCEP 9 November 2015
 ENSO: Recent Evolution, Current Status and Predictions Update prepared by: Climate Prediction Center / NCEP 9 November 2015 Outline Summary Recent Evolution and Current Conditions Oceanic Niño Index (ONI)
RR#4 - Multiple Choice
 1. The map below shows the amount of snowfall, in inches, produced by a lake-effect snowstorm in central New York State. The wind that produced this snowfall pattern most likely came from the 1) northeast
ATMOSPHERIC ENERGY and GLOBAL TEMPERATURES. Physical Geography (Geog. 300) Prof. Hugh Howard American River College
 Prof. Hugh Howard American River College") ATMOSPHERIC ENERGY and GLOBAL TEMPERATURES Physical Geography (Geog. 300) Prof. Hugh Howard American River College RADIATION FROM the SUN SOLAR RADIATION Primarily shortwave (UV-SIR) Insolation Incoming
ATMOSPHERIC ENERGY and GLOBAL TEMPERATURES Physical Geography (Geog. 300) Prof. Hugh Howard American River College RADIATION FROM the SUN SOLAR RADIATION Primarily shortwave (UV-SIR) Insolation Incoming
Weather and the Atmosphere. RAP Short Course
 Weather and the Atmosphere RAP Short Course Syllabus 1) Vertical structure and composition of the atmosphere, basic weather variables 2) Warming Earth and its atmosphere the diurnal and seasonal cycles
Topic # 11 HOW CLIMATE WORKS continued (Part II) pp in Class Notes
 pp in Class Notes") Topic # 11 HOW CLIMATE WORKS continued (Part II) pp 61-67 in Class Notes To drive the circulation, the initial source of energy is from the Sun: Not to scale! EARTH- SUN Relationships 4 Things to Know
Topic # 11 HOW CLIMATE WORKS continued (Part II) pp 61-67 in Class Notes To drive the circulation, the initial source of energy is from the Sun: Not to scale! EARTH- SUN Relationships 4 Things to Know
b. The boundary between two different air masses is called a.
 NAME Earth Science Weather WebQuest Part 1. Air Masses 1. Find out what an air mass is. http://okfirst.mesonet.org/train/meteorology/airmasses.html a. What is an air mass? An air mass is b. The boundary
Warm Up 1: Atmosphere LT I can describe dew point, condensation nuclei and explain the difference between relative and absolute humidity.
 Warm Up 1: Atmosphere 2-8-17 LT I can describe dew point, condensation nuclei and explain the difference between relative and absolute humidity. Q1 List as many layers of the atmosphere as you can remember.
Solutions Manual to Exercises for Weather & Climate, 8th ed. Appendix A Dimensions and Units 60 Appendix B Earth Measures 62 Appendix C GeoClock 63
 Solutions Manual to Exercises for Weather & Climate, 8th ed. 1 Vertical Structure of the Atmosphere 1 2 Earth Sun Geometry 4 3 The Surface Energy Budget 8 4 The Global Energy Budget 10 5 Atmospheric Moisture
Summary and Conclusions
 241 Chapter 10 Summary and Conclusions Kerala is situated in the southern tip of India between 8 15 N and 12 50 N latitude and 74 50 E and 77 30 E longitude. It is popularly known as Gods own country.
Three things necessary for weather are Heat, Air, Moisture (HAM) Weather takes place in the Troposphere (The lower part of the atmosphere).
 Weather takes place in the Troposphere (The lower part of the atmosphere).") Grade 5 SCIENCE WEATHER WATCH Name: STUDY NOTES Weather - The condition of the atmosphere with respect to heat/cold, wetness/dryness, clearness/ cloudiness for a period of time. Weather changes over time
Grade 5 SCIENCE WEATHER WATCH Name: STUDY NOTES Weather - The condition of the atmosphere with respect to heat/cold, wetness/dryness, clearness/ cloudiness for a period of time. Weather changes over time
Page 1. Name:
 Name: 1) As the difference between the dewpoint temperature and the air temperature decreases, the probability of precipitation increases remains the same decreases 2) Which statement best explains why
The Atmosphere. Topic 3: Global Cycles and Physical Systems. Topic 3: Global Cycles and Physical Systems. Topic 3: Global Cycles and Physical Systems
 The Atmosphere 1 How big is the atmosphere? Why is it cold in Geneva? Why do mountaineers need oxygen on Everest? 2 A relatively thin layer of gas over the Earths surface Earth s radius ~ 6400km Atmospheric
Suppressed Surface Heating over northwestern parts of the Country and the ensuing Monsoon Rainfall
 Suppressed Surface Heating over northwestern parts of the Country and the ensuing Monsoon Rainfall During this year, the temperatures have been below normal over north and northwestern parts of India.
Return periods of prolonged fog events in Canada
 Return periods of prolonged fog events in Canada 43th Annual Congress of the Canadian Meteorological and Oceanographic Society, Halifax, NS, 31 May 4 June 2009 Authors: Bjarne Hansen (Science and Technology
The Spatial Analysis of Insolation in Iran
 The Spatial Analysis of Insolation in Iran M. Saligheh, F. Sasanpour, Z. Sonboli & M. Fatahi Department of Geography, Tehran Tarbiat Moallem University, Iran E-mail: salighe@hamoon.usb.ac.ir; far20_sasanpour@yahoo.com;
STATION If relative humidity is 60% and saturation vapor pressure is 35 mb, what is the actual vapor pressure?
 STATION 1 Vapor pressure is a measure of relative humidity and saturation vapor pressure. Using this information and the information given in the problem, answer the following question. 1. If relative
Condensation: Dew, Fog and Clouds AT350
 Condensation: Dew, Fog and Clouds AT350 T=30 C Water vapor pressure=12mb What is Td? What is the sat. water vapor T=30 C Water vapor pressure=12mb What is Td? What is the sat. water vapor ~12/42~29% POLAR
78% : component of atmosphere! 21% : 1% : Changes depending on origin of air: - originated over - originated over Ozone = O 3 Definition:
 Unit 6 Part 1 Meteorology Name: Composition and Structure of the Atmosphere SWBAT: Describe the composition of the atmosphere. Diagram/describe the layers of the earth s atmosphere. Weather Climate Atmospheric
Chapter 12 Fronts & Air Masses
 Chapter overview: Anticyclones or highs Air Masses o Classification o Source regions o Air masses of North America Fronts o Stationary fronts o Cold fronts o Warm fronts o Fronts and the jet stream o Frontogenesis
ENSO Cycle: Recent Evolution, Current Status and Predictions. Update prepared by Climate Prediction Center / NCEP 24 September 2012
 ENSO Cycle: Recent Evolution, Current Status and Predictions Update prepared by Climate Prediction Center / NCEP 24 September 2012 Outline Overview Recent Evolution and Current Conditions Oceanic Niño
Weather Notes. Chapter 16, 17, & 18
 Weather Notes Chapter 16, 17, & 18 Weather Weather is the condition of the Earth s atmosphere at a particular place and time Weather It is the movement of energy through the atmosphere Energy comes from
Weather and Climate 1. Elements of the weather
 Weather and Climate 1 affect = to have an effect on, influence, change altitude = the height of a place above the sea axis = the line around which an object rotates certain = special consist of = to be
Name the surface winds that blow between 0 and 30. GEO 101, February 25, 2014 Monsoon Global circulation aloft El Niño Atmospheric water
 GEO 101, February 25, 2014 Monsoon Global circulation aloft El Niño Atmospheric water Name the surface winds that blow between 0 and 30 What is the atmospheric pressure at 0? What is the atmospheric pressure
Water Balance in the Murray-Darling Basin and the recent drought as modelled with WRF
 18 th World IMACS / MODSIM Congress, Cairns, Australia 13-17 July 2009 http://mssanz.org.au/modsim09 Water Balance in the Murray-Darling Basin and the recent drought as modelled with WRF Evans, J.P. Climate
2015: A YEAR IN REVIEW F.S. ANSLOW
 2015: A YEAR IN REVIEW F.S. ANSLOW 1 INTRODUCTION Recently, three of the major centres for global climate monitoring determined with high confidence that 2015 was the warmest year on record, globally.
3. HYDROMETEROLOGY. 3.1 Introduction. 3.2 Hydro-meteorological Aspect. 3.3 Rain Gauge Stations
 3. HYDROMETEROLOGY 3.1 Introduction Hydrometeorology is a branch of meteorology and hydrology that studies the transfer of water and energy between the land surface and the lower atmosphere. Detailed hydrological
UNIT TEST PRACTICE TEST
 Page 1 of 1 Directions: Match the best answer to complete each question. Some words may be used more than once and some may not be used at all. e 1. The condition of Earth s atmosphere at a given time
2. What are the four most common gasses in the atmosphere and their percentages?
 Meteorology Review Directions: Answer the following open ended review questions. Utilize a diagram where appropriate and do make sure that you label and describe the drawing. Atmospheric Composition 1.
3/31/17. No CLASS FRIDAY. End of subsidence unit. Next up: SEVERE WEATHER. Video - Severe Weather (Tornadoes) #23 - Weather - Principles I
 #23 - Weather - Principles I") No CLASS FRIDAY End of subsidence unit Next up: SEVERE WEATHER Exam 2: Wednesday April 5 th 7:15 PM, 141+151 Loomis Web Exercise #4 (Landslides): Due Today 11:59 PM Writing Assignment Information will
No CLASS FRIDAY End of subsidence unit Next up: SEVERE WEATHER Exam 2: Wednesday April 5 th 7:15 PM, 141+151 Loomis Web Exercise #4 (Landslides): Due Today 11:59 PM Writing Assignment Information will
Will a warmer world change Queensland s rainfall?
 Will a warmer world change Queensland s rainfall? Nicholas P. Klingaman National Centre for Atmospheric Science-Climate Walker Institute for Climate System Research University of Reading The Walker-QCCCE