Lab: Using Correlation Coefficient During Winter Events
|
|
|
- Marylou Stokes
- 5 years ago
- Views:
Transcription
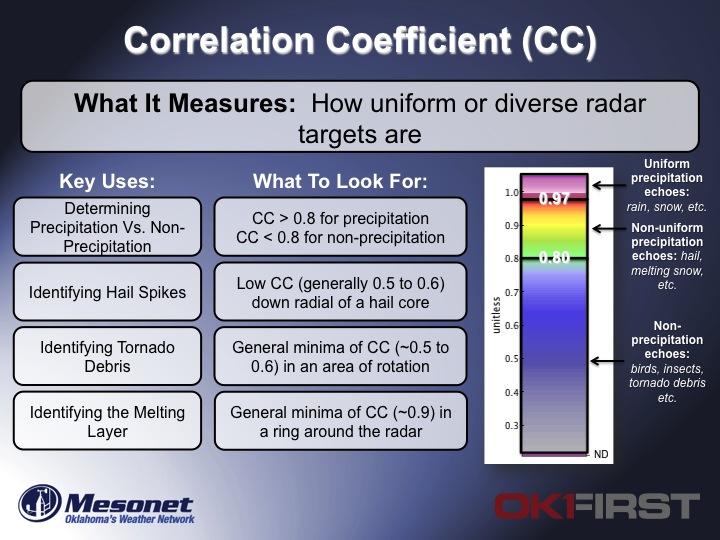
1 Lab: Using Correlation Coefficient During Winter Events Objective: In this lab exercise we will investigate a couple winter weather events from late 2013 to see how the correlation coefficient radar product could be used to help us identify changes in precipitation type. We will also take a look at Skew-T s and Mesonet data to diagnose precipitation type. Instructions: You will need to use the latest version of RadarFirst to complete this lab. Please read each question carefully and answer them as best you can in the space provided. You are welcome to work on your own or in a group. Region of Focus for this Exercise: For the purposes of this lab we will keep our attention on central Oklahoma and will only use the KTLX (Oklahoma City) radar. Terminology: The following are definitions of several meteorological terms you may see during this lab: Base Reflectivity (BREF) Radar product that measures how much of the radar s energy is reflected back to the radar. More particles and/or bigger particles reflect more energy. This is the most common radar product shown on TV. Correlation Coefficient (CC) Dual-pol radar product that measures how uniform or diverse radar targets are. The following are values and what they mean: o Values greater than 0.97 uniform precipitation o Values between 0.8 and 0.97 mixed precipitation (such as snow and sleet, sleet and freezing rain, etc.) o Values less than 0.8 non-precipitation targets Skew-T Diagram A way to plot information from a weather balloon that shows how temperatures, dew point temperatures, and winds change going upward in the atmosphere. Temperature lines are skewed diagonally giving this chart its funny name. Conditions nearest the ground are at the bottom of the chart, while conditions higher in the atmosphere are found by moving up the chart. 1

2 Cheat Sheets: 2
3 Lab Exercise: Open RadarFirst. Put the software in 2-pane mode (View à Two Panes) and make cities visible (Edit à Options à Show Cities). At the top of RadarFirst Go to Edit à Date... and set your date to 11/22/2013 and your time to 12:00PM. For your radar, choose KTLX Oklahoma City. In the left radar window pick radar product BREF2 and in the right radar window pick CC2. Your software should be set as follows: Radar Date Time Left Pane Right Pane KTLX Oklahoma City 11/22/ :00PM BREF2 (Base Reflectivity 2) CC2 (Correlation Coefficient 2) Question 1. Base Reflectivity shows what looks to be precipitation going through central Oklahoma. Looking at Correlation Coefficient in the right window, what do the dark red colors mean? What do the yellow colors in the right window mean? Question 2. What do we call the yellow area in Correlation Coefficient in the right window? Scroll your mouse over this yellow area in Correlation Coefficient. About how high up is it? Question 3. At the top of RadarFirst go to Edit à Date and change your time to 2:00PM. How has the shape of the yellow area in Correlation Coefficient changed since 12:00PM? Briefly describe. Question 4. Relying only on radar (not something we should do in reality!) make a prediction of the type of precipitation you think might be occurring in the OKC metro area that afternoon. 3
 from Norman is shown below in the bottom image.")
4 Question 5. 2PM Mesonet surface temperatures, freezing line (yellow), and winds plus radar Correlation Coefficient 2 are shown below in the top image. The 6PM Skew-T (with freezing line in blue) from Norman is shown below in the bottom image. Given this added information, what type of precipitation do you think occurred in the OKC metro that afternoon? 4
5 Let s check out another event. At the top of RadarFirst go to Edit à Date and change your date to December 5, 2013 and the time to 3:00PM. Make sure your software is set as follows: Radar Date Time Left Pane Right Pane KTLX Oklahoma City 12/5/2013 3:00PM BREF2 (Base Reflectivity 2) CC2 (Correlation Coefficient 2) Question 6. Describe what you are seeing in the Correlation Coefficient product in the right window. Again, what do the dark red colors mean? The yellow colors? Question 7. Scroll your mouse over the yellow area in Correlation Coefficient in the right window. About how high up is it? Question 8. Look at the reflectivity data in the left window. Describe what you are seeing. Question 9. Relying only on radar (again, not something we should do in reality!), make a prediction of the type of precipitation you think might be occurring in the OKC metro area that afternoon. 5
, and winds plus radar")
 from Norman is shown below in the bottom")
6 Question 10. 3PM Mesonet surface temperatures, freezing line (yellow), and winds plus radar Correlation Coefficient 2 are shown below in the top image. The 6PM Skew-T (with freezing line in blue) from Norman is shown below in the bottom image. Given this added information, what type of precipitation do you think occurred in the OKC metro that afternoon? 6
7 Let s move forward in time to the next morning. At the top of RadarFirst go to Edit à Date and change your date to December 6, 2013 and the time to 6:00AM. Make sure your software is set as follows: Radar Date Time Left Pane Right Pane KTLX Oklahoma City 12/6/2013 6:00AM BREF2 (Base Reflectivity 2) CC2 (Correlation Coefficient 2) Question 11. We have moved forward in time 15 hours. Describe how the Correlation Coefficient product in the right window has changed from earlier. What is different? Question 12. Base Reflectivity data has a different appearance than it did 15 hours ago. Describe it. What is the highest reflectivity value you can find? Question 13. Again only using radar, what is your prediction of precipitation type in the OKC metro area that morning? 7
,")


8 Question 14. 6AM Mesonet surface temperatures, freezing line (yellow), and winds plus radar Correlation Coefficient 2 are shown below in the top image. The 6AM Skew-T (with freezing line in blue) from Norman is shown below in the bottom image. Given this added information, what type of precipitation do you think occurred in the OKC metro that morning? 8
June 17, 2015 Lab Exercise
 June 17, 2015 Lab Exercise Objective: To become comfortable with: Interpreting heavy rainfall forecast products and ingredients before an event (Part 1) Monitoring key heavy rainfall products during an
Dual-Pol RadarFirst Lab Exercise
 Dual-Pol RadarFirst Lab Exercise Possible Uses of Dual-Pol Radar Data for Emergency Management Objective: This exercise serves as a first introduction to using dual-pol radar data. In the lab, you will
ESCI 1010 Lab 6 Midlatitude Cyclones and Thunderstorms
 ESCI 1010 Lab 6 Midlatitude Cyclones and Thunderstorms Before Lab: Review pages 244-324 in your Weather and Climate textbook. Pay special attention to the sections entitled Fronts, Life Cyclone of a Midlatitude
Department of Earth & Climate Sciences San Francisco State University Fall 2018 ERTH 360. Homework #1 Answer Sheet (Graphics Online) 100 points
 100 points") Department of Earth & Climate Sciences Name San Francisco State University Fall 2018 ERTH 360 Homework #1 Answer Sheet (Graphics Online) 100 points (Due Beginning of Class, Thursday 20 September 2018)
Department of Earth & Climate Sciences Name San Francisco State University Fall 2018 ERTH 360 Homework #1 Answer Sheet (Graphics Online) 100 points (Due Beginning of Class, Thursday 20 September 2018)
How to Effectively Use Weather Radar. Presented by: Robert Reale Company:
 How to Effectively Use Weather Radar Presented by: Robert Reale Company: Who Am I? What is WeatherWorks? WeatherWorks Private weather consulting firm located in Hackettstown, NJ Over 30 years in the snow
Department of Earth & Climate Sciences San Francisco State University Fall 2016 ERTH 360. Homework #1 Answer Sheet (Graphics Online) 100 points
 100 points") Department of Earth & Climate Sciences Name San Francisco State University Fall 2016 ERTH 360 Homework #1 Answer Sheet (Graphics Online) 100 points (Due Beginning of Class, Thursday 22 September 2016)
Department of Earth & Climate Sciences Name San Francisco State University Fall 2016 ERTH 360 Homework #1 Answer Sheet (Graphics Online) 100 points (Due Beginning of Class, Thursday 22 September 2016)
Weather Unit. Daily Weather:
 Satellites, Weather and Climate Lesson plan summary: Weather Created by: Richard Meyer Burlington High School, Burlington VT Grade Level: 9-12 Curriculum Target Benchmarks: Subject keywords: Weather, Unisys
WEATHER NOTIFICATION STATEMENT
 WEATHER NOTIFICATION STATEMENT NEW DATA SHOWS SNOWSTORM THREAT FOR JAN 13-14 LOOKS MUCH HEAVIER BIGGER COVERAGE northwest NC (ice) ALL OF VA (Except Hampton Roads) all of MD/ DEL eastern southern PA southern
Introduction to the College of DuPage NEXLAB Website
 Introduction to the College of DuPage NEXLAB Website The purpose of this lab is to familiarize yourself with our website so that you will have an easier time following along in class and will be able to
ANSWER KEY. Part I: Synoptic Scale Composite Map. Lab 12 Answer Key. Explorations in Meteorology 54
 ANSWER KEY Part I: Synoptic Scale Composite Map 1. Using Figure 2, locate and highlight, with a black dashed line, the 500-mb trough axis. Also, locate and highlight, with a black zigzag line, the 500-mb
Meteorology Unit Study Guide
 Name: Key Pd. Date: 1. Define meteorology Meteorology Unit Study Guide Study of the atmosphere including weather and weather patterns 2. The most abundant gas in the atmosphere by volume is. This gas comprises
Examination #3 Wednesday, 28 November 2001
 Name & Signature Dr. Droegemeier Student ID Meteorology 1004 Introduction to Meteorology Fall, 2001 Examination #3 Wednesday, 28 November 2001 BEFORE YOU BEGIN!! Please be sure to read each question CAREFULLY
The Sun and Water Cycle
 Have you ever jumped in a puddle or played in the rain? If so, you know you can get very wet. What you may not know is that a dinosaur could have walked through that same water millions of years ago. The
Winter Storm Saturday into Sunday December 14-15, 2013
 Winter Storm Saturday into Sunday December 14-15, 2013 Prepared 900 AM EST Friday December 13, 2013 Al Cope NOAA s NJ Forecast office http://www.erh.noaa.gov/phi/ Purpose of Briefing Briefing #3 for event.
IWT Scenario 2 Integrated Warning Team Workshop National Weather Service Albany, NY October 31, 2014
 IWT Scenario 2 Integrated Warning Team Workshop National Weather Service Albany, NY October 31, 2014 09 10 11 12 13 Scenario 2 Timeline December 9-13 Tue Wed Thu Fri Sat Tue, Dec. 9 @ 5 am 2014 2014 2014
Weather Compass Webquest: Lab/Activity Edition
 Weather Compass Webquest: Lab/Activity Edition www.weathercompass.webs.com 1 Name: Date: Welcome to the Weather Compass Webquest: Activity/Lab Edition. This webquest was created by the National Oceanic
Chemistry 14CL. Worksheet for the Molecular Modeling Workshop. (Revised FULL Version 2012 J.W. Pang) (Modified A. A. Russell)
 (Modified A. A. Russell)") Chemistry 14CL Worksheet for the Molecular Modeling Workshop (Revised FULL Version 2012 J.W. Pang) (Modified A. A. Russell) Structure of the Molecular Modeling Assignment The molecular modeling assignment
Chemistry 14CL Worksheet for the Molecular Modeling Workshop (Revised FULL Version 2012 J.W. Pang) (Modified A. A. Russell) Structure of the Molecular Modeling Assignment The molecular modeling assignment
Winter Weather. National Weather Service Buffalo, NY
 Winter Weather National Weather Service Buffalo, NY Average Seasonal Snowfall SNOWFALL = BIG IMPACTS School / government / business closures Airport shutdowns/delays Traffic accidents with injuries/fatalities
The Word Art features of Word allows the user to create stylized text with various special effects such as textures, outlines and shapes.
 Overview: During this lesson, students use Word Art and the text box tool in Microsoft Word to describe a word related to weather. After printing the page they illustrate the weather word. Objectives:
Pressure Conversion in Millibars
 Name Date The Weather Map Biggie Lab: Make it Colorful and Purty! Now that you have learned about all of the different variables that contribute to daily changes in weather, it is now time to bring it
WEATHER ON WHEELS Elementary School Program
 WEATHER ON WHEELS Elementary School Program MAST ACADEMY OUTREACH On-Site Packet Miami-Dade County Public Schools Miami, Florida MAST ACADEMY OUTREACH WEATHER ON WHEELS ELEMENTARY ON-SITE HIGHLIGHTS PACKET
NWS Resources For School Districts
 NWS Resources For School Districts January 23rd, 2017 Shawn DeVinny shawn.devinny@noaa.gov Meteorologist National Weather Service Twin Cities/Chanhassen, MN Outline Watches/Warnings/Advisories Example
Watching the Weather
 Watching the Weather Topic Observing the weather Key Question What is the weather like today? Focus Students will observe and record weather conditions over a long period of time. Guiding Documents NCTM
Maps and Remote Sensing AOSC 200 Tim Canty
 Maps and Remote Sensing AOSC 200 Tim Canty Class Web Site: http://www.atmos.umd.edu/~tcanty/aosc200 Topics for today: Weather Maps Radar Satellite Observations Lecture 04 Feb 7 2019 1 Today s Weather Map
Chapter 5: Weather. Only Section 1: What is Weather?
 Chapter 5: Weather Only Section 1: What is Weather? Find the definitions of: Meteorology, meteorologist, weather, climate Not in book? Use the dictionaries **Meteorology - Meteorology is the study of the
Forecast Models. General Meteorology Laboratory #11
 General Meteorology Laboratory #11 Name Partners Forecast Models Date _ Section Purpose: Develop the ability to contour two dimensional data and use the resulting information to locate a cold front. Equipment:
Weather Briefing Mixed Winter Storm Event February 26-27, 2013
 Weather Briefing Mixed Winter Storm Event February 26-27, 2013 Prepared 1200 PM EST Tuesday, February 26th, 2013 Joe Miketta NOAA s NJ Forecast Office http://www.erh.noaa.gov/phi/ Purpose of Briefing Briefing
Denver International Airport MDSS Demonstration Verification Report for the Season
 Denver International Airport MDSS Demonstration Verification Report for the 2014-2015 Season Prepared by the University Corporation for Atmospheric Research Research Applications Division (RAL) Seth Linden
Remote Sensing Observations AOSC 200 Tim Canty
 Remote Sensing Observations AOSC 200 Tim Canty Class Web Site: http://www.atmos.umd.edu/~tcanty/aosc200 Topics for today: Maps Radar Satellite Observations Lecture 04 Feb 7 2019 1 Today s Weather Map http://www.wpc.ncep.noaa.gov/sfc/namussfcwbg.gif
Temperature Changes OBJECTIVES PREPARATION SCHEDULE MATERIALS. The students. For each student. For each team of two. For the class
 activity 3 Temperature Changes OBJECTIVES Students observe changes in air temperature and discover the role of the Sun in heating Earth. The students measure and record outdoor air temperature at three
Module 11: Meteorology Topic 5 Content: Weather Maps Notes
 Introduction A variety of weather maps are produced by the National Weather Service and National Oceanographic Atmospheric Administration. These maps are used to help meteorologists accurately predict
Graphing the Weather. Main Core Tie
 Graphing the Weather Summary Students take weather readings using simple weather instruments and predict the weather in this lesson. They take readings for a month during a season and chart it. With the
Studying Topography, Orographic Rainfall, and Ecosystems (STORE)
") Studying Topography, Orographic Rainfall, and Ecosystems (STORE) Introduction Basic Lesson 3: Using Microsoft Excel to Analyze Weather Data: Topography and Temperature This lesson uses NCDC data to compare
Studying Topography, Orographic Rainfall, and Ecosystems (STORE) Introduction Basic Lesson 3: Using Microsoft Excel to Analyze Weather Data: Topography and Temperature This lesson uses NCDC data to compare
ERTH 365 Homework #2: Hurricane Harvey. 100 points
 ERTH 365 Homework #2: Hurricane Harvey 100 points Due by 6pm, Tuesday 30 October 2018, ELECTRONIC SUBMISSON BY EMAIL ONLY BY 6PM (send to klevey@sfsu.edu) (acceptable formats: MS Word, Google Doc, plain
Copyright 2015 Edmentum All rights reserved.
 Copyright 2015 Edmentum All rights reserved. weather 1 1. Sharon woke up on a sunny morning and ate breakfast. Then she looked outside and saw tall, quickly forming clouds. The clouds looked ready to rain.
February 2011: A Month of Below Average Temperatures, A Record Cold Snap, and a Sharp Frontal Passage with Snow
 1 Steven Mullen February 2011: A Month of Below Average Temperatures, A Record Cold Snap, and a Sharp Frontal Passage with Snow Overview of the Weather and Detail Diagnosis for Feb 25 th -27 th Daily surface
Linked Environments for Atmospheric Discovery: Web Services for Meteorological Research and Education
 Linked Environments for Atmospheric Discovery: Web Services for Meteorological Research and Education What Would YOU Do if These Were About to Occur? What THEY Do to Us!!! Each year in the US, mesoscale
General Meteorology Laboratory #11. Forecast Models
 General Meteorology Laboratory #11 Name Partners Forecast Models Date _ Section Purpose: Develop the ability to contour two dimensional data and use the resulting information to locate a cold front. Equipment:
Road Weather: The Science Behind What You Know
 The Weather Road Weather: The Science Behind What You Know Jon Tarleton Global Roads Marketing Manager Meteorologist Jon.tarleton@vaisala.com Page 2 / date / name / Internal use / Vaisala Weather and Our
Denver International Airport MDSS Demonstration Verification Report for the Season
 Denver International Airport MDSS Demonstration Verification Report for the 2015-2016 Season Prepared by the University Corporation for Atmospheric Research Research Applications Division (RAL) Seth Linden
Type of storm viewed by Spotter A Ordinary, multi-cell thunderstorm. Type of storm viewed by Spotter B Supecell thunderstorm
 ANSWER KEY Part I: Locating Geographical Features 1. The National Weather Service s Storm Prediction Center (www.spc.noaa.gov) has issued a tornado watch on a warm spring day. The watch covers a large
Name Class Date. 3. In what part of the water cycle do clouds form? a. precipitation b. evaporation c. condensation d. runoff
 Skills Worksheet Directed Reading B Section: Water in the Air 1. What do we call the condition of the atmosphere at a certain time and place? a. the water cycle b. weather c. climate d. precipitation THE
a. Air is more dense b. Associated with cold air (more dense than warm air) c. Associated with sinking air
 c. Associated with sinking air") Meteorology 1. Air pressure the weight of air pressing down on Earth 2. Temperature and altitude determine air pressure 3. The more air particles are present, the more air density or pressure exists 4.
Meteorology 1. Air pressure the weight of air pressing down on Earth 2. Temperature and altitude determine air pressure 3. The more air particles are present, the more air density or pressure exists 4.
08-Nov METARs and TAFs are shown in coded and decoded text format under the Airfield information where weather data is available.
 EasyWeather provides a direct weather interface from SA Weather Services to EasyPlan as overlays on your EasyPlan map. This service is available in South Africa only, at this stage. By using your internet
Precipitating Weather
 Title: Precipitating Weather (Meteorology) Grade Level(s): 6-8 Introduction: There has probably been a small increase in global precipitation over land during the twentieth century. When speaking of precipitation,
Understanding Common Storms and Weather Phenomena
 Understanding Common Storms and Weather Phenomena Overview: In teaching students about common storms and weather phenomena, the goal is for the student to be able to investigate and understand the basic
Coastal Storm this Weekend
 Weather Briefing Prepared 9 AM EST Feb 5, 2010 Joe Miketta Warning Coordination Meteorologist NOAA s National Weather Service Philadelphia/Mt. Holly NJ Forecast Office 609-261 261-6602 6602 x223 Joseph.Miketta@noaa.gov
Meeting the Needs of Oklahomans
 www.mesonet.org Volume 3 Issue 2 February 2012 connection Meeting the Needs of Oklahomans by Stephanie Bowen With parts of Oklahoma still in an extended drought and with warmer months ahead, the increased
McIDAS-V Tutorial Displaying Point Observations from ADDE Datasets updated July 2016 (software version 1.6)
") McIDAS-V Tutorial Displaying Point Observations from ADDE Datasets updated July 2016 (software version 1.6) McIDAS-V is a free, open source, visualization and data analysis software package that is the
McIDAS-V Tutorial Displaying Point Observations from ADDE Datasets updated July 2016 (software version 1.6) McIDAS-V is a free, open source, visualization and data analysis software package that is the
Severe Weather and weather mapping Remediation Assignment. Once the page has been approved, Mrs. Blinka will sign here:
 Severe Weather and weather mapping Remediation Assignment Part I: Complete the remediation page attached This will be a single page (front and back) that helps your organize the most important information
Department of Geosciences San Francisco State University Spring Metr 201 Monteverdi Quiz #5 Key (100 points)
") Department of Geosciences Name San Francisco State University Spring 2012 Metr 201 Monteverdi Quiz #5 Key (100 points) 1. Fill in the Blank or short definition. (3 points each for a total of 15 points)
Department of Geosciences Name San Francisco State University Spring 2012 Metr 201 Monteverdi Quiz #5 Key (100 points) 1. Fill in the Blank or short definition. (3 points each for a total of 15 points)
Jr. Meteorologist Club
 Vintage Math, Science and Technology Magnet School Jr. Meteorologist Club Hey, you 5 th Grade WeatherBugs Complete the four required activities plus two activities of your choice in this Jr. Meteorologist
Weather Predictor. NC Standards 5.E.1.1, 5.P.1.2 Page 28. Grade 5 Earth Science. Activity Description & Estimated Class Time.
 Weather Predictor NC Standards 5.E.1.1, 5.P.1.2 Page 28 Grade 5 Earth Science Throughout the guide, teaching tips are in red. Activity Description & Estimated Class Time In this 50-minute activity, students
MAST ACADEMY OUTREACH. WOW (Weather on Wheels)
") MAST ACADEMY OUTREACH ELEMENTARY SCHOOL PROGRAM Adventures Aboard WOW (Weather on Wheels) On-Site Packet MAST Academy Maritime and Science Technology High School Miami-Dade County Public Schools Miami,
MAST ACADEMY OUTREACH ELEMENTARY SCHOOL PROGRAM Adventures Aboard WOW (Weather on Wheels) On-Site Packet MAST Academy Maritime and Science Technology High School Miami-Dade County Public Schools Miami,
Study Guide. Earth Systems 1109 Weather Dynamics. Adult Basic Education Science. Prerequisites: Credit Value: 1
 Adult Basic Education Science Weather Dynamics Study Guide Prerequisites: None Credit Value: 1 Text: Science 10 ; Ritter, Plumb, et al; Nelson, 2001. Earth Systems Concentration Earth Systems 3109A Earth
anemometer a weather instrument that measures wind speed with wind-catching cups (SRB, IG)
") FOSS Weather on Earth Module Glossary 3 rd Edition 2012 absorb to soak in air the mixture of gases surrounding Earth air pressure the force exerted on a surface by the mass of the air above it anemometer
FOSS Weather on Earth Module Glossary 3 rd Edition 2012 absorb to soak in air the mixture of gases surrounding Earth air pressure the force exerted on a surface by the mass of the air above it anemometer
LAB 15. Lab 15. Air Masses and Weather Conditions: How Do the Motions and Interactions of Air Masses Result in Changes in Weather Conditions?
 Lab Handout Lab 15. Air Masses and Weather Conditions: How Do the Motions and Interactions of Air Masses Result in Changes in Weather Conditions? Introduction Meteorology is the study of the atmosphere.
Lab 19.2 Synoptic Weather Maps
 Lab 19.2 Synoptic Weather Maps Name: Partner: Purpose The purpose of this lab is to have you read and interpret the information displayed on synoptic weather maps. You will also learn the techniques used
Weather, Sun/Water Cycle, and Space. Test Review
 Weather, Sun/Water Cycle, and Space Test Review Weather Key Concept 1: Weather conditions can vary and change from day to day. Key Concept 2: We can use tools, such as rain gauges, wind vanes, and thermometers
Answer Questions 1 4
 Name Date Period Introduction: Even though the moon does not appear to turn on its own axis from the Earth s point of view, it is indeed rotating as it revolves around the Earth. In the following activity,
EDU /31 Elementary Science Methods 5E Weather Unit Unit Plan
 EDU 397-30/31 Elementary Science Methods 5E Weather Unit Unit Plan Unit Title: Weather Changes and Measurements Teacher: Mr. Colgrove/Dr. Leonard Grade Level: 4 Duration: 8 days (Lesson 1 requires data
A Complex Weather System: Tuesday Afternoon into Thursday March 3 5, 2015
 A Complex Weather System: Tuesday Afternoon into Thursday March 3 5, 2015 Briefing #1, prepared 900 AM EST Tuesday, March 3, 2015 by Meteorologists at NWS - WFO Mount Holly, NJ To promote situational awareness
MAST ACADEMY OUTREACH. WOW (Weather on Wheels)
") MAST ACADEMY OUTREACH ELEMENTARY PROGRAM Adventures Aboard WOW (Weather on Wheels) Teacher Instructions / Answer Keys MAST Academy Maritime and Science Technology High School Miami-Dade County Public Schools
MAST ACADEMY OUTREACH ELEMENTARY PROGRAM Adventures Aboard WOW (Weather on Wheels) Teacher Instructions / Answer Keys MAST Academy Maritime and Science Technology High School Miami-Dade County Public Schools
NWS Resources For Public Works
 NWS Resources For Public Works August 28th, 2016 Shawn DeVinny shawn.devinny@noaa.gov Meteorologist National Weather Service Twin Cities/Chanhassen, MN 1 APWA 2016 PWX 8/28/2016 National Weather Service
Oklahoma Weather. Adaptable for 4 th -5 th Grade. by Allison Cassady, Ph.D. Brought to you by:
 Oklahoma Weather Brought to you by: by Allison Cassady, Ph.D. Adaptable for 4 th -5 th Grade 4 th -5 th Grade Weather Unit Resources National Oceanic and Atmospheric Administration - http://www.srh.noaa.gov/srh/jetstream/clouds/cloudwise/types.html
I T A T I O N H B I T B T V A O C J K M R S A T M O S P H E R E
 Word Search Directions: Below are definitions of vocabulary terms. Figure out each term and then find and circle it in the puzzle. Words may appear horizontally, vertically, or diagonally. K E M I S S
WEATHER, CLIMATE, & NATURAL HAZARDS (3.ES.NGSS)
") TM WEATHER, CLIMATE, & NATURAL HAZARDS (3.ES.NGSS) UNIT AT A GLANCE ACTIVITY 1 - Weather Trackers QUESTIONS: How can two different areas have different weather conditions? How can we collect weather data
TM WEATHER, CLIMATE, & NATURAL HAZARDS (3.ES.NGSS) UNIT AT A GLANCE ACTIVITY 1 - Weather Trackers QUESTIONS: How can two different areas have different weather conditions? How can we collect weather data
This function is started with the TEST key on the reverse of the device. Proceed as follows:
 Operating Instructions With the Mete-On 1, you hold a genuine global innovation in your hands! Accordingly, putting it into operation and operating it requires a new kind of procedure. Please therefore
1. Base your answer to the following question on the weather map below, which shows a weather system that is affecting part of the United States.
 1. Base your answer to the following question on the weather map below, which shows a weather system that is affecting part of the United States. Which sequence of events forms the clouds associated with
Precipitation Processes METR σ is the surface tension, ρ l is the water density, R v is the Gas constant for water vapor, T is the air
 Precipitation Processes METR 2011 Introduction In order to grow things on earth, they need water. The way that the earth naturally irrigates is through snowfall and rainfall. Therefore, it is important
Name Date Hour Table. Chapter 12-AP Lesson One
 Name Date Hour Table 1. Chapter 12-AP Lesson One 2. 3. 4. 5. 6. 7. 8. 9. 10. 11. 12. 13. 14. 15. 16. 17. 18. 19. 20. 21. 22. Name Date Hour Table Directions: Answer each question to create your word bank.
Winter Storm Update. Through Late Afternoon: Jacksonville, FL Weather Forecast Office. Northeast Florida and Southeast Georgia
 Winter Storm Update Through Late Afternoon: Winter Storm Warning for all of Southeast GA and portions of Suwannee Valley and I-10 Corridor west of Jacksonville. Dangerous ice storm expected from Live Oak
Advanced Spotter Training Welcome! Lesson 1: Introduction and Why Spotters are Important
 Advanced Spotter Training 2009 Welcome! Lesson 1: Introduction and Why Spotters are Important Introduction This course is intended to advance the basic training given by the National Weather Service (NWS).
Remote Sensing in Meteorology: Satellites and Radar. AT 351 Lab 10 April 2, Remote Sensing
 Remote Sensing in Meteorology: Satellites and Radar AT 351 Lab 10 April 2, 2008 Remote Sensing Remote sensing is gathering information about something without being in physical contact with it typically
Dr. Christopher M. Godfrey University of North Carolina at Asheville
 Surface and Upper-Air Observations Surface Observations Collect information for synoptic-scale weather Most surface observations are automated (e.g., Automated Surface Observing System) Also mesoscale
WEATHER AND CLIMATE COMPLETING THE WEATHER OBSERVATION PROJECT CAMERON DOUGLAS CRAIG
 WEATHER AND CLIMATE COMPLETING THE WEATHER OBSERVATION PROJECT CAMERON DOUGLAS CRAIG Introduction The Weather Observation Project is an important component of this course that gets you to look at real
Coastal Storm. Wednesday through Friday, 3/6-8/2013 Weather Briefing
 Coastal Storm Wednesday through Friday, 3/6-8/2013 Weather Briefing Prepared 2:00 PM EST Wednesday, March 6, 2013 National Weather Service New York, NY Purpose of Briefing Promote Situational Awareness
Mr. P s Science Test!
 WEATHER- 2017 Mr. P s Science Test! # Name Date 1. Draw and label a weather station model. (10 pts) 2. The is the layer of the atmosphere with our weather. 3. Meteorologists classify clouds in about different
Did the Samoa Tsunami Affect the Movement of a Drifter in Monterey Bay? name
 Did the Samoa Tsunami Affect the Movement of a Drifter in Monterey Bay? name In this lab we will gain experience manipulating the drifter data in Google Earth. During the September 2009 deployment of the
Play Ball! Or Not. Whether the Weather will compel you to call the Game Off. Figure 1: Accuweather forecast outlook issued at 8:00 AM June 23, 2015
 Play Ball! Or Not. Whether the Weather will compel you to call the Game Off Part 1 June 23, 215 The Chatsworth Little League championship game is scheduled for a 6: PM first pitch. There is pressure to
Snow Measurement Guidelines for National Weather Service Snow Spotters
 Snow Measurement Guidelines for National Weather Service Snow Spotters National Weather Service Forecast Office Northern Indiana October 2004 Table of Contents Introduction 3 Definitions.. 3 Relaying Real
GEO165 LAB EXERCISE #3
 GEO165 LAB EXERCISE #3 Tools of the Meteorologist Part 2: Fronts Introduction 1. A front is the leading edge of a new air mass invading a region. Because Vilhelm Bjerknes was reminded of the bloody battle
7. The weather instrument below can be used to determine relative humidity.
 1. What is the dewpoint temperature when the dry-bulb temperature is 12 C and the wet-bulb temperature is 7 C? A) 1 C B) -2 C C) -5 C D) 4 C 2. A parcel of air has a dry-bulb temperature reading of 16
Weather Maps. Name:& & &&&&&Advisory:& & 1.! A&weather&map&is:& & & & 2.! Weather&fronts&are:& & & & & &
 Name: Advisory: Weather Maps 1. Aweathermapis: 2. Weatherfrontsare: a. Labelthefrontsbelow: 1. 2. 3. 4. 3. Clovercoversymbols 4. Precipitationsymbols 5. 6. 7. 8. 5. RadarEchoIntensityshows 6. Isobarsare
Graphing Sea Ice Extent in the Arctic and Antarctic
 Graphing Sea Ice Extent in the Arctic and Antarctic 1. Large amounts of ice form in some seasons in the oceans near the North Pole and the South Pole (the Arctic Ocean and the Southern Ocean). This ice,
How to display RGB imagery by SATAID
 How to display RGB imagery by SATAID Akihiro SHIMIZU Meteorological Satellite Center (MSC), Japan Meteorological Agency (JMA) Ver. 2015110500 RGB imagery on SATAID SATAID software has a function of overlapping
HEADLINES ** 2 ND FROST POSSIBLE FOR THE SHEANANDOAH VALLEY THURSDAY MORNING 4/17??***
 HEADLINES DATA SHOWS CLOUDS WINDS VERY LOW DEW POINTS OVER NIGHT WHICH MAY SAVE THE DAY AND PREVENT MAJOR FROST FREEZE IN SOME AREAS WEDNESDAY MORNING ** 2 ND FROST POSSIBLE FOR THE SHEANANDOAH VALLEY
INSURANCE CLAIMS PAST WEATHER INVESTIGATION
 INSURANCE CLAIMS PAST WEATHER INVESTIGATION Prepared For: John Smith ABC Insurance Company RE: Claim No.: 123456 Bryn Mawr, PA Prepared By: Your Weather Experts (800) 427-3456 PO Box 7100 Hackettstown,
WeatherHawk Weather Station Protocol
 WeatherHawk Weather Station Protocol Purpose To log atmosphere data using a WeatherHawk TM weather station Overview A weather station is setup to measure and record atmospheric measurements at 15 minute
Climate Change Lecture Notes
 Climate Change Lecture Notes (Topic 12A) page 1 Climate Change Lecture Notes Learning Outcomes for the Climate Change Unit 1. Students can list observations which suggest that the world is warming, and
Scout s Address: City State Zip:
 WEATHER BYU Merit Badge Pow Wow Official Merit Badge Worksheet New 2014 Requirements Scout s Name: Instructor s Name: Scout s Address: City State Zip: Instructions 1. The Scout is to review the merit badge
ESCI 1010 Lab 1 Introduction to Weather Data
 ESCI 1010 Lab 1 Introduction to Weather Data Before Lab: Review pages 1-51 in your Weather and Climate textbook. Pay special attention to the sections entitled Location and Time on Earth and Some Weather
Investigation 11.3 Weather Maps
 Name: Date: Investigation 11.3 Weather Maps What can you identify weather patterns based on information read on a weather map? There have been some amazing technological advancements in the gathering and
Winter Storm Today into Tonight
 Winter Storm Today into Tonight Decision Support Briefing #2 As of 6 AM Wednesday, February 20, 2019 What Has Changed? Minor adjustments to forecast snow and ice amounts. Main Points Hazard Impacts Location
Winter Weather Threat Friday night and Saturday January 7, 2017
 Winter Weather Threat Friday night and Saturday January 7, 2017 National Weather Service Newport/Morehead City, NC Date/Time Created: 1/6/2017, 6 AM EST Winter Weather Threat Summary Tonight and Saturday
Sample Q4. Name: Class: Date: Multiple Choice Identify the letter of the choice that best completes the statement or answers the question.
 Name: Class: Date: Sample Q4 Multiple Choice Identify the letter of the choice that best completes the statement or answers the question. 1. The Fujita scale pertains to a. the size of a tornado producing
Fun with Weather Maps! (no, really stop laughing) AOSC 200 Tim Canty
 AOSC 200 Tim Canty") Fun with Weather Maps! (no, really stop laughing) AOSC 200 Tim Canty Class Web Site: http://www.atmos.umd.edu/~tcanty/aosc200 Topics for today: Observations Station Model Temperature Maps Pressure Maps
Fun with Weather Maps! (no, really stop laughing) AOSC 200 Tim Canty Class Web Site: http://www.atmos.umd.edu/~tcanty/aosc200 Topics for today: Observations Station Model Temperature Maps Pressure Maps
Weather Forecasting. pencils, colored daily weather maps for consecutive days (5)
") Long-Term Projects Weather Forecasting Every three hours, the National Weather Service collects data from about 800 weather stations located around the world. Daily newspapers summarize this weather data
Long-Term Projects Weather Forecasting Every three hours, the National Weather Service collects data from about 800 weather stations located around the world. Daily newspapers summarize this weather data
Polarization Diversity for the National Weather Service (NWS), WSR-88D radars
, WSR-88D radars") Polarization Diversity for the National Weather Service (NWS), WSR-88D radars Dusan S. Zrnic National Severe Storm Laboratory Norman, OK 73069, USA In the early eighties the NOAA s National Severe Storms
Polarization Diversity for the National Weather Service (NWS), WSR-88D radars Dusan S. Zrnic National Severe Storm Laboratory Norman, OK 73069, USA In the early eighties the NOAA s National Severe Storms
Pilots watch the clouds, because clouds can indicate the kind of weather in store for a flight.
 Low stratus Cumulonimbus Pilots watch the clouds, because clouds can indicate the kind of weather in store for a flight. FILL IN THE BLANKS OR CIRCLE ONE: A. Stratus means flat or on one level. Low stratus