An Evaluation of the Surface Radiation Budget Over North America for a Suite of Regional Climate Models Against Surface Station Observations
|
|
|
- Wilfred Blake Webb
- 5 years ago
- Views:
Transcription
1 An Evaluation of the Surface Radiation Budget Over North America for a Suite of Regional Climate Models Against Surface Station Observations Marko Markovic Department of Earth and Atmospheric Sciences. University of Quebec at Montreal. Ouranos, 550 Sherbrooke West, 19 th floor, West Tower, Montreal, Quebec H3A 1B9, Canada Colin Jones Department of Earth and Atmospheric Sciences. University of Quebec at Montreal, Canada Paul A. Vaillancourt Recherche en Prévision Numérique, Meteorological Research Division, 2121 Route Transcanadienne Dorval, Quebec, H9P 1J3, Canada Dominique Paquin Consortium Ouranos 550 Sherbrooke West, 19 th floor, West Tower, Montreal, Quebec H3A 1B9, Canada Katja Winger Department of Earth and Atmospheric Sciences. University of Quebec at Montreal. Ouranos, 550 Sherbrooke West, 19 th floor, West Tower, Montreal, Quebec H3A 1B9, Canada Danahé Paquin-Ricard Department of Earth and Atmospheric Sciences. University of Quebec at Montreal. Ouranos, 550 Sherbrooke West, 19 th floor, West Tower, Montreal, Quebec H3A 1B9, Canada Corresponding Author address: Colin Jones Department of Earth and Atmospheric Sciences University of Quebec at Montreal Ouranos, 550 Sherbrooke West, 19 th floor, West Tower Montreal, Quebec H3A 1B9, Canada Tel: (514) (ext.293) Fax: (514) jones.colin@uqam.ca
2 2 Abstract Components of the surface radiation budget (SRB) (Incoming Shortwave Radiation, [ISR] and Downwelling Longwave Radiation, [DLR]) and cloud cover are assessed for 3 Regional Climate Models (RCM) forced by analysed boundary conditions, over North America. We present a comparison of the mean seasonal and diurnal cycles of surface radiation between the three RCMs, and surface observations. This aids in identifying in what type of sky situation simulated surface radiation budget errors arise. We present results for total-sky conditions as well as overcast and clear-sky conditions separately. Through the analysis of normalised frequency distributions we show the impact of varying cloud cover on the simulated and observed surface radiation budget, from which we derive observed and model estimates of surface cloud radiative forcing. Surface observations are from the NOAA SURFRAD network. For all models DLR all-sky biases are significantly influenced by cloud-free radiation, cloud emissivity and cloud cover errors. Simulated cloud-free DLR exhibits a systematic negative bias during cold, dry conditions, probably due to a combination of omission of trace gas contributions to the DLR and a poor treatment of the water vapor continuum at low water vapor concentrations. Overall, models overestimate ISR all-sky in summer, which is primarily linked to an underestimate of cloud cover. Cloud-free ISR is relatively well simulated by all RCMs. We show that cloud cover and cloud-free ISR biases can often compensate to result in an accurate total-sky ISR, emphasizing the need to evaluate the individual components making up the total simulated SRB. Key words: surface radiation, solar and longwave radiation, regional climate model evaluation, surface observations.
3 3 1. Introduction. Downwelling longwave and shortwave radiation at the surface are two key terms in the surface energy budget and therefore important parameters to accurately simulate in climate models. Systematic biases in the representation of the surface radiation budget (SRB) can lead to errors in a number of key near surface climate variables (e.g. soil moisture, snow cover and sea-ice amounts). A number of researchers have previously evaluated the surface radiation budget in climate models. Wild et al. (1995) compared various Global Climate Models (GCMs) against surface measurements. All the analysed models tended to overestimate the Incoming Shortwave Radiation (ISR) values. One of the main reasons cited was that the clear-sky atmosphere in the models absorbed less solar radiation than observations suggested. With respect to Downwelling Longwave Radiation (DLR), all models underestimated the observations due both to errors in the simulated cloud fraction as well as due to an underestimate of DLR under cloud-free conditions. Garrat and Prata (1996) compared the simulated DLR in several GCMs against surface observations over a variety of continental regions. They found annual mean DLR errors of ~ ±10 Wm -2 for the GCMs evaluated. The authors linked DLR errors with neglect of trace gases (e.g. N 2 O, SO 2, CFCs) and aerosols, biases in boundary-layer humidity, errors in near-surface temperature and erroneous cloud cover. Wild et al. (2001) compared DLR from different GCMs and ERA15 against surface observations for all-sky and cloud-free conditions. They concluded that similar biases in simulated DLR between ERA15 and the GCMs arose primarily due to common errors in the respective radiation schemes, rather than due to differences in the thermodynamic input to the schemes. DLR biases identified in all-sky conditions were generally associated with errors in the clear-sky DLR and tended to be largest, in a relative sense, in the winter season. Wild et al. suggested a probable cause of this bias was a poor representation of the water vapor continuum during cold
4 4 and dry atmospheric conditions. Results from Iacono et al. (2000) suggest a more detailed treatment of the water vapor continuum under dry conditions can potentially ameliorate this error. Roads et al. (2003) analysed a number of Regional Climate Models, concentrating on the simulated ISR over North America. While their conclusions were limited by the availability of observational data, errors in simulated cloud cover were strongly linked with biases in the simulated ISR in the models analyzed. In this study, surface observations at a number of sites across North America are used to evaluate downwelling ISR and DLR in 3 RCMs run for the recent past ( ) using analysed lateral boundary conditions (LBCs). The RCMs were run in a single, 6-year integration with LBCs and sea surface temperatures updated 6- hourly, with a linear time interpolation applied between each update time. Configuring a RCM to run forced by analysed boundary conditions constrains the model simulated large-scale meteorology to follow the observed evolution relatively closely. Along with a relatively high model resolution (~0.5 ), this allows for a comparison of the performance of key parameterisation schemes, such as radiation and cloud schemes, against detailed surface observations. The RCMs will be directly compared with available ground-based measurements over the continental USA. We evaluate the surface radiation budget in a variety of climate conditions, for cloudy and clear-sky conditions separately and as a function of season and time of day. In doing this we aim to isolate conditions and situations where the respective cloud and radiation schemes operate poorly and thereby identify aspects of the respective parameterization schemes that require improvement in order to improve the simulated SRB.
5 5 2. Models and Observations. The models used in this assessment are: The Canadian Regional Climate Model (CRCM, version 4.0) (Caya and Laprise, 1999), GEM-LAM, the regional version of the Global Environmental Multiscale Model (Côté et al., 1998) and third, RCA3, the regional model from the Rossby Centre (Jones et al., 2004). CRCM4 is presently used as the standard RCM in Canada for regional climate change simulations, while GEM-LAM is planned to replace CRCM4 in the near future. It is also planned to use the RCA3 model, within a suite of RCMs, to generate regional climate change simulations over North America. It is therefore pertinent to evaluate the SRBs in these models given its importance in determining the near-surface regional climate. In CRCM shortwave (SW) radiation is treated using a photon path method with scattering incorporated through the Delta-Edington technique (Fouquart and Bonnel, 1980) with 4 bands in the visible and near IR. Longwave (LW) radiation is treated with a broadband flux emissivity approach, with temperature and pressure dependant gaseous absorption included, following Morcrette (1991). The aerosol input in CRCM uses a prescribed, zonal mean distribution, with different concentrations applied over ocean and land. Aerosols are assumed to be homogeneously distributed within the boundary layer with the scattering and absorption properties based on the work of Shettle and Fenn (1979). In RCA3 clearsky SW radiation is reduced from the top of the atmosphere value by: parameterised broad-band ozone absorption, water vapor absorption and Rayleigh scattering by air molecules. Aerosol effects in RCA3 are incorporated simply by multiplying the water vapour absorption term and the Rayleigh scattering term each by separate constants, that aim to represent the effects of clear-sky aerosol scattering and absorption on the surface solar radiation flux. A discussion of the appropriate values for these constants can be found in Sarvijarvi (1990). In the runs reported here the constant amplifying
6 6 clear-sky absorption, caak, is set equal to 1.3, while that amplifying the clear-sky scattering of the solar flux, cask, is set to Cloud scattering and absorption of SW radiation follow the parameterisation of Slingo (1982). LW radiation is treated with a broadband emissivity scheme, following the approach of Rogers (1977) and Stephens (1984). The RCA3 radiation scheme is further described in Savijarvi (1990) and Räisänen (2000). The GEM-LAM radiation code includes IR absorption and emission from all of the following trace gases: H 2 O, CO 2, O 3, N 2 O, CH 4, CFC11, CFC12, CFC13 and CFC14. It is worth noting that both CRCM and RCA3 consider only the first three of these gases. GEM-LAM radiation uses a correlated-k distribution method (CKD) for gaseous transmission with 9 frequency intervals for LW and 4 frequency intervals for SW radiation. Cloud infrared scattering is included as is cloud vertical overlap (Li and Barker, 2005). In GEM-LAM, 2 formulations describing the total optical thickness of aerosols are applied, one appropriate for land and the other over the ocean (Toon and Pollack, 1976). These distributions also include a latitudinal gradient. Aerosols are assumed only to affect the solar absorption properties of the clear-sky atmosphere. The cloud schemes in all 3 models follow the basic approach of Sundqvist et al. (1989) with some small differences between each model. Cloud fraction is diagnosed as an increasing function of grid box mean relative humidity, activating once a threshold humidity is exceeded. The ground measurements are taken from the Surface Radiation Network (SURFRAD) coordinated by NASA. We used six observational sites representing a cross-section of various climate types over North America (see Figure 1). SURFRAD stations have adopted the standards for measurement accuracy set by the Baseline Surface Radiation Network (BSRN), which are an accuracy of ±15 Wm -2 for broadband solar measurements and ±10 Wm -2 for thermal infrared measurements. To correct for the effect of orographic differences between model and observations we
7 7 apply a constant correction of 2.8 Wm -2 per 100 m to the model DLR values where the two orographic heights differ, as detailed by Wild et al. (1995). 3. Evaluating the simulated annual cycle of ISR and DLR at the 6 SURFRAD sites. 3.1 Mean Annual Cycle In this section we compare the simulated surface radiation from the 3 RCMs against surface observations. We extract 3-hourly average ISR and DLR from the 6 SURFRAD stations and from the 4 model grid boxes closest to each respective station. A comparison of RCM simulated SRB using the single grid box collocated with the SURFRAD stations versus an average of the 4 nearest grid boxes showed almost no difference (results not shown), hence all analysis in this paper uses a 4 grid box mean value for simulated SRB. The analyzed period is determined by the common time period between the 3 RCM simulations and the availability of station observations, this results in a common analysis period of We analyse the annual cycle of monthly mean all-sky radiation (including all-sky conditions irrespective of cloud fraction). We further analyse frequency distributions of 3 hourly ISR and DLR from the 3 RCMs and surface observations, separately for winter (DJF) and summer (JJA). In later sections we will consider more closely the ISR and DLR in cloudy-sky and clear-sky conditions and include an evaluation of the surface cloud radiative forcing and the simulated diurnal cycle of the SRB. Figure 2a shows the mean annual cycle of ISR averaged over the 6 sites, for the 3 RCMs and observations, while Figure 2c shows monthly mean biases in the simulated ISR. GEM-LAM and CRCM accurately represent ISR in winter, (~2 Wm -2
8 8 bias) while there is an overestimation of ISR in summer in these 2 models (~20-30 Wm -2 ). In contrast, RCA3 is relatively accurate during summer but has the largest ISR biases in spring and winter (~10-20 Wm -2 overestimate). One probable cause of the summer season biases in ISR lies in an underestimate of cloud amounts in all 3 models. Figure 3 shows a time restricted, long-term mean diurnal cycle of cloud cover for all sites during the extended summer season (April-August). Cloud cover observations at the SURFRAD sites use an RGB cloud-detecting camera ( which operates only during daylight hours. Hence, for the summer season cloud cover analysis, we are constrained to using a common daylight period for the 6 sites, which is UTC (approximately 9-18 local time). Two observational estimates are presented for observed cloud amounts (Figure 3). The first is directly from the RGB camera (in black). The second curve (in gray) utilizes the findings from a number of studies (e.g. Karlsson, 2003) that suggest surface based cloud cover observations are generally biased high in the summer season. This mainly results from surface observations and scanning cameras frequently observing the sides of vertically stacked cumulus clouds and attributing this cloud as an overhead cloud fraction. Satellite sensors typically view the projected cloud top and therefore have a cloud cover more analogous to the overhead cloud fraction defined in numerical models. We have applied an approximate correction to the RGB cloud cover based on the findings of Karlsson et al. (2003), that suggest satellite cloud cover in the summer season over Scandinavia is systematically lower than surface based estimate by ~5-10%. Even with this correction it is clear that all 3 RCMs systematically underestimate cloud cover during this part of the summer season diurnal cycle, with CRCM being the worst offender. As a result they will significantly overestimate all-sky ISR during this period of the day. Problems simulating the diurnal cycle of summer season convection and associated cloudiness are common to many climate models (Lenderink et al., 2004, Yang and Slingo,
9 9 2001). An inability to simulate sufficient convective activity in a given model will likely lead to an underestimate of cloud cover and an associated overestimate of the surface solar radiation flux. This excess radiation will lead to a warm and dry bias developing at the surface, further compounding the initial convection-cloud error. In this manner, cloud-convection errors can be amplified by surface-atmosphere feedbacks, leading to a negative cloud bias accompanied by a mid-continent, surface warm/dry bias (Wild et al., 1996) A more detailed analysis of how the 3 models represent surface radiation as a function of cloud cover will be presented in Section 4. Figures 2b and 2d show the mean annual cycle of DLR for the 3 RCMs and surface observations, as well as presenting the mean annual cycle of DLR biases (RCM-OBS). GEM-LAM and RCA3 produce a relatively accurate representation of DLR, except in the winter season when there is an underestimate of ~10-20 Wm -2 in both models. As with DLR winter errors in ERA15, this type of DLR error may be associated with problems in representing the water vapor continuum in cold, clearsky conditions during winter (see Wild et al., 2001) or the neglect of trace gases in the calculation of DLR (Garrat and Prata, 1996). The trace gas contribution to total DLR will become relatively more important in cold, dry conditions as the total DLR becomes less dominated by water vapor emission. This issue will be returned to in Section 4 where we analyse in more detail the RCM simulated surface radiation in clear and cloudy conditions separately. CRCM gives a constant underestimate of DLR throughout the year of ~20 Wm -2. We will subsequently indicate that this bias is consistent with a year round underestimate of cloud fraction and cloud liquid water path in this model. 3.2 Normalized frequency distributions of 3-hourly SRB. As a further validation of the RCMs surface radiation we present a comparison of the 3 hourly surface flux values from the 3 RCMs and observations. Figure 4 presents normalised frequency distributions of surface ISR and DLR
10 10 separately for summer (JJA) and winter (DJF) as derived from surface observations and the RCMs, both meaned over the 6 SURFRAD stations collocated with the RCM grid points. The normalised frequency distribution expresses the occurrence of a given 3 hourly ISR or DLR value as a fraction of the total number of 3 hourly occurrences in a given season. In making this analysis we wish to determine whether the RCMs not only simulate the monthly mean ISR and DLR but also the higher time frequency variability in the surface radiation budget that underlie the seasonal mean values. The period used in constructing the frequency distributions encompasses 5 years ( ). The RCM data are 3 hourly average radiation fluxes, hence the observations have been averaged to the same time period. Values along the x-axes indicate the band of ISR or DLR values for which a given frequency of occurrence has been calculated (e.g. a value of 350 in the ISR plot indicates a band of ISR between Wm -2 while for DLR the value of 350 indicates a band of DLR between Wm -2. The band width for ISR is 50 Wm -2 for the entire range of values, while for DLR it is 20 Wm -2 ). Nighttime is not included in the ISR analysis thus the first ISR band is 5-50 Wm -2. Nighttime is included in the DLR distribution. The 3 RCMs represent winter and summer mean ISR and DLR with a reasonable degree of accuracy, nevertheless a few systematic biases can be seen in Figure 4. RCA3 overestimates DJF ISR (Figure 4a) in the range of Wm -2 and slightly underestimates the occurrence of values less than 200 Wm -2. This is consistent with its positive bias of DJF ISR in Figure 2a. This type of error structure is consistent with an overall underestimate of cloud amounts (see Figure 6). It is also consistent with simulated winter season clouds being not sufficiently reflective. RCA3 uses a diagnostic partitioning of cloud water into liquid and frozen fractions (The fraction of cloud water assumed as frozen increases from 0 to 1, as the second power of temperature in the range 0 to 22 C). Recent observations (e.g. Shupe et
11 11 al., 2006) suggest liquid droplets are present in clouds over the Arctic down to temperatures as low as 39 C. It is therefore feasible that RCA3 has a systematic overestimate of the ice fraction in mixed phase clouds leading to an overestimate of the median effective radius and an underestimate of cloud reflectivity. The approach used to partition water into liquid and solid components in RCA3 is the same as that used in the ECMWF model used in the production of ERA40. Analysis of an equivalent ERA40 normalised frequency distribution of winter season ISR shows a similar shift to that seen for RCA3 (not shown) suggesting a common underestimate of cloud reflectivity in the winter season. This problem will be discussed more in Section 4 where cloud-free and cloudy-sky radiation along with cloud fraction are evaluated together. GEM-LAM also has a positive bias in the occurrence of ISR in the range of Wm -2, which is balanced by the underestimate of ISR low occurrences (< 200 Wm -2, see the inset on Figure 4a). CRCM gives a very good representation of DJF ISR. In the summer season (Figure 4c) GEM-LAM and CRCM overestimate the occurrence of very high (>800 Wm -2 ) ISR values. These high values of ISR are likely associated with clear-sky conditions and the overestimate in this ISR range will result from an underestimate of cloud amounts in the middle of the day (as shown in Figure 3). RCA3 has a smaller positive bias in this range of ISR, even though it too has a similar underestimate of cloud fraction during early afternoon in summer (see Figure 3). This suggests that while RCA3 underestimates the fractional cloud amount during this period, the clouds simulated in this model are significantly more reflective than in GEM-LAM or CRCM, compensating for the underestimate of cloud amount in terms of total surface ISR. In Section 4 we will further show that the RCA3 clear-sky ISR is underestimated compared to the observed ISR in equivalent clear-sky conditions, implying the RCA3 clear-sky atmosphere is too opaque. This error will also act to ameliorate ISR errors, associated with an underestimate of cloud fraction, in terms of the total-sky ISR. These types of compensation indicate the importance of
12 12 evaluating all terms controlling the surface radiation budget in a model in order to improve the physical realism of the simulated cloud-radiation processes. The winter DLR frequency distribution shows all models have a peak occurrence shifted towards lower values than observed. This shift leads to an underestimate in the mean DLR in winter (Figure 2b). In summer (Figure 4d) GEM- LAM and RCA3 follow the observed distribution quite well, while CRCM simulated DLR remains shifted towards lower values (Figure 2b). A discussion of the cause of these errors is deferred to Section 4 where we analyse the surface radiation frequency distributions separately for clear and cloudy conditions. 4. Understanding cloud-radiation errors in the 3 RCMs. 4.1 Evaluating simulated ISR and DLR under different cloud cover conditions. In Figure 5 we present the daytime mean annual cycle of ISR and DLR under all-sky (Figures 5a and 5b) and cloud-free conditions (Figures 5c and 5d). All-sky condition refers to ISR and DLR values for all cloud cover conditions (0-100% cloud cover) while cloud-free ISR and DLR are those values when observations or models have cloud cover less then 10%. Conditions with less than 10% of cloud cover are taken as cloud-free, rather than using 0% as the threshold, as this would significantly reduce the number of cloud-free occurrences available for analysis. Despite the shorter diurnal cycle used in this section, DLR and ISR all-sky model errors are similar to those seen when the entire diurnal cycle is used (Figures 2a and 2b). ISR errors are slightly amplified due to our concentration on daylight hours. We are therefore confident that cloud and clear-sky radiation errors found using this shortened diurnal cycle are representative.
13 13 To better understand the underlying causes of the all-sky radiation errors we analyse cloud-free radiation fluxes separately. ISR in cloud-free conditions (Figure 5c) is underestimated in the winter season by all models (a negative bias of ~15-20 Wm -2 ). One possible reason for the winter ISR clear-sky biases could be that models underestimate the occurrences of cloud cover at high integrated water values compared to observations: hence the simulated clear-sky systematically samples higher integrated water vapor values and therefore experiences an atmosphere more opaque to solar radiation, resulting in an apparent negative bias in modeled clear-sky ISR. This negative clear-sky bias is in the opposite sense to the winter season ISR biases in all-sky conditions (positive biases of ~10-50 Wm -2 ) and strongly suggests the ISR all-sky biases in winter are dominated by an underprediction of cloud amount and or cloud reflectivity. In summer GEM-LAM and CRCM show only small biases in cloud-free ISR (5-15 Wm -2 ), far better than in all-sky conditions. RCA3 underestimates clear-sky ISR during the summer season by Wm -2. In Figure 6 we present a comparison of cloud cover for the 3 RCMs against observations from the SURFRAD stations. The annual cycle is constructed for the same daytime period as used in Figure 5. Even considering potential errors in the cloud observations all models underestimate cloud cover especially for the JJA season. In Figure 5c we showed that RCA3 underestimated ISR in summer season clear-sky conditions. This negative bias in cloud-free ISR will partially offset an underprediction of cloud cover in RCA3 (too frequent occurrence of cloud-free conditions) leading to a relatively accurate all-sky ISR due to 2 compensating errors (i.e. too frequent occurrence of clear-sky conditions which are excessively opaque to solar radiation). GEM-LAM and CRCM have relatively accurate cloud-free ISR, due to the underestimate of cloud cover they both significantly overestimate ISR for JJA all-sky conditions. Put in another way, the surface solar radiation flux in GEM-LAM and CRCM is (correctly) more sensitive to cloud errors than in RCA3.
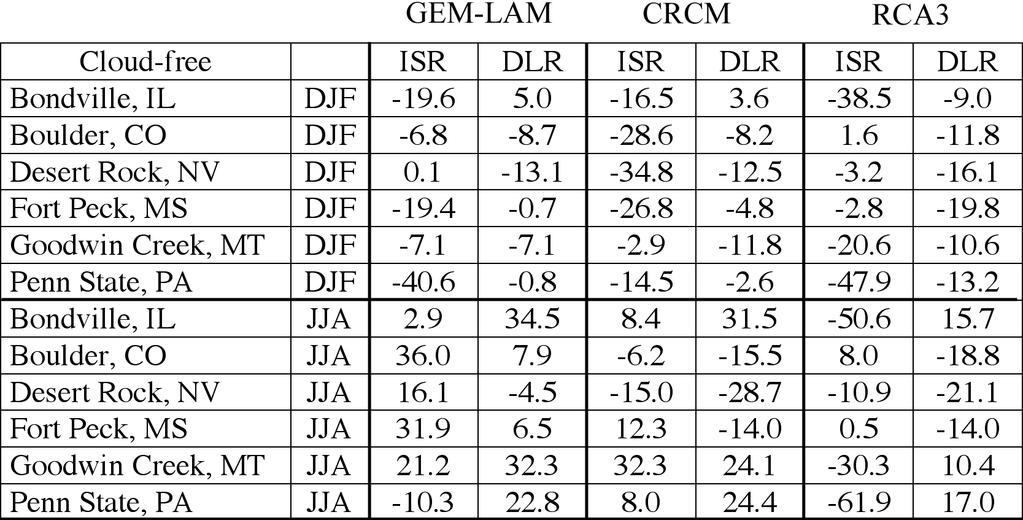
14 14 In order to investigate this problem further we made a sensitivity experiment with the RCA3 model, reducing the 2 constants (caak and cask) used to amplify clearsky solar absorption and scattering. In the original RCA3 runs these constants were set to 1.3 and 1.35 respectively. In the new run (RCA3aero) the constants were reduced to 1.2 and Figure 7 shows the original monthly-mean ISR all-sky and clear-sky biases for June, July and August averaged over the daytime period 9-18 LST. A relatively accurate all-sky ISR (black bar in Figure 7a) comes about partially from a negative bias in the clear-sky ISR (Figure 7b) balancing an understimate of cloud fraction. Reducing the aerosol absorption/scattering terms improves the clearsky ISR flux in RCAaero. The reduced clear-sky opacity is now not available to balance the cloud underestimate in RCA3, and as with GEM-LAM and CRCM, a significant positive bias in all-sky ISR develops, coincident with an accurate clearsky surface flux. Figure 7b shows the difference in the clear-sky ISR due to the changed aerosol treatment, with simulated ISR values increasing by ~40-50 Wm -2. Cloud-free DLR errors in GEM-LAM and RCA3 look very similar to the allsky DLR errors throughout the annual cycle (Figures 5b and 5d), suggesting clear-sky DLR problems dominate the all-sky DLR in these two models. Cloud-free DLR errors in CRCM are comparable to the other two models across the annual cycle. This is not true for all-sky conditions where CRCM has a large year-round negative bias, suggesting the all-sky DLR error in CRCM is a result of both a clear-sky bias which is amplified by cloudy-sky errors. It is worth noting that both GEM-LAM and RCA3 have a prognostic treatment of cloud water with a Sundqvist type treatment of precipitation loss (Sundqvist, 1989). Cloud water is consistently treated between the radiation and cloud microphysics. CRCM does not have prognostic cloud water, all supersaturation is assumed to be removed as precipitation in the microphysics and cloud water amounts in the radiation are diagnosed using the approach due to Betts and Harshvardan (1987). Errors in the DLR suggest this approach may be leading to a
15 15 systematic underestimate of cloud emissivity in the CRCM radiation scheme. (We will return to this point later). In order to expand the analysis undertaken in this section, we present winter and cloud-free (Table 2) conditions. This is done to ascertain that the spatially mean results presented so far do not hide spatial error compensation in either of the SRB components. For JJA ISR in cloud-free conditions, GEM-LAM and RCA3 confirm the spatially mean results presented in Figure 5c, while some cancellation of opposite signed biases is seen in CRCM. We emphasize that the ISR results presented in Table 1 are averages across the approximate 6-hour period when solar flux is maximum. Hence the ISR biases are significantly larger than if they were averaged across the diurnal cycle, as frequently done. The DJF ISR cloud-free negative biases presented in Table 2 also confirm the general underestimate within all models seen in the spatial mean results. In JJA the only DLR term showing some spatial cancellation is the CRCM flux. Otherwise the majority of the conclusions drawn from the spatial mean results are valid when the 6 sites are considered separately. 4.2 Evaluating surface cloud radiative forcing. To summarize the cloud contribution to the total SRB we construct mean annual cycles of surface Cloud Radiative Forcing (CRF) for ISR and DLR (Figure 8). The definition of surface CRF used here is the difference in surface incoming radiation between all-sky and cloud-free conditions. Due to limitations in the cloud observations, the CRF is constructed for the daytime period common to all SURFRAD sites, namely UTC (9-15 approximate local time). ISR CRF errors will therefore be exaggerated relative to DLR CRF errors, compared to a full integration across the diurnal cycle. Two observational estimates of the ISR CRF are presented in Figure 8 (gray bars). The second observational estimate of CRF attempts
16 16 to account for the aforementioned overestimate of summer season clouds (~5-10%) by the RGB camera. Here we try to indicate the likely change in CRF if observed cloud amounts were reduced by 5-10% in the summer season. An estimate of the change of ISR for a given fractional change in cloud cover can be obtained by applying a linear best fit approximation to the figure representing observed surface ISR plotted as a function of observed cloud cover. As an example, Figure 9a and Figure 9b present observed ISR plotted against observed cloud fraction for the months April and July respectively for the Bondville station. To assess the sensitivity of the ISR-cloud fraction relationship, we separately plot 4 independent times of day. (Green corresponds to 12 LST, red to 9 LST, blue to 18 LST, and black to 15 LST). A linear best fit to these curves gives an estimate of the change in ISR for a percent ISR change in cloud cover. This technique was used for all SURFRAD sites for cloud the period April to August and a mean ISR cloud ~ 3Wm 2 % 1 was derived. This change in ISR was then translated into an implied ISR assuming 5-10% increase in observed cloud amount and a second estimate of observed ISR CRF was derived. The sensitivity of DLR to this 5-10% change was an order of magnitude smaller than the ISR sensitivity and was therefore not included. The second estimate of observed CRF should be viewed simply as an uncertainty range for CRF due to uncertainties in the observed cloud fraction. The ISR CRF in Figure 8a shows all models underestimate ISR cloud radiative forcing compared to observations, especially for spring and summer, commensurate with the largest biases in all-sky ISR. For GEM-LAM and CRCM errors are mainly due to cloudy-sky errors (e.g. an underestimate of cloud fraction and possible underestimate of LWP). These errors are also present in RCA3 (e.g. cloud fraction underestimate) but are partially balanced by the clear-sky atmosphere being too opaque to ISR.
17 17 DLR CRF (Figure 8b) is underestimated by GEM-LAM and CRCM throughout the year. Again this is partially a result of the systematic underestimate of cloud cover. RCA3 has an accurate simulation of DLR CRF even though it too underestimates cloud fraction. This underestimate must be partially compensated by RCA3 simulated cloud emissivity being too high. Summer ISR CRF errors are smallest in GEM-LAM and RCA3 commensurate with smaller cloud errors in these two models compared to CRCM. In the winter season RCA3 has the largest negative bias in ISR CRF while having a very accurate estimate of DLR CRF. GEM-LAM and RCA3 have similar cloud amounts during the winter season, suggesting a problem in RCA3 specific to the treatment of winter (ice and mixed phase) clouds in the solar portion of the radiation scheme. CRCM has the poorest DLR CRF, with an underestimate of Wm -2 throughout the year (Figure 8b). The primary reason for this underestimate is the relatively large cloud cover bias in CRCM and also a probable underestimate of cloud water path. To further explain CRCMs underestimate of DLR CRF (Figure 8b) we present a normalized frequency distribution of vertically integrated LWP used in the radiation scheme of the CRCM model and observed by the microwave radiometer, for non-precipitating cases, at the ARM Southern Great Plains site (Figure 10). In Figure 10, the black and green bars represent LWP for non-precipitating events only, for both observations and model respectively, while the blue bar represents model LWP, including all occurrences of precipitation. The values along the x-axes indicate the band of LWP quantity for which a given frequency of distribution has been calculated (e.g. value of 15 gm -2 indicates a band of LWP between 0-15 gm -2 ). For both seasons CRCM has a very clear underestimate of LWP, confirming a general underestimate in cloud emissivity, which along with the cloud fraction underestimate contributes to the year round deficit in DLR in this model. The first band in Figure 10 (0-15 gm -2 ) includes the LWP values of 0 gm -2, which is the equivalent of clear-sky events,
18 18 indicating an overestimate of clear-sky events in CRCM. Even including model LWP when precipitation is occurring (blue bar in Figure 10) still results in a relatively large underestimate of LWP in CRCM simulated clouds. Inclusion of possible observational uncertainties in summer season cloud amounts (gray bar in Figure 6) and their effect of the observed ISR CRF reduce slightly the implied ISR biases in the models, nevertheless the basic conclusions remain unchanged hourly histograms of ISR and DLR as a function of cloud cover. In this section we present normalised frequency distributions of ISR and DLR where the distributions are constructed and normalised separately for all-sky, clearsky (cloud cover <10%) and overcast (cloud cover > 90%) conditions. Frequency distributions are constructed for the daytime period UTC (9-15h local time for most sites) due to the observed cloud constraints, for the winter (Figure 11) and summer (Figure 12) seasons. The winter distribution of all-sky DLR (Figure 11d) shows that all models are systematically biased towards low values. For RCA3 and GEM-LAM this appears to be primarily due to a negative bias in the DJF DLR clearsky frequency distribution (Figure 11e), DJF DLR for cloudy conditions (Figure 11f) being well simulated by these 2 models. CRCM has the same DJF DLR clear-sky error (Figure 11e) but also has a negative bias in DJF DLR during overcast conditions (Figure 11f). This error is when both model and observations have >90% cloud cover and is therefore not due to an underestimate of cloud fraction. This error in cloudysky DLR we feel is a direct consequence of the underestimate of LWP and cloud emissivity shown in Figure 10. The error in cloudy-sky DLR combines with the general underestimate of cloud cover in CRCM to produce the large DLR CRF negative bias seen in Figure 8b. GEM-LAM and CRCM represent the distribution of all-sky DJF ISR fairly well (Figure 11a), while RCA3 has a clear shift in the distribution towards higher values than observed.
19 19 To better understand the surface radiation errors in Figure 11 we plot normalized frequency distributions of cloud fraction for DJF (Figure 13a) and JJA (Figure 13b) respectively. The gray surface on both figures represent an envelope between averaging periods of 3 and 6 hours for the surface point observations. Cloud cover in models represents an aerial fractional coverage over the entire model grid box, while the observations represent a vertical integral of cloud amount over a given point location. To adjust the observed cloud cover from a point value to be more representative of an aerial mean, we apply a time averaging of 3 and 6 hours. Figure 13 suggests the degree of time averaging in this range does not greatly change the histogram of observed cloud fraction occurrence. CRCM clearly overestimates the occurrence of clear-sky conditions in DJF and underestimates the occurrence of overcast skies (cloud fraction > 90%). The negative bias in cloudy-sky ISR in DJF (clouds too reflective) in CRCM (Figure 11c) is therefore balanced in the all-sky by a large overestimate of the occurrence of clear-sky conditions. (Note that ISR clear-sky (Figure 11b) values are always larger than the ISR cloudy values). RCA3 DJF ISR all-sky (Figure 11a) has a bias of too few ISR values in the range < 200 Wm -2 and too many occurrences in the range Wm -2. The clear-sky DJF ISR (Figure 11b) is quite accurate for this model, while cloudy DJF ISR underestimates low flux values and overestimates high values (Figure 11c), suggesting problems in the all-sky DJF ISR come from radiation in cloudy conditions. In DJF, simulated clouds in RCA3 appear to have a systematic negative bias in cloud reflectivity which may be related to a fractional distribution of total cloud water biased towards excessive ice fraction as discussed in Section 3. All models have a slightly wider distribution of total-sky (Figure 12d) and clear-sky (Figure 12e) JJA DLR, which suggests greater variability in simulated boundary layer temperature and water vapor amounts than observed. A larger diurnal range of near surface temperatures is consistent with a general underestimate of cloud
20 20 amounts. Excess daytime solar radiation leads to a warm bias by day and too little cloud at night allows excess infra-red cooling and a nighttime cold bias in the models. With respect to clear-sky JJA DLR, due to the general underestimate of clouds in the 3 RCMs, it is conceivable that a fraction of the disagreement in the DLR frequency distributions stems from the RCMs classifying a range of atmospheric humidity states as clear-sky that are never clear-sky in the observations. This will particularly lead to the positive bias in the JJA DLR clear-sky distributions, with the model clear-sky contributions being biased to higher emissivity values (higher integrated water vapor amounts) than observed. CRCM has a bias towards too low values of JJA DLR in all-sky conditions. This seems strongly linked to an underestimate of cloudy-sky JJA DLR (Figure 12f) with the underestimate of cloud water and cloud emissivity in this model. The cloudy-sky negative DLR bias in CRCM is partially balanced by a positive bias in clear-sky DLR in JJA for the reasons mentioned earlier. GEM-LAM also shows this bias in clear-sky JJA DLR (Figure 12e). RCA3 gives a remarkably good JJA ISR total-sky (Figure 12a) distribution while, for the higher flux values, GEM-LAM and CRCM overestimate the occurrence of these ISR values. RCA3 has a bias towards to many occurrences of very low ISR (< 200 Wm -2 ) in JJA cloudy conditions (Figure 12c). This is consistent with the findings of Karlsson et al. (2008) that RCA3 summer season clouds consistently are optically too thick (i.e. contain excessive amounts of liquid water). GEM-LAM has too many occurrences of very high JJA ISR during overcast conditions (ISR > 800 Wm -2 ) (Figure 12c). This amount of ISR during cloudy conditions is likely only to occur for optically thin cirrus clouds, suggesting in the summer season GEM-LAM too frequently (incorrectly) simulates clouds of low optical thickness. CRCM JJA ISR biases seem mainly related to clear-sky errors (e.g.
21 21 the clear-sky is too transmissive). This will amplify the CRCM tendency to underestimate JJA cloud occurrence and lead to the poor JJA ISR in the seasonal mean (Figure 5a). All models tend to overestimate the occurrence of very small cloud fraction (0-10%) and to underestimate large cloud cover occurrences (90-100%) for both seasons (Figures 13a and 13b). This has a big influence on ISR all-sky (Figure 5a), especially for summer season, with all models exhibiting a positive bias in JJA ISR. 5. Evaluating the diurnal cycle of SRB in the 3 RCMs. An accurate simulation of the diurnal cycle of surface radiation is an important requirement for climate modeling. Many of the systematic errors seen in the simulated seasonal mean SRBs may well result from persistent errors within the diurnal cycle. This is particularly the case with respect to the diurnal cycle of clouds and their interaction with solar radiation. In this section we evaluate the diurnal cycle in the 3 RCMs against surface observations for different conditions of cloud cover. Because cloud observations at the measurement sites are available only during daylight, we analyse the period April-August (the hours 15-0 UTC, approximately 9-18 LST) in order to maximize the analysed period of the day. In Figure 14 we plot the mean diurnal cycle of DLR and ISR for cloud-free (cloud cover < 10%) and all-sky conditions. In the morning (~15-18 UTC), GEM-LAM and RCA3 both have large positive biases in ISR. In the afternoon (~18-21 UTC), the average overestimate for GEM-LAM remains high ~70 Wm -2 while for RCA3 it reduces to ~35 Wm -2. In the evening both models are remarkably accurate with small errors. In contrast, CRCM
22 22 ISR is most accurate in the morning (~5 Wm -2 error) while in afternoon and evening periods a positive bias in ISR of a 70 Wm -2 develops. Cloud-free ISR errors (Figure 14b) are smaller than the total-sky error in GEM-LAM and CRCM, indicating an amplification of the cloud-free error due to an underestimate of cloud amounts. RCA3 also shows smaller morning clear-sky ISR bias (~30 Wm -2 ) compared to all-sky conditions, but for the afternoon and evening there is an increasing underestimate of ISR (e.g. the clear-sky atmosphere in RCA3 is too opaque to ISR partially balancing the underestimate of cloud fraction in the model, leading to a relatively accurate all-sky ISR). Again highlighting the need to consider all components controlling the total simulated SRB in a model. DLR exhibits a much weaker diurnal cycle than ISR, all-sky DLR (Figure 14c) is very well simulated by GEM-LAM and RCA3, with biases of less than 10 Wm -2 for both models through the diurnal cycle. CRCM has a continuous negative bias in all-sky DLR ranging from Wm -2 with the largest bias in the morning and afternoon. In the evening the CRCM all-sky DLR bias decreases due to a positive bias in clear-sky DLR. This is consistent with the CRCM lower atmosphere being too warm probably due to the accumulated effects of the large positive bias in ISR in this model through the diurnal cycle (Figure 14a). As a result DLR values from clear-sky emission become increasingly large as the positive temperature error increases through the day. In cloud-free conditions GEM-LAM overestimates DLR, also consistent with an atmosphere that is too warm. The underestimated cloud amounts (overall underestimate of total-sky emissivity) along with a too warm atmosphere (leading to excess clear-sky DLR emission) combine to produce an accurate estimate of all-sky DLR in GEM-LAM. RCA3 has a relatively accurate representation of the diurnal cycle of cloud-free DLR. Like GEM-LAM, RCA3 has a negative bias in simulated cloud amounts. The accurate all-sky and clear-sky DLR in RCA3 therefore suggests that in the context of total-sky DLR, the underestimate of cloud fraction in
23 23 RCA3 is balanced by clouds, when present, having systematically too high emissivity. To extend the evaluation of the diurnal cycle of simulated cloud-radiation interaction we evaluate the sensitivity of ISR to increasing cloud fraction for 3 different solar zenith angles (SZA) representing 3 solar heights in the diurnal cycle. Figure 15a shows the ISR distribution for the daytime period with maximal solar elevation SZA (20-40 ), while Figures 15b and 15c represent and solar elevation. The analysed period in Figure 15 is April-August. For a given cloud cover, RCA3 underestimates ISR for all 3 SZA. The biggest biases can be seen when the sun is highest in the sky (Figure 15a). The underestimate for 0% cloud cover is consistent with Figure 14b where RCA3 also has a negative bias (period UTC) in cloud-free ISR. It is noteworthy that the trend of ISR with increasing cloud fraction in the RCA3 model runs parallel to the observations across the entire cloud fraction range (0-100%). This suggests that the primary ISR cloudradiation problem in this model is due to a clear-sky atmosphere that is to opaque too ISR. This error can prejudice ISR in cloudy conditions due to an underestimate of solar radiation incident at the top of frequent boundary layer clouds. In Figure 15 we also show the ISR-cloud fraction relationship derived from the RCA3aero integration, where the clear-sky absorption and scattering due to aerosols was reduced in the model (see Section 4.1). With reduced aerosol absorption and scattering the relationship between ISR and cloud cover is clearly improved in RCAaero for all SZAs and cloud fraction regimes. CRCM and GEM-LAM show quite accurate ISR-cloud fraction relationship for the highest sun elevation (Figure 15a). Again, for 0% of cloud cover this is in accord with Figure 14b (18-21 UTC). For the lower SZAs, agreement with the
24 24 observations decreases for both models, while the trend of ISR with increasing cloud fraction is relatively well captured. 6. Summary and conclusions. The simulated SRB from 3 RCMs has been evaluated against surface observations from 6 SURFRAD sites distributed over the continental USA. Comparison of the mean annual cycles of ISR and DLR showed that GEM-LAM and CRCM accurately represented ISR in winter but overestimated in summer season. In contrast, RCA3 produced an accurate ISR in summer but overestimated in spring and winter. All models underestimated observed cloud cover. The mean annual cycle of DLR was well simulated by GEM-LAM and RCA3 with an underestimate in the winter season, while CRCM systematically underestimated DLR throughout the year. To better understand these biases we compared the mean annual cycles of DLR and ISR under cloud-free and all-sky conditions. Cloud-free comparisons showed that GEM-LAM and CRCM give fairly good ISR results, even for the summer season, suggesting that erroneous cloud cover is the principal reason for all-sky ISR biases in these 2 models. GEM-LAM exhibited an unrealistically high frequency of large ISR values under overcast conditions, suggesting too frequent simulation of complete sky-cover by optically thin (cirrus) clouds in this model. RCA3 had an underestimate of summer ISR for cloud-free conditions, which balanced a cloud underestimate and led to a relatively accurate all-sky ISR in this model. We subsequently showed that a large part of the clear-sky flux errors in RCA3 could be attributed to an excess absorption and scattering by aerosols in the clear-sky portion of the radiation code. DLR biases in cloud-free conditions for GEM-LAM and RCA3 were rather similar to the all-sky biases suggesting DLR biases in these models are mainly due to
25 25 cloud-free errors. This was confirmed in the normalized frequency distribution plots for DJF DLR, where all 3 models were systematically biased towards low values in clear-sky conditions, consistent with earlier studies (e.g. Wild et al. 2001). GEM- LAM had the smallest bias in these conditions, this was attributed to its inclusion of trace gas contributions to DLR. CRCM DLR was underestimated year round with this error being due both to a cloud fraction underestimate and a negative bias in cloud emissivity resulting from a systematic underestimate of LWP. Cloud radiative forcing (CRF) was evaluated for the 3 RCMs against surface observations. All models underestimated ISR CRF primarily due to a lack of clouds. DLR CRF was underestimated in GEM-LAM and CRCM partially due to the cloud cover underestimate while the RCA3 DLR CRF was accurate due to a positive bias in cloud emissivity balancing the underestimate of cloud fraction. Comparison of the mean diurnal cycle of ISR showed that all models had smaller biases under cloud-free conditions indicating cloud cover as the primary cause of all-sky errors. The diurnal cycle of DLR for RCA3 model was well simulated for both cloud cover conditions. CRCM had a continuous DLR all-sky bias, which decreased in the evening, suggesting the CRCM lower atmosphere is too warm due to excess ISR values at the surface throughout the day. GEM-LAMs accurate representation of DLR all-sky was also a result of underestimated cloud cover along with its atmosphere being too warm, leading to overestimate of clear-sky DLR. This work highlights the importance of analyzing the individual components of the total-sky surface radiation flux in climate models. In doing this we can better identify the actual cloud or radiation processes, in a given model, that are the root cause of errors in the total-sky SRB. A number of the points highlighted in this work are presently being addressed in the respective models. To make progress in simulating cloud-radiation feedbacks it is important that the underlying physical processes controlling the surface radiative budget are well simulated. This is
26 26 particularly true with respect to error compensation within the various components of the SRB. Acknowledgements: This work was funded by the grant provided by the Canadian Foundation for Climate and Atmospheric Sciences, grant number which funded the Canadian Regional Climate Modeling and Diagnostics network.
27 27 REFERENCES Betts, A. K. and Harshvardan, J., 1987: Thermodynamic Constraint on the Cloud Liquid Water Feedback in climate Models. J. Geophys. Res., 92, Caya, D. and Laprise, R., 1999: A Semi-Implicit Semi-Lagrangian Regional Climate Model: The Canadian RCM. Monthly Weather Review, 127, Côté, J., J.-G. Desmarais, S. Gravel, A. Méthot, A. Patoine, M. Roch et A. Staniforth, 1998: The operational CMC-MRB global environnemental multiscale (GEM) model. Part I: Design considerations and formulation. Mon. Wea. Rev, 126, Fouquart, Y. and B. Bonnel, 1980: Computation of Solar Heating of the Earth s Atmosphere : A New Parameterization. Contributions to Atmospheric Physics, 53, No.1, Garrat and Prata, 1996: Downwelling Longwave Fluxes at Continental Surface A Comparison of Observations with GCM Simulations and Implications for the Global Land-Surface Radiation Budget. Journal of Climate, 9, Accessed March 28, Accessed March 28, 2007 Iacono, M. J., E. J. Mlawer, S. A. Clough, and J.-J. Morcrette, 2000: Impact of an improved longwave radiation model, RRTM, on the energy budget and thermodynamic properties of the NCAR community climate model, CCM3. J. Geophys. Res., 105, 14,873-14,890. Jones, C. G., U. Willén, A. Ullerstig, U. Hansson, 2004: The Rossby Centre Regional Atmospheric Climate Model Part I: Model Climatology and Performance for the Present Climate over Europe. Ambio 33:4-5, Karlsson, K. G., 2003: A 10 Year Cloud Climatology Over Scandinavia Derived From NOAA Advanced Very High Resolution Radiometer Imagery. International Journal of Climatology, 23, Karlsson, K. G., U. Willén, C. Jones, K. Wyser, 2008: Evaluation of Regional Cloud Climate Simulations Over Scandinavia using Ten-Year NOAA AVHRR Cloud Climatology. Submitted to Journal of Geophysical Research.
28 28 Lenderink, G., A P Siebesma, S Cheinet, S Irons, C G Jones, P Marquet, F Mller, D Olmeda, J Calvo, E Sanchez, and P M M Soares, 2004 The diurnal cycle of shallow cumulus clouds over land: A single-column model intercomparison study Q. J. R. Meteorol. Soc, 130, Li, J. and H. W. Barker, 2005: A Radiation Algoritm with Correlated-k Distribution. Part I: Local Thermal Equilibrium. Journal of the Atmospheric Science, 62, Morcrette J. -J, 1991: Radiation and Cloud Radiative Properties in the European Centre for Medium Range Weather Forecast Forecasting System. Journal of Geophysical Research., 96, Räisänen, P., M. Rummukainen and J. Räisänen, 2000: Modification of the HIRLAM radiation scheme for use in the Rossby Centre regional Atmospheric Climate model. Report 49, Department of Meteorology, University of Helsinki, 71pp. Roads, J., R Lawford, E. Bainto, E. Berbery, S. Chen, B. Fekete, K. Gallo, A. Grundstein, W. Higgins, M. Kanamitsu, W. Krajewski, V. Lskshmi, D. Leathers, D. Lettermaier, L. Luo, E. Maurer, T. Meyers, D. Miller, K. Mitchell, T. Mote, R. Pinker, T. Reichler, D. Robinson, A. Robock, J. Smith, G. Srinivasan, K. Vinnikov, T. Vonder Haar, C. Vorosmarty, S. Williams, E. Yarosh, 2003: GCIP water and energy budget synthesis (WEBS), J. Geophys. Res., 108(D16), 8609, doi: /2002jd Rogers C. D., 1977: Radiative Processes in the Atmosphere. ECMWF Seminars, Reading, Savijarvi H., 1990: Fast Radiation Parameterisation Schemes for Mesoscale and Short-Range Forecast Models. Journal of Applied Meteorology, 29, Shettle E.P. and R.W. Fenn, Models for the aerosols of the lower atmosphere and effects of humidity variations on their optical properties, Air Force Geophys. Laboratory, Environmental Papers No. 676, Shupe, M.D., S.Y. Matrosov, and T. Uttal, 2006: Arctic mixed-phase cloud properties derive from surface-based sensors at SHEBA. J. Atmos. Sci., 63, Slingo, A. and H.M. Schrecker, On the shortwave radiative properties of stratiform water clouds. Q. J. R. Meteorol. Soc., 108, Stephens G. L., 1984: Review of the Parameterisation of Radiation for Numerical Weather Prediction and Climate Models. Mon. Wea. Rev., 112,
29 29 Sundquist, H., E. Berge, J. E. Kristjansson, 1989: Condensation and Cloud Parameterisation Studies with a Mesoscale Numerical Weather Prediction Model. Mon. Wea. Rev.,117, Toon, O. B., and J. B. Pollack, 1976: A global average model of atmospheric aerosols for radiative transfer calculations. J. Appl. Meteor., 15, Wild, M, A. Ohmura, H. Gilgen, and E. Roeckner, 1995: Validation of GCM simulated radiative fluxes using surface observations. Journal of climate, 8, Wild, M., Dümenil, L., and Schulz, J.P., 1996: Regional climate simulation with a high resolution GCM: surface hydrology. Climate Dynamics, 12, Wild, M, A. Ohmura, H. Gilgen, 2001: Evaluation of Downward Longvawe Radiation in General Circulation Models. Journal of Climate, 14, Yang, G.-Y. and Slingo, J., 2001: The dirunal cycle in the tropics. Mon. Weather Rev., 129:
30 30 LIST OF FIGURES AND TABLES Table 1: Winter and summer season DLR and ISR biases for 3 RCMs at 6 individual SURFRAD stations for all-sky conditions. Table 2: As Table 1 but for cloud-free conditions. Figure 1: SURFRAD ground stations used in this study (Spatial map derived from: Figure 2: (a) Mean annual cycle of monthly mean ISR, (b) DLR, (c) monthly mean differences in ISR between each model and observations, (d) same as (c) for DLR. All values are averaged across the entire diurnal cycle. In all figures in this paper observations will be presented in black, GEM-LAM results in red, CRCM in green and RCA3 in blue. Figure 3: Mean Annual Cycle of Cloud Cover ( ). Averaged for all Sites, April-August. Figure 4: Distribution of 3 hourly fluxes from RCMs and observation, a) ISR winter season, b) DLR winter season, c) ISR summer season, d) DLR summer season. The inset on 1.4a shows in more detail GEM-LAM and observed values within the range 5-200Wm 2. Figure 5: Mean annual cycle of: (a) ISR, total-sky, (b) DLR, total-sky, (c) ISR, clearsky, (d) DLR, clear-sky. Daytime, period 15-21UTC. Figure 6: Mean annual cycle of cloud cover. Daytime period UTC. Figure 7: Mean annual cycle of of JJA ISR for observations and RCA3 with two different aerosol treatments, a) all-sky, b) clear-sky. Daytime, period UTC. Figure 8: Mean annual cycle of cloud radiative forcing: a) ISR CRF, b) DLR CRF,. Daytime period UTC. Figure 9: Observed ISR plotted as a function of observed cloud cover for Bondville a) April, b) July. Four different points in the diurnal cycle are presented.

31 31 Figure 10: Normalised frequency distribution of LWP for CRCM against observations at the ARM Southern Great Plains site: a) winter season, b) summer season. Figure 11: Normalised frequency distribution of winter season ISR and DLR 3 hourly fluxes from RCMs and observations. Analyzed daytime period UTC: a) ISR all-sky, b) ISR cloud-free, c) ISR cloudy, d) DLR all-sky, e) DLR cloud-free, f) DLR cloudy. Cloud-free conditions are defined when the respective model and observations have cloud cover less than 10% for a given 3 hour period, overcast conditions are for cloud cover greater than 90% for a 3 hour period. Figure 12: As Figure 11 but for JJA season. Figure 13: Normalised frequency distribution of cloud cover 3 hourly data from RCMs and observations. Analyzed daytime period UTC, a) winter season, b) summer season. Figure 14: Mean diurnal cycle of :(a) ISR all-sky, (b) ISR cloud-free, (c) DLR all-sky (d) DLR cloud-free. Season April-August. Figure 15: ISR plotted as a function of increasing cloud fraction for: (a) 20-40deg SZA, (b) 40-60deg SZA, (c) 60-90deg SZA. A mean ISR value has been calculated for each 1% step in cloud fraction for each site and then averaged across the 6 sites. This procedure was performed separately for the 3 respective SZAs. A 10% running mean was then applied to each SZA curve to smooth the resulting ISR cloud curves presented in the figure. fig: 1
32 32 fig:2 fig:3
33 33 fig:4 fig:5
34 34 fig:6 fig:7

35 35 fig:8 fig:9
36 fig:10 36
37 fig: 11 37
38 fig:12 38
39 39 fig:13 fig: 14
40 fig: 15 40

41 41 table: 1 table: 2
Andrey Martynov 1, René Laprise 1, Laxmi Sushama 1, Katja Winger 1, Bernard Dugas 2. Université du Québec à Montréal 2
 CMOS-2012, Montreal, 31 May 2012 Reanalysis-driven climate simulation over CORDEX North America domain using the Canadian Regional Climate Model, version 5: model performance evaluation Andrey Martynov
Analysis of Cloud-Radiation Interactions Using ARM Observations and a Single-Column Model
 Analysis of Cloud-Radiation Interactions Using ARM Observations and a Single-Column Model S. F. Iacobellis, R. C. J. Somerville, D. E. Lane, and J. Berque Scripps Institution of Oceanography University
The PRECIS Regional Climate Model
 The PRECIS Regional Climate Model General overview (1) The regional climate model (RCM) within PRECIS is a model of the atmosphere and land surface, of limited area and high resolution and locatable over
Radiative Climatology of the North Slope of Alaska and the Adjacent Arctic Ocean
 Radiative Climatology of the North Slope of Alaska and the Adjacent Arctic Ocean C. Marty, R. Storvold, and X. Xiong Geophysical Institute University of Alaska Fairbanks, Alaska K. H. Stamnes Stevens Institute
The skill of ECMWF cloudiness forecasts
 from Newsletter Number 143 Spring 215 METEOROLOGY The skill of ECMWF cloudiness forecasts tounka25/istock/thinkstock doi:1.21957/lee5bz2g This article appeared in the Meteorology section of ECMWF Newsletter
Surface Radiation Budget from ARM Satellite Retrievals
 Surface Radiation Budget from ARM Satellite Retrievals P. Minnis, D. P. Kratz, and T. P. charlock Atmospheric Sciences National Aeronautics and Space Administration Langley Research Center Hampton, Virginia
P1.34 MULTISEASONALVALIDATION OF GOES-BASED INSOLATION ESTIMATES. Jason A. Otkin*, Martha C. Anderson*, and John R. Mecikalski #
 P1.34 MULTISEASONALVALIDATION OF GOES-BASED INSOLATION ESTIMATES Jason A. Otkin*, Martha C. Anderson*, and John R. Mecikalski # *Cooperative Institute for Meteorological Satellite Studies, University of
Influence of clouds on radiative fluxes in the Arctic. J. English, J. Kay, A. Gettelman CESM Workshop / PCWG Meeting June 20, 2012
 Influence of clouds on radiative fluxes in the Arctic J. English, J. Kay, A. Gettelman CESM Workshop / PCWG Meeting June 20, 2012 The complexity of arctic clouds Arctic Mixed-Phase Clouds Morrison et al.,
Electromagnetic Radiation. Radiation and the Planetary Energy Balance. Electromagnetic Spectrum of the Sun
 Radiation and the Planetary Energy Balance Electromagnetic Radiation Solar radiation warms the planet Conversion of solar energy at the surface Absorption and emission by the atmosphere The greenhouse
Climate Dynamics (PCC 587): Feedbacks & Clouds
: Feedbacks & Clouds") Climate Dynamics (PCC 587): Feedbacks & Clouds DARGAN M. W. FRIERSON UNIVERSITY OF WASHINGTON, DEPARTMENT OF ATMOSPHERIC SCIENCES DAY 6: 10-14-13 Feedbacks Climate forcings change global temperatures directly
Climate Dynamics (PCC 587): Feedbacks & Clouds DARGAN M. W. FRIERSON UNIVERSITY OF WASHINGTON, DEPARTMENT OF ATMOSPHERIC SCIENCES DAY 6: 10-14-13 Feedbacks Climate forcings change global temperatures directly
Spectrum of Radiation. Importance of Radiation Transfer. Radiation Intensity and Wavelength. Lecture 3: Atmospheric Radiative Transfer and Climate
 Lecture 3: Atmospheric Radiative Transfer and Climate Radiation Intensity and Wavelength frequency Planck s constant Solar and infrared radiation selective absorption and emission Selective absorption
Lecture 3: Atmospheric Radiative Transfer and Climate
 Lecture 3: Atmospheric Radiative Transfer and Climate Solar and infrared radiation selective absorption and emission Selective absorption and emission Cloud and radiation Radiative-convective equilibrium
The Climatology of Clouds using surface observations. S.G. Warren and C.J. Hahn Encyclopedia of Atmospheric Sciences.
 The Climatology of Clouds using surface observations S.G. Warren and C.J. Hahn Encyclopedia of Atmospheric Sciences Gill-Ran Jeong Cloud Climatology The time-averaged geographical distribution of cloud
Understanding the Greenhouse Effect
 EESC V2100 The Climate System spring 200 Understanding the Greenhouse Effect Yochanan Kushnir Lamont Doherty Earth Observatory of Columbia University Palisades, NY 1096, USA kushnir@ldeo.columbia.edu Equilibrium
Lecture 2: Global Energy Cycle
 Lecture 2: Global Energy Cycle Planetary energy balance Greenhouse Effect Vertical energy balance Solar Flux and Flux Density Solar Luminosity (L) the constant flux of energy put out by the sun L = 3.9
Antarctic Cloud Radiative Forcing at the Surface Estimated from the AVHRR Polar Pathfinder and ISCCP D1 Datasets,
 JUNE 2003 PAVOLONIS AND KEY 827 Antarctic Cloud Radiative Forcing at the Surface Estimated from the AVHRR Polar Pathfinder and ISCCP D1 Datasets, 1985 93 MICHAEL J. PAVOLONIS Cooperative Institute for
Comparison of Long-term Downward Radiation Observations at Tateno with JRA-25 and ERA-40 Data
 Comparison of Long-term Downward Radiation Observations at Tateno with JRA-25 and ERA-40 Data Nozomu Ohkawara, Yasuo Hirose Ozone and Radiation Division, Aerological Observatory, Japan Meteorological Agency
Assessing the Radiative Impact of Clouds of Low Optical Depth
 Assessing the Radiative Impact of Clouds of Low Optical Depth W. O'Hirok and P. Ricchiazzi Institute for Computational Earth System Science University of California Santa Barbara, California C. Gautier
Microphysical Properties of Single and Mixed-Phase Arctic Clouds Derived From Ground-Based AERI Observations
 Microphysical Properties of Single and Mixed-Phase Arctic Clouds Derived From Ground-Based AERI Observations Dave Turner University of Wisconsin-Madison Pacific Northwest National Laboratory 8 May 2003
Radiation Quantities in the ECMWF model and MARS
 Radiation Quantities in the ECMWF model and MARS Contact: Robin Hogan (r.j.hogan@ecmwf.int) This document is correct until at least model cycle 40R3 (October 2014) Abstract Radiation quantities are frequently
Land-cloud-climate Coupling on the Canadian Prairies
 Land-cloud-climate Coupling on the Canadian Prairies Dr. Alan K. Betts (Atmospheric Research, Pittsford, VT 05763) Ray Desjardin, D. Cerkowniak (Agriculture-Canada) and Ahmed Tawfik (NCAR) akbetts@aol.com
Effect of clouds on the calculated vertical distribution of shortwave absorption in the tropics
 Click Here for Full Article JOURNAL OF GEOPHYSICAL RESEARCH, VOL. 113,, doi:10.1029/2008jd009791, 2008 Effect of clouds on the calculated vertical distribution of shortwave absorption in the tropics Sally
Earth s Heat Budget. What causes the seasons? Seasons
 Earth s Heat Budget Solar energy and the global heat budget Transfer of heat drives weather and climate Ocean circulation A. Rotation of the Earth B. Distance from the Sun C. Variations of Earth s orbit
Changes in Earth s Albedo Measured by satellite
 Changes in Earth s Albedo Measured by satellite Bruce A. Wielicki, Takmeng Wong, Norman Loeb, Patrick Minnis, Kory Priestley, Robert Kandel Presented by Yunsoo Choi Earth s albedo Earth s albedo The climate
Coupling Climate to Clouds, Precipitation and Snow
 Coupling Climate to Clouds, Precipitation and Snow Alan K. Betts akbetts@aol.com http://alanbetts.com Co-authors: Ray Desjardins, Devon Worth Agriculture and Agri-Food Canada Shusen Wang and Junhua Li
Radiation in climate models.
 Lecture. Radiation in climate models. Objectives:. A hierarchy of the climate models.. Radiative and radiative-convective equilibrium.. Examples of simple energy balance models.. Radiation in the atmospheric
Evidence of Clear-Sky Daylight Whitening: Are we already conducting geoengineering?
 Evidence of Clear-Sky Daylight Whitening: Are we already conducting geoengineering? Chuck Long (NOAA ESRL GMD/CIRES) Jim Barnard & Connor Flynn (PNNL) Are we already conducting geoengineering? We think
Lecture 4: Radiation Transfer
 Lecture 4: Radiation Transfer Spectrum of radiation Stefan-Boltzmann law Selective absorption and emission Reflection and scattering Remote sensing Importance of Radiation Transfer Virtually all the exchange
Evaluating Parametrizations using CEOP
 Evaluating Parametrizations using CEOP Paul Earnshaw and Sean Milton Met Office, UK Crown copyright 2005 Page 1 Overview Production and use of CEOP data Results SGP Seasonal & Diurnal cycles Other extratopical
Regional offline land surface simulations over eastern Canada using CLASS. Diana Verseghy Climate Research Division Environment Canada
 Regional offline land surface simulations over eastern Canada using CLASS Diana Verseghy Climate Research Division Environment Canada The Canadian Land Surface Scheme (CLASS) Originally developed for the
CLIMATE AND CLIMATE CHANGE MIDTERM EXAM ATM S 211 FEB 9TH 2012 V1
 CLIMATE AND CLIMATE CHANGE MIDTERM EXAM ATM S 211 FEB 9TH 2012 V1 Name: Student ID: Please answer the following questions on your Scantron Multiple Choice [1 point each] (1) The gases that contribute to
1.0 BACKGROUND 1.1 Surface Radiation
 1.0 BACKGROUND 1.1 Surface Radiation Meteorologists have utilized recent advances in computer speeds and atmospheric models to create increasingly accurate models of the environment. The computational
1. The frequency of an electromagnetic wave is proportional to its wavelength. a. directly *b. inversely
 CHAPTER 3 SOLAR AND TERRESTRIAL RADIATION MULTIPLE CHOICE QUESTIONS 1. The frequency of an electromagnetic wave is proportional to its wavelength. a. directly *b. inversely 2. is the distance between successive
Modeling Challenges At High Latitudes. Judith Curry Georgia Institute of Technology
 Modeling Challenges At High Latitudes Judith Curry Georgia Institute of Technology Physical Process Parameterizations Radiative transfer Surface turbulent fluxes Cloudy boundary layer Cloud microphysics
Direct assimilation of all-sky microwave radiances at ECMWF
 Direct assimilation of all-sky microwave radiances at ECMWF Peter Bauer, Alan Geer, Philippe Lopez, Deborah Salmond European Centre for Medium-Range Weather Forecasts Reading, Berkshire, UK Slide 1 17
An Annual Cycle of Arctic Cloud Microphysics
 An Annual Cycle of Arctic Cloud Microphysics M. D. Shupe Science and Technology Corporation National Oceanic and Atmospheric Administration Environmental Technology Laboratory Boulder, Colorado T. Uttal
Evaluation of Satellite and Reanalysis Products of Downward Surface Solar Radiation over East Asia
 International Workshop on Land Use/Cover Changes and Air Pollution in Asia August 4-7th, 2015, Bogor, Indonesia Evaluation of Satellite and Reanalysis Products of Downward Surface Solar Radiation over
5. General Circulation Models
 5. General Circulation Models I. 3-D Climate Models (General Circulation Models) To include the full three-dimensional aspect of climate, including the calculation of the dynamical transports, requires
CLIMATE CHANGE Albedo Forcing ALBEDO FORCING
 ALBEDO FORCING Albedo forcing is the hypothesis that variations in the Earth s reflectance of solar radiation can bring about global climate change. This hypothesis is undeniable in principle; since virtually
Climate Dynamics (PCC 587): Clouds and Feedbacks
: Clouds and Feedbacks") Climate Dynamics (PCC 587): Clouds and Feedbacks D A R G A N M. W. F R I E R S O N U N I V E R S I T Y O F W A S H I N G T O N, D E P A R T M E N T O F A T M O S P H E R I C S C I E N C E S D A Y 7 : 1
Climate Dynamics (PCC 587): Clouds and Feedbacks D A R G A N M. W. F R I E R S O N U N I V E R S I T Y O F W A S H I N G T O N, D E P A R T M E N T O F A T M O S P H E R I C S C I E N C E S D A Y 7 : 1
Characterization of the Present-Day Arctic Atmosphere in CCSM4
 Characterization of the Present-Day Arctic Atmosphere in CCSM4 Gijs de Boer 1, Bill Chapman 2, Jennifer Kay 3, Brian Medeiros 3, Matthew Shupe 4, Steve Vavrus, and John Walsh 6 (1) (2) (3) (4) ESRL ()
Journal of the Meteorological Society of Japan, Vol. 75, No. 1, pp , Day-to-Night Cloudiness Change of Cloud Types Inferred from
 Journal of the Meteorological Society of Japan, Vol. 75, No. 1, pp. 59-66, 1997 59 Day-to-Night Cloudiness Change of Cloud Types Inferred from Split Window Measurements aboard NOAA Polar-Orbiting Satellites
Energy Balance and Temperature. Ch. 3: Energy Balance. Ch. 3: Temperature. Controls of Temperature
 Energy Balance and Temperature 1 Ch. 3: Energy Balance Propagation of Radiation Transmission, Absorption, Reflection, Scattering Incoming Sunlight Outgoing Terrestrial Radiation and Energy Balance Net
Energy Balance and Temperature
 Energy Balance and Temperature 1 Ch. 3: Energy Balance Propagation of Radiation Transmission, Absorption, Reflection, Scattering Incoming Sunlight Outgoing Terrestrial Radiation and Energy Balance Net
How Accurate is the GFDL GCM Radiation Code? David Paynter,
 Radiation Processes in the GFDL GCM: How Accurate is the GFDL GCM Radiation Code? David Paynter, Alexandra Jones Dan Schwarzkopf, Stuart Freidenreich and V.Ramaswamy GFDL, Princeton, New Jersey 13th June
Arctic Climate Change. Glen Lesins Department of Physics and Atmospheric Science Dalhousie University Create Summer School, Alliston, July 2013
 Arctic Climate Change Glen Lesins Department of Physics and Atmospheric Science Dalhousie University Create Summer School, Alliston, July 2013 When was this published? Observational Evidence for Arctic
Observations of Integrated Water Vapor and Cloud Liquid Water at SHEBA. James Liljegren
 Observations of Integrated Water Vapor and Cloud Liquid Water at SHEBA James Liljegren Ames Laboratory Ames, IA 515.294.8428 liljegren@ameslab.gov Introduction In the Arctic water vapor and clouds influence
Tropical cirrus and water vapor: an effective Earth infrared iris feedback?
 Atmos. Chem. Phys.,, 31 3, www.atmos-chem-phys.org/acp//31/ Atmospheric Chemistry and Physics Tropical cirrus and water vapor: an effective Earth infrared iris feedback? Q. Fu, M. Baker, and D. L. Hartmann
All objects emit radiation. Radiation Energy that travels in the form of waves Waves release energy when absorbed by an object. Earth s energy budget
 Radiation Energy that travels in the form of waves Waves release energy when absorbed by an object Example: Sunlight warms your face without necessarily heating the air Shorter waves carry more energy
The Ocean-Atmosphere System II: Oceanic Heat Budget
 The Ocean-Atmosphere System II: Oceanic Heat Budget C. Chen General Physical Oceanography MAR 555 School for Marine Sciences and Technology Umass-Dartmouth MAR 555 Lecture 2: The Oceanic Heat Budget Q
Warming Earth and its Atmosphere The Diurnal and Seasonal Cycles
 Warming Earth and its Atmosphere The Diurnal and Seasonal Cycles Or, what happens to the energy received from the sun? First We Need to Understand The Ways in Which Heat Can be Transferred in the Atmosphere
Radiation and the atmosphere
 Radiation and the atmosphere Of great importance is the difference between how the atmosphere transmits, absorbs, and scatters solar and terrestrial radiation streams. The most important statement that
PUBLICATIONS. Journal of Advances in Modeling Earth Systems. Mitigating errors in surface temperature forecasts using approximate radiation updates
 PUBLICATIONS Journal of Advances in Modeling Earth Systems RESEARCH ARTICLE 1.12/215MS455 Key Points: Weather models can have large temperature errors at coastlines A new scheme is proposed to correct
Variability in Global Top-of-Atmosphere Shortwave Radiation Between 2000 And 2005
 Variability in Global Top-of-Atmosphere Shortwave Radiation Between 2000 And 2005 Norman G. Loeb NASA Langley Research Center Hampton, VA Collaborators: B.A. Wielicki, F.G. Rose, D.R. Doelling February
GEO1010 tirsdag
 GEO1010 tirsdag 31.08.2010 Jørn Kristiansen; jornk@met.no I dag: Først litt repetisjon Stråling (kap. 4) Atmosfærens sirkulasjon (kap. 6) Latitudinal Geographic Zones Figure 1.12 jkl TØRR ATMOSFÆRE Temperature
Observed Southern Ocean Cloud Properties and Shortwave Reflection
 Observed Southern Ocean Cloud Properties and Shortwave Reflection Daniel T McCoy* 1, Dennis L Hartmann 1, and Daniel P Grosvenor 2 University of Washington 1 University of Leeds 2 *dtmccoy@atmosuwedu Introduction
Lecture 2: Global Energy Cycle
 Lecture 2: Global Energy Cycle Planetary energy balance Greenhouse Effect Selective absorption Vertical energy balance Solar Flux and Flux Density Solar Luminosity (L) the constant flux of energy put out
Solar Flux and Flux Density. Lecture 2: Global Energy Cycle. Solar Energy Incident On the Earth. Solar Flux Density Reaching Earth
 Lecture 2: Global Energy Cycle Solar Flux and Flux Density Planetary energy balance Greenhouse Effect Selective absorption Vertical energy balance Solar Luminosity (L) the constant flux of energy put out
Earth s Heat Budget. What causes the seasons? Seasons
 Earth s Heat Budget Solar energy and the global heat budget Transfer of heat drives weather and climate Ocean circulation A. Rotation of the Earth B. Distance from the Sun C. Variations of Earth s orbit
Radiative Effects of Contrails and Contrail Cirrus
 Radiative Effects of Contrails and Contrail Cirrus Klaus Gierens, DLR Oberpfaffenhofen, Germany Contrail-Cirrus, other Non-CO2 Effects and Smart Flying Workshop, London, 22 Oktober 2015 Two closely related
Interannual Variations of Arctic Cloud Types:
 Interannual Variations of Arctic Cloud Types: Relationships with Sea Ice and Surface Temperature Ryan Eastman Stephen Warren University of Washington Department of Atmospheric Sciences Changes in Arctic
NSF 2005 CPT Report. Jeffrey T. Kiehl & Cecile Hannay
 NSF 2005 CPT Report Jeffrey T. Kiehl & Cecile Hannay Introduction: The focus of our research is on the role of low tropical clouds in affecting climate sensitivity. Comparison of climate simulations between
Applications of the SEVIRI window channels in the infrared.
 Applications of the SEVIRI window channels in the infrared jose.prieto@eumetsat.int SEVIRI CHANNELS Properties Channel Cloud Gases Application HRV 0.7 Absorption Scattering
Incorporation of 3D Shortwave Radiative Effects within the Weather Research and Forecasting Model
 Incorporation of 3D Shortwave Radiative Effects within the Weather Research and Forecasting Model W. O Hirok and P. Ricchiazzi Institute for Computational Earth System Science University of California
Standalone simulations: CAM3, CAM4 and CAM5
 Standalone simulations: CAM3, and CAM5 CAM5 Model Development Team Cécile Hannay, Rich Neale, Andrew Gettelman, Sungsu Park, Joe Tribbia, Peter Lauritzen, Andrew Conley, Hugh Morrison, Phil Rasch, Steve
Radiation in the atmosphere
 Radiation in the atmosphere Flux and intensity Blackbody radiation in a nutshell Solar constant Interaction of radiation with matter Absorption of solar radiation Scattering Radiative transfer Irradiance
Arctic Boundary Layer
 Annual Seminar 2015 Physical processes in present and future large-scale models Arctic Boundary Layer Gunilla Svensson Department of Meteorology and Bolin Centre for Climate Research Stockholm University,
The Atmosphere. Importance of our. 4 Layers of the Atmosphere. Introduction to atmosphere, weather, and climate. What makes up the atmosphere?
 The Atmosphere Introduction to atmosphere, weather, and climate Where is the atmosphere? Everywhere! Completely surrounds Earth February 20, 2010 What makes up the atmosphere? Argon Inert gas 1% Variable
1. Weather and climate.
 Lecture 31. Introduction to climate and climate change. Part 1. Objectives: 1. Weather and climate. 2. Earth s radiation budget. 3. Clouds and radiation field. Readings: Turco: p. 320-349; Brimblecombe:
Analysis of the Hydrologic Cycle in the Community Atmosphere Model
 Meteorology Senior Theses Undergraduate Theses and Capstone Projects 12-1-2017 Analysis of the Hydrologic Cycle in the Community Atmosphere Model Kyle A. Knight Iowa State University Follow this and additional
Towards a better use of AMSU over land at ECMWF
 Towards a better use of AMSU over land at ECMWF Blazej Krzeminski 1), Niels Bormann 1), Fatima Karbou 2) and Peter Bauer 1) 1) European Centre for Medium-range Weather Forecasts (ECMWF), Shinfield Park,
Fundamentals of Atmospheric Radiation and its Parameterization
 Source Materials Fundamentals of Atmospheric Radiation and its Parameterization The following notes draw extensively from Fundamentals of Atmospheric Physics by Murry Salby and Chapter 8 of Parameterization
1. GLACIER METEOROLOGY - ENERGY BALANCE
 Summer School in Glaciology McCarthy, Alaska, 5-15 June 2018 Regine Hock Geophysical Institute, University of Alaska, Fairbanks 1. GLACIER METEOROLOGY - ENERGY BALANCE Ice and snow melt at 0 C, but this
Single-Column Modeling, General Circulation Model Parameterizations, and Atmospheric Radiation Measurement Data
 Single-Column ing, General Circulation Parameterizations, and Atmospheric Radiation Measurement Data S. F. Iacobellis, D. E. Lane and R. C. J. Somerville Scripps Institution of Oceanography University
Lecture # 04 January 27, 2010, Wednesday Energy & Radiation
 Lecture # 04 January 27, 2010, Wednesday Energy & Radiation Kinds of energy Energy transfer mechanisms Radiation: electromagnetic spectrum, properties & principles Solar constant Atmospheric influence
Energy Systems, Structures and Processes Essential Standard: Analyze patterns of global climate change over time Learning Objective: Differentiate
 Energy Systems, Structures and Processes Essential Standard: Analyze patterns of global climate change over time Learning Objective: Differentiate between weather and climate Global Climate Focus Question
A Preliminary Assessment of the Simulation of Cloudiness at SHEBA by the ECMWF Model. Tony Beesley and Chris Bretherton. Univ.
 A Preliminary Assessment of the Simulation of Cloudiness at SHEBA by the ECMWF Model Tony Beesley and Chris Bretherton Univ. of Washington 16 June 1998 Introduction This report describes a preliminary
HEATING THE ATMOSPHERE
 HEATING THE ATMOSPHERE Earth and Sun 99.9% of Earth s heat comes from Sun But
ATMOS 5140 Lecture 1 Chapter 1
 ATMOS 5140 Lecture 1 Chapter 1 Atmospheric Radiation Relevance for Weather and Climate Solar Radiation Thermal Infrared Radiation Global Heat Engine Components of the Earth s Energy Budget Relevance for
NOTES AND CORRESPONDENCE. Seasonal Variation of the Diurnal Cycle of Rainfall in Southern Contiguous China
 6036 J O U R N A L O F C L I M A T E VOLUME 21 NOTES AND CORRESPONDENCE Seasonal Variation of the Diurnal Cycle of Rainfall in Southern Contiguous China JIAN LI LaSW, Chinese Academy of Meteorological
Coupling of Diurnal Climate to Clouds, Land-use and Snow
 Coupling of Diurnal Climate to Clouds, Land-use and Snow Alan K. Betts akbetts@aol.com http://alanbetts.com Co-authors: Ray Desjardins, Devon Worth, Darrel Cerkowniak Agriculture and Agri-Food Canada Shusen
Chapter 6: Modeling the Atmosphere-Ocean System
 Chapter 6: Modeling the Atmosphere-Ocean System -So far in this class, we ve mostly discussed conceptual models models that qualitatively describe the system example: Daisyworld examined stable and unstable
Extreme Weather and Climate Change: the big picture Alan K. Betts Atmospheric Research Pittsford, VT NESC, Saratoga, NY
 Extreme Weather and Climate Change: the big picture Alan K. Betts Atmospheric Research Pittsford, VT http://alanbetts.com NESC, Saratoga, NY March 10, 2018 Increases in Extreme Weather Last decade: lack
Radiation balance of the Earth. 6. Earth radiation balance under present day conditions. Top of Atmosphere (TOA) Radiation balance
 Radiation balance") Radiation balance of the Earth Top of Atmosphere (TOA) radiation balance 6. Earth radiation balance under present day conditions Atmospheric radiation balance: Difference between TOA and surface radiation
Radiation balance of the Earth Top of Atmosphere (TOA) radiation balance 6. Earth radiation balance under present day conditions Atmospheric radiation balance: Difference between TOA and surface radiation
9/5/16. Section 3-4: Radiation, Energy, Climate. Common Forms of Energy Transfer in Climate. Electromagnetic radiation.
 Section 3-4: Radiation, Energy, Climate Learning outcomes types of energy important to the climate system Earth energy balance (top of atm., surface) greenhouse effect natural and anthropogenic forcings
An evaluation of Arctic cloud and radiation processes during the SHEBA year: simulation results from eight Arctic regional climate models
 Clim Dyn (28) 3:23 223 DOI 1.17/s382-7-286-1 An evaluation of Arctic cloud and radiation processes during the SHEBA year: simulation results from eight Arctic regional climate models K. Wyser Æ C. G. Jones
Observational Needs for Polar Atmospheric Science
 Observational Needs for Polar Atmospheric Science John J. Cassano University of Colorado with contributions from: Ed Eloranta, Matthew Lazzara, Julien Nicolas, Ola Persson, Matthew Shupe, and Von Walden
Climate Modelling and Scenarios in Canada. Elaine Barrow Principal Investigator (Science) Canadian Climate Impacts Scenarios (CCIS) Project
 Canadian Climate Impacts Scenarios (CCIS) Project") Climate Modelling and Scenarios in Canada Elaine Barrow Principal Investigator (Science) Canadian Climate Impacts Scenarios (CCIS) Project Canadian Centre for Climate Modelling and Analysis (CCCma) http://www.cccma.bc.ec.gc.ca
Climate Modelling and Scenarios in Canada Elaine Barrow Principal Investigator (Science) Canadian Climate Impacts Scenarios (CCIS) Project Canadian Centre for Climate Modelling and Analysis (CCCma) http://www.cccma.bc.ec.gc.ca
Chapter 2 Available Solar Radiation
 Chapter 2 Available Solar Radiation DEFINITIONS Figure shows the primary radiation fluxes on a surface at or near the ground that are important in connection with solar thermal processes. DEFINITIONS It
Polar Weather Prediction
 Polar Weather Prediction David H. Bromwich Session V YOPP Modelling Component Tuesday 14 July 2015 A special thanks to the following contributors: Kevin W. Manning, Jordan G. Powers, Keith M. Hines, Dan
On the Satellite Determination of Multilayered Multiphase Cloud Properties. Science Systems and Applications, Inc., Hampton, Virginia 2
 JP1.10 On the Satellite Determination of Multilayered Multiphase Cloud Properties Fu-Lung Chang 1 *, Patrick Minnis 2, Sunny Sun-Mack 1, Louis Nguyen 1, Yan Chen 2 1 Science Systems and Applications, Inc.,
Clouds, Haze, and Climate Change
 Clouds, Haze, and Climate Change Jim Coakley College of Oceanic and Atmospheric Sciences Earth s Energy Budget and Global Temperature Incident Sunlight 340 Wm -2 Reflected Sunlight 100 Wm -2 Emitted Terrestrial
Towards a global climatology of cloud microphysical properties and why MODIS does not like sunsets (nor sunrise!)
") Towards a global climatology of cloud microphysical properties and why MODIS does not like sunsets (nor sunrise!) Daniel Grosvenor & Robert Wood (U. Washington) Using scattered solar radiation to infer
Towards a global climatology of cloud microphysical properties and why MODIS does not like sunsets (nor sunrise!) Daniel Grosvenor & Robert Wood (U. Washington) Using scattered solar radiation to infer
The role of soil moisture in influencing climate and terrestrial ecosystem processes
 1of 18 The role of soil moisture in influencing climate and terrestrial ecosystem processes Vivek Arora Canadian Centre for Climate Modelling and Analysis Meteorological Service of Canada Outline 2of 18
Torben Königk Rossby Centre/ SMHI
 Fundamentals of Climate Modelling Torben Königk Rossby Centre/ SMHI Outline Introduction Why do we need models? Basic processes Radiation Atmospheric/Oceanic circulation Model basics Resolution Parameterizations
Influence of Clouds and Aerosols on the Earth s Radiation Budget Using Clouds and the Earth s Radiant Energy System (CERES) Measurements
 Measurements") Influence of Clouds and Aerosols on the Earth s Radiation Budget Using Clouds and the Earth s Radiant Energy System (CERES) Measurements Norman G. Loeb Hampton University/NASA Langley Research Center Bruce
Influence of Clouds and Aerosols on the Earth s Radiation Budget Using Clouds and the Earth s Radiant Energy System (CERES) Measurements Norman G. Loeb Hampton University/NASA Langley Research Center Bruce
Earth s Heat Budget. What causes the seasons?
 Earth s Heat Budget Solar Energy and the global Heat Budget Transfer of heat drives weather and climate Ocean circulation Should we talk about this? What causes the seasons? Before you answer, think. What
The inputs and outputs of energy within the earth-atmosphere system that determines the net energy available for surface processes is the Energy
 Energy Balance The inputs and outputs of energy within the earth-atmosphere system that determines the net energy available for surface processes is the Energy Balance Electromagnetic Radiation Electromagnetic
Radiation Fluxes During ZCAREX-99: Measurements and Calculations
 Radiation Fluxes During ZCAREX-99: Measurements and Calculations G. S. Golitsyn, P. P. Anikin, E. M. Feigelson, I. A. Gorchakova, I. I. Mokhov, E. V. Romashova, M. A. Sviridenkov, and T. A. Tarasova Oboukhov
A) usually less B) dark colored and rough D) light colored with a smooth surface A) transparency of the atmosphere D) rough, black surface
 usually less B) dark colored and rough D) light colored with a smooth surface A) transparency of the atmosphere D) rough, black surface") 1. Base your answer to the following question on the diagram below which shows two identical houses, A and B, in a city in North Carolina. One house was built on the east side of a factory, and the other
1. Base your answer to the following question on the diagram below which shows two identical houses, A and B, in a city in North Carolina. One house was built on the east side of a factory, and the other