Change Detection in Multivariate Data
|
|
|
- Jade Long
- 5 years ago
- Views:
Transcription
1 Change Detection in Multivariate Data Likelihood and Detectability Loss Giacomo Boracchi July, 8 th, 2016 giacomo.boracchi@polimi.it TJ Watson, IBM NY
2 Examples of CD Problems: Anomaly Detection
3 Examples of CD Problems: Anomaly Detection


4 Other Examples of CD Problems ECG monitoring: Detect arrhythmias / device mispositioning

5 Other Examples of CD Problems ECG monitoring: Detect arrhythmias / device mispositioning Environmental monitoring: detect changes in signals monitoring a rockface


6 Other Examples of CD Problems ECG monitoring: Detect arrhythmias / device mispositioning Environmental monitoring: detect changes in signals monitoring a rockface Stream mining: Fraud Detection Stream mining: Online Classification Systems Spam Classification Fraud Detection
7 x(t) τ t The Change-Detection Problem Often, these problems boil down to: a) Monitor a stream x t, t = 1,, x t R d of realizations of a random variable, and detect the change-point τ, x t φ 0 t < τ φ 1 t τ, where {x t, t < τ} are i.i.d. and φ 0 φ 1, φ 1 is unknown and φ 0 can be possibly estimated from training data φ 0 φ 1
8 x(t) τ t The Change-Detection Problem Often, these problems boil down to: a) Monitor a stream x t, t = 1,, x t R d of realizations of a random variable, and detect the change-point τ, x t φ 0 t < τ φ 1 t τ, where {x t, t < τ} are i.i.d. and φ 0 φ 1, φ 1 is unknown and φ 0 can be possibly estimated from training data φ 0 φ 1 (Process) Change Detection Problem
9 x(t) The Change-Detection Problem Often, these problems boil down to: b) Determining whether a set of data x t, t = t 0,, t 1 is generated from φ o and detect possible outliers We refer to φ 0 pre-change distribution / normal (can be estimated) φ 1 post-change distribution / anomalous (unknown) φ 0 φ 0 φ 1 t
10 x(t) The Change-Detection Problem Often, these problems boil down to: b) Determining whether a set of data x t, t = t 0,, t 1 is generated from φ o and detect possible outliers We refer to φ 0 pre-change distribution / normal (can be estimated) φ 1 post-change distribution / anomalous (unknown) φ 0 φ 0 φ 1 Anomaly Detection Problem t
11 THE ADDRESSED PROBLEM
12 x(t) Our Goal Study how the data dimension d influences the change detectability, i.e., how difficult is to solve these two problems φ 0 φ 1 τ t
13 x(t) Our Goal Study how the data dimension d influences the change detectability, i.e., how difficult is to solve these two problems φ 0 φ 1 τ t
14 x(t) Our Goal Study how the data dimension d influences the change detectability, i.e., how difficult is to solve these two problems φ 0 φ 1 τ t
15 Our Approach To study the impact of the sole data dimension d in change-detection problems we need to: 1. Consider a change-detection approach 2. Define a measure of change detectability that well correlates with traditional performance measures 3. Define a measure of change magnitude that refers only to differences between φ 0 and φ 1
16 Our Approach To study the impact of the sole data dimension d in change-detection problems we need to: 1. Consider a change-detection approach 2. Define a measure of change detectability that well correlates with traditional performance measures 3. Define a measure of change magnitude that refers only to differences between φ 0 and φ 1 Our goal (reformulated): Studing how the change detectability varies in changedetection problems that have different data dimensions d constant change magnitude
17 Our Result We show there is a detectability loss problem, i.e. that change detectability steadily decreases when d increases. Detectability loss is shown by: Analytical derivations: when φ 0 and φ 1 are Gaussians Empirical analysis: measuring the the power of hypothesis tests in change-detection problems on real data
18 Presentation Outline Preliminaries: Assumptions The change-detection approach The change magnitude The measure of change detectability The detectability loss Detectability loss and anomaly detection in images
19 Presentation Outline Preliminaries: Assumptions The change-detection approach The change magnitude The measure of change detectability The detectability loss Detectability loss and anomaly detection in images
20 Our Assumptions To detect the change φ 0 φ 1 we assume that φ 0 is unknown, can be estimated from a training set TR = x t, t < t 0, x φ 0 φ 1 is unknown, no training data are provided We refer to φ 0 as stationary / normal / pre-change distribution φ 0 as the estimate of φ 0 from a training set φ 1 as nonstationary / anomalous / post-change distribution
21 Presentation Outline Preliminaries: Assumptions The change-detection approach The change magnitude The measure of change detectability The detectability loss Detectability loss and anomaly detection in images
22 L x t x(t) t How? Monitoring the Log-likelihood A typical approach to monitor the log-likelohood 1. During training, estimate φ 0 from TR 2. During testing, compute L x t = log( φ 0 (x(t))) 3. Monitor L x t, t = 1,
23 How? Monitoring the Log-likelihood A typical approach to monitor the log-likelohood 1. During training, estimate φ 0 from TR 2. During testing, compute L x t = log( φ 0 (x(t))) 3. Monitor L x t, t = 1, This is quite a popular approach in sequential monitoring and in anomaly detection L. I. Kuncheva, Change detection in streaming multivariate data using likelihood detectors," IEEE Transactions on Knowledge and Data Engineering, vol. 25, no. 5, X. Song, M. Wu, C. Jermaine, and S. Ranka, Statistical change detection for multidimensional data," in Proceedings of International Conference on Knowledge Discovery and Data Mining (KDD), J. H. Sullivan and W. H. Woodall, Change-point detection of mean vector or covariance matrix shifts using multivariate individual observations," IIE transactions, vol. 32, no. 6, 2000.
24 Our Goal / Presentation Outline Preliminaries: Assumptions The change-detection approach The change magnitude The measure of change detectability The detectability loss Detectability loss and anomaly detection in images
25 The Change Magnitude We measure the magnitude of a change φ 0 φ 1 by the symmetric Kullback-Leibler divergence skl φ 0, φ 1 = KL φ 0, φ 1 + KL φ 1, φ 0 = = න log φ 0 x φ φ 1 x 0 x dx + න log φ 1 x φ 0 x φ 1 x dx In practice, large values of skl φ 0, φ 1 correspond to changes φ 0 φ 1 that are very apparent, since skl φ 0, φ 1 is related to the power of hypothesis tests designed to detect either φ 0 φ 1 or φ 1 φ 0 (Stein Lemma) T. Dasu, K. Shankar, S. Venkatasubramanian, K. Yi, An information-theoretic approach to detecting changes in multi-dimensional data streams In Proc. Symp. on the Interface of Statistics, Computing Science, and Applications, 2006
26 Our Goal / Presentation Outline Preliminaries: The change-detection approach The change magnitude The measure of change detectability The detectability loss Concluding remarks
27 The Change Detectability The Signal to Noise Ratio of the change SNR φ 0 φ 1 = E L(x) E L(x) x φ 0 x φ 1 var L(x) + var L(x) x φ 0 x φ 1 2 The SNR φ 0 φ 1 Measures the extent to which φ 0 φ 1 is detectable by monitoring E L(x) If we replace E[ ] and var[ ] by the sample estimators we get the t-test statistic
28 DETECTABILITY LOSS
29 The Detectability Loss Theorem Let φ 0 = N(μ 0, Σ 0 ) and let φ 1 x = φ 0 (Qx + v) where Q R d d and orthogonal, v R d, then SNR φ 0 φ 1 < C d Where C is a constant that depends only on skl φ 0, φ 1 C. Alippi, G. Boracchi, D. Carrera, M. Roveri, "Change Detection in Multivariate Datastreams: Likelihood and Detectability Loss" IJCAI 2016, New York, USA, July 9-13
30 The Detectability Loss: Remarks Theorem Let φ 0 = N(μ 0, Σ 0 ) and let φ 1 x = φ 0 (Qx + v) where Q R d d and orthogonal, v R d, then SNR φ 0 φ 1 < C d Where C is a constant that depends only on skl φ 0, φ 1 Remarks: Changes of a given magnitude, skl φ 0, φ 1, become more difficult to detect when d increases DL does not depend on how φ 0 changes DL does not depend on the specific detection rule DL does not depend on estimation errors on φ 0
31 The Detectability Loss: The Change Model Theorem Let φ 0 = N(μ 0, Σ 0 ) and let φ 1 x = φ 0 (Qx + v) where Q R d d and orthogonal, v R d, then SNR φ 0 φ 1 < C d Where C is a constant that depends only on skl φ 0, φ 1
32 The Detectability Loss: The Change Model The change model φ 1 x = φ 0 (Qx + v) includes: Changes in the location of φ 0 (i.e, +v) φ 1 φ 0
33 The Detectability Loss: The Change Model The change model φ 1 x = φ 0 (Qx + v) includes: Changes in the location of φ 0 (i.e, +v) Changes in the correlation of x (i.e, Qx) φ 0 φ 1
34 The Detectability Loss: The Change Model The change model φ 1 x = φ 0 (Qx + v) includes: Changes in the location of φ 0 (i.e, +v) Changes in the correlation of x (i.e, Qx) It does not include changes in the scale of φ 0 that can be however detected monitoring x φ 1 φ 0
35 The Detectability Loss: The Gaussian Assumption Theorem Let φ 0 = N(μ 0, Σ 0 ) and let φ 1 x = φ 0 (Qx + v) where Q R d d and orthogonal, v R d, then SNR φ 0 φ 1 < C d Where C is a constant that depends only on skl φ 0, φ 1
36 The Detectability Loss: The Gaussian Assumption Assuming φ 0 = N(μ 0, Σ 0 ) looks like a severe limitation. Other distributions are not easy to handle analytically We can prove that DL occurs also in random variables having independent components The result can be empirically extended to the apprimations of L typically used for Gaussian mixtures
37 x(t) t The Detectability Loss: Empirical Analysis The data Two datsets from UCI database (Particle, Wine) Synthetically generate streams of different dimension d Estimate φ 0 by GM from a stationary training set In each stream we introduce φ 0 φ 1 such that φ 1 x = φ 0 Qx + v and skl φ 0, φ 1 = 1 Test data: two windows V 0 and V 1 (500 samples each) selected before and after the change. V 0 V 1
38 L x t t The Detectability Loss: Empirical Analysis The change-detectabiltity measure: Compute L φ 0 (x) from V 0 and V 1, obtaining W 0 and W 1 Compute a test statistic T(W 0, W 1 ) to compare the two Detect a change by an hypothesis test T W 0, W 1 h where h controls the amount of false positives Use the power of this test to assess change detectability W 0 W 1
39 DL: the Power of HTs on Gaussian Streams Gaussians t-test log(φ 0 ( )) t-test log( φ 0 ( )) Lepage log(φ 0 ( )) Lepage log( φ 0 ( )) Remarks: φ 1 is defined analytically The t-test detects changes in expectation The Lepage test detects changes in the location and scale Results The HT power decays with d: DL does not only concern the upperbound of SNR. DL is not due to estimation errors, but these make things worst. The power of the Lepage HT also decreases, which indicates that the change is more difficult to detect also monitoring the variance
40 Results: the Power of the Hypothesis Tests Particle Wine
41 Results: the Power of the Hypothesis Tests Particle Wine DL: the power of Hypothesis Tests also decays with d, not just the upperbound of SNR. DL occurs also in non-gaussian data The Lepage statistic also decreases, which indicates that the change is more difficult to detect also monitoring the variance Experiments on synthetic datasets confirms that DL is not due to estimation errors of φ 0
42 DETECTABILITY LOSS AND ANOMALY DETECTION IN IMAGES
43 The Considered Problem


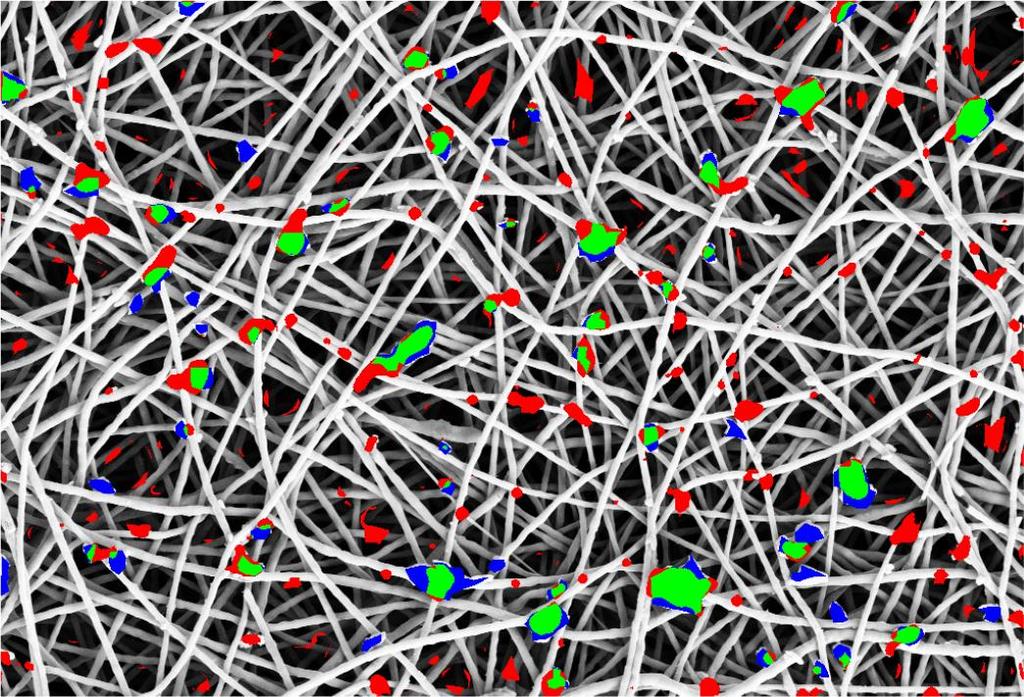
44 Patch-based processing of nanofibers Analyze each patch of an image s s c = {s c + u, u U} and determine whether it is normal or anomalous Patches s c R p are too high-dimensional (p 0) for modeling the distribution φ 0 generating normal paches We need to extract suitable features to reduce the dimensionality of our anomaly-detection problem.
45 Feature Extraction Expert-driven features: On each patch, compute the average, the variance, the total variation. These are expected to distinguish normal and anomalous patches Data-driven features: our approach consists in 1. Learning a model D that describes normal patches 2. Assessing the conformance of each patch s c to D
46 D: Dictionary of patches Sparse representations have shown to be a very useful method for constructing signal models The underlying assumption is that and α R n where: s Dα i. e., s Dα 2 0 D R p n is the dictionary, columns are called atoms the coefficient vector x is sparse α 0 = L n or α 1 is small The dictionary is learned a training set of normal patches. We learn a union of low-dimensional sub-spaces where normal patches live

47 The dictionary of normal patches Example of training patches Few learned atoms (BPDN-based learning)
48 Data-Driven Features To assess the confrmance of s c with D we perform the Sparse coding: α = argmin α R n Dα s λ α 1, λ > 0 which we solve using the BPDN problem (using ADMM). We then measure and Dα s 2 2 α 1 Data-driven features are x = Dα s 2 2 α 1
49 x(t) Detecting Anomalies Normal patches are expected to yield features x that are i.i.d. and that follow a (unknown) distribution φ 0, anomalous patches do not, as they follow φ 1 φ 0 We are back to the original problem Determining whether a set of data x c, c = 1, is generated from φ o and detect possible outliers" Anomaly Detection Problem φ 0 φ 1 φ 0 t
50
51
52
53
54 The ROC curves Tests on 40 images with anomalies manually annotated by an expert The proposed anomaly detection algorithm outperforms expert-driven features and other methods based on sparse representations
55 Detectability Loss on these nanofibers Selecting the good features is obviously important. Why not stacking data-driven and expert-driven features? Consider d = 3, 4, 5 dimensional features We selectively add the three expert-driven features to the two data-driven ones We always fit a GM model to a large-enough number of training data
56 Detectability Loss on these nanofibers Anomaly detection performance progressively decay when d increases
57 Detectability Loss and Irrelevant Features Irrelevant features, namely features that: are not directly affected by the change do not provide any additional information for change detection purposes (i.e. leave skl φ 0, φ 1 constant) Adding irrelevant feature yields detectability loss. Other issues might cause the performance decay A biased denisty function for φ 0 Scarcity of training samples when d increases However, we are inclined to conclude that These expert-driven features do not add enough relevant information on top of the data-driven ones (for anomaly-detection purposes).
58 Obviously is not always the case We developed data-driven features based on convolutional sparse models n s d i α i, i=1 s. t. α i is sparse where a signal s is entirely encoded as the sum of n convolutions between a filter d i and a coefficient map α i Pros: Translation invariant representation Few small filters are typically required Filters exhibit very specific image structures Easy to use filters having different size Collaboration with Los Alamos National Laboratory, NM, USA


59 Example of Learned Filters Training Image Learned Filters
60 Convolutional Sparsity for Anomaly Detection If we consider the convolutional sparse coding α = argmin α n n d i α i s i=1 we can build the feature vector as: x c = c n 2 2 d i α i s i=1 n i=1 c α 1 n + λ i=1 2 2 α 1 but unfortunately, detection performance are rather poor
 patches exhibit same sparsity and reconstruction error Coefficient maps anomalous")
61 Sparsity is too loose a criterion for detection Coefficient maps normal patch The two (normal and anomalous) patches exhibit same sparsity and reconstruction error Coefficient maps anomalous patch
62 Convolutional Sparsity for Anomaly Detection Add the group sparsity of the maps on the patch support as an additional feature x c = c m d i α i s i=1 m i=1 m i=1 α c α c D. Carrera, G. Boracchi, A. Foi and B. Wohlberg, Detecting Anomalous Structures by Convolutional Sparse Models IEEE IJCNN 2015
63 Anomaly-Detection Performance On 25 different textures and 600 test images (pair of textures to mimic normal/anomalous regions) Best performance achieved by the 3-dimensional feature indicators Achieve similar performance than steerable pyramid specifically designed for texture classification
64 CONCLUDING REMARKS
65 Comments on Detectability Loss Detectability loss occurs: independently on the specific statistical tool used to monitor the log-likelihood does not depend on how the change affects φ 0, e.g. the number of affected components. Empirical analysis confirms DL on real-world datastreams. It is important to keep the change-magnitude constant when changing d (or the dataset) Irrelevant components in x are harmful! Consider this in feature-based anomaly-detection methods. Ongoing works: extending this study to other changedetection approaches and to other families of distributions. Further details
66 Thanks, Questions? C. Alippi, G. Boracchi, D. Carrera, M. Roveri, "Change Detection in Multivariate Datastreams: Likelihood and Detectability Loss" IJCAI 2016, New York, USA, July 9-13 D. Carrera, G. Boracchi, A. Foi and B. Wohlberg "Detecting Anomalous Structures by Convolutional Sparse Models" IJCNN 2015 Killarney, Ireland, July 12 D. Carrera, F. Manganini, G. Boracchi, E. Lanzarone "Defect Detection in Nanostructures", IEEE Transactions on Industrial Informatics -- Submitted, 11 pages.
67 BACKUP SLIDES
68 Sketch of the proof Theorem Let φ 0 = N(μ 0, Σ 0 ) and let φ 1 x = φ 0 (Qx + v) where Q R d d and orthogonal, v R d, then SNR φ 0 φ 1 < C d Where C is a constant that depends only on skl φ 0, φ 1 Sketch of the proof: recall SNR φ 0 φ 1 = E L(x) E L(x) x φ 0 x φ 1 var x φ 0 L(x) + var x φ 1 L(x) We compute an upper bound of the numerator and a lower bound of the denominator 2
69 Sketch of the proof We now show that skl φ 0, φ 1 E x φ 0 L x E x φ 1 L x ( ) From L x = log(φ 0 x ) and the definition of skl it follows skl φ 0, φ 1 = E x φ 0 [log(φ 0 x ] E log φ 1 x + x φ 0 + E x φ 1 [log φ 1 x ] E x φ 1 [log(φ 0 x ] Thus E x φ 1 log φ 1 x E x φ 0 log φ 1 x 0
70 Sketch of the proof E log φ 1 x E log φ 1 x = x φ 1 x φ 0 = log φ 1 x φ 1 x dx log φ 1 x φ 0 x dx We denote y = Q x v, x = Qy + v dy = det Q dx = dx φ 0 x = φ 1 Q x v = φ 1 (y) φ 1 x = φ 1 Qy + v =: φ 2 (y) then E log φ 1 x E log φ 1 x = x φ 1 x φ 0 = log φ 1 x φ 1 x dx log φ 2 y φ 1 y dx = = KL φ 1, φ 2 0
71 Sketch of the proof Thus skl φ 0, φ 1 E x φ 0 L x E x φ 1 L x Moreover var L x x φ 0 = var x φ χ2 = d 2 It follows SNR φ 0 φ 1 = E L(x) E L(x) x φ 0 x φ 1 var L(x) + var L(x) x φ 0 x φ 1 2 skl φ 0, φ 1 2 d/2
Learning Under Concept Drift: Methodologies and Applications
 Learning Under Concept Drift: Methodologies and Applications Giacomo Boracchi DEIB, Politecnico di Milano, giacomo.boracchi@polim.it September 26, 2015 EANN 2015, Island of Rhodes,Greece AN INTRODUCTORY
QuantTree: Histograms for Change Detection in Multivariate Data Streams
 Giacomo Boracchi 1 Diego Carrera 1 Cristiano Cervellera 2 Danilo Macciò 2 Abstract We address the problem of detecting distribution changes in multivariate data streams by means of histograms. Histograms
Sparse Gaussian Markov Random Field Mixtures for Anomaly Detection
 Sparse Gaussian Markov Random Field Mixtures for Anomaly Detection Tsuyoshi Idé ( Ide-san ), Ankush Khandelwal*, Jayant Kalagnanam IBM Research, T. J. Watson Research Center (*Currently with University
Applications of Information Geometry to Hypothesis Testing and Signal Detection
 CMCAA 2016 Applications of Information Geometry to Hypothesis Testing and Signal Detection Yongqiang Cheng National University of Defense Technology July 2016 Outline 1. Principles of Information Geometry
CS570 Data Mining. Anomaly Detection. Li Xiong. Slide credits: Tan, Steinbach, Kumar Jiawei Han and Micheline Kamber.
 CS570 Data Mining Anomaly Detection Li Xiong Slide credits: Tan, Steinbach, Kumar Jiawei Han and Micheline Kamber April 3, 2011 1 Anomaly Detection Anomaly is a pattern in the data that does not conform
Uncertainty. Jayakrishnan Unnikrishnan. CSL June PhD Defense ECE Department
 Decision-Making under Statistical Uncertainty Jayakrishnan Unnikrishnan PhD Defense ECE Department University of Illinois at Urbana-Champaign CSL 141 12 June 2010 Statistical Decision-Making Relevant in
Machine learning - HT Maximum Likelihood
 Machine learning - HT 2016 3. Maximum Likelihood Varun Kanade University of Oxford January 27, 2016 Outline Probabilistic Framework Formulate linear regression in the language of probability Introduce
Proximity-Based Anomaly Detection using Sparse Structure Learning
 Proximity-Based Anomaly Detection using Sparse Structure Learning Tsuyoshi Idé (IBM Tokyo Research Lab) Aurelie C. Lozano, Naoki Abe, and Yan Liu (IBM T. J. Watson Research Center) 2009/04/ SDM 2009 /
Single-channel source separation using non-negative matrix factorization
 Single-channel source separation using non-negative matrix factorization Mikkel N. Schmidt Technical University of Denmark mns@imm.dtu.dk www.mikkelschmidt.dk DTU Informatics Department of Informatics
How to do backpropagation in a brain
 How to do backpropagation in a brain Geoffrey Hinton Canadian Institute for Advanced Research & University of Toronto & Google Inc. Prelude I will start with three slides explaining a popular type of deep
Scalable robust hypothesis tests using graphical models
 Scalable robust hypothesis tests using graphical models Umamahesh Srinivas ipal Group Meeting October 22, 2010 Binary hypothesis testing problem Random vector x = (x 1,...,x n ) R n generated from either
Recent advances in sensor data analytics
 Recent advances in sensor data analytics Tsuyoshi Ide ( Ide-san ) PhD, Senior Technical Staff Member IBM Thomas J. Watson Research Center Jan 10, 2018, University at Albany, SUNY Agenda General challenges
Streaming multiscale anomaly detection
 Streaming multiscale anomaly detection DATA-ENS Paris and ThalesAlenia Space B Ravi Kiran, Université Lille 3, CRISTaL Joint work with Mathieu Andreux beedotkiran@gmail.com June 20, 2017 (CRISTaL) Streaming
Lecture 3: More on regularization. Bayesian vs maximum likelihood learning
 Lecture 3: More on regularization. Bayesian vs maximum likelihood learning L2 and L1 regularization for linear estimators A Bayesian interpretation of regularization Bayesian vs maximum likelihood fitting
ISyE 691 Data mining and analytics
 ISyE 691 Data mining and analytics Regression Instructor: Prof. Kaibo Liu Department of Industrial and Systems Engineering UW-Madison Email: kliu8@wisc.edu Office: Room 3017 (Mechanical Engineering Building)
Information Theory and Hypothesis Testing
 Summer School on Game Theory and Telecommunications Campione, 7-12 September, 2014 Information Theory and Hypothesis Testing Mauro Barni University of Siena September 8 Review of some basic results linking
Performance Limits on the Classification of Kronecker-structured Models
 Performance Limits on the Classification of Kronecker-structured Models Ishan Jindal and Matthew Nokleby Electrical and Computer Engineering Wayne State University Motivation: Subspace models (Union of)
Covariance function estimation in Gaussian process regression
 Covariance function estimation in Gaussian process regression François Bachoc Department of Statistics and Operations Research, University of Vienna WU Research Seminar - May 2015 François Bachoc Gaussian
Lecture 8: Signal Detection and Noise Assumption
 ECE 830 Fall 0 Statistical Signal Processing instructor: R. Nowak Lecture 8: Signal Detection and Noise Assumption Signal Detection : X = W H : X = S + W where W N(0, σ I n n and S = [s, s,..., s n ] T
CHANGE DETECTION IN STREAMS OF SIGNALS WITH SPARSE REPRESENTATIONS
 CHANGE DETECTION IN STREAMS OF SIGNALS WITH SPARSE REPRESENTATIONS Cesare Alippi, Giacomo Boracchi Dipartimento di Elettronica, Informazione e Bioingegneria, Politecnico di Milano Brendt Wohlberg Theoretical
Approximating mixture distributions using finite numbers of components
 Approximating mixture distributions using finite numbers of components Christian Röver and Tim Friede Department of Medical Statistics University Medical Center Göttingen March 17, 2016 This project has
CS Lecture 19. Exponential Families & Expectation Propagation
 CS 6347 Lecture 19 Exponential Families & Expectation Propagation Discrete State Spaces We have been focusing on the case of MRFs over discrete state spaces Probability distributions over discrete spaces
Expectation propagation for signal detection in flat-fading channels
 Expectation propagation for signal detection in flat-fading channels Yuan Qi MIT Media Lab Cambridge, MA, 02139 USA yuanqi@media.mit.edu Thomas Minka CMU Statistics Department Pittsburgh, PA 15213 USA
Adaptively Detecting Changes in Autonomic Grid Computing
 Adaptively Detecting Changes in Autonomic Grid Computing Xiangliang Zhang, Cecile Germain-Renaud, Michèle Sebag To cite this version: Xiangliang Zhang, Cecile Germain-Renaud, Michèle Sebag. Adaptively
Recent Advances in Bayesian Inference Techniques
 Recent Advances in Bayesian Inference Techniques Christopher M. Bishop Microsoft Research, Cambridge, U.K. research.microsoft.com/~cmbishop SIAM Conference on Data Mining, April 2004 Abstract Bayesian
Anomaly Detection. Jing Gao. SUNY Buffalo
 Anomaly Detection Jing Gao SUNY Buffalo 1 Anomaly Detection Anomalies the set of objects are considerably dissimilar from the remainder of the data occur relatively infrequently when they do occur, their
Statistical Models and Algorithms for Real-Time Anomaly Detection Using Multi-Modal Data
 Statistical Models and Algorithms for Real-Time Anomaly Detection Using Multi-Modal Data Taposh Banerjee University of Texas at San Antonio Joint work with Gene Whipps (US Army Research Laboratory) Prudhvi
INFORMATION PROCESSING ABILITY OF BINARY DETECTORS AND BLOCK DECODERS. Michael A. Lexa and Don H. Johnson
 INFORMATION PROCESSING ABILITY OF BINARY DETECTORS AND BLOCK DECODERS Michael A. Lexa and Don H. Johnson Rice University Department of Electrical and Computer Engineering Houston, TX 775-892 amlexa@rice.edu,
Recursive Generalized Eigendecomposition for Independent Component Analysis
 Recursive Generalized Eigendecomposition for Independent Component Analysis Umut Ozertem 1, Deniz Erdogmus 1,, ian Lan 1 CSEE Department, OGI, Oregon Health & Science University, Portland, OR, USA. {ozertemu,deniz}@csee.ogi.edu
Anomaly Detection for the CERN Large Hadron Collider injection magnets
 Anomaly Detection for the CERN Large Hadron Collider injection magnets Armin Halilovic KU Leuven - Department of Computer Science In cooperation with CERN 2018-07-27 0 Outline 1 Context 2 Data 3 Preprocessing
Pointwise Exact Bootstrap Distributions of Cost Curves
 Pointwise Exact Bootstrap Distributions of Cost Curves Charles Dugas and David Gadoury University of Montréal 25th ICML Helsinki July 2008 Dugas, Gadoury (U Montréal) Cost curves July 8, 2008 1 / 24 Outline
Lecture 5: Likelihood ratio tests, Neyman-Pearson detectors, ROC curves, and sufficient statistics. 1 Executive summary
 ECE 830 Spring 207 Instructor: R. Willett Lecture 5: Likelihood ratio tests, Neyman-Pearson detectors, ROC curves, and sufficient statistics Executive summary In the last lecture we saw that the likelihood
CS 195-5: Machine Learning Problem Set 1
 CS 95-5: Machine Learning Problem Set Douglas Lanman dlanman@brown.edu 7 September Regression Problem Show that the prediction errors y f(x; ŵ) are necessarily uncorrelated with any linear function of
Using Multiple Kernel-based Regularization for Linear System Identification
 Using Multiple Kernel-based Regularization for Linear System Identification What are the Structure Issues in System Identification? with coworkers; see last slide Reglerteknik, ISY, Linköpings Universitet
STATS 306B: Unsupervised Learning Spring Lecture 12 May 7
 STATS 306B: Unsupervised Learning Spring 2014 Lecture 12 May 7 Lecturer: Lester Mackey Scribe: Lan Huong, Snigdha Panigrahi 12.1 Beyond Linear State Space Modeling Last lecture we completed our discussion
Sharp Generalization Error Bounds for Randomly-projected Classifiers
 Sharp Generalization Error Bounds for Randomly-projected Classifiers R.J. Durrant and A. Kabán School of Computer Science The University of Birmingham Birmingham B15 2TT, UK http://www.cs.bham.ac.uk/ axk
Independent Component Analysis. Contents
 Contents Preface xvii 1 Introduction 1 1.1 Linear representation of multivariate data 1 1.1.1 The general statistical setting 1 1.1.2 Dimension reduction methods 2 1.1.3 Independence as a guiding principle
Machine Learning Linear Classification. Prof. Matteo Matteucci
 Machine Learning Linear Classification Prof. Matteo Matteucci Recall from the first lecture 2 X R p Regression Y R Continuous Output X R p Y {Ω 0, Ω 1,, Ω K } Classification Discrete Output X R p Y (X)
VC dimension, Model Selection and Performance Assessment for SVM and Other Machine Learning Algorithms
 03/Feb/2010 VC dimension, Model Selection and Performance Assessment for SVM and Other Machine Learning Algorithms Presented by Andriy Temko Department of Electrical and Electronic Engineering Page 2 of
Unsupervised Anomaly Detection for High Dimensional Data
 Unsupervised Anomaly Detection for High Dimensional Data Department of Mathematics, Rowan University. July 19th, 2013 International Workshop in Sequential Methodologies (IWSM-2013) Outline of Talk Motivation
Online Dictionary Learning with Group Structure Inducing Norms
 Online Dictionary Learning with Group Structure Inducing Norms Zoltán Szabó 1, Barnabás Póczos 2, András Lőrincz 1 1 Eötvös Loránd University, Budapest, Hungary 2 Carnegie Mellon University, Pittsburgh,
Variational Principal Components
 Variational Principal Components Christopher M. Bishop Microsoft Research 7 J. J. Thomson Avenue, Cambridge, CB3 0FB, U.K. cmbishop@microsoft.com http://research.microsoft.com/ cmbishop In Proceedings
Modifying Voice Activity Detection in Low SNR by correction factors
 Modifying Voice Activity Detection in Low SNR by correction factors H. Farsi, M. A. Mozaffarian, H.Rahmani Department of Electrical Engineering University of Birjand P.O. Box: +98-9775-376 IRAN hfarsi@birjand.ac.ir
Short Term Memory Quantifications in Input-Driven Linear Dynamical Systems
 Short Term Memory Quantifications in Input-Driven Linear Dynamical Systems Peter Tiňo and Ali Rodan School of Computer Science, The University of Birmingham Birmingham B15 2TT, United Kingdom E-mail: {P.Tino,
Improved Bayesian Compression
 Improved Bayesian Compression Marco Federici University of Amsterdam marco.federici@student.uva.nl Karen Ullrich University of Amsterdam karen.ullrich@uva.nl Max Welling University of Amsterdam Canadian
CIFAR Lectures: Non-Gaussian statistics and natural images
 CIFAR Lectures: Non-Gaussian statistics and natural images Dept of Computer Science University of Helsinki, Finland Outline Part I: Theory of ICA Definition and difference to PCA Importance of non-gaussianity
Regression I: Mean Squared Error and Measuring Quality of Fit
 Regression I: Mean Squared Error and Measuring Quality of Fit -Applied Multivariate Analysis- Lecturer: Darren Homrighausen, PhD 1 The Setup Suppose there is a scientific problem we are interested in solving
Properties of the Autocorrelation Function
 Properties of the Autocorrelation Function I The autocorrelation function of a (real-valued) random process satisfies the following properties: 1. R X (t, t) 0 2. R X (t, u) =R X (u, t) (symmetry) 3. R
Sparse Kernel Density Estimation Technique Based on Zero-Norm Constraint
 Sparse Kernel Density Estimation Technique Based on Zero-Norm Constraint Xia Hong 1, Sheng Chen 2, Chris J. Harris 2 1 School of Systems Engineering University of Reading, Reading RG6 6AY, UK E-mail: x.hong@reading.ac.uk
Detection of Anomalies in Texture Images using Multi-Resolution Features
 Detection of Anomalies in Texture Images using Multi-Resolution Features Electrical Engineering Department Supervisor: Prof. Israel Cohen Outline Introduction 1 Introduction Anomaly Detection Texture Segmentation
CS-E3210 Machine Learning: Basic Principles
 CS-E3210 Machine Learning: Basic Principles Lecture 3: Regression I slides by Markus Heinonen Department of Computer Science Aalto University, School of Science Autumn (Period I) 2017 1 / 48 In a nutshell
A Variance Modeling Framework Based on Variational Autoencoders for Speech Enhancement
 A Variance Modeling Framework Based on Variational Autoencoders for Speech Enhancement Simon Leglaive 1 Laurent Girin 1,2 Radu Horaud 1 1: Inria Grenoble Rhône-Alpes 2: Univ. Grenoble Alpes, Grenoble INP,
Independent Component Analysis and Unsupervised Learning
 Independent Component Analysis and Unsupervised Learning Jen-Tzung Chien National Cheng Kung University TABLE OF CONTENTS 1. Independent Component Analysis 2. Case Study I: Speech Recognition Independent
Adapted Feature Extraction and Its Applications
 saito@math.ucdavis.edu 1 Adapted Feature Extraction and Its Applications Naoki Saito Department of Mathematics University of California Davis, CA 95616 email: saito@math.ucdavis.edu URL: http://www.math.ucdavis.edu/
Self Adaptive Particle Filter
 Self Adaptive Particle Filter Alvaro Soto Pontificia Universidad Catolica de Chile Department of Computer Science Vicuna Mackenna 4860 (143), Santiago 22, Chile asoto@ing.puc.cl Abstract The particle filter
Multivariate statistical methods and data mining in particle physics
 Multivariate statistical methods and data mining in particle physics RHUL Physics www.pp.rhul.ac.uk/~cowan Academic Training Lectures CERN 16 19 June, 2008 1 Outline Statement of the problem Some general
Model Selection Tutorial 2: Problems With Using AIC to Select a Subset of Exposures in a Regression Model
 Model Selection Tutorial 2: Problems With Using AIC to Select a Subset of Exposures in a Regression Model Centre for Molecular, Environmental, Genetic & Analytic (MEGA) Epidemiology School of Population
Image Noise: Detection, Measurement and Removal Techniques. Zhifei Zhang
 Image Noise: Detection, Measurement and Removal Techniques Zhifei Zhang Outline Noise measurement Filter-based Block-based Wavelet-based Noise removal Spatial domain Transform domain Non-local methods
Environmental Sound Classification in Realistic Situations
 Environmental Sound Classification in Realistic Situations K. Haddad, W. Song Brüel & Kjær Sound and Vibration Measurement A/S, Skodsborgvej 307, 2850 Nærum, Denmark. X. Valero La Salle, Universistat Ramon
Worst-Case Analysis of the Perceptron and Exponentiated Update Algorithms
 Worst-Case Analysis of the Perceptron and Exponentiated Update Algorithms Tom Bylander Division of Computer Science The University of Texas at San Antonio San Antonio, Texas 7849 bylander@cs.utsa.edu April
ECE531 Lecture 6: Detection of Discrete-Time Signals with Random Parameters
 ECE531 Lecture 6: Detection of Discrete-Time Signals with Random Parameters D. Richard Brown III Worcester Polytechnic Institute 26-February-2009 Worcester Polytechnic Institute D. Richard Brown III 26-February-2009
6.435, System Identification
 System Identification 6.435 SET 3 Nonparametric Identification Munther A. Dahleh 1 Nonparametric Methods for System ID Time domain methods Impulse response Step response Correlation analysis / time Frequency
Scalable Algorithms for Distribution Search
 Scalable Algorithms for Distribution Search Yasuko Matsubara (Kyoto University) Yasushi Sakurai (NTT Communication Science Labs) Masatoshi Yoshikawa (Kyoto University) 1 Introduction Main intuition and
2. What are the tradeoffs among different measures of error (e.g. probability of false alarm, probability of miss, etc.)?
?") ECE 830 / CS 76 Spring 06 Instructors: R. Willett & R. Nowak Lecture 3: Likelihood ratio tests, Neyman-Pearson detectors, ROC curves, and sufficient statistics Executive summary In the last lecture we
ECE 830 / CS 76 Spring 06 Instructors: R. Willett & R. Nowak Lecture 3: Likelihood ratio tests, Neyman-Pearson detectors, ROC curves, and sufficient statistics Executive summary In the last lecture we
SPARSE signal representations have gained popularity in recent
 6958 IEEE TRANSACTIONS ON INFORMATION THEORY, VOL. 57, NO. 10, OCTOBER 2011 Blind Compressed Sensing Sivan Gleichman and Yonina C. Eldar, Senior Member, IEEE Abstract The fundamental principle underlying
Gatsby Theoretical Neuroscience Lectures: Non-Gaussian statistics and natural images Parts I-II
 Gatsby Theoretical Neuroscience Lectures: Non-Gaussian statistics and natural images Parts I-II Gatsby Unit University College London 27 Feb 2017 Outline Part I: Theory of ICA Definition and difference
Latent Variable Models and EM algorithm
 Latent Variable Models and EM algorithm SC4/SM4 Data Mining and Machine Learning, Hilary Term 2017 Dino Sejdinovic 3.1 Clustering and Mixture Modelling K-means and hierarchical clustering are non-probabilistic
Maximum Mean Discrepancy
 Maximum Mean Discrepancy Thanks to Karsten Borgwardt, Malte Rasch, Bernhard Schölkopf, Jiayuan Huang, Arthur Gretton Alexander J. Smola Statistical Machine Learning Program Canberra, ACT 0200 Australia
Finding persisting states for knowledge discovery in time series
 Finding persisting states for knowledge discovery in time series Fabian Mörchen and Alfred Ultsch Data Bionics Research Group, Philipps-University Marburg, 3532 Marburg, Germany Abstract. Knowledge Discovery
1 [15 points] Frequent Itemsets Generation With Map-Reduce
![1 [15 points] Frequent Itemsets Generation With Map-Reduce](/thumbs/72/67172903.jpg "1 [15 points] Frequent Itemsets Generation With Map-Reduce") Data Mining Learning from Large Data Sets Final Exam Date: 15 August 2013 Time limit: 120 minutes Number of pages: 11 Maximum score: 100 points You can use the back of the pages if you run out of space.
Data Mining Learning from Large Data Sets Final Exam Date: 15 August 2013 Time limit: 120 minutes Number of pages: 11 Maximum score: 100 points You can use the back of the pages if you run out of space.
Performance of small signal sets
 42 Chapter 5 Performance of small signal sets In this chapter, we show how to estimate the performance of small-to-moderate-sized signal constellations on the discrete-time AWGN channel. With equiprobable
Gaussian Processes 1. Schedule
 1 Schedule 17 Jan: Gaussian processes (Jo Eidsvik) 24 Jan: Hands-on project on Gaussian processes (Team effort, work in groups) 31 Jan: Latent Gaussian models and INLA (Jo Eidsvik) 7 Feb: Hands-on project
Maximum Likelihood Estimation. only training data is available to design a classifier
 Introduction to Pattern Recognition [ Part 5 ] Mahdi Vasighi Introduction Bayesian Decision Theory shows that we could design an optimal classifier if we knew: P( i ) : priors p(x i ) : class-conditional
Information Theory Based Estimator of the Number of Sources in a Sparse Linear Mixing Model
 Information heory Based Estimator of the Number of Sources in a Sparse Linear Mixing Model Radu Balan University of Maryland Department of Mathematics, Center for Scientific Computation And Mathematical
Lecture 22: Error exponents in hypothesis testing, GLRT
 10-704: Information Processing and Learning Spring 2012 Lecture 22: Error exponents in hypothesis testing, GLRT Lecturer: Aarti Singh Scribe: Aarti Singh Disclaimer: These notes have not been subjected
Massive MIMO: Signal Structure, Efficient Processing, and Open Problems II
 Massive MIMO: Signal Structure, Efficient Processing, and Open Problems II Mahdi Barzegar Communications and Information Theory Group (CommIT) Technische Universität Berlin Heisenberg Communications and
Bias-Variance Trade-Off in Hierarchical Probabilistic Models Using Higher-Order Feature Interactions
 - Trade-Off in Hierarchical Probabilistic Models Using Higher-Order Feature Interactions Simon Luo The University of Sydney Data61, CSIRO simon.luo@data61.csiro.au Mahito Sugiyama National Institute of
Lecture 7 Introduction to Statistical Decision Theory
 Lecture 7 Introduction to Statistical Decision Theory I-Hsiang Wang Department of Electrical Engineering National Taiwan University ihwang@ntu.edu.tw December 20, 2016 1 / 55 I-Hsiang Wang IT Lecture 7
Bayesian Methods for Machine Learning
 Bayesian Methods for Machine Learning CS 584: Big Data Analytics Material adapted from Radford Neal s tutorial (http://ftp.cs.utoronto.ca/pub/radford/bayes-tut.pdf), Zoubin Ghahramni (http://hunch.net/~coms-4771/zoubin_ghahramani_bayesian_learning.pdf),
Cross-Validation with Confidence
 Cross-Validation with Confidence Jing Lei Department of Statistics, Carnegie Mellon University UMN Statistics Seminar, Mar 30, 2017 Overview Parameter est. Model selection Point est. MLE, M-est.,... Cross-validation
ECE521 week 3: 23/26 January 2017
 ECE521 week 3: 23/26 January 2017 Outline Probabilistic interpretation of linear regression - Maximum likelihood estimation (MLE) - Maximum a posteriori (MAP) estimation Bias-variance trade-off Linear
Measure-Transformed Quasi Maximum Likelihood Estimation
 Measure-Transformed Quasi Maximum Likelihood Estimation 1 Koby Todros and Alfred O. Hero Abstract In this paper, we consider the problem of estimating a deterministic vector parameter when the likelihood
Particle Swarm Optimization of Hidden Markov Models: a comparative study
 Particle Swarm Optimization of Hidden Markov Models: a comparative study D. Novák Department of Cybernetics Czech Technical University in Prague Czech Republic email:xnovakd@labe.felk.cvut.cz M. Macaš,
Statistical approach for dictionary learning
 Statistical approach for dictionary learning Tieyong ZENG Joint work with Alain Trouvé Page 1 Introduction Redundant dictionary Coding, denoising, compression. Existing algorithms to generate dictionary
A6523 Signal Modeling, Statistical Inference and Data Mining in Astrophysics Spring
 Lecture 8 A6523 Signal Modeling, Statistical Inference and Data Mining in Astrophysics Spring 2015 http://www.astro.cornell.edu/~cordes/a6523 Applications: Bayesian inference: overview and examples Introduction
Introduction PCA classic Generative models Beyond and summary. PCA, ICA and beyond
 PCA, ICA and beyond Summer School on Manifold Learning in Image and Signal Analysis, August 17-21, 2009, Hven Technical University of Denmark (DTU) & University of Copenhagen (KU) August 18, 2009 Motivation
CFAR TARGET DETECTION IN TREE SCATTERING INTERFERENCE
 CFAR TARGET DETECTION IN TREE SCATTERING INTERFERENCE Anshul Sharma and Randolph L. Moses Department of Electrical Engineering, The Ohio State University, Columbus, OH 43210 ABSTRACT We have developed
Improved Bounds on the Dot Product under Random Projection and Random Sign Projection
 Improved Bounds on the Dot Product under Random Projection and Random Sign Projection Ata Kabán School of Computer Science The University of Birmingham Birmingham B15 2TT, UK http://www.cs.bham.ac.uk/
Generative classifiers: The Gaussian classifier. Ata Kaban School of Computer Science University of Birmingham
 Generative classifiers: The Gaussian classifier Ata Kaban School of Computer Science University of Birmingham Outline We have already seen how Bayes rule can be turned into a classifier In all our examples
Blind Spectral-GMM Estimation for Underdetermined Instantaneous Audio Source Separation
 Blind Spectral-GMM Estimation for Underdetermined Instantaneous Audio Source Separation Simon Arberet 1, Alexey Ozerov 2, Rémi Gribonval 1, and Frédéric Bimbot 1 1 METISS Group, IRISA-INRIA Campus de Beaulieu,
Independent Component Analysis and Unsupervised Learning. Jen-Tzung Chien
 Independent Component Analysis and Unsupervised Learning Jen-Tzung Chien TABLE OF CONTENTS 1. Independent Component Analysis 2. Case Study I: Speech Recognition Independent voices Nonparametric likelihood
BLIND SEPARATION OF INSTANTANEOUS MIXTURES OF NON STATIONARY SOURCES
 BLIND SEPARATION OF INSTANTANEOUS MIXTURES OF NON STATIONARY SOURCES Dinh-Tuan Pham Laboratoire de Modélisation et Calcul URA 397, CNRS/UJF/INPG BP 53X, 38041 Grenoble cédex, France Dinh-Tuan.Pham@imag.fr
Machine Learning Basics Lecture 2: Linear Classification. Princeton University COS 495 Instructor: Yingyu Liang
 Machine Learning Basics Lecture 2: Linear Classification Princeton University COS 495 Instructor: Yingyu Liang Review: machine learning basics Math formulation Given training data x i, y i : 1 i n i.i.d.
No. of dimensions 1. No. of centers
 Contents 8.6 Course of dimensionality............................ 15 8.7 Computational aspects of linear estimators.................. 15 8.7.1 Diagonalization of circulant andblock-circulant matrices......
An Introduction to Signal Detection and Estimation - Second Edition Chapter III: Selected Solutions
 An Introduction to Signal Detection and Estimation - Second Edition Chapter III: Selected Solutions H. V. Poor Princeton University March 17, 5 Exercise 1: Let {h k,l } denote the impulse response of a
Towards an Optimal Noise Versus Resolution Trade-off in Wind Scatterometry
 Towards an Optimal Noise Versus Resolution Trade-off in Wind Scatterometry Brent Williams Jet Propulsion Lab, California Institute of Technology IOWVST Meeting Utrecht Netherlands June 12, 2012 Copyright
2.3. Clustering or vector quantization 57
 Multivariate Statistics non-negative matrix factorisation and sparse dictionary learning The PCA decomposition is by construction optimal solution to argmin A R n q,h R q p X AH 2 2 under constraint :
When Dictionary Learning Meets Classification
 When Dictionary Learning Meets Classification Bufford, Teresa 1 Chen, Yuxin 2 Horning, Mitchell 3 Shee, Liberty 1 Mentor: Professor Yohann Tendero 1 UCLA 2 Dalhousie University 3 Harvey Mudd College August
DETECTION theory deals primarily with techniques for
 ADVANCED SIGNAL PROCESSING SE Optimum Detection of Deterministic and Random Signals Stefan Tertinek Graz University of Technology turtle@sbox.tugraz.at Abstract This paper introduces various methods for
ELEG 5633 Detection and Estimation Signal Detection: Deterministic Signals
 ELEG 5633 Detection and Estimation Signal Detection: Deterministic Signals Jingxian Wu Department of Electrical Engineering University of Arkansas Outline Matched Filter Generalized Matched Filter Signal