Basic perfusion theory
|
|
|
- James Simon
- 5 years ago
- Views:
Transcription
1 Basic perfusion theory January 24 th 2012 by Henrik BW Larsson Functional Imaging Unit, Diagnostic Department
2 Outline What is perfusion Why measure perfusion Measures The easy part: What to do and why The complicated part: Formalism and models The really complicated part: Deconvolution Conclusion
3 What is perfusion? Large vessels : flow ½ mm Perfusion: related to the microvascular system ~ the capillaries
4 The vascular system of the brain and perfusion Venules: capacity vessels 50% Veins 20% Artery:conductance vessels 30% Capillaries: exchange vessels ~ transport~diffusion Arteriole:resistance vessels

5 Perfusion : ml/100g/min ½ mm
6 Perfusion : ml/100g/min ½ mm
7 Perfusion metrics in imaging: ml/min/ 100g or ml/min/100ml ½ mm
8 Number of transport (ml) vehicles entering 100 ml tissue pr. time unit:: ml/min/100 ml tissue volume
9 Important metrics Perfusion: f [ml/min/100g] or [ ml/min/100ml ] Brain Perfusion ( flow ) : Cerebral blood flow CBF [ml/100g/min] Cerebral blood volume: CBV [ml/100g] ½ mm Volume of Distibution: V d [ml/100g] or [ml/100ml] Mean transit time: MTT [s] Blood brain permeability: PS product [ml/100g/min]
10 Important metrics Perfusion: f [ml/min/100g] or [ ml/min/100ml ] Brain Perfusion ( flow ) : Cerebral blood flow CBF [ml/100g/min] Cerebral blood volume: CBV [ml/100g] ½ mm Mean transit time: MTT [s] Blood brain permeability: PS product [ml/100g/min]
11 Blood flow changes and energy metabolism in brain and skeletal muscle 5 30 % Brain Muscle Activation Increases up to 30 x Rest
 = CBF x Ca x OEF Is")
12 Why measure brain perfusion? It intimately related to brain activation Govern oxygen delivery and CMRO 2 : CMRO 2 =CBF x (Ca Cv) = CBF x Ca x OEF Is profoundly changed in nearly all brain diseases either primarily or secondary or in a more subtle way

13

14 Non-invasive perfusion: What to do and the easy part

15 Measuring perfusion by an external registration: CT,SPECT,PET,MRI detector artery f vein f: perfusion in [ml/min /100g]
16 How can it be measured? Add a contrast agent carried by the blood to the tissue
17 Bolus of tracer or contrast
18 Bolus of tracer or contrast
19 Bolus of tracer or contrast
20 Bolus of tracer or contrast
21 Bolus of tracer or contrast
22 Bolus of tracer or contrast
23 Bolus of tracer or contrast
24 Bolus of tracer or contrast
25 Bolus of tracer or contrast
26 Bolus of tracer or contrast
27 Bolus of tracer or contrast
28 Bolus of tracer or contrast
29 Bolus of tracer or contrast
30 Bolus of tracer or contrast
31 Bolus of tracer or contrast
32 Bolus of tracer or contrast
33 Bolus of tracer or contrast
34 Bolus of tracer or contrast
35 Bolus of tracer or contrast
36 Bolus of tracer or contrast
37 Bolus of tracer or contrast
38 Bolus of tracer or contrast
39 Bolus of tracer or contrast
40 Bolus of tracer or contrast
41 Bolus of tracer or contrast
42 Bolus of tracer or contrast
43 Bolus of tracer or contrast
44 Bolus of tracer or contrast
45 Bolus of tracer or contrast
46 Bolus of tracer or contrast
47 Bolus of tracer or contrast
48 Bolus of tracer or contrast
49 Bolus of tracer or contrast
50 Bolus of tracer or contrast
51 Bolus of tracer or contrast
52 Bolus of tracer or contrast
53 Bolus of tracer or contrast
54 Bolus of tracer or contrast
55 Bolus of tracer or contrast
56 Bolus of tracer or contrast
57 Bolus of tracer or contrast
58 Bolus of tracer or contrast
59 Bolus of tracer or contrast
60 Bolus of tracer or contrast
61 How can it be measured? Add a contrast agent carried by the blood to the tissue Contrast agent exogent endogent
62 The complicated part: Single bolus injection and external registration


63 The complicated part: Single bolus injection and external registration
64 time
65 Perfusion (f) = ml/min vehicles/min x Signal C tis (0) : f C a (0) Conc (C a ) = mmol/ml the cargo they carry time
66 C tis (t) = f C a (0) Δt RF(t) C tis (0) = : f C a (0) Δt flux dose MTT RF(t) =1 for t < MTT RF(t) =0 for t > MTT time
67 C tis (t) = f C a (0) Δt RF(t) C tis (0) = f C a (0) Δt time
68 Summing up: direct short bolus Measure the tissue conc Measure the input conc i.e. input function Scanner signal : C tis (t) = f C a (0) Δt RF(t) Estimate f and RF(t)
69 Summing up Measure the tissue conc Measure the input conc i.e. input function Scanner signal : C tis (t) = f C a (0) Δt RF(t) Estimate f and RF(t) RF(t) by model free methods, or assume a model e.g. RF(t) =e -k2t

70 Different perfusion tracers behaves differently
71 C tis (t) = f C a (0) RF(t) C tis (0) = f C a (0) Δt time (s)
72 C tis (t) = f C a (0) Δt RF(t) C tis (0) = f C a (0) Δt RF(t) = e -k2t 1 2 time (s)
73 C tis (t) = f C a (0) Δt RF(t) C tis (0) = f C a (0) Δt RF(t) = e -k2t time (s)
74 C tis (t) = f C a (0) RF(t) C tis (0) = f C a (0) Δt RF(t) = e -k2t time (s)
75 C tis (t) = f C a (0) Δt RF(t) C tis (0) = f C a (0) Δt RF(t) = e -k2t + e -k3t time (s)
76 The residue impulse response function RF(t) RF(t) : the fraction of the injected dose remaining in the tissue (voxel) as a function of time Mean transit time : MTT MTT = RF(t) 0
77 Mean transit time : MTT RF(t) 1 MTT t 1 MTT = RF(t)dt 0 RF(t) MTT t n N 1 MTT= RF(t) n N t t MTT
78 Perfusion: f Distribution vol: V d Mean transit time: MTT Generally f = V d MTT For an intravascular contrast agent, the case in brain MRI we have: Brain perfusion: CBF Brain blood volume: CBV Mean transit time: MTT CBF = CBV MTT
79 Generally For an intravascular contrast agent, the case in brain perfusion MRI we have: Brain perfusion: CBF Brain blood volume: CBV Mean transit time: MTT CBF = CBV MTT

80 The really complicated part: Deconvolution


81 We cannot apply a bolus directly in the tissue!
82 Input : C a (t) Tissue enhancement : C tis (t) = f C a (τ) RF(t- τ) dτ 0 tissue Deconvolution : find f RF(t) f time
83 Input : C a (t) Tissue enhancement : C tis (t) =? tissue
84 Input : C a (t) Tissue enhancement : C tis (t) = f C a (0) RF(t) Δt tissue
85 Input : C a (t) Tissue enhancement : C tis (t) =? tissue
86 Input : C a (t) composed of many small input Tissue enhancement : C tis (t) =? tissue If the linearity of the system exist
87 Input : C a (t) composed of many small input Tissue enhancement : C tis (t) = f C a (0) RF(t - 0) Δτ tissue 0 0
88 Input : C a (t) composed of many small input Tissue enhancement : C tis (t) = f C a (1) RF(t - 1) Δτ tissue 1 1
89 Input : C a (t) composed of many small input Tissue enhancement : C tis (t) = f C a (2) RF(t - 2) Δτ tissue 2 2
90 Input : C a (t) composed of many small input Tissue enhancement : C tis (t) = f C a (3) RF(t - 3) Δτ tissue 3 3
91 Input : C a (t) composed of many small input Tissue enhancement : C tis (t) = f C a (4) RF(t - 4) Δτ tissue 4 4
92 Input : C a (t) composed of many small input Tissue enhancement : C tis (t) = f C a (5) RF(t - 5) Δτ tissue 5 5
93 Input : C a (t) composed of many small input Tissue enhancement : C tis (t) = f C a (6) RF(t - 6) Δτ tissue 6 6
94 Input : C a (t) composed of many small input Tissue enhancement : C tis (t) = f C a (7) RF(t - 7) Δτ tissue 7 7
95 Input : C a (t) composed of many small input Tissue enhancement : C tis (t) = f C a (8) RF(t - 8) Δτ tissue 8 8
96 Input : C a (t) composed of many small input Tissue enhancement : C tis (t) = f C a (9) RF(t - 9) Δτ tissue 9 9
97 Input : C a (t) composed of many small input Tissue enhancement : C tis (t) = f C a (10) RF(t - 10) Δτ tissue 10 10
98 Input : C a (t) composed of many small input Tissue enhancement : C tis (t) = f C a (11) RF(t - 11) Δτ tissue 11 11
99 Input : C a (t) composed of many small input Tissue enhancement : C tis (t) = f C a (12) RF(t - 12) Δτ tissue 12 12
100 Input : C a (t) composed of many small input Tissue enhancement : C tis (t) = f C a (13) RF(t - 13) Δτ tissue 13 13
101 Input : C a (t) composed of many small input Tissue enhancement : C tis (t) = f C a (14) RF(t - 14) Δτ tissue 14 14
102 Input : C a (t) composed of many small input Tissue enhancement : C tis (t) = f C a (15) RF(t - 15) Δτ tissue 15 15
103 Input : C a (t) composed of many small input Tissue enhancement : C tis (t) = f C a (16) RF(t - 16) Δτ tissue 16 16
104 Input : C a (t) composed of many small input Tissue enhancement : C tis (t) = f C a (17) RF(t - 17) Δτ tissue 17 17
105 Input : C a (t) composed of many small input Tissue enhancement : C tis (t) = f C a (18) RF(t - 18) Δτ tissue 18 18
106 Input : C a (t) composed of many small input Tissue enhancement : C tis (t) = f C a (19) RF(t - 19) Δτ tissue 19 19
107 Input : C a (t) composed of many small input Tissue enhancement : C tis (t) = f C a (20) RF(t - 20) Δτ tissue 20 20
108 Input : C a (t) composed of many small input Tissue enhancement : C tis (t) = f C a (21) RF(t - 21) Δτ tissue 21 21
109 Input : C a (t) composed of many small input Tissue enhancement : C tis (t) = f C a (22) RF(t - 22) Δτ tissue 22 22
110 Input : C a (t) composed of many small input Tissue enhancement : C tis (t) = f C a (23) RF(t - 23) Δτ tissue 23 23
111 Input : C a (t) composed of many small input Tissue enhancement : C tis (t) = f C a (24) RF(t - 24) Δτ tissue 24 24
112 Input : C a (t) composed of many small input Tissue enhancement : C tis (t) = f C a (25) RF(t - 25) Δτ tissue 25 25
113 Input : C a (t) composed of many small input Tissue enhancement : C tis (t) = f C a (26) RF(t - 26) Δτ tissue 26 26
114 Input : C a (t) composed of many small input Tissue enhancement : C tis (t) = f C a (27) RF(t - 27) Δτ tissue 27 27
115 Input : C a (t) composed of many small input Tissue enhancement : C tis (t) = f C a (28) RF(t - 28) Δτ tissue 28 28
116 Input : C a (t) composed of many small input Tissue enhancement : C tis (t) = f C a (29) RF(t - 29) Δτ tissue 29 29
117 Input : C a (t) composed of many small input Tissue enhancement : C tis (t) = f C a (30) RF(t - 30) Δτ tissue 30 30
118 Input : C a (t) composed of many small input Tissue enhancement : C tis (t) = f C a (31) RF(t - 31) Δτ tissue 31 31
119 Input : C a (t) composed of many small input Tissue enhancement : C tis (t) = f C a (32) RF(t - 32) Δτ tissue 32 32
120 Input : C a (t) composed of many small input Tissue enhancement : C tis (t) = f C a (32) RF(t - 32) Δτ tissue 32 32
121 Input : C a (t) composed of many small input Tissue enhancement : C tis (t) = f C a (33) RF(t - 33) Δτ tissue 33 33
122 Tissue enhancement : f C a (τ) RF(t - τ ) Δτ ; τ = 0:33 τ:
123 Total tissue enhancement : C tis (t)= f C a (τ) RF(t - τ ) Δτ ; τ = 0:33 τ:
124 Total tissue concentration: t C tis (t)= f C a (τ) RF(t - τ ) dτ 0 The convolution integral τ:
125 Input : C a (t) Tissue enhancement : C tis (t) = f C a (τ) RF(t- τ) dτ tissue Deconvolution : find f and RF(t) f time
126 Conclusion Measure the tissue conc Measure the input conc i.e. input function Bolus input : C tis (t) = f C a (0) Δt RF(t) Estimate f and RF(t) Veneous injection : C tis (t) = f C a (τ) RF(t- τ) dτ
127 Deconvolution ~ Modelbased Use a model e.g.: Monoexponentiel, biexponentiel, Optimise the free parameters by least square fit to tissue enhancement curve It is robust Relative insensitive to noise Incorrect if the model is inappropriately chosen
128 Deconvolution ~ Modelfree No model a priory Very flexible: many of free parameters A projection Very sensitive to noise Incorrect if not regularized rigoriously Fourier transform, SVD, GSVD, Tikhonov, GPD

129 The story can begin
130 DCE T1 perfusion and blood brain barrier: Methodological considerations and applications January by Henrik BW Larsson Functional Imaging Unit, Diagnostic Department
131 Acute MS lesions T1 T1-Gd
132 Paramagnetic Contrast, Gd-DTPA Decreases homogeneity in molecular environment Increases relaxation speed!
133 Acute MS lesions T1 T1-Gd
134 BBB permeability : PS / K trans / K i
135 Dynamic Contrast Enhanced Heart Perfusion, normal MR signal blood tissue time
136 Dynamic Contrast Enhanced Heart Perfusion, normal MR signal blood tissue time
137 Rest scan : healthy subject
138 Stress scan: healthy subject
139 Gadolinium-DTPA as perfusion CA T1w MR-signal T2*w MR-signal extravascular intravascular Time to peak bolus time bolus time

140 Gadolinium-DTPA as perfusion CA T1w MR-signal T2*w MR-signal extravascular intravascular Time to peak bolus time bolus time

141 Dynamic T1 weighted contrast enhanced perfusion MRI in brain at 1.5 tesla F = 83 ml/100/min Larsson at al MRM 2001, p272
142 Dynamic T1 weighted contrast enhanced perfusion MRI in brain at 3 tesla Time resolution: 5 slices pr. 1.24s
143 Dynamic T1 weighted contrast enhanced perfusion MRI in brain at 3 tesla Time resolution: 5 slices pr. 1.24s
144 Gd gives shorter T 1 = faster recovery Short range works only in same compartment Increased signal in blood and tissue on T1W images Normally BBB - K trans Now perfusion - CBF
145 MRI Perfusion Measurement Procedure, Gd: Intravenous injection of Gd-DTPA Rapid imaging using T1W FFE (SR TurboFLASH) Conversion of signal units to concentration via relaxation rate units Data analysis: deconvolution approach
146 From MR signal to concentration of contrast agent R1 = 1/T1 MR signal Concentration C tis C a callibration by external phantoms
147 R 1 Gd+ - R 1 Gd- = relaxivity C ΔR 1 (t) = relaxivity C(t)
148 Conversion of MR signal to tracer concentration Measured MR signal Equilibrium magnetization Flip angle Saturation recovery delay Tissue R 1 before bolus Change of tissue R 1 due to Gd bolus s(t) = M 0 sin(α)[1-exp(-td(r 1 +ΔR 1 (t)))], ΔR 1 (t) = r 1 c(t) Saturation recovery equation Relaxivity of contrast agent M 0 sin(α) s(td) Tracer concentration 1/R 1 TD
] T 1 = 1.")
149 T1 measurement s(t) = M 0 sin(α)[1-exp(-td R 1 )] T 1 = 1.23 s (frontal gray matter) R 1 M 0
150 Favorite brain arteries for AIF Middle Cerebral Artery (MCA) ICA Internal Carotid Artery (ICA)


151 Slice position in DCE
152 Dynamic T1 weighted contrast enhanced perfusion MRI in brain at Sat-Recovey: TI = 120ms TR= 4 ms TE= 2 ms Angle = 30 o Voxel = 3x3x6 mm Time resolution: 5 slices pr. 1.24s 3 tesla Dose: Magnevist/ Dotarem 0.05mmol/kg
153 Dynamic T1 weighted contrast enhanced perfusion MRI in brain at 3 tesla Sat-Recovey: TI = 120ms TR= 4 ms TE= 2 ms Angle = 30 o Voxel = 3x3x6 mm Time resolution: 5 slices pr. 1.24s Dose: Magnevist/ Dotarem 0.05mmol/kg
154 Deconvolution approach to quantitative perfusion measurement tissue curve arterial input tissue response c t (t) (mm) c a (t) (mm) = F RF(t) t (s) t (s) t (s) C t (t) = F C a (t) RF(t) = F C a (t ) RF(t-t ) dt t 0 MTT = RF(t)dt CBV = F MTT


155 Dynamic T1w contrast enhanced MRIperfusion CBF map
156 Deconvolution methods c t (t) = F c a (t) RF(t) gray matter ROI arterial input RF(t): monoexp tissue curve RF(t): deconvolution with SVD RF(t): deconvolution with Tikhonov


157 The residue impulse response function gray matter ROI arterial input tissue curve RF(t): deconvolution with SVD RF(t): deconvolution with Tikhonov
158 Tikhonov s deconvolution or Generalized SVD large small Larsson at al JMRI 2008, p754


159 Examples of CBF maps ml/100g/min We found perfusion value for ROI s to be 62 ml/100g/min in gray matter and 21 ml/100g/min in white matter in 7 patients with acute optic neuritis.
160 ml/100g/min Combined Anatomical and Functional MRI: Anatomy & perfusion of the brain
 T 2 - w")

161 Two patients with stroke (one week old) T 2 - w image DWI CBF ml/100g/min Larsson at al JMRI 2008, p754


162 CBV ml/100g MTT s Larsson at al JMRI 2008, p
163 Perfusion in clinical desicision making Assesment of cerebral ischemia Assesment of reversible versus irreversible tissue damage before treatement
164 Comparison of MR perfusion methods: Carotic flow measurement (PCM) DCE ASL PET ( 15 H 2 O) Otto Henriksen at al JMRI 2012, in press

165
166 17 healthy subjects, years Performed twice - Variation: Within persons method variation Between persons variation
167 Table 1. Cerebral blood flow measurements by different modalities Mean Bias * p- value ** s betw s with CV betw CV with Global CBF PCM % 7.4% ASL % 4.8% DCE % 15.1% PET % 11.9% Gray matter CBF ASL % 6.1% DCE % 15.3% PET % 11.8% White matter CBF ASL % 4.9% DCE % 15.8% PET % 12.4%
168 Table 1. Cerebral blood flow measurements by different modalities Mean Bias * p- value ** s betw s with CV betw CV with Global CBF PCM % 7.4% ASL % 4.8% DCE % 15.1% PET % 11.9% Gray matter CBF ASL % 6.1% DCE % 15.3% PET % 11.8% White matter CBF ASL % 4.9% DCE % 15.8% PET % 12.4%
169 Comparison of MR perfusion methods: Otto Henriksen at al JMRI 2012, in press
170 Conclusion Large inter-individual variability all methods Same mean global CBF across ASL, DCE, PET PCM global flow > global ASL, DCE, PET No correlation between methods, except A (weak) correlation between PCM and DCE Existence of significant subject-method interaction
171 Does it works if BBB is leaky? Can we still estimate CBF? Can we estimate PS (K i or K trans )? Can we estimate CBV? Can we differentiate between V d and CBV?
172 Before CA Blood brain barrier defect in brain tumors After CA Tikonov: CBF = 53ml/100g/min 90 Gray matter Tikonov: CBF = 157 ml/100g/min 300 Tumor lesion Concentration a.u Concentration a.u time (sec) time (sec)
173 Before CA Blood brain barrier defect in brain tumors After CA Tikonov: CBF = 53ml/100g/min 90 Gray matter Tikonov: CBF = 157 ml/100g/min 300 Tumor lesion Concentration a.u Concentration a.u time (sec) time (sec)

174 Permeability - surface area map ml/100g/min
175 Measurement of Brain Perfusion, Blood Brain Barrier Permeability using Dynamic Contrast Enhanced T1- Weighted MRI at 3 T Larsson at al MRM 2009, p1270
176 Compartment model BBB arteries C a (t) veins F F blood C b (t) V b K i K i (1-Hct) C e (t) V e tissue Intracellular space V tis V d
177 BBB arteries C a (t) veins F F blood C b (t) V b K i K i (1-Hct) C e (t) V e tissue Intracellula r space V tis, C tis V d Tissue voxel
178
179
180
181 Patlak & Gjedde method
182 Calculation of BBB permeability Patlak & Gjedde method or two-compartment model & Tikhonov CBF estimation
183
184
185
186 Gray matter Tumor Tumor
187 Does it works if BBB is leaky? Can we still estimate CBF? yes Can we estimate PS (K i or K trans )? yes Can we estimate CBV? yes Can we differentiate between V d and CBV? yes In the relevant range!
 5 100 4")
")

188 F (ml/100g/min) 120 K i (ml/100g/min) Anatomy, T2w V d (ml/100g) 0 CBV 20 V b (ml/100g)

 20 17 17 13 13 10 10 7 7 3 3")
189 F (ml/100g/min) 100 K i (ml/100g/min) Anatomy, T2w T2 w TSE V d (ml/100g) CBV 20 V b (ml/100g)
190 DCE in evaluation of tumor recurrence versus radiation necrosis FDG-PET as referene Vibeke A Larsen et al Submitted

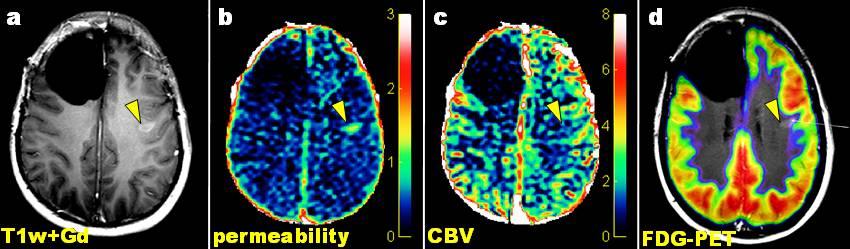
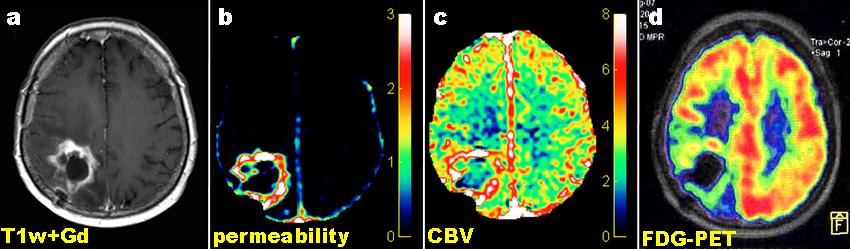
191 Tumor recurrence Tumor recurrence Radiation necrosis
192 Recurence versus necrosis
193 Recurence versus necrosis
194 DCE in evaluation of tumor recurrence versus radiation necrosis FDG-PET as referene: CBV from DCE seems a sensible parameter Larsen VA at al Submitted
195 Pivotal for all measurement The input function Partial volume effect on the arterial input function in T1-weighted perfusion imaging and limitations of the multiplicative rescaling approach Adam E Hansen et al. MRM 2009, p1055


196 Effect of partial volume on the arterial input function high in-plane resolution: (1.15mm) 2 voxel

197 Point spread function of input function
198

199 Future directions The feasibility at 7 T? Incorporation of water exchange, i.e. water permeability Larsson at al MRM 2001, p272
200 T1 versus T2 Gd based perfusion Advantage T1 No image distortion (no susceptibility) Input function clearly defined No bias due to defect BBB Half of normal clinical dose Disadvantage T1 Fewer slices Lower S/N for tissue conc time function Necessitate high field strength 3 tesla Injection of contrast agent Can only be repeated a few times Many slices Advantage T2 High S/N for the tissue conc time function Input function cannot be defined clearly Perfusion is estimated to high MR signal to conc is problematic Perfusion is bias when BBB is defect Injection of contrast agent Repeatable? Disadvantage T2
201 Conclusion It is possible to generate CBF maps using DCE T1 weighted MRI at 3 T Perfusion values are consistent with literature Tikhonov s method is best suited for deconvolution DCE T1 weighted MRI appears promising for distinguishing tumor recurrence and radiation necrosis employing CBV Easy identification of vasculature with DCE T1 weighted MRI allows to study details of input function
202 Thanks to Egill Rostrup, Adam E Hansen, Otto Henriksen, Glostrup Hospital Bente Sonne Møller, Helle Juhl Simonsen, Marjut Lindhart, Glostrup Hospital Olav Haraldseth, Trondheim Vibeke Andrée Larsen, Ian Law, Julie M Grüner, RH Frederic Courivaud, Philips Clinical Scientist Lundbeck Centre for Neurovascular Signaling Thank you for your attention!
Dynamic Contrast Enhance (DCE)-MRI
-MRI") Dynamic Contrast Enhance (DCE)-MRI contrast enhancement in ASL: labeling of blood (endogenous) for this technique: usage of a exogenous contras agent typically based on gadolinium molecules packed inside
Dynamic Contrast Enhance (DCE)-MRI contrast enhancement in ASL: labeling of blood (endogenous) for this technique: usage of a exogenous contras agent typically based on gadolinium molecules packed inside
Blood Water Dynamics
 Bioengineering 208 Magnetic Resonance Imaging Winter 2007 Lecture 8 Arterial Spin Labeling ASL Basics ASL for fmri Velocity Selective ASL Vessel Encoded ASL Blood Water Dynamics Tissue Water Perfusion:
Bioengineering 278" Magnetic Resonance Imaging" " Winter 2011" Lecture 9! Time of Flight MRA!
 Bioengineering 278" Magnetic Resonance Imaging" " Winter 2011" Lecture 9 Motion Encoding using Longitudinal Magnetization: Magnetic Resonance Angiography Time of Flight Contrast Enhanced Arterial Spin
Quantitative MRI & Dynamic Models
 Quantitative MRI & Dynamic Models The pre-eminent role of imaging now requires a new level of metric - quantitative measurements Robert I Grossman, Radiology Dep, NYU why measuring relaxation times? T1
Application of Time Sampling in Brain CT Perfusion Imaging for Dose Reduction
 Application of Time Sampling in Brain CT Perfusion Imaging for Dose Reduction S. H. Lee a, J. H. Kim* a, b, K. G. Kim b, S. J. Park a, Jung Gi Im b a Interdisciplinary Program in Radiation Applied Life
Measuring cerebral blood flow and other haemodynamic parameters using Arterial Spin Labelling MRI. David Thomas
 Measuring cerebral blood flow and other haemodynamic parameters using Arterial Spin Labelling MRI David Thomas Principal Research Associate in MR Physics Leonard Wolfson Experimental Neurology Centre UCL
HST.583 Functional Magnetic Resonance Imaging: Data Acquisition and Analysis Fall 2008
 MIT OpenCourseWare http://ocw.mit.edu HST.583 Functional Magnetic Resonance Imaging: Data Acquisition and Analysis Fall 2008 For information about citing these materials or our Terms of Use, visit: http://ocw.mit.edu/terms.
Can arterial spin labelling techniques quantify cerebral blood flow (CBF)?
?") Can arterial spin labelling techniques quantify cerebral blood flow (CBF)? Christian Kerskens Bruker User Meeting 12. October 2016 Neuroimaging & theoretical neuroscience Trinity College Institute of Neuroscience
Can arterial spin labelling techniques quantify cerebral blood flow (CBF)? Christian Kerskens Bruker User Meeting 12. October 2016 Neuroimaging & theoretical neuroscience Trinity College Institute of Neuroscience
Outline. Superconducting magnet. Magnetic properties of blood. Physiology BOLD-MRI signal. Magnetic properties of blood
 Magnetic properties of blood Physiology BOLD-MRI signal Aart Nederveen Department of Radiology AMC a.j.nederveen@amc.nl Outline Magnetic properties of blood Moses Blood oxygenation BOLD fmri Superconducting
Introduction to the Course and the Techniques. Jeffry R. Alger, PhD Ahmanson-Lovelace Brain Mapping Center Department of Neurology
 Introduction to the Course and the Techniques Jeffry R. Alger, PhD Ahmanson-Lovelace Brain Mapping Center Department of Neurology (jralger@ucla.edu) CTSI Neuroimaging April 2013 Rationale for the Course
Contrast Mechanisms in MRI. Michael Jay Schillaci
 Contrast Mechanisms in MRI Michael Jay Schillaci Overview Image Acquisition Basic Pulse Sequences Unwrapping K-Space Image Optimization Contrast Mechanisms Static and Motion Contrasts T1 & T2 Weighting,
Multi Time-point Arterial Spin Labeling Arterial Transit Time, Arterial Blood Volume,...
 Multi Timepoint rterial Spin Labeling rterial Transit Time, rterial lood Volume,... Esben Thade Petersen Department of Radiology and Department of Radiotherapy, University Medical Center Utrecht, The Netherlands
Part III: Sequences and Contrast
 Part III: Sequences and Contrast Contents T1 and T2/T2* Relaxation Contrast of Imaging Sequences T1 weighting T2/T2* weighting Contrast Agents Saturation Inversion Recovery JUST WATER? (i.e., proton density
EL-GY 6813/BE-GY 6203 Medical Imaging, Fall 2016 Final Exam
 EL-GY 6813/BE-GY 6203 Medical Imaging, Fall 2016 Final Exam (closed book, 1 sheets of notes double sided allowed, no calculator or other electronic devices allowed) 1. Ultrasound Physics (15 pt) A) (9
Towards absolute quantification of perfusion using. dynamic, susceptibility-weighted, contrast-enhanced (DSC) MRI
 MRI") Towards absolute quantification of perfusion using dynamic, susceptibility-weighted, contrast-enhanced (DSC) MRI by Vishal Patil A dissertation submitted in partial fulfillment Of the requirements for
Towards absolute quantification of perfusion using dynamic, susceptibility-weighted, contrast-enhanced (DSC) MRI by Vishal Patil A dissertation submitted in partial fulfillment Of the requirements for
Magnetic Resonance Imaging. Qun Zhao Bioimaging Research Center University of Georgia
 Magnetic Resonance Imaging Qun Zhao Bioimaging Research Center University of Georgia The Nobel Prize in Physiology or Medicine 2003 "for their discoveries concerning magnetic resonance imaging" Paul C.
Field trip: Tuesday, Feb 5th
 Pulse Sequences Field trip: Tuesday, Feb 5th Hardware tour of VUIIIS Philips 3T Meet here at regular class time (11.15) Complete MRI screening form! Chuck Nockowski Philips Service Engineer Reminder: Project/Presentation
( t) ASL Modelling and Quantification. David Thomas. Overview of talk. Brief review of ASL. ASL CBF quantification model. ASL CBF quantification model
 ASL Modelling and Quantification. David Thomas. Overview of talk. Brief review of ASL. ASL CBF quantification model. ASL CBF quantification model") verview of talk AL Modelling and Quantification David homas CL nstitute of Neurology Queen quare, London, K d.thomas@ucl.ac.uk Brief review of AL Descrie the 2 main AL quantification models model General
verview of talk AL Modelling and Quantification David homas CL nstitute of Neurology Queen quare, London, K d.thomas@ucl.ac.uk Brief review of AL Descrie the 2 main AL quantification models model General
Review Article Deconvolution-Based CT and MR Brain Perfusion Measurement: Theoretical Model Revisited and Practical Implementation Details
 International Journal of Biomedical Imaging Volume 211, Article ID 467563, 2 pages doi:1.1155/211/467563 Review Article Deconvolution-Based CT and MR Brain Perfusion Measurement: Theoretical Model Revisited
Introduction to MRI Acquisition
 Introduction to MRI Acquisition James Meakin FMRIB Physics Group FSL Course, Bristol, September 2012 1 What are we trying to achieve? 2 What are we trying to achieve? Informed decision making: Protocols
Welcome to MR! CT PET (with FDG) MRI (T2 w.) MR Image types: T2 weighted T1 weighted Sequence parameters FLAIR Diffusion
 MRI (T2 w.) MR Image types: T2 weighted T1 weighted Sequence parameters FLAIR Diffusion") Phsics Images Welcome to R! Introduction to agnetic Resonance Imaging Adam Espe Hansen, PET/R-phsicist Department of Clinical Phsiolog, Nuclear medicine & PET Rigshospitalet Basic Kinetic odeling in olecular
Phsics Images Welcome to R! Introduction to agnetic Resonance Imaging Adam Espe Hansen, PET/R-phsicist Department of Clinical Phsiolog, Nuclear medicine & PET Rigshospitalet Basic Kinetic odeling in olecular
Spectral analysis: principle and clinical applications
 REVIEW Annals of Nuclear Medicine Vol. 17, No. 6, 427 434, 2003 Spectral analysis: principle and clinical applications Kenya MURASE Department of Medical Physics and Engineering, Division of Medical Technology
Lecture #7 In Vivo Water
 Lecture #7 In Vivo Water Topics Hydration layers Tissue relaxation times Magic angle effects Magnetization Transfer Contrast (MTC) CEST Handouts and Reading assignments Mathur-De Vre, R., The NMR studies
Tissue Parametric Mapping:
 Tissue Parametric Mapping: Contrast Mechanisms Using SSFP Sequences Jongho Lee Department of Radiology University of Pennsylvania Tissue Parametric Mapping: Contrast Mechanisms Using bssfp Sequences Jongho
Introduction to the Physics of NMR, MRI, BOLD fmri
 Pittsburgh, June 13-17, 2011 Introduction to the Physics of NMR, MRI, BOLD fmri (with an orientation toward the practical aspects of data acquisition) Pittsburgh, June 13-17, 2001 Functional MRI in Clinical
Technical University of Denmark
 Technical University of Denmark Page 1 of 11 pages Written test, 9 December 2010 Course name: Introduction to medical imaging Course no. 31540 Aids allowed: none. "Weighting": All problems weight equally.
MRI. made. likely simplistic. Sorry, guys! We have less than one hour! Part 2: Sources of contrast. Endogenous (tissue) contrast
 contrast") .. made simple likely simplistic Sorry, guys! We have less than one hour! U. Himmelreich K.U.Leuven.. B. Gallez U.C.Louvain.. B. Jordan U.C.Louvain Part 2: Sources of contrast Endogenous (tissue) contrast
.. made simple likely simplistic Sorry, guys! We have less than one hour! U. Himmelreich K.U.Leuven.. B. Gallez U.C.Louvain.. B. Jordan U.C.Louvain Part 2: Sources of contrast Endogenous (tissue) contrast
How is it different from conventional MRI? What is MR Spectroscopy? How is it different from conventional MRI? MR Active Nuclei
 What is MR Spectroscopy? MR-Spectroscopy (MRS) is a technique to measure the (relative) concentration of certain chemical or biochemical molecules in a target volume. MR-Spectroscopy is an in vivo (in
Tomography is imaging by sections. 1
 Tomography is imaging by sections. 1 It is a technique used in clinical medicine and biomedical research to create images that show how certain tissues are performing their physiological functions. 1 Conversely,
PET Tracer Kinetic Modeling In Drug
 PET Tracer Kinetic Modeling In Drug Discovery Research Applications Sandra M. Sanabria-Bohórquez Imaging Merck & Co., Inc. Positron Emission Tomography - PET PET is an advanced d imaging i technique permitting
The ASL signal. Parenchy mal signal. Venous signal. Arterial signal. Input Function (Label) Dispersion: (t e -kt ) Relaxation: (e -t/t1a )
 Dispersion: (t e -kt ) Relaxation: (e -t/t1a )") Lecture Goals Other non-bold techniques (T2 weighted, Mn contrast agents, SSFP, Dynamic Diffusion, ASL) Understand Basic Principles in Spin labeling : spin inversion, flow vs. perfusion ASL variations
Lecture Goals Other non-bold techniques (T2 weighted, Mn contrast agents, SSFP, Dynamic Diffusion, ASL) Understand Basic Principles in Spin labeling : spin inversion, flow vs. perfusion ASL variations
Diffusion Weighted MRI. Zanqi Liang & Hendrik Poernama
 Diffusion Weighted MRI Zanqi Liang & Hendrik Poernama 1 Outline MRI Quick Review What is Diffusion MRI? Detecting Diffusion Stroke and Tumor Detection Presenting Diffusion Anisotropy and Diffusion Tensor
HY Ιατρική Απεικόνιση. Διδάσκων: Kώστας Μαριάς
 HY 571 - Ιατρική Απεικόνιση Διδάσκων: Kώστας Μαριάς 11. MRI Τ1,Τ2, PD and physiological parameter imaging Summary and Clarifications Resonance is referred to as the property of an atom to absorb energy
MR Advance Techniques. Flow Phenomena. Class I
 MR Advance Techniques Flow Phenomena Class I Flow Phenomena In this class we will explore different phenomenona produced from nuclei that move during the acquisition of data. Flowing nuclei exhibit different
The Basics of Magnetic Resonance Imaging
 The Basics of Magnetic Resonance Imaging Nathalie JUST, PhD nathalie.just@epfl.ch CIBM-AIT, EPFL Course 2013-2014-Chemistry 1 Course 2013-2014-Chemistry 2 MRI: Many different contrasts Proton density T1
Contrast Agents. Altering Tissue Contrast. Altering Tissue Contrast
 Contrast Agents Mike Moseley, Ph.D. Department of Radiology Stanford University Current Concepts Monterey October 2005 Altering Tissue Contrast Intrinsic tissue contrasts: 1. uclei (proton) density - PD
Mathematical Segmentation of Grey Matter, White Matter
 Tina Memo No. 2000-006 Short Version published in: British Journal of Radiology, 74, 234-242, 2001. Mathematical Segmentation of Grey Matter, White Matter and Cerebral Spinal Fluid from MR image Pairs.
Computational Framework for Generating Transport Models from Databases of Microvascular Anatomy
 Annals of Biomedical Engineering, Vol. 29, pp. 837 843, 2001 Printed in the USA. All rights reserved. 0090-6964/2001/29 10 /837/7/$15.00 Copyright 2001 Biomedical Engineering Society Computational Framework
NMR/MRI examination (8N080 / 3F240)
") NMR/MRI examination (8N080 / 3F240) Remarks: 1. This test consists of 3 problems with at total of 26 sub-questions. 2. Questions are in English. You are allowed to answer them in English or Dutch. 3. Please
NMR/MRI examination (8N080 / 3F240) Remarks: 1. This test consists of 3 problems with at total of 26 sub-questions. 2. Questions are in English. You are allowed to answer them in English or Dutch. 3. Please
Radioisotopes and PET
 Radioisotopes and PET 1 Radioisotopes Elements are defined by their number of protons, but there is some variation in the number of neutrons. Atoms resulting from this variation are called isotopes. Consider
MR Contrast due to Intravascular Magnetic Susceptibility Perturbations
 MR Contrast due to Intravascular Magnetic Susceptibility Perturbations Jerrold L. Boxerman, Leena M. Hamberg, Bruce R. Rosen, Robert M. Weisskoff A particularly powerful paradigm for functional MR imaging
Variational solution to hemodynamic and perfusion response estimation from ASL fmri data
 Variational solution to hemodynamic and perfusion response estimation from ASL fmri data Aina Frau-Pascual, Florence Forbes, Philippe Ciuciu June, 2015 1 / 18 BOLD: Qualitative functional MRI Blood Oxygen
Wavelet-based noise reduction for improved deconvolution of time-series data in dynamic susceptibility-contrast MRI.
 Wavelet-based noise reduction for improved deconvolution of time-series data in dynamic susceptibility-contrast MRI. Wirestam, Ronnie; Ståhlberg, Freddy Published in: Magma DOI: 10.1007/s10334-005-0102-z
Basic Principles of Tracer Kinetic Modelling
 The Spectrum of Medical Imaging Basic Principles of Tracer Kinetic Modelling Adriaan A. Lammertsma Structure X-ray/CT/MRI Physiology US, SPECT, PET, MRI/S Metabolism PET, MRS Drug distribution PET Molecular
FREQUENCY SELECTIVE EXCITATION
 PULSE SEQUENCES FREQUENCY SELECTIVE EXCITATION RF Grad 0 Sir Peter Mansfield A 1D IMAGE Field Strength / Frequency Position FOURIER PROJECTIONS MR Image Raw Data FFT of Raw Data BACK PROJECTION Image Domain
Time Frequency Analysis for Motion Magnification and Detection
 Time Frequency Analysis for Motion Magnification and Detection Thesis submitted in partial fulfillment of the requirements for the degree of Master of Science (by Research) in Electronics and Communication
Basic MRI physics and Functional MRI
 Basic MRI physics and Functional MRI Gregory R. Lee, Ph.D Assistant Professor, Department of Radiology June 24, 2013 Pediatric Neuroimaging Research Consortium Objectives Neuroimaging Overview MR Physics
NIH Public Access Author Manuscript Neuroimage. Author manuscript; available in PMC 2012 July 1.
 NIH Public Access Author Manuscript Published in final edited form as: Neuroimage. 2011 July 1; 57(1): 182 189. doi:10.1016/j.neuroimage.2011.03.060. Early Time Points Perfusion Imaging: Theoretical Analysis
Measuring the invisible using Quantitative Magnetic Resonance Imaging
 Measuring the invisible using Quantitative Magnetic Resonance Imaging Paul Tofts Emeritus Professor University of Sussex, Brighton, UK Formerly Chair in Imaging Physics, Brighton and Sussex Medical School,
Overview Optimizing MR Imaging Procedures:
 Overview Optimizing MR Imaging Procedures: The Physicist as a Consultant Lisa C. Lemen, Radiology Department University of Cincinnati Image contrast in standard clinical sequences (pulse timing parameters)
Technical University of Denmark
 Technical University of Denmark Page 1 of 10 pages Written test, 12 December 2012 Course name: Introduction to medical imaging Course no. 31540 Aids allowed: None. Pocket calculator not allowed "Weighting":
Applications of Spin Echo and Gradient Echo: Diffusion and Susceptibility Contrast
 Applications of Spin Echo and Gradient Echo: Diffusion and Susceptibility Contrast Chunlei Liu, PhD Department of Electrical Engineering & Computer Sciences and Helen Wills Neuroscience Institute University
USING A VOXEL-BASED KROGH CYLINDER ARRAY TO SIMULATE MICROVASCULAR CONTRAST ENHANCEMENT DANIEL SPENCER BRADLEY THESIS
 USING A VOXEL-BASED KROGH CYLINDER ARRAY TO SIMULATE MICROVASCULAR CONTRAST ENHANCEMENT BY DANIEL SPENCER BRADLEY THESIS Submitted in partial fulfillment of the requirements for the degree of Master of
Cambridge University Press MRI from A to Z: A Definitive Guide for Medical Professionals Gary Liney Excerpt More information
 Main glossary Aa AB systems Referring to molecules exhibiting multiply split MRS peaks due to spin-spin interactions. In an AB system, the chemical shift between the spins is of similar magnitude to the
Master of Science Thesis. Development of a phantom for optimisation and quality control in functional MRI (fmri) Anders Nilsson
 Anders Nilsson") Master of Science Thesis Development of a phantom for optimisation and quality control in functional MRI (fmri) Anders Nilsson Supervisor: Johan Olsrud, PhD Medical Radiation Physics Clinical Sciences,
Master of Science Thesis Development of a phantom for optimisation and quality control in functional MRI (fmri) Anders Nilsson Supervisor: Johan Olsrud, PhD Medical Radiation Physics Clinical Sciences,
Introduction to Magnetic Resonance Imaging (MRI) Pietro Gori
 Pietro Gori") Introduction to Magnetic Resonance Imaging (MRI) Pietro Gori Enseignant-chercheur Equipe IMAGES - Télécom ParisTech pietro.gori@telecom-paristech.fr September 20, 2017 P. Gori BIOMED 20/09/2017 1 / 76
Introduction to Magnetic Resonance Imaging (MRI) Pietro Gori Enseignant-chercheur Equipe IMAGES - Télécom ParisTech pietro.gori@telecom-paristech.fr September 20, 2017 P. Gori BIOMED 20/09/2017 1 / 76
Advanced Topics and Diffusion MRI
 Advanced Topics and Diffusion MRI Slides originally by Karla Miller, FMRIB Centre Modified by Mark Chiew (mark.chiew@ndcn.ox.ac.uk) Slides available at: http://users.fmrib.ox.ac.uk/~mchiew/teaching/ MRI
Physics of MR Image Acquisition
 Physics of MR Image Acquisition HST-583, Fall 2002 Review: -MRI: Overview - MRI: Spatial Encoding MRI Contrast: Basic sequences - Gradient Echo - Spin Echo - Inversion Recovery : Functional Magnetic Resonance
The physics of medical imaging US, CT, MRI. Prof. Peter Bogner
 The physics of medical imaging US, CT, MRI Prof. Peter Bogner Clinical radiology curriculum blocks of lectures and clinical practice (7x2) Physics of medical imaging Neuroradiology Head and neck I. Head
Sequential Monte Carlo Methods for Bayesian Model Selection in Positron Emission Tomography
 Methods for Bayesian Model Selection in Positron Emission Tomography Yan Zhou John A.D. Aston and Adam M. Johansen 6th January 2014 Y. Zhou J. A. D. Aston and A. M. Johansen Outline Positron emission tomography
Introduction to MRI. Spin & Magnetic Moments. Relaxation (T1, T2) Spin Echoes. 2DFT Imaging. K-space & Spatial Resolution.
 Spin Echoes. 2DFT Imaging. K-space & Spatial Resolution.") Introduction to MRI Spin & Magnetic Moments Relaxation (T1, T2) Spin Echoes 2DFT Imaging Selective excitation, phase & frequency encoding K-space & Spatial Resolution Contrast (T1, T2) Acknowledgement:
Introduction to MRI Spin & Magnetic Moments Relaxation (T1, T2) Spin Echoes 2DFT Imaging Selective excitation, phase & frequency encoding K-space & Spatial Resolution Contrast (T1, T2) Acknowledgement:
 www.aask24.com www.aask24.com www.aask24.com P=Positron E= Emission T=Tomography Positron emission or beta plus decay (+ ) is a particular type of radioactive decay, in which a proton inside a radionuclide
Chapter 24 MRA and Flow quantification. Yongquan Ye, Ph.D. Assist. Prof. Radiology, SOM Wayne State University
 Chapter 24 MRA and Flow quantification Yongquan Ye, Ph.D. Assist. Prof. Radiology, SOM Wayne State University Previous classes Flow and flow compensation (Chap. 23) Steady state signal (Cha. 18) Today
Quantitative Susceptibility Mapping and Susceptibility Tensor Imaging. Magnetization and Susceptibility
 Quantitative Susceptibility Mapping and Susceptibility Tensor Imaging 1, Chunlei Liu, Ph.D. 1 Brain Imaging and Analysis Center Department of Radiology Duke University, Durham, NC, USA 1 Magnetization
Professor Stuart Bunt 217
 Professor Stuart Bunt 217 Traditional Anatomy Phrenology, the study of bumps on the skull. Measuring brain weights and size (still being done..see the fuss about Einstein s brain). Little link between
King s Research Portal
 King s Research Portal DOI: 10.1038/s41598-017-18890-x Document Version Publisher's PDF, also known as Version of record Link to publication record in King's Research Portal Citation for published version
Functional Neuroimaging with PET
 Functional Neuroimaging with PET Terry Oakes troakes@wisc.edu W.M.Keck Lab for Functional Brain Imaging and Behavior Seeing the Brain Just look at it! Anatomic Images (MRI) Functional Images PET fmri (Just
Using mathematical models & approaches to quantify BRAIN (dynamic) Positron Emission Tomography (PET) data
 Positron Emission Tomography (PET) data") Using mathematical models & approaches to quantify BRAIN (dynamic) Positron Emission Tomography (PET) data Imaging Seminars Series Stony Brook University, Health Science Center Stony Brook, NY - January
Using mathematical models & approaches to quantify BRAIN (dynamic) Positron Emission Tomography (PET) data Imaging Seminars Series Stony Brook University, Health Science Center Stony Brook, NY - January
Introductory MRI Physics
 C HAPR 18 Introductory MRI Physics Aaron Sodickson EXRNAL MAGNETIC FIELD, PROTONS AND EQUILIBRIUM MAGNETIZATION Much of the bulk of the magnetic resonance imaging (MRI) scanner apparatus is dedicated to
G Medical Imaging. Outline 4/13/2012. Physics of Magnetic Resonance Imaging
 G16.4426 Medical Imaging Physics of Magnetic Resonance Imaging Riccardo Lattanzi, Ph.D. Assistant Professor Department of Radiology, NYU School of Medicine Department of Electrical and Computer Engineering,
Modeling of the Impact of Blood Vessel Flow on the Temperature Distribution during Focused Ultrasound Exposure
 Excerpt from the Proceedings of the COMSOL Conference 1 Boston Modeling of the Impact of Blood Vessel Flow on the Temperature Distribution during Focused Ultrasound Exposure E. Sassaroli 1, K.C. P. Li
On Signal to Noise Ratio Tradeoffs in fmri
 On Signal to Noise Ratio Tradeoffs in fmri G. H. Glover April 11, 1999 This monograph addresses the question of signal to noise ratio (SNR) in fmri scanning, when parameters are changed under conditions
Multi-Energy CT: Principles, Processing
 Multi-Energy CT: Principles, Processing and Clinical Applications Shuai Leng, PhD Associate Professor Department of Radiology Mayo Clinic, Rochester, MN Clinical Motivation CT number depends on x-ray attenuation
Differentiating Chemical Reactions from Nuclear Reactions
 Differentiating Chemical Reactions from Nuclear Reactions 1 CHEMICAL Occurs when bonds are broken or formed. Atoms remained unchanged, though may be rearranged. Involves valence electrons Small energy
Part VI: Advanced Concepts (Selection)
") Part VI: Advanced Concepts (Selection) Contents Cardiovascular magnetic resonance imaging (CMR; cardiac MRI) Diffusion Imaging (diffusion weighted imaging: DWI, diffusion tensor imaging: DTI) BOLD (blood
Part VI: Advanced Concepts (Selection) Contents Cardiovascular magnetic resonance imaging (CMR; cardiac MRI) Diffusion Imaging (diffusion weighted imaging: DWI, diffusion tensor imaging: DTI) BOLD (blood
The measurement of diffusion and perfusion in biological systems using magnetic resonance imaging
 Phys. Med. Biol. 45 (2000) R97 R138. Printed in the UK PII: S0031-9155(00)99102-4 TOPICAL REVIEW The measurement of diffusion and perfusion in biological systems using magnetic resonance imaging David
MRI in Review: Simple Steps to Cutting Edge Part I
 MRI in Review: Simple Steps to Cutting Edge Part I DWI is now 2 years old... Mike Moseley Radiology Stanford DWI, b = 1413 T2wt, 28/16 ASN 21 San Francisco + Disclosures: Funding NINDS, NCRR, NCI 45 minutes
Chapter 14:Physics of Magnetic Resonance
 Chapter 14:Physics of Magnetic Resonance Slide set of 141 slides based on the chapter authored by Hee Kwon Song of the publication (ISBN 978-92-0-131010-1): Diagnostic Radiology Physics: A Handbook for
MRI in Practice. Catherine Westbrook MSc, DCRR, CTC Senior Lecturer Anglia Polytechnic University Cambridge UK. John Talbot MSc, DCRR
 MRI in Practice Third edition Catherine Westbrook MSc, DCRR, CTC Senior Lecturer Anglia Polytechnic University Cambridge UK and Carolyn Kaut RothRT(R) (MR) (CT) (M) (CV) Fellow SMRT (Section for Magnetic
A Neurosurgeon s Perspectives of Diffusion Tensor Imaging(DTI) Diffusion Tensor MRI (DTI) Background and Relevant Physics.
 Diffusion Tensor MRI (DTI) Background and Relevant Physics.") A Neurosurgeon s Perspectives of Diffusion Tensor Imaging(DTI) Kalai Arasu Muthusamy, D.Phil(Oxon) Senior Lecturer & Consultant Neurosurgeon. Division of Neurosurgery. University Malaya Medical Centre.
A Neurosurgeon s Perspectives of Diffusion Tensor Imaging(DTI) Kalai Arasu Muthusamy, D.Phil(Oxon) Senior Lecturer & Consultant Neurosurgeon. Division of Neurosurgery. University Malaya Medical Centre.
Introduction to SPECT & PET TBMI02 - Medical Image Analysis 2017
 Introduction to SPECT & PET TBMI02 - Medical Image Analysis 2017 Marcus Ressner, PhD, Medical Radiation Physicist, Linköping University Hospital Content What is Nuclear medicine? Basic principles of Functional
S Walker-Samuel, M O Leach and D J Collins
 INSTITUTE OF PHYSICS PUBLISHING Phys. Med. Biol. 51 (2006) 3593 3602 PHYSICS IN MEDICINE AND BIOLOGY doi:10.1088/0031-9155/51/14/021 Evaluation of response to treatment using DCE-MRI: the relationship
Velocity Images. Phase Contrast Technique. G. Reiter 1,2, U. Reiter 1, R. Rienmüller 1
 Velocity Images - the MR Phase Contrast Technique G. Reiter 1,2, U. Reiter 1, R. Rienmüller 1 SSIP 2004 12 th Summer School in Image Processing, Graz, Austria 1 Interdisciplinary Cardiac Imaging Center,
Basic Pulse Sequences II - Spin Echoes. TE=12ms TE=47ms TE=106ms TE=153ms UCLA. Radiology
 TE TR 90 180 90 Basic Pulse Sequences II - Spin Echoes TE=12ms TE=47ms TE=106ms TE=153ms TE=235ms Lecture #6 Summary B1(t) RF TR RF t ~M (1) (0 )= ~ M 0 = 2 4 0 0 M 0 3 5 Initial Condition ~M (1) (0 +
Magnetic Resonance Spectroscopy. Saurabh Bhaskar Shaw Dwip Shah
 Magnetic Resonance Spectroscopy By Saurabh Bhaskar Shaw Dwip Shah What is Magnetic Resonance Spectroscopy? [1] Non invasive method to look at concentration of metabolites invivo. 2 Basics of MRS Physics
Part III Minor Option in Medical Physics 2018 Examples Sheet
 Part III Minor Option in Medical Physics 2018 Examples Sheet Any errors or comments should be addressed sent to: seb53@cam.ac.uk URLs that may be useful: Stanford Event Generation Simulator: http://tinyurl.com/pkg476r
A Study of Flow Effects on the Gradient Echo Sequence
 -MR Flow Imaging- A Study of Flow Effects on the Gradient Echo Sequence Cylinder filled with doped water α pulse α pulse Flowing water Plastic pipes Slice Phase Read a TE b Signal sampling TR Thesis for
22.56J Noninvasive Imaging in Biology and Medicine Instructor: Prof. Alan Jasanoff Fall 2005, TTh 1-2:30
 22.56J Noninvasive Imaging in Biology and Medicine Instructor: Prof. Alan Jasanoff Fall 2005, TTh 1-2:30 Sample problems HW1 1. Look up (e.g. in the CRC Manual of Chemistry and Physics www.hbcpnetbase.com)
Pulse Sequences: RARE and Simulations
 Pulse Sequences: RARE and Simulations M229 Advanced Topics in MRI Holden H. Wu, Ph.D. 2018.04.19 Department of Radiological Sciences David Geffen School of Medicine at UCLA Class Business Final project
Functional Magnetic Resonance Imaging of the Human Brain and Spinal Cord by Means of Signal Enhancement by Extravascular Protons
 Functional Magnetic Resonance Imaging of the Human Brain and pinal Cord by Means of ignal Enhancement by Extravascular Protons P.W. TROMAN, B. TOMANEK, K.L. MALIZA MR Technology Group, Institute for Biodiagnostics,
CT-PET calibration : physical principles and operating procedures F.Bonutti. Faustino Bonutti Ph.D. Medical Physics, Udine University Hospital.
 CT-PET calibration : physical principles and operating procedures Faustino Bonutti Ph.D. Medical Physics, Udine University Hospital Topics Introduction to PET physics F-18 production β + decay and annichilation
Outlines: (June 11, 1996) Instructor:
 Instructor:") Magnetic Resonance Imaging (June 11, 1996) Instructor: Tai-huang Huang Institute of Biomedical Sciences Academia Sinica Tel. (02) 2652-3036; Fax. (02) 2788-7641 E. mail: bmthh@ibms.sinica.edu.tw Reference:
Magnetic Resonance Imaging (June 11, 1996) Instructor: Tai-huang Huang Institute of Biomedical Sciences Academia Sinica Tel. (02) 2652-3036; Fax. (02) 2788-7641 E. mail: bmthh@ibms.sinica.edu.tw Reference:
A Brief Introduction to Medical Imaging. Outline
 A Brief Introduction to Medical Imaging Outline General Goals Linear Imaging Systems An Example, The Pin Hole Camera Radiations and Their Interactions with Matter Coherent vs. Incoherent Imaging Length
ENG4BF3 Medical Image Processing
 ENG4BF3 Medical Image Processing Medical Imaging Modalities Imaging in Medical Sciences Imaging is an essential aspect of medical sciences for visualization of anatomical structures and functional or metabolic
X. Allen Li. Disclosure. DECT: What, how and Why Why dual-energy CT (DECT)? 7/30/2018. Improving delineation and response assessment using DECT in RT
? 7/30/2018. Improving delineation and response assessment using DECT in RT") Improving delineation and response assessment using DECT in RT X. Allen Li Medical College of Wisconsin MO-A-DBRA-1, AAPM, July 30 th, 2018 Disclosure Research funding support: Siemens Healthineers Elekta
Improving delineation and response assessment using DECT in RT X. Allen Li Medical College of Wisconsin MO-A-DBRA-1, AAPM, July 30 th, 2018 Disclosure Research funding support: Siemens Healthineers Elekta
The effects of capillary transit time heterogeneity (CTH) on brain oxygenation
 on brain oxygenation") Journal of Cerebral Blood Flow & Metabolism (), SCBFM All rights reserved -X/ $. www.jcbfm.com ORGNAL ARTCLE The effects of capillary transit time heterogeneity (CTH) on brain oxygenation Hugo Angleys,
Journal of Cerebral Blood Flow & Metabolism (), SCBFM All rights reserved -X/ $. www.jcbfm.com ORGNAL ARTCLE The effects of capillary transit time heterogeneity (CTH) on brain oxygenation Hugo Angleys,
2015 U N I V E R S I T I T E K N O L O G I P E T R O N A S
 Multi-Modality based Diagnosis: A way forward by Hafeez Ullah Amin Centre for Intelligent Signal and Imaging Research (CISIR) Department of Electrical & Electronic Engineering 2015 U N I V E R S I T I
Quantitative Metrics for White Matter Integrity Based on Diffusion Tensor MRI Data. Stephanie Lee
 Quantitative Metrics for White Matter Integrity Based on Diffusion Tensor MRI Data Stephanie Lee May 5, 2005 Quantitative Metrics for White Matter Integrity Based on Diffusion Tensor MRI Data ABSTRACT
Will be provided on moodle (pdf) Please take notes during lecture!!
 Please take notes during lecture!!") 1: Introduction to the course How is the course organized? 1. What is Bio-imaging?. How can SR and CR be optimized? 3. What is the importance of biomedical imaging? 4. Examples Tour of the Imaging Centre
1: Introduction to the course How is the course organized? 1. What is Bio-imaging?. How can SR and CR be optimized? 3. What is the importance of biomedical imaging? 4. Examples Tour of the Imaging Centre
ELG7173 Topics in signal Processing II Computational Techniques in Medical Imaging
 ELG7173 Topics in signal Processing II Computational Techniques in Medical Imaging Topic #1: Intro to medical imaging Medical Imaging Classifications n Measurement physics Send Energy into body Send stuff