Multiplicative Winter s Smoothing Method
|
|
|
- Jocelin Hall
- 6 years ago
- Views:
Transcription
1 Multiplicative Winter s Smoothing Method LECTURE 6 TIME SERIES FORECASTING METHOD rahmaanisa@apps.ipb.ac.id
2 Review What is the difference between additive and multiplicative seasonal pattern in time series data? What is the basic idea of additive Winter s smoothing method? What are the issues of additive Winter s smoothing procedure?

3 Seasonal Data
4 Seasonal Data Aditif Multiplikatif Additive Multiplicative
5 Outline Time series data set with multiplicative seasonal component Winter s smoothing method for multiplicative seasonal time series data Ilustration
6

7
8 EXPONENTIAL SMOOTHING FOR SEASONAL DATA Originally introduced by Holt (1957) and Winters (1960) Generally known as Winters method Basic idea: seasonal adjustment linear trend model Two types of adjustments are suggested: Additive Multiplicative
9 Aditive Model Y t = L t + S t + ε t level or linear trend component can in turn be represented by β 0 + β 1 t the seasonal adjustment S t = S t+m = S t+2m = for t = 1,, m 1 length of the season (period) of the cycles
 of the cycles")
10 Multiplicative Model Y t = L t S t + ε t level or linear trend component can in turn be represented by β 0 + β 1 t the seasonal adjustment S t = S t+m = S t+2m = for t = 1,, m 1 length of the season (period) of the cycles
11 Additive Vs Multiplicative Holt- Winter s Method Additive: Y t+h t = L t + B t h + S t+h m Level Trend Seasonal Multiplicative: Y t+h t = L t + B t h S t+h m
12 Holt-Winters Multiplicative Formulation Suppose the time series is denoted by y 1,, y n with m seasonal period. Estimate of the level: L t = α Estimate of the trend: Y t S t m + 1 α L t 1 + B t 1 B t = γ L t L t γ B t 1 Estimate of the seasonal factor: S t = δ Y t L t + 1 δ S t m
13 h-step-ahead forecast Let Y t+h t be the h-step forecast made using data to time t Y t+h t = L t + B t h S t+h m
14 Holt-Winters Additive Vs Multiplicative Formulation Suppose the time series is denoted by y 1,, y n with m seasonal period. Est. of level Additive L t = α Y t S t m + 1 α L t 1 + B t 1 L t = α Multiplicative Y t S t m + 1 α L t 1 + B t 1 Est. of trend B t = γ L t L t γ B t 1 B t = γ L t L t γ B t 1 Est. of seasonal S t = δ Y t L t + 1 δ S t m S t = δ Y t L t + 1 δ S t m Forecast Y t+h t = L t + B t h + S t+h m Y t+h t = L t + B t h S t+h m
15 The Procedure Step 1: Initialize the value of L t, B t, and S t Step 2: Update the estimate of L t Step 3: Update the estimate of B t Step 4: Update the estimate of S t Step 5: Conduct the h-step-ahead forecast
16 Initializing the Holt-Winters method Hyndman (2010) 1. Fit a 2 m moving average smoother to the first 2 or 3 years of data. 2. Subtract smooth trend from the original data to get detrended data. The initial seasonal values are then obtained from the averaged de-trended data. 3. Subtract the seasonal values from the original data to get seasonally adjusted data. 4. Fit a linear trend to the seasonally adjusted data to get the initial level L 0 (the intercept) and the initial slope B 0.
17 Initializing the Holt-Winters method Montgomery (2015): Suppose a dataset consist of k seasons. L 0 = y k y 1 k 1 m where y i = 1 m im t= i 1 m+1 y t B 0 = y 1 m 2 L 0 S j m = m S j m i=1 S, for 1 j s, where S j = 1 j k t=1 k y t 1 m+j y t s+1 2 j β 0
18 Initializing the Holt-Winters method Hansun (2017) Used the basic principle of weighted moving average to give more weight to more recent data and estimate the initial values for the overall smoothing and the trend smoothing components. The initial values for the seasonal indices can be computed by calculating the average level for each observed season.
19 Procedures of Multiplicative Holt-Winters Method Use the Sports Drink example as an illustration Slide 19
20 Procedures of Multiplicative Holt-Winters Method Sports Drink (y) Time Slide 20
21 Procedures of Multiplicative Holt-Winters Method Observations: Linear upward trend over the 8-year period Magnitude of the seasonal span increases as the level of the time series increases Multiplicative Holt-Winters method can be applied to forecast future sales Slide 21
22 Procedures of Multiplicative Holt-Winters Method Step 1: Obtain initial values for the level l 0, the growth rate b 0, and the seasonal factors s -3, s -2, s -1, and s 0, by fitting a least squares trend line to at least four or five years of the historical data. y-intercept = l 0 ; slope = b 0 Slide 22

23 Procedures of Multiplicative Holt-Winters Method Example Fit a least squares trend line to the first 16 observations Trend line yˆ t t l 0 = ; b 0 = Slide 23
24 Procedures of Multiplicative Holt-Winters Method Step 2: Find the initial seasonal factors 1. Compute for the in-sample observations used for fitting the regression. In this example, t = 1, 2,, 16. y ˆt yˆ (1) yˆ (2) yˆ (16) Slide 24
25 Procedures of Multiplicative Holt-Winters Method Step 2: Find the initial seasonal factors 2. Detrend the data by computing SS 0,t ˆ t yt / yt for each time period that is used in finding the least squares regression equation. In this example, t = 1, 2,, 16. S 0,1 S 0,2 S y / yˆ 72 / S y / yˆ 116 / S 0, S y / yˆ 120 / Slide 25
26 Procedures of Multiplicative Holt-Winters Method Step 2: Find the initial seasonal factors 3. Compute the average seasonal values for each of the k seasons. The k averages are found by computing the average of the detrended values for the corresponding season. For example, for quarter 1, S [1] S1 S5 S9 S Slide 26
27 Procedures of Multiplicative Holt-Winters Method Step 2: Find the initial seasonal factors 4. Multiply the average seasonal values by the normalizing constant CF = m m i=1 S [i] such that the average of the seasonal factors is 1. The initial seasonal factors are sn S ( ) ( 1,2,..., ) i m i L S[] CF i L i Slide 27
28 Procedures of Multiplicative Holt-Winters Method Step 2: Find the initial seasonal factors 4. Multiply the average seasonal values by the normalizing constant such that the average of the seasonal factors is 1. Example CF = 4/ = sn S 3 = sn S 1 4 S ( CF) (1) [1] sn S 2 = sn S 2 4 S ( CF) (1) [2] sn S 1 = sn S 3 4 S ( CF) (1) [3] sn S 0 = sn S S[1] ( CF) (1) Slide 28
29 Procedures of Multiplicative Holt-Winters Method Step 3: Calculate a point forecast of y 1 from time 0 using the initial values y t+h t = L t + B t h S t+h m t = 1, h = 0 y 1 0 = L 0 + B 0 S 1 4 = L 0 + B 0 S 3 y 1 0 = y 1 0 = Slide 29
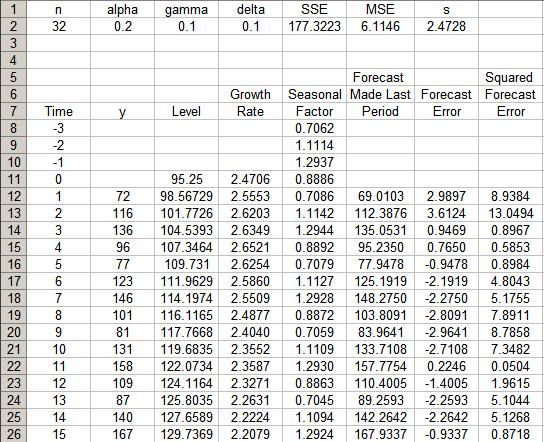
30 Procedures of Multiplicative Holt-Winters Method Step 4: Update the estimates l T, b T, and sn T by using some predetermined values of smoothing constants. Example: let = 0.2, = 0.1, and δ = 0.1 l b ( y / sn ) (1 )( l b ) s (72 / ) 0.8( ) ( l l ) (1 ) b ( ) 0.9(2.4706) sn1 ( y1 / l 1) (1 ) sn s (72 / ) 0.9(0.7062) yˆ 2(1) ( l 1 b1 ) sn s ( )(1.1114) Slide 30
31 yˆ 3 b sn y2 sn s b b y2 2 1 sn s b2 sn s Slide 31
32 yˆ 5 b sn y4 sn s b b y4 4 1 sn s b4 sn s Slide 32
33 Slide 33
 Example: Use Solver in Excel as an illustration SSE alpha gamma delta Slide")
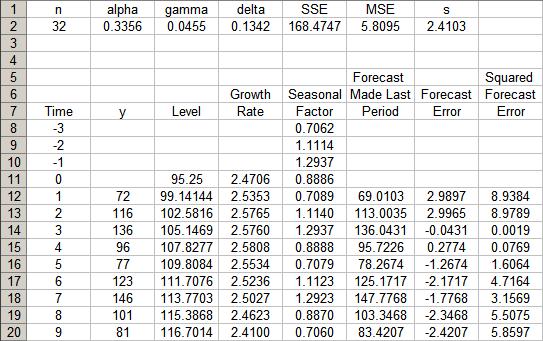
34 Procedures of Multiplicative Holt-Winters Method Step 5: Find the most suitable combination of,, and δ that minimizes SSE (or MSE) Example: Use Solver in Excel as an illustration SSE alpha gamma delta Slide 34
35 Slide 35
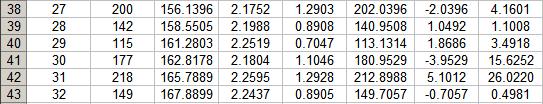
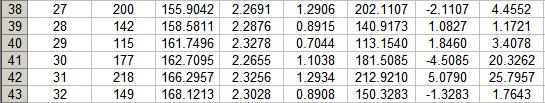
36 Multiplicative Holt-Winters Method p-step-ahead forecast made at time T y t+h t = L t + B t h S t+h m h = 1, 2, 3,. Example yˆ (32) ( l b ) sn s 33 4 ( )(0.7044) yˆ (32) ( l 2 b ) sn [ (2.3028)](1.1038) s yˆ (32) ( l 3 b ) sn [( (2.3028)](1.2934) s yˆ (32) ( l 4 b ) sn [( (2.3028)](0.8908) s Slide 36
37 Multiplicative Holt-Winters Method Example Forecast Plot for Sports Drink Sales Observed values Forecasts Forecasts Time Slide 37
38 Chapter Summary Additive Vs multiplicative Holt-Winter s smoothing? Basic idea of multiplicative Holt-Winter s smoothing? Procedure in multiplicative Holt-Winter s smoothing?
, chapter 4")
39 Another Example See example 4.8 on Montgomery (2015), chapter 4 page 309.
40 Exercise 1. Montgomery (2015) exercise 4.27, 4.28, Montgomery (2015) exercise 4.30 part (c) 3. Montgomery (2015) exercise 4.32 part (c)
41 Next Topic Regression for Time Series Data Set (part 1)
42 References Hyndman, R.J Initializing the Holt-Winters method. [March 7 th, 2018] Hyndman, R.J and Athanasopoulos, G Forecasting: principles and practice. fpp/6/2/ [March 7 th, 2018] Montgomery, D.C., Jennings, C.L., Kulahci, M Introduction to Time Series Analysis and Forecasting, 2 nd ed. New Jersey: John Wiley & Sons. Hansun, S New Estimation Rules for Unknown Parameters on Holt-Winters Multiplicative Method. J.Math. Fund. Sci., Vol. 49 (2): DOI: /j.math.fund.sci Wan, A Exponential Smoothing. cityu.edu.hk/msawan/teaching/ms6215/exponential%20smoothin g%20methods.ppt [March 7 th, 2018] 42
43 The handouts are available on the following site: stat.ipb.ac.id/en 43
44
STATS24x7.com 2010 ADI NV, INC.
 TIME SERIES SIMPLE EXPONENTIAL SMOOTHING If the mean of y t remains constant over n time, each observation gets equal weight: y ˆ t1 yt 0 et, 0 y n t 1 If the mean of y t changes slowly over time, recent
Product and Inventory Management (35E00300) Forecasting Models Trend analysis
 Forecasting Models Trend analysis") Product and Inventory Management (35E00300) Forecasting Models Trend analysis Exponential Smoothing Data Storage Shed Sales Period Actual Value(Y t ) Ŷ t-1 α Y t-1 Ŷ t-1 Ŷ t January 10 = 10 0.1 February
Product and Inventory Management (35E00300) Forecasting Models Trend analysis Exponential Smoothing Data Storage Shed Sales Period Actual Value(Y t ) Ŷ t-1 α Y t-1 Ŷ t-1 Ŷ t January 10 = 10 0.1 February
INTRODUCTION TO FORECASTING (PART 2) AMAT 167
 AMAT 167") INTRODUCTION TO FORECASTING (PART 2) AMAT 167 Techniques for Trend EXAMPLE OF TRENDS In our discussion, we will focus on linear trend but here are examples of nonlinear trends: EXAMPLE OF TRENDS If you
INTRODUCTION TO FORECASTING (PART 2) AMAT 167 Techniques for Trend EXAMPLE OF TRENDS In our discussion, we will focus on linear trend but here are examples of nonlinear trends: EXAMPLE OF TRENDS If you
DEPARTMENT OF QUANTITATIVE METHODS & INFORMATION SYSTEMS
 DEPARTMENT OF QUANTITATIVE METHODS & INFORMATION SYSTEMS Moving Averages and Smoothing Methods ECON 504 Chapter 7 Fall 2013 Dr. Mohammad Zainal 2 This chapter will describe three simple approaches to forecasting
Chapter 5: Forecasting
 1 Textbook: pp. 165-202 Chapter 5: Forecasting Every day, managers make decisions without knowing what will happen in the future 2 Learning Objectives After completing this chapter, students will be able
Lecture 1: Introduction to Forecasting
 NATCOR: Forecasting & Predictive Analytics Lecture 1: Introduction to Forecasting Professor John Boylan Lancaster Centre for Forecasting Department of Management Science Leading research centre in applied
Forecasting. Copyright 2015 Pearson Education, Inc.
 5 Forecasting To accompany Quantitative Analysis for Management, Twelfth Edition, by Render, Stair, Hanna and Hale Power Point slides created by Jeff Heyl Copyright 2015 Pearson Education, Inc. LEARNING
Operation and Supply Chain Management Prof. G. Srinivasan Department of Management Studies Indian Institute of Technology, Madras
 Operation and Supply Chain Management Prof. G. Srinivasan Department of Management Studies Indian Institute of Technology, Madras Lecture - 3 Forecasting Linear Models, Regression, Holt s, Seasonality
Dennis Bricker Dept of Mechanical & Industrial Engineering The University of Iowa. Forecasting demand 02/06/03 page 1 of 34
 demand -5-4 -3-2 -1 0 1 2 3 Dennis Bricker Dept of Mechanical & Industrial Engineering The University of Iowa Forecasting demand 02/06/03 page 1 of 34 Forecasting is very difficult. especially about the
Lecture 7: Exponential Smoothing Methods Please read Chapter 4 and Chapter 2 of MWH Book
 Lecture 7: Exponential Smoothing Methods Please read Chapter 4 and Chapter 2 of MWH Book 1 Big Picture 1. In lecture 6, smoothing (averaging) method is used to estimate the trend-cycle (decomposition)
Forecasting Module 2. Learning Objectives. Trended Data. By Sue B. Schou Phone:
 Forecasting Module 2 By Sue B. Schou Phone: 8-282-408 Email: schosue@isu.edu Learning Objectives Make forecast models using trend analysis in Minitab Make forecast models using Holt s exponential smoothing
Economic Forecasting Lecture 9: Smoothing Methods
 Economic Forecasting Lecture 9: Smoothing Methods Richard G. Pierse 1 Introduction Smoothing methods are rather different from the model-based methods that we have been looking at up to now in this module.
STAT 115: Introductory Methods for Time Series Analysis and Forecasting. Concepts and Techniques
 STAT 115: Introductory Methods for Time Series Analysis and Forecasting Concepts and Techniques School of Statistics University of the Philippines Diliman 1 FORECASTING Forecasting is an activity that
Econ 3790: Statistics Business and Economics. Instructor: Yogesh Uppal
 Econ 3790: Statistics Business and Economics Instructor: Yogesh Uppal Email: yuppal@ysu.edu Chapter 14 Covariance and Simple Correlation Coefficient Simple Linear Regression Covariance Covariance between
Foundations - 1. Time-series Analysis, Forecasting. Temporal Information Retrieval
 Foundations - 1 Time-series Analysis, Forecasting Temporal Information Retrieval Time Series An ordered sequence of values (data points) of variables at equally spaced time intervals Time Series Components
Forecasting. Operations Analysis and Improvement Spring
 Forecasting Operations Analysis and Improvement 2015 Spring Dr. Tai-Yue Wang Industrial and Information Management Department National Cheng Kung University 1-2 Outline Introduction to Forecasting Subjective
Time-series Forecasting - Exponential Smoothing
 Time-series Forecasting - Exponential Smoothing Dr. Josif Grabocka ISMLL, University of Hildesheim Business Analytics Business Analytics 1 / 26 Motivation Extreme recentivism: The Naive forecast considers
Applications of Mathematics
 Applications of Mathematics Tomáš Cipra Exponential smoothing for irregular data Applications of Mathematics Vol. 5 2006) No. 6 597--604 Persistent URL: http://dml.cz/dmlcz/34655 Terms of use: Institute
Chapter 14 Simple Linear Regression (A)
") Chapter 14 Simple Linear Regression (A) 1. Characteristics Managerial decisions often are based on the relationship between two or more variables. can be used to develop an equation showing how the variables
Chapter 14 Simple Linear Regression (A) 1. Characteristics Managerial decisions often are based on the relationship between two or more variables. can be used to develop an equation showing how the variables
Forecasting. Chapter Copyright 2010 Pearson Education, Inc. Publishing as Prentice Hall
 Forecasting Chapter 15 15-1 Chapter Topics Forecasting Components Time Series Methods Forecast Accuracy Time Series Forecasting Using Excel Time Series Forecasting Using QM for Windows Regression Methods
DEPARTMENT OF ECONOMETRICS AND BUSINESS STATISTICS
 ISSN 1440-771X ISBN 0 7326 1085 0 Unmasking the Theta Method Rob J. Hyndman and Baki Billah Working Paper 5/2001 2001 DEPARTMENT OF ECONOMETRICS AND BUSINESS STATISTICS AUSTRALIA Unmasking the Theta method
Forecasting. Dr. Richard Jerz rjerz.com
 Forecasting Dr. Richard Jerz 1 1 Learning Objectives Describe why forecasts are used and list the elements of a good forecast. Outline the steps in the forecasting process. Describe at least three qualitative
Lecture Prepared By: Mohammad Kamrul Arefin Lecturer, School of Business, North South University
 Lecture 15 20 Prepared By: Mohammad Kamrul Arefin Lecturer, School of Business, North South University Modeling for Time Series Forecasting Forecasting is a necessary input to planning, whether in business,
The Multiple Regression Model
 Multiple Regression The Multiple Regression Model Idea: Examine the linear relationship between 1 dependent (Y) & or more independent variables (X i ) Multiple Regression Model with k Independent Variables:
Dennis Bricker Dept of Mechanical & Industrial Engineering The University of Iowa. Exponential Smoothing 02/13/03 page 1 of 38
 demand -5-4 -3-2 -1 0 1 2 3 Dennis Bricker Dept of Mechanical & Industrial Engineering The University of Iowa Exponential Smoothing 02/13/03 page 1 of 38 As with other Time-series forecasting methods,
Forecasting. Simon Shaw 2005/06 Semester II
 Forecasting Simon Shaw s.c.shaw@maths.bath.ac.uk 2005/06 Semester II 1 Introduction A critical aspect of managing any business is planning for the future. events is called forecasting. Predicting future
Forecasting: The First Step in Demand Planning
 Forecasting: The First Step in Demand Planning Jayant Rajgopal, Ph.D., P.E. University of Pittsburgh Pittsburgh, PA 15261 In a supply chain context, forecasting is the estimation of future demand General
Statistical Methods for Forecasting
 Statistical Methods for Forecasting BOVAS ABRAHAM University of Waterloo JOHANNES LEDOLTER University of Iowa John Wiley & Sons New York Chichester Brisbane Toronto Singapore Contents 1 INTRODUCTION AND
Exponentially weighted forecasts
 FORECASTING USING R Exponentially weighted forecasts Rob Hyndman Author, forecast Simple exponential smoothing Forecasting Notation: ŷ t+h t = y t+h y 1,...,y t point forecast of Forecast Equation: given
ECON 343 Lecture 4 : Smoothing and Extrapolation of Time Series. Jad Chaaban Spring
 ECON 343 Lecture 4 : Smoothing and Extrapolation of Time Series Jad Chaaban Spring 2005-2006 Outline Lecture 4 1. Simple extrapolation models 2. Moving-average models 3. Single Exponential smoothing 4.
Econ 3790: Business and Economics Statistics. Instructor: Yogesh Uppal
 Econ 3790: Business and Economics Statistics Instructor: Yogesh Uppal yuppal@ysu.edu Sampling Distribution of b 1 Expected value of b 1 : Variance of b 1 : E(b 1 ) = 1 Var(b 1 ) = σ 2 /SS x Estimate of
BUSI 460 Suggested Answers to Selected Review and Discussion Questions Lesson 7
 BUSI 460 Suggested Answers to Selected Review and Discussion Questions Lesson 7 1. The definitions follow: (a) Time series: Time series data, also known as a data series, consists of observations on a
Forecasting. BUS 735: Business Decision Making and Research. exercises. Assess what we have learned
 Forecasting BUS 735: Business Decision Making and Research 1 1.1 Goals and Agenda Goals and Agenda Learning Objective Learn how to identify regularities in time series data Learn popular univariate time
Chapter 7 Forecasting Demand
 Chapter 7 Forecasting Demand Aims of the Chapter After reading this chapter you should be able to do the following: discuss the role of forecasting in inventory management; review different approaches
CHAPTER 1: Decomposition Methods
 CHAPTER 1: Decomposition Methods Prof. Alan Wan 1 / 48 Table of contents 1. Data Types and Causal vs.time Series Models 2 / 48 Types of Data Time series data: a sequence of observations measured over time,
STA 6104 Financial Time Series. Moving Averages and Exponential Smoothing
 STA 6104 Financial Time Series Moving Averages and Exponential Smoothing Smoothing Our objective is to predict some future value Y n+k given a past history {Y 1, Y 2,..., Y n } of observations up to time
Chapter 14 Student Lecture Notes Department of Quantitative Methods & Information Systems. Business Statistics. Chapter 14 Multiple Regression
 Chapter 14 Student Lecture Notes 14-1 Department of Quantitative Methods & Information Systems Business Statistics Chapter 14 Multiple Regression QMIS 0 Dr. Mohammad Zainal Chapter Goals After completing
FORECASTING AND MODEL SELECTION
 FORECASTING AND MODEL SELECTION Anurag Prasad Department of Mathematics and Statistics Indian Institute of Technology Kanpur, India REACH Symposium, March 15-18, 2008 1 Forecasting and Model Selection
Chapter 4. Regression Models. Learning Objectives
 Chapter 4 Regression Models To accompany Quantitative Analysis for Management, Eleventh Edition, by Render, Stair, and Hanna Power Point slides created by Brian Peterson Learning Objectives After completing
Unit 11: Multiple Linear Regression
 Unit 11: Multiple Linear Regression Statistics 571: Statistical Methods Ramón V. León 7/13/2004 Unit 11 - Stat 571 - Ramón V. León 1 Main Application of Multiple Regression Isolating the effect of a variable
Correlation Analysis
 Simple Regression Correlation Analysis Correlation analysis is used to measure strength of the association (linear relationship) between two variables Correlation is only concerned with strength of the
Time-Series Analysis. Dr. Seetha Bandara Dept. of Economics MA_ECON
 Time-Series Analysis Dr. Seetha Bandara Dept. of Economics MA_ECON Time Series Patterns A time series is a sequence of observations on a variable measured at successive points in time or over successive
Chapter 8 - Forecasting
 Chapter 8 - Forecasting Operations Management by R. Dan Reid & Nada R. Sanders 4th Edition Wiley 2010 Wiley 2010 1 Learning Objectives Identify Principles of Forecasting Explain the steps in the forecasting
Complex exponential Smoothing. Ivan Svetunkov Nikolaos Kourentzes Robert Fildes
 Complex exponential Smoothing Ivan Svetunkov Nikolaos Kourentzes Robert Fildes 18 March 2015 Introduction Exponential Smoothing methods performed very well in many competitions: M-Competitions in 1982
Mathematics for Economics MA course
 Mathematics for Economics MA course Simple Linear Regression Dr. Seetha Bandara Simple Regression Simple linear regression is a statistical method that allows us to summarize and study relationships between
Copyright 2010 Pearson Education, Inc. Publishing as Prentice Hall.
 13 Forecasting PowerPoint Slides by Jeff Heyl For Operations Management, 9e by Krajewski/Ritzman/Malhotra 2010 Pearson Education 13 1 Forecasting Forecasts are critical inputs to business plans, annual
Regression Models. Chapter 4
 Chapter 4 Regression Models To accompany Quantitative Analysis for Management, Eleventh Edition, by Render, Stair, and Hanna Power Point slides created by Brian Peterson Introduction Regression analysis
15 yaş üstü istihdam ( )
") Forecasting 1-2 Forecasting 23 000 15 yaş üstü istihdam (2005-2008) 22 000 21 000 20 000 19 000 18 000 17 000 - What can we say about this data? - Can you guess the employement level for July 2013? 1-3
Forecasting 1-2 Forecasting 23 000 15 yaş üstü istihdam (2005-2008) 22 000 21 000 20 000 19 000 18 000 17 000 - What can we say about this data? - Can you guess the employement level for July 2013? 1-3
Suppose we obtain a MLR equation as follows:
 Psychology 8 Lecture #9 Outline Probing Interactions among Continuous Variables Suppose we carry out a MLR analysis using a model that includes an interaction term and we find the interaction effect to
Statistics for Managers using Microsoft Excel 6 th Edition
 Statistics for Managers using Microsoft Excel 6 th Edition Chapter 13 Simple Linear Regression 13-1 Learning Objectives In this chapter, you learn: How to use regression analysis to predict the value of
Robust control charts for time series data
 Robust control charts for time series data Christophe Croux K.U. Leuven & Tilburg University Sarah Gelper Erasmus University Rotterdam Koen Mahieu K.U. Leuven Abstract This article presents a control chart
Lecture 4 Forecasting
 King Saud University College of Computer & Information Sciences IS 466 Decision Support Systems Lecture 4 Forecasting Dr. Mourad YKHLEF The slides content is derived and adopted from many references Outline
Forecasting. Al Nosedal University of Toronto. March 8, Al Nosedal University of Toronto Forecasting March 8, / 80
 Forecasting Al Nosedal University of Toronto March 8, 2016 Al Nosedal University of Toronto Forecasting March 8, 2016 1 / 80 Forecasting Methods: An Overview There are many forecasting methods available,
STAT 212 Business Statistics II 1
 STAT 1 Business Statistics II 1 KING FAHD UNIVERSITY OF PETROLEUM & MINERALS DEPARTMENT OF MATHEMATICAL SCIENCES DHAHRAN, SAUDI ARABIA STAT 1: BUSINESS STATISTICS II Semester 091 Final Exam Thursday Feb
Decision 411: Class 9. HW#3 issues
 Decision 411: Class 9 Presentation/discussion of HW#3 Introduction to ARIMA models Rules for fitting nonseasonal models Differencing and stationarity Reading the tea leaves : : ACF and PACF plots Unit
Inference for Regression Simple Linear Regression
 Inference for Regression Simple Linear Regression IPS Chapter 10.1 2009 W.H. Freeman and Company Objectives (IPS Chapter 10.1) Simple linear regression p Statistical model for linear regression p Estimating
Exponential smoothing in the telecommunications data
 Available online at www.sciencedirect.com International Journal of Forecasting 24 (2008) 170 174 www.elsevier.com/locate/ijforecast Exponential smoothing in the telecommunications data Everette S. Gardner
Lecture 3: Inference in SLR
 Lecture 3: Inference in SLR STAT 51 Spring 011 Background Reading KNNL:.1.6 3-1 Topic Overview This topic will cover: Review of hypothesis testing Inference about 1 Inference about 0 Confidence Intervals
A time series is called strictly stationary if the joint distribution of every collection (Y t
 5 Time series A time series is a set of observations recorded over time. You can think for example at the GDP of a country over the years (or quarters) or the hourly measurements of temperature over a
The Art of Forecasting
 Time Series The Art of Forecasting Learning Objectives Describe what forecasting is Explain time series & its components Smooth a data series Moving average Exponential smoothing Forecast using trend models
Principles of forecasting
 2.5 Forecasting Principles of forecasting Forecast based on conditional expectations Suppose we are interested in forecasting the value of y t+1 based on a set of variables X t (m 1 vector). Let y t+1
Inferences for Regression
 Inferences for Regression An Example: Body Fat and Waist Size Looking at the relationship between % body fat and waist size (in inches). Here is a scatterplot of our data set: Remembering Regression In
Decision 411: Class 4
 Decision 411: Class 4 Non-seasonal averaging & smoothing models Simple moving average (SMA) model Simple exponential smoothing (SES) model Linear exponential smoothing (LES) model Combining seasonal adjustment
Simple Linear Regression
 9-1 l Chapter 9 l Simple Linear Regression 9.1 Simple Linear Regression 9.2 Scatter Diagram 9.3 Graphical Method for Determining Regression 9.4 Least Square Method 9.5 Correlation Coefficient and Coefficient
Forecasting models and methods
 Forecasting models and methods Giovanni Righini Università degli Studi di Milano Logistics Forecasting methods Forecasting methods are used to obtain information to support decision processes based on
Ch. 12: Workload Forecasting
 Ch. 12: Workload Forecasting Kenneth Mitchell School of Computing & Engineering, University of Missouri-Kansas City, Kansas City, MO 64110 Kenneth Mitchell, CS & EE dept., SCE, UMKC p. 1/2 Introduction
Operations Management
 3-1 Forecasting Operations Management William J. Stevenson 8 th edition 3-2 Forecasting CHAPTER 3 Forecasting McGraw-Hill/Irwin Operations Management, Eighth Edition, by William J. Stevenson Copyright
Decision 411: Class 3
 Decision 411: Class 3 Discussion of HW#1 Introduction to seasonal models Seasonal decomposition Seasonal adjustment on a spreadsheet Forecasting with seasonal adjustment Forecasting inflation Poor man
STA 108 Applied Linear Models: Regression Analysis Spring Solution for Homework #6
 STA 8 Applied Linear Models: Regression Analysis Spring 011 Solution for Homework #6 6. a) = 11 1 31 41 51 1 3 4 5 11 1 31 41 51 β = β1 β β 3 b) = 1 1 1 1 1 11 1 31 41 51 1 3 4 5 β = β 0 β1 β 6.15 a) Stem-and-leaf
STATISTICAL DATA ANALYSIS IN EXCEL
 Microarra Center STATISTICAL DATA ANALYSIS IN EXCEL Lecture 5 Linear Regression dr. Petr Nazarov 14-1-213 petr.nazarov@crp-sante.lu Statistical data analsis in Ecel. 5. Linear regression OUTLINE Lecture
Multiple Regression. Inference for Multiple Regression and A Case Study. IPS Chapters 11.1 and W.H. Freeman and Company
 Multiple Regression Inference for Multiple Regression and A Case Study IPS Chapters 11.1 and 11.2 2009 W.H. Freeman and Company Objectives (IPS Chapters 11.1 and 11.2) Multiple regression Data for multiple
BNAD 276 Lecture 10 Simple Linear Regression Model
 1 / 27 BNAD 276 Lecture 10 Simple Linear Regression Model Phuong Ho May 30, 2017 2 / 27 Outline 1 Introduction 2 3 / 27 Outline 1 Introduction 2 4 / 27 Simple Linear Regression Model Managerial decisions
arxiv: v1 [stat.co] 11 Dec 2012
![arxiv: v1 [stat.co] 11 Dec 2012](/thumbs/74/69772020.jpg "arxiv: v1 [stat.co] 11 Dec 2012") Simulating the Continuation of a Time Series in R December 12, 2012 arxiv:1212.2393v1 [stat.co] 11 Dec 2012 Halis Sak 1 Department of Industrial and Systems Engineering, Yeditepe University, Kayışdağı,
Simulating the Continuation of a Time Series in R December 12, 2012 arxiv:1212.2393v1 [stat.co] 11 Dec 2012 Halis Sak 1 Department of Industrial and Systems Engineering, Yeditepe University, Kayışdağı,
Prediction of maximum/minimum temperatures using Holt Winters Method with Excel Spread Sheet for Junagadh Region Gundalia Manoj j. Dholakia M. B.
 Prediction of maximum/minimum temperatures using Holt Winters Method with Excel Spread Sheet for Junagadh Region Gundalia Manoj j. Dholakia M. B. Ph. D. Scholar Gujarat Technological University, Ahmedabad
FinQuiz Notes
 Reading 9 A time series is any series of data that varies over time e.g. the quarterly sales for a company during the past five years or daily returns of a security. When assumptions of the regression
Linear Profile Forecasting using Regression Analysis
 Proceedings of the 2012 International Conference on Industrial Engineering and Operations Management Istanbul, Turkey, July 3 6, 2012 Linear Profile Forecasting using Regression Analysis Hamideh Razavi
Least Squares and Discounted Least Squares in Autoregressive Process
 122 Least Squares and Discounted Least Squares in Autoregressive Process Least Squares and Discounted Least Squares in Autoregressive Process Phongsaphen Jantana and Prapaisri Sudasna-na-Ayudthya Abstract
Problem 4.1, HR7E Forecasting R. Saltzman. b) Forecast for Oct. 12 using 3-week weighted moving average with weights.1,.3,.6: 372.
 Forecast for Oct. 12 using 3-week weighted moving average with weights.1,.3,.6: 372.") Problem 4.1, HR7E Forecasting R. Saltzman Part c Week Pints ES Forecast Aug. 31 360 360 Sept. 7 389 360 Sept. 14 410 365.8 Sept. 21 381 374.64 Sept. 28 368 375.91 Oct. 5 374 374.33 Oct. 12? 374.26 a) Forecast
Problem 4.1, HR7E Forecasting R. Saltzman Part c Week Pints ES Forecast Aug. 31 360 360 Sept. 7 389 360 Sept. 14 410 365.8 Sept. 21 381 374.64 Sept. 28 368 375.91 Oct. 5 374 374.33 Oct. 12? 374.26 a) Forecast
FORECASTING FLUCTUATIONS OF ASPHALT CEMENT PRICE INDEX IN GEORGIA
 FORECASTING FLUCTUATIONS OF ASPHALT CEMENT PRICE INDEX IN GEORGIA Mohammad Ilbeigi, Baabak Ashuri, Ph.D., and Yang Hui Economics of the Sustainable Built Environment (ESBE) Lab, School of Building Construction
Lecture 2 Simple Linear Regression STAT 512 Spring 2011 Background Reading KNNL: Chapter 1
 Lecture Simple Linear Regression STAT 51 Spring 011 Background Reading KNNL: Chapter 1-1 Topic Overview This topic we will cover: Regression Terminology Simple Linear Regression with a single predictor
Lecture 10 Multiple Linear Regression
 Lecture 10 Multiple Linear Regression STAT 512 Spring 2011 Background Reading KNNL: 6.1-6.5 10-1 Topic Overview Multiple Linear Regression Model 10-2 Data for Multiple Regression Y i is the response variable
A new approach to forecasting based on exponential smoothing with independent regressors
 ISSN 1440-771X Australia Department of Econometrics and Business Statistics http://wwwbusecomonasheduau/depts/ebs/pubs/wpapers/ A new approach to forecasting based on exponential smoothing with independent
Improved Holt Method for Irregular Time Series
 WDS'08 Proceedings of Contributed Papers, Part I, 62 67, 2008. ISBN 978-80-7378-065-4 MATFYZPRESS Improved Holt Method for Irregular Time Series T. Hanzák Charles University, Faculty of Mathematics and
Decision 411: Class 4
 Decision 411: Class 4 Non-seasonal averaging & smoothing models Simple moving average (SMA) model Simple exponential smoothing (SES) model Linear exponential smoothing (LES) model Combining seasonal adjustment
Inference for the Regression Coefficient
 Inference for the Regression Coefficient Recall, b 0 and b 1 are the estimates of the slope β 1 and intercept β 0 of population regression line. We can shows that b 0 and b 1 are the unbiased estimates
Exponential smoothing is, like the moving average forecast, a simple and often used forecasting technique
 EconS 450 Advanced Farm Management Forecasting Lecture 2 Simple Exponential Smoothing Exponential smoothing is, like the moving average forecast, a simple and often used forecasting technique Exponential
3 Time Series Regression
 3 Time Series Regression 3.1 Modelling Trend Using Regression Random Walk 2 0 2 4 6 8 Random Walk 0 2 4 6 8 0 10 20 30 40 50 60 (a) Time 0 10 20 30 40 50 60 (b) Time Random Walk 8 6 4 2 0 Random Walk 0
The exponent of a number shows you how many times the number is being multiplied by itself.
 Name Evaluating Numerical Expressions with Exponents- Step-by-Step Lesson Lesson 1 Exponent Problem: Write the expression as an exponent. 4 x 4 x 4 x 4 x 4 Explanation: The exponent of a number shows you
Forecasting: principles and practice. Rob J Hyndman 1.1 Introduction to Forecasting
 Forecasting: principles and practice Rob J Hyndman 1.1 Introduction to Forecasting 1 Outline 1 Background 2 Case studies 3 The statistical forecasting perspective 4 What can we forecast? 2 Resources Slides
Bayesian Models for Time Series with Covariates, Trend, Seasonality, Autoregression and Outliers
 Journal of Computer Science, 9 (3): 9-98, 03 ISSN 549-3636 03 Tongkhow and Kantanantha, This open access article is distributed under a Creative Commons Attribution (CC-BY) 3.0 license doi:0.3844/jcssp.03.9.98
The data was collected from the website and then converted to a time-series indexed from 1 to 86.
 Introduction For our group project, we analyzed the S&P 500s futures from 30 November, 2015 till 28 March, 2016. The S&P 500 futures give a reasonable estimate of the changes in the market in the short
Lecture # 31. Questions of Marks 3. Question: Solution:
 Lecture # 31 Given XY = 400, X = 5, Y = 4, S = 4, S = 3, n = 15. Compute the coefficient of correlation between XX and YY. r =0.55 X Y Determine whether two variables XX and YY are correlated or uncorrelated
The linear regression model: functional form and structural breaks
 The linear regression model: functional form and structural breaks Ragnar Nymoen Department of Economics, UiO 16 January 2009 Overview Dynamic models A little bit more about dynamics Extending inference
Basic Business Statistics 6 th Edition
 Basic Business Statistics 6 th Edition Chapter 12 Simple Linear Regression Learning Objectives In this chapter, you learn: How to use regression analysis to predict the value of a dependent variable based
Evaluation of Some Techniques for Forecasting of Electricity Demand in Sri Lanka
 Appeared in Sri Lankan Journal of Applied Statistics (Volume 3) 00 Evaluation of Some echniques for Forecasting of Electricity Demand in Sri Lanka.M.J. A. Cooray and M.Indralingam Department of Mathematics
Industrial Engineering Prof. Inderdeep Singh Department of Mechanical & Industrial Engineering Indian Institute of Technology, Roorkee
 Industrial Engineering Prof. Inderdeep Singh Department of Mechanical & Industrial Engineering Indian Institute of Technology, Roorkee Module - 04 Lecture - 05 Sales Forecasting - II A very warm welcome
Simultaneous Linear Equations
 Simultaneous Linear Equations PHYSICAL PROBLEMS Truss Problem Pressure vessel problem a a b c b Polynomial Regression We are to fit the data to the polynomial regression model Simultaneous Linear Equations
Forecasting: Methods and Applications
 Neapolis University HEPHAESTUS Repository School of Economic Sciences and Business http://hephaestus.nup.ac.cy Books 1998 Forecasting: Methods and Applications Makridakis, Spyros John Wiley & Sons, Inc.
SCIENCE & TECHNOLOGY
 Pertanika J. Sci. & Technol. 5 (3): 787-796 (017) SCIENCE & TECHNOLOGY Journal homepage: http://www.pertanika.upm.edu.my/ Combination of Forecasts with an Application to Unemployment Rate Muniroh, M. F.
Bachelor thesis. Forecasting inflation in Sweden - A univariate approach. Eva Huselius and Linn Wallén
 Bachelor thesis Department of Statistics Kandidatuppsats, Statistiska Institutionen Nr 2014:11 Forecasting inflation in Sweden - A univariate approach Eva Huselius and Linn Wallén Bachelor thesis 15 HE