ECON 343 Lecture 4 : Smoothing and Extrapolation of Time Series. Jad Chaaban Spring
|
|
|
- Liliana Watkins
- 6 years ago
- Views:
Transcription
1 ECON 343 Lecture 4 : Smoothing and Extrapolation of Time Series Jad Chaaban Spring
2 Outline Lecture 4 1. Simple extrapolation models 2. Moving-average models 3. Single Exponential smoothing 4. Double Exponential smoothing 5. Seasonal adjustment 6. Structural breaks
3 1. Simple extrapolation models Assumptions: Forecast the time series on the basis of its past behavior Deterministic nature: no randomness used in the models here Regress the series against a function of time and/or itself lagged Types of models: Linear trend model Quadratic trend model Exponential model Autoregressive trend model
4 Linear trend model Assumptions: The series will increase in constant absolute amounts each period Trend line depends only on time t Formula: Y t = α + βt t is usually chosen to equal 0 in the base period and to increase by 1 during each successive period Simple OLS estimation
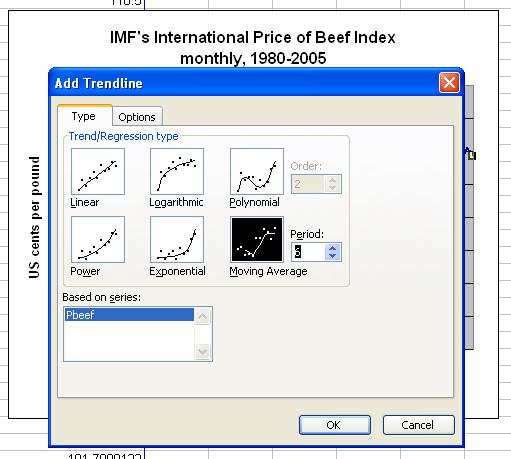
5 Excel implementation IMF's International Price of Beef Index monthly, US cents per pound Jan-80 Jan-82 Jan-84 Jan-86 Jan-88 Jan-90 Jan-92 Jan-94 Jan-96 Jan-98 Jan-00 Jan-02 Jan-04
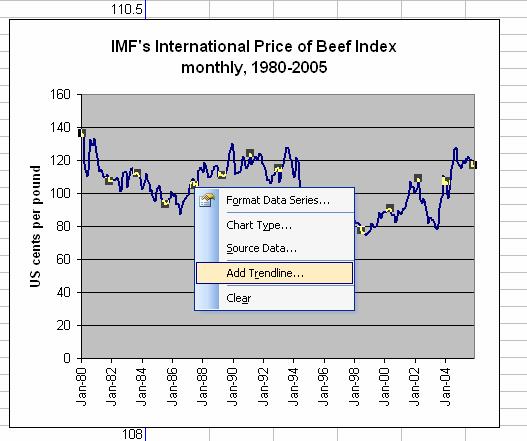
6 Excel implementation
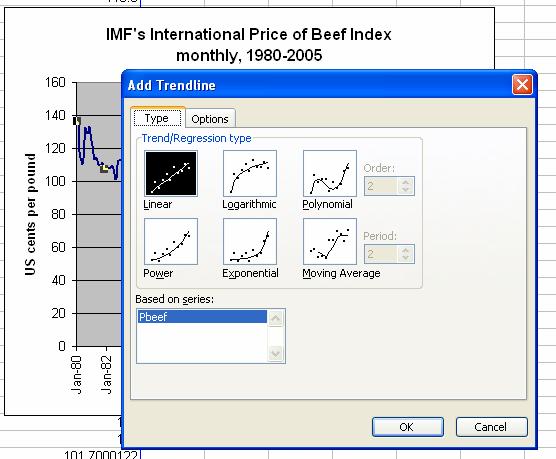
7 Excel implementation
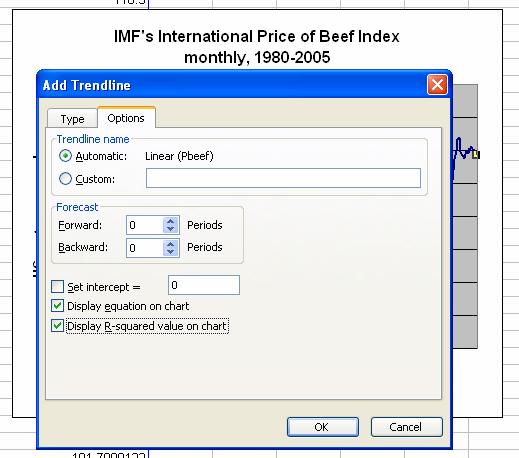
8 Excel implementation
9 Excel implementation IMF's International Price of Beef Index monthly, y = x R 2 = US cents per pound Jan-80 Jan-82 Jan-84 Jan-86 Jan-88 Jan-90 Jan-92 Jan-94 Jan-96 Jan-98 Jan-00 Jan-02 Jan-04
10 Quadratic trend model Assumptions: Extends the simple linear trend model to potential non-linearity Add a term t 2 Formula: Y t = α + βt + γt If β and γ are >0, then y t will always increase If β <0 and γ>0, y t will first decrease then increase If β and γ are <0, then y t will always decrease 2
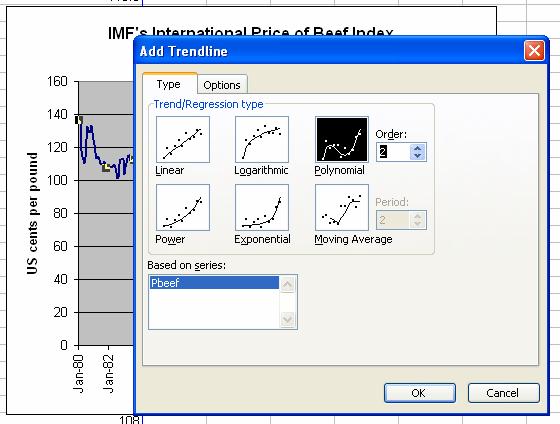
11 Excel implementation
12 Excel implementation IMF's International Price of Beef Index monthly, y = x x R 2 = US cents per pound Jan-80 Jan-82 Jan-84 Jan-86 Jan-88 Jan-90 Jan-92 Jan-94 Jan-96 Jan-98 Jan-00 Jan-02 Jan-04
13 Excel implementation Polynomial of 6 time variables y = -1E-11x 6 + 7E-08x x x x x - 2E+07 R 2 = US cents per pound Jan-80 Jan-82 Jan-84 Jan-86 Jan-88 Jan-90 Jan-92 Jan-94 Jan-96 Jan-98 Jan-00 Jan-02 Jan-04
14 Exponential model Assumptions: The series will grow with constant percentage increases Use of the exponential function Formula: Y = The parameters A and r can be estimated by taking the logarithms of both sides of the formula Then we fit the through OLS the log-linear function: where c 1 =log(a) and c 2 =r t Ae rt log( Y ) = c + c t t 1 2
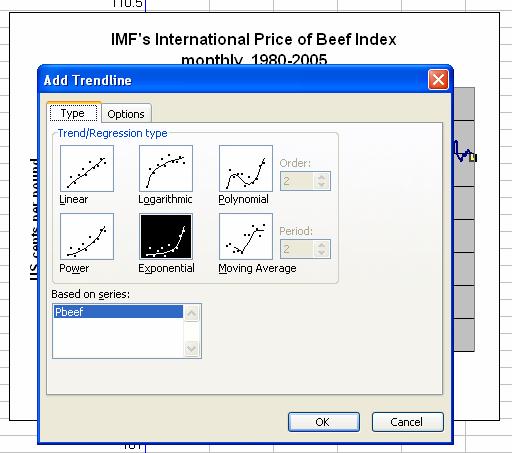
15 Excel implementation
16 Excel implementation IMF's International Price of Beef Index monthly, y = e x 60 R 2 = US cents per pound Jan-80 Jan-82 Jan-84 Jan-86 Jan-88 Jan-90 Jan-92 Jan-94 Jan-96 Jan-98 Jan-00 Jan-02 Jan-04
17 Autoregressive trend model Assumptions: The series will grow according to its lagged values only Formula: Y t = α + βyt 1 Variation of the model: logarithmic autoregressive trend model: log( Y ) = α + β log( Y ) t t 1 If α=0 then the value of β is the compounded rate of growth of the series Y
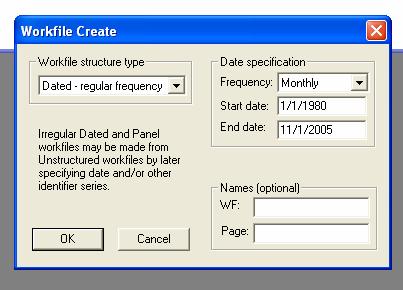
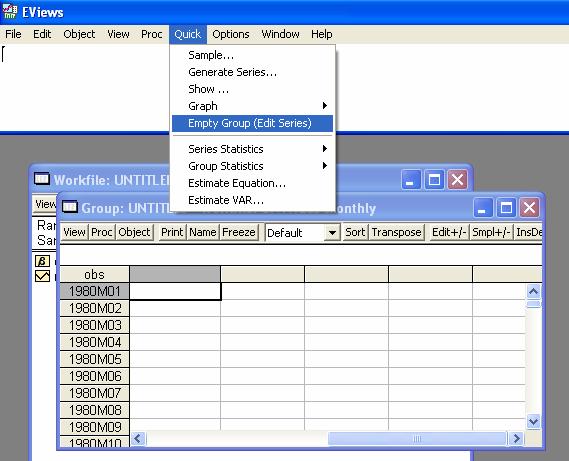
18 EViews implementation
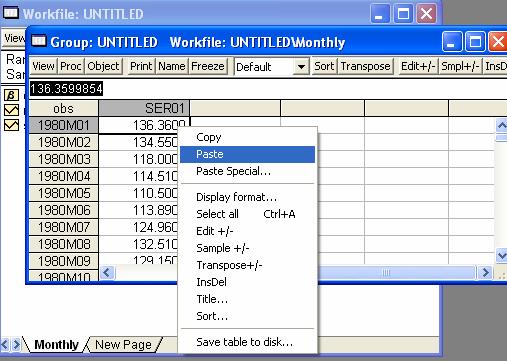
19 EViews implementation

20 EViews implementation renamed normal autoregressive
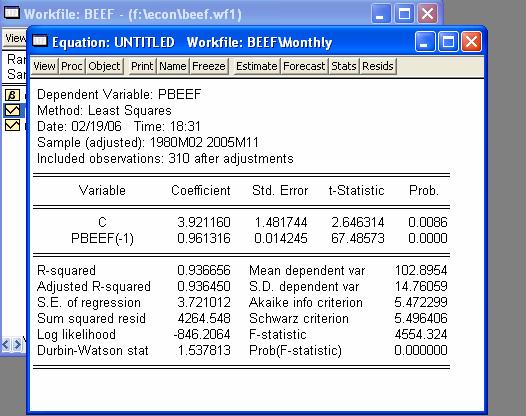
21 EViews implementation

22 Logarithmic autoregressive EViews implementation

23 Logarithmic autoregressive EViews implementation
24 2. Moving Average models Assumptions: The likely value for our series next month is a simple average of its values over the past 12 months No regression used in the model Moving Average An n-period moving average is the average value over the previous n time periods. As you move forward in time, the oldest time period is dropped from the analysis. Weighted Moving Average An n-period weighted moving average allows you to place more weight on more recent time periods by weighting those time periods more heavily.
25 Moving Average models Formulas: Moving Average MA = with n time periods Weighted Moving Average WMA = n n i ( y,..., 1 t t m n i y t n ( α y,..., 1 α y ) α M ) t n
26 Excel implementation
27 Excel implementation IMF's International Price of Beef Index monthly, Pbeef 6 months MA US cents per pound Jan-80 Jan-83 Jan-86 Jan-89 Jan-92 Jan-95 Jan-98 Jan-01 Jan-04
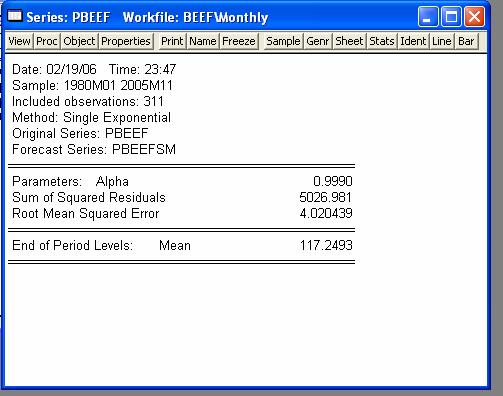
28 3. Single Exponential Smoothing This single exponential smoothing method is appropriate for series that move randomly above and below a constant mean with no trend nor seasonal patterns. The smoothed series of is computed recursively, by evaluating: where is the damping (or smoothing) factor. The smaller is the, the smoother is the series. By repeated substitution, we can rewrite the recursion as
29 Single Exponential Smoothing Exponential smoothing-the forecast of y t is a weighted average of the past values of y t, where the weights decline exponentially with time. The forecasts from single smoothing are constant for all future observations. This constant is given by: Where T is the end of the estimation sample. EViews uses the mean of the initial observations of y t to start the recursion. Values of α around 0.01 to 0.30 work quite well. You can also let EViews estimate to minimize the sum of squares of one-step forecast errors
30 4. Double Exponential Smoothing This method applies the single smoothing method twice (using the same parameter) It is appropriate for series with a linear trend Double smoothing of a series y is defined by the recursions: where S is the single smoothed series and D is the double smoothed series. Note that double smoothing is a single parameter smoothing method with damping factor
31 Double Exponential Smoothing Forecasts from double smoothing are computed as: This expression shows that forecasts from double smoothing lie on a linear trend with intercept and slope

32 Eviews Exponential Smoothing
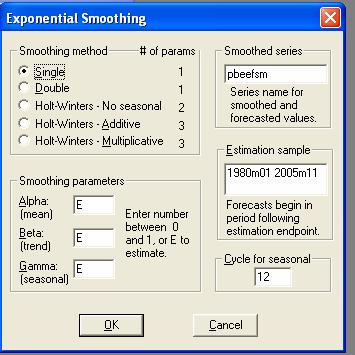
33 Eviews Exponential Smoothing
34 5. Seasonal adjustment If yt is a time series, then its generic element can be expressed as yt = Lt xct x St x εt where Lt : the global trend, Ct : a secular cycle (long term cyclical component), St : the seasonal variation, εt : an irregular component. The objective is to eliminate S First, estimate LxC by deriving an average. For monthly data, a 12-month average: ~ 1 yt = ( yt yt + yt yt 5 ) 12 which is free of irregular and seasonal fluctuations
35 Seasonal adjustment Then divide the original data by this estimate: L C S ε y t = S ε = = z t L C ~ y t The next step is to eliminate εt Average the values of St x εt corresponding to the same month For monthly data, suppose there are 48 months: ~ 1 z 1 = ( z 1 + z 13 + z 25 + z 37 ) 4 ~ 1 z 2 = ( z 2 + z 14 + z 26 + z 38 ) ~ z 1 = 1 ( z 12 + z 24 + z 36 + z 4 48 )
36 5. Seasonal adjustment The sum of these seasonal indices should be 12 in this case If not, adjust by a factor The final seasonal indices are used to deflate the data as follows: y y... y y a 1 a 2 a 13 a 14 etc =. = = = y y y y / / z / / z 1 2 z z 1 2

37 Eviews seasonal adjustment

38 Eviews seasonal adjustment
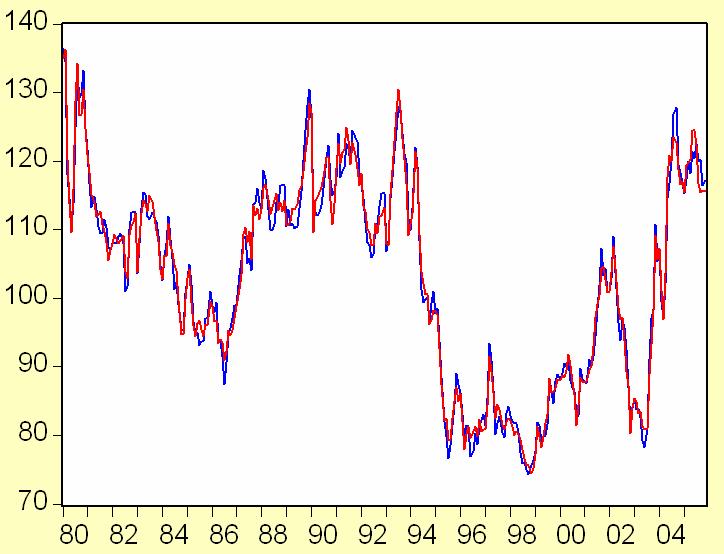
39 Importance of historical accidents IMF's International Price of Beef Index monthly, Mad Cow disease, UK US cents per pound Jan-80 Jan-82 Jan-84 Jan-86 Jan-88 Jan-90 Jan-92 Jan-94 Jan-96 Jan-98 Jan-00 Jan-02 Jan-04
.")
40 Incorporating structural breaks Mad Cow timeline: Early 1990s: The British government insists the disease poses no threat to humans 1993: 120,000 cattle have been diagnosed with Bovine Spongiform Encephalopathy BSE in Britain May 1995: Stephen Churchill, 19, becomes the first victim of a new version of Creutzfeldt-Jakob Disease (vcjd). His is one of three vcjd deaths in 1995 April 2002: First confirmed case of vcjd appears in the US, in a 22-year-old British woman living in Florida Structural break: end of 1994

41 Dummy variable before after

42 Eviews estimation cons t t 2
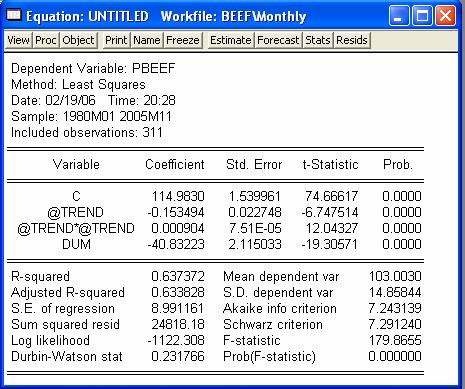
43 Eviews estimation

44 Eviews estimation graph
45 Comparison Jan-80 Jan-82 Jan-84 Jan-86 Jan-88 Jan-90 Jan-92 Jan-94 Jan-96 Jan-98 Jan-00 Jan-02 Jan-04 Jan-06 Jan-08 Jan-10 Forecast quadratic, with break Forecast quadratic, no break
Economic Forecasting Lecture 9: Smoothing Methods
 Economic Forecasting Lecture 9: Smoothing Methods Richard G. Pierse 1 Introduction Smoothing methods are rather different from the model-based methods that we have been looking at up to now in this module.
STAT 115: Introductory Methods for Time Series Analysis and Forecasting. Concepts and Techniques
 STAT 115: Introductory Methods for Time Series Analysis and Forecasting Concepts and Techniques School of Statistics University of the Philippines Diliman 1 FORECASTING Forecasting is an activity that
Time-Series Analysis. Dr. Seetha Bandara Dept. of Economics MA_ECON
 Time-Series Analysis Dr. Seetha Bandara Dept. of Economics MA_ECON Time Series Patterns A time series is a sequence of observations on a variable measured at successive points in time or over successive
Lecture 12. Functional form
 Lecture 12. Functional form Multiple linear regression model β1 + β2 2 + L+ β K K + u Interpretation of regression coefficient k Change in if k is changed by 1 unit and the other variables are held constant.
Exponential smoothing is, like the moving average forecast, a simple and often used forecasting technique
 EconS 450 Advanced Farm Management Forecasting Lecture 2 Simple Exponential Smoothing Exponential smoothing is, like the moving average forecast, a simple and often used forecasting technique Exponential
BUSI 460 Suggested Answers to Selected Review and Discussion Questions Lesson 7
 BUSI 460 Suggested Answers to Selected Review and Discussion Questions Lesson 7 1. The definitions follow: (a) Time series: Time series data, also known as a data series, consists of observations on a
Forecasting. BUS 735: Business Decision Making and Research. exercises. Assess what we have learned
 Forecasting BUS 735: Business Decision Making and Research 1 1.1 Goals and Agenda Goals and Agenda Learning Objective Learn how to identify regularities in time series data Learn popular univariate time
Lecture Prepared By: Mohammad Kamrul Arefin Lecturer, School of Business, North South University
 Lecture 15 20 Prepared By: Mohammad Kamrul Arefin Lecturer, School of Business, North South University Modeling for Time Series Forecasting Forecasting is a necessary input to planning, whether in business,
Dennis Bricker Dept of Mechanical & Industrial Engineering The University of Iowa. Forecasting demand 02/06/03 page 1 of 34
 demand -5-4 -3-2 -1 0 1 2 3 Dennis Bricker Dept of Mechanical & Industrial Engineering The University of Iowa Forecasting demand 02/06/03 page 1 of 34 Forecasting is very difficult. especially about the
DEPARTMENT OF QUANTITATIVE METHODS & INFORMATION SYSTEMS
 DEPARTMENT OF QUANTITATIVE METHODS & INFORMATION SYSTEMS Moving Averages and Smoothing Methods ECON 504 Chapter 7 Fall 2013 Dr. Mohammad Zainal 2 This chapter will describe three simple approaches to forecasting
Forecasting. Simon Shaw 2005/06 Semester II
 Forecasting Simon Shaw s.c.shaw@maths.bath.ac.uk 2005/06 Semester II 1 Introduction A critical aspect of managing any business is planning for the future. events is called forecasting. Predicting future
Forecasting. Chapter Copyright 2010 Pearson Education, Inc. Publishing as Prentice Hall
 Forecasting Chapter 15 15-1 Chapter Topics Forecasting Components Time Series Methods Forecast Accuracy Time Series Forecasting Using Excel Time Series Forecasting Using QM for Windows Regression Methods
The Art of Forecasting
 Time Series The Art of Forecasting Learning Objectives Describe what forecasting is Explain time series & its components Smooth a data series Moving average Exponential smoothing Forecast using trend models
3 Time Series Regression
 3 Time Series Regression 3.1 Modelling Trend Using Regression Random Walk 2 0 2 4 6 8 Random Walk 0 2 4 6 8 0 10 20 30 40 50 60 (a) Time 0 10 20 30 40 50 60 (b) Time Random Walk 8 6 4 2 0 Random Walk 0
Econ 300/QAC 201: Quantitative Methods in Economics/Applied Data Analysis. 17th Class 7/1/10
 Econ 300/QAC 201: Quantitative Methods in Economics/Applied Data Analysis 17th Class 7/1/10 The only function of economic forecasting is to make astrology look respectable. --John Kenneth Galbraith show
Chapter 5: Forecasting
 1 Textbook: pp. 165-202 Chapter 5: Forecasting Every day, managers make decisions without knowing what will happen in the future 2 Learning Objectives After completing this chapter, students will be able
Forecasting. Copyright 2015 Pearson Education, Inc.
 5 Forecasting To accompany Quantitative Analysis for Management, Twelfth Edition, by Render, Stair, Hanna and Hale Power Point slides created by Jeff Heyl Copyright 2015 Pearson Education, Inc. LEARNING
Chapter 8 - Forecasting
 Chapter 8 - Forecasting Operations Management by R. Dan Reid & Nada R. Sanders 4th Edition Wiley 2010 Wiley 2010 1 Learning Objectives Identify Principles of Forecasting Explain the steps in the forecasting
Lecture 4 Forecasting
 King Saud University College of Computer & Information Sciences IS 466 Decision Support Systems Lecture 4 Forecasting Dr. Mourad YKHLEF The slides content is derived and adopted from many references Outline
Cyclical Effect, and Measuring Irregular Effect
 Paper:15, Quantitative Techniques for Management Decisions Module- 37 Forecasting & Time series Analysis: Measuring- Seasonal Effect, Cyclical Effect, and Measuring Irregular Effect Principal Investigator
Autoregressive models with distributed lags (ADL)
") Autoregressive models with distributed lags (ADL) It often happens than including the lagged dependent variable in the model results in model which is better fitted and needs less parameters. It can be
Autoregressive models with distributed lags (ADL) It often happens than including the lagged dependent variable in the model results in model which is better fitted and needs less parameters. It can be
TIMES SERIES INTRODUCTION INTRODUCTION. Page 1. A time series is a set of observations made sequentially through time
 TIMES SERIES INTRODUCTION A time series is a set of observations made sequentially through time A time series is said to be continuous when observations are taken continuously through time, or discrete
Topics Covered in Math 115
 Topics Covered in Math 115 Basic Concepts Integer Exponents Use bases and exponents. Evaluate exponential expressions. Apply the product, quotient, and power rules. Polynomial Expressions Perform addition
Public Library Use and Economic Hard Times: Analysis of Recent Data
 Public Library Use and Economic Hard Times: Analysis of Recent Data A Report Prepared for The American Library Association by The Library Research Center University of Illinois at Urbana Champaign April
9) Time series econometrics
 Time series econometrics") 30C00200 Econometrics 9) Time series econometrics Timo Kuosmanen Professor Management Science http://nomepre.net/index.php/timokuosmanen 1 Macroeconomic data: GDP Inflation rate Examples of time series
30C00200 Econometrics 9) Time series econometrics Timo Kuosmanen Professor Management Science http://nomepre.net/index.php/timokuosmanen 1 Macroeconomic data: GDP Inflation rate Examples of time series
Multiplicative Winter s Smoothing Method
 Multiplicative Winter s Smoothing Method LECTURE 6 TIME SERIES FORECASTING METHOD rahmaanisa@apps.ipb.ac.id Review What is the difference between additive and multiplicative seasonal pattern in time series
Financial Time Series Analysis: Part II
 Department of Mathematics and Statistics, University of Vaasa, Finland Spring 2017 1 Unit root Deterministic trend Stochastic trend Testing for unit root ADF-test (Augmented Dickey-Fuller test) Testing
Glossary. The ISI glossary of statistical terms provides definitions in a number of different languages:
 Glossary The ISI glossary of statistical terms provides definitions in a number of different languages: http://isi.cbs.nl/glossary/index.htm Adjusted r 2 Adjusted R squared measures the proportion of the
Ch3. TRENDS. Time Series Analysis
 3.1 Deterministic Versus Stochastic Trends The simulated random walk in Exhibit 2.1 shows a upward trend. However, it is caused by a strong correlation between the series at nearby time points. The true
Time Series Analysis -- An Introduction -- AMS 586
 Time Series Analysis -- An Introduction -- AMS 586 1 Objectives of time series analysis Data description Data interpretation Modeling Control Prediction & Forecasting 2 Time-Series Data Numerical data
FORECASTING COARSE RICE PRICES IN BANGLADESH
 Progress. Agric. 22(1 & 2): 193 201, 2011 ISSN 1017-8139 FORECASTING COARSE RICE PRICES IN BANGLADESH M. F. Hassan*, M. A. Islam 1, M. F. Imam 2 and S. M. Sayem 3 Department of Agricultural Statistics,
STRUCTURAL TIME-SERIES MODELLING
 1: Structural Time-Series Modelling STRUCTURAL TIME-SERIES MODELLING Prajneshu Indian Agricultural Statistics Research Institute, New Delhi-11001 1. Introduction. ARIMA time-series methodology is widely
Based on the original slides from Levine, et. all, First Edition, Prentice Hall, Inc
 Based on the original slides from Levine, et. all, First Edition, Prentice Hall, Inc Process of predicting a future event Underlying basis of all business decisions Production Inventory Personnel Facilities
Simple Descriptive Techniques
 Simple Descriptive Techniques Outline 1 Types of variation 2 Stationary Time Series 3 The Time Plot 4 Transformations 5 Analysing Series that Contain a Trend 6 Analysing Series that Contain Seasonal Variation
Forecasting: The First Step in Demand Planning
 Forecasting: The First Step in Demand Planning Jayant Rajgopal, Ph.D., P.E. University of Pittsburgh Pittsburgh, PA 15261 In a supply chain context, forecasting is the estimation of future demand General
Contents. 9. Fractional and Quadratic Equations 2 Example Example Example
 Contents 9. Fractional and Quadratic Equations 2 Example 9.52................................ 2 Example 9.54................................ 3 Example 9.55................................ 4 1 Peterson,
Decision 411: Class 3
 Decision 411: Class 3 Discussion of HW#1 Introduction to seasonal models Seasonal decomposition Seasonal adjustment on a spreadsheet Forecasting with seasonal adjustment Forecasting inflation Poor man
Prof. Dr. Roland Füss Lecture Series in Applied Econometrics Summer Term Introduction to Time Series Analysis
 Introduction to Time Series Analysis 1 Contents: I. Basics of Time Series Analysis... 4 I.1 Stationarity... 5 I.2 Autocorrelation Function... 9 I.3 Partial Autocorrelation Function (PACF)... 14 I.4 Transformation
Decision 411: Class 3
 Decision 411: Class 3 Discussion of HW#1 Introduction to seasonal models Seasonal decomposition Seasonal adjustment on a spreadsheet Forecasting with seasonal adjustment Forecasting inflation Log transformation
MHCA Math Summer Packet 2015
 Directions: MHCA Math Summer Packet 2015 For students entering PreCalculus Honors You are to complete all the problems assigned in this packet by Friday, September 4 th. If you don t turn in your summer
Decision 411: Class 3
 Decision 411: Class 3 Discussion of HW#1 Introduction to seasonal models Seasonal decomposition Seasonal adjustment on a spreadsheet Forecasting with seasonal adjustment Forecasting inflation Poor man
Time Series and Forecasting
 Time Series and Forecasting Introduction to Forecasting n What is forecasting? n Primary Function is to Predict the Future using (time series related or other) data we have in hand n Why are we interested?
Seasonal Models and Seasonal Adjustment
 LECTURE 10 Seasonal Models and Seasonal Adjustment So far, we have relied upon the method of trigonometrical regression for building models which can be used for forecasting seasonal economic time series.
03 Time series with trend and seasonality components. Andrius Buteikis,
 03 Time series with trend and seasonality components Andrius Buteikis, andrius.buteikis@mif.vu.lt http://web.vu.lt/mif/a.buteikis/ Time series with deterministic components Up until now we assumed our
Learning Module 1 - Basic Algebra Review (Appendix A)
") Learning Module 1 - Basic Algebra Review (Appendix A) Element 1 Real Numbers and Operations on Polynomials (A.1, A.2) Use the properties of real numbers and work with subsets of the real numbers Determine
Learning Module 1 - Basic Algebra Review (Appendix A) Element 1 Real Numbers and Operations on Polynomials (A.1, A.2) Use the properties of real numbers and work with subsets of the real numbers Determine
Time Series Analysis of Stock Prices Using the Box- Jenkins Approach
 Georgia Southern University Digital Commons@Georgia Southern Electronic Theses & Dissertations Jack N. Averitt College of Graduate Studies (COGS) Time Series Analysis of Stock Prices Using the Box- Jenkins
Graphing Equations Chapter Test
 1. Which line on the graph has a slope of 2/3? Graphing Equations Chapter Test A. Line A B. Line B C. Line C D. Line D 2. Which equation is represented on the graph? A. y = 4x 6 B. y = -4x 6 C. y = 4x
Math Exam Jam Solutions. Contents. 1 Linear Inequalities and Absolute Value Equations 2
 Math 11100 Exam Jam Solutions Contents 1 Linear Inequalities and Absolute Value Equations 2 2 Linear Equations, Graphing and Solving Systems of Equations 4 3 Polynomials and Rational Expressions 13 4 Radical
Time Series and Forecasting
 Time Series and Forecasting Introduction to Forecasting n What is forecasting? n Primary Function is to Predict the Future using (time series related or other) data we have in hand n Why are we interested?
Lecture 2. Business Cycle Measurement. Randall Romero Aguilar, PhD II Semestre 2017 Last updated: August 18, 2017
 Lecture 2 Business Cycle Measurement Randall Romero Aguilar, PhD II Semestre 2017 Last updated: August 18, 2017 Universidad de Costa Rica EC3201 - Teoría Macroeconómica 2 Table of contents 1. Introduction
APPLICATIONS OF MATHEMATICAL METHODS IN THE SUPERVISION OF THE TECHNICAL SAFETY OF WATER CONSTRUCTIONS
 2010/1 PAGES 22 28 RECEIVED 22. 9. 2009 ACCEPTED 7. 1. 2010 J. HAKÁČ, E. BEDNÁROVÁ APPLICATIONS OF MATHEMATICAL METHODS IN THE SUPERVISION OF THE TECHNICAL SAFETY OF WATER CONSTRUCTIONS ABSTRACT Ján Hakáč
Exponential and Logarithmic Functions. Copyright Cengage Learning. All rights reserved.
 3 Exponential and Logarithmic Functions Copyright Cengage Learning. All rights reserved. 3.1 Exponential Functions and Their Graphs Copyright Cengage Learning. All rights reserved. What You Should Learn
Question 1. Find the coordinates of the y-intercept for. f) None of the above. Question 2. Find the slope of the line:
 None of the above. Question 2. Find the slope of the line:") of 4 4/4/017 8:44 AM Question 1 Find the coordinates of the y-intercept for. Question Find the slope of the line: of 4 4/4/017 8:44 AM Question 3 Solve the following equation for x : Question 4 Paul has
of 4 4/4/017 8:44 AM Question 1 Find the coordinates of the y-intercept for. Question Find the slope of the line: of 4 4/4/017 8:44 AM Question 3 Solve the following equation for x : Question 4 Paul has
Modelling trends in the ocean wave climate for dimensioning of ships
 Modelling trends in the ocean wave climate for dimensioning of ships STK1100 lecture, University of Oslo Erik Vanem Motivation and background 2 Ocean waves and maritime safety Ships and other marine structures
FinQuiz Notes
 Reading 9 A time series is any series of data that varies over time e.g. the quarterly sales for a company during the past five years or daily returns of a security. When assumptions of the regression
Forecasting Major Vegetable Crops Productions in Tunisia
 International Journal of Research in Business Studies and Management Volume 2, Issue 6, June 2015, PP 15-19 ISSN 2394-5923 (Print) & ISSN 2394-5931 (Online) Forecasting Major Vegetable Crops Productions
Spiral Review Probability, Enter Your Grade Online Quiz - Probability Pascal's Triangle, Enter Your Grade
 Course Description This course includes an in-depth analysis of algebraic problem solving preparing for College Level Algebra. Topics include: Equations and Inequalities, Linear Relations and Functions,
Applied Time Series Topics
 Applied Time Series Topics Ivan Medovikov Brock University April 16, 2013 Ivan Medovikov, Brock University Applied Time Series Topics 1/34 Overview 1. Non-stationary data and consequences 2. Trends and
Some Time-Series Models
 Some Time-Series Models Outline 1. Stochastic processes and their properties 2. Stationary processes 3. Some properties of the autocorrelation function 4. Some useful models Purely random processes, random
Revised: 2/19/09 Unit 1 Pre-Algebra Concepts and Operations Review
 2/19/09 Unit 1 Pre-Algebra Concepts and Operations Review 1. How do algebraic concepts represent real-life situations? 2. Why are algebraic expressions and equations useful? 2. Operations on rational numbers
Lecture Prepared By: Mohammad Kamrul Arefin Lecturer, School of Business, North South University
 Lecture 15 20 Prepared By: Mohammad Kamrul Arefin Lecturer, School of Business, North South University Modeling for Time Series Forecasting Forecasting is a necessary input to planning, whether in business,
Lecture 6: Sections 2.2 and 2.3 Polynomial Functions, Quadratic Models
 L6-1 Lecture 6: Sections 2.2 and 2.3 Polynomial Functions, Quadratic Models Polynomial Functions Def. A polynomial function of degree n is a function of the form f(x) = a n x n + a n 1 x n 1 +... + a 1
INTRODUCTION TO FORECASTING (PART 2) AMAT 167
 AMAT 167") INTRODUCTION TO FORECASTING (PART 2) AMAT 167 Techniques for Trend EXAMPLE OF TRENDS In our discussion, we will focus on linear trend but here are examples of nonlinear trends: EXAMPLE OF TRENDS If you
INTRODUCTION TO FORECASTING (PART 2) AMAT 167 Techniques for Trend EXAMPLE OF TRENDS In our discussion, we will focus on linear trend but here are examples of nonlinear trends: EXAMPLE OF TRENDS If you
( ) ( ) x. The exponential function f(x) with base b is denoted by x
 ( ) x. The exponential function f(x) with base b is denoted by x") Page of 7 Eponential and Logarithmic Functions Eponential Functions and Their Graphs: Section Objectives: Students will know how to recognize, graph, and evaluate eponential functions. The eponential function
Page of 7 Eponential and Logarithmic Functions Eponential Functions and Their Graphs: Section Objectives: Students will know how to recognize, graph, and evaluate eponential functions. The eponential function
Pacing Guide Algebra 1
 Pacing Guide Algebra Chapter : Equations and Inequalities (one variable) Section Section Title Learning Target(s) I can. Evaluate and Simplify Algebraic Expressions. Evaluate and simplify numeric and algebraic
Threshold Autoregressions and NonLinear Autoregressions
 Threshold Autoregressions and NonLinear Autoregressions Original Presentation: Central Bank of Chile October 29-31, 2013 Bruce Hansen (University of Wisconsin) Threshold Regression 1 / 47 Threshold Models
How do we analyze, evaluate, solve, and graph quadratic functions?
 Topic: 4. Quadratic Functions and Factoring Days: 18 Key Learning: Students will be able to analyze, evaluate, solve and graph quadratic functions. Unit Essential Question(s): How do we analyze, evaluate,
EXPONENTIAL, LOGARITHMIC, AND TRIGONOMETRIC FUNCTIONS
 Calculus for the Life Sciences nd Edition Greenwell SOLUTIONS MANUAL Full download at: https://testbankreal.com/download/calculus-for-the-life-sciences-nd-editiongreenwell-solutions-manual-/ Calculus for
Midterm 2 - Solutions
 Ecn 102 - Analysis of Economic Data University of California - Davis February 24, 2010 Instructor: John Parman Midterm 2 - Solutions You have until 10:20am to complete this exam. Please remember to put
EPPING HIGH SCHOOL ALGEBRA 2 Concepts COURSE SYLLABUS
 Course Title: Algebra 2 Concepts Course Description Algebra 2 Concepts is designed for students who wish to take an Algebra 2 course at a non college prep level. The class will begin with a review of Algebra
MATHEMATICS CONTENT ASSESSED ON THE ALGEBRA 1 EOC ASSESSMENT AND ITEM TYPES BY BENCHMARK
 Body of Knowledge Algebra Standard 1 Real and Complex Number System Expand and deepen understanding of real and complex numbers by comparing expressions and performing arithmetic computations, especially
YEAR 10 GENERAL MATHEMATICS 2017 STRAND: BIVARIATE DATA PART II CHAPTER 12 RESIDUAL ANALYSIS, LINEARITY AND TIME SERIES
 YEAR 10 GENERAL MATHEMATICS 2017 STRAND: BIVARIATE DATA PART II CHAPTER 12 RESIDUAL ANALYSIS, LINEARITY AND TIME SERIES This topic includes: Transformation of data to linearity to establish relationships
THE ROYAL STATISTICAL SOCIETY 2009 EXAMINATIONS SOLUTIONS GRADUATE DIPLOMA MODULAR FORMAT MODULE 3 STOCHASTIC PROCESSES AND TIME SERIES
 THE ROYAL STATISTICAL SOCIETY 9 EXAMINATIONS SOLUTIONS GRADUATE DIPLOMA MODULAR FORMAT MODULE 3 STOCHASTIC PROCESSES AND TIME SERIES The Society provides these solutions to assist candidates preparing
Question 1 [17 points]: (ch 11)
![Question 1 [17 points]: (ch 11)](/thumbs/95/123686850.jpg "Question 1 [17 points]: (ch 11)") Question 1 [17 points]: (ch 11) A study analyzed the probability that Major League Baseball (MLB) players "survive" for another season, or, in other words, play one more season. They studied a model of
Question 1 [17 points]: (ch 11) A study analyzed the probability that Major League Baseball (MLB) players "survive" for another season, or, in other words, play one more season. They studied a model of
Sec. 4.2 Logarithmic Functions
 Sec. 4.2 Logarithmic Functions The Logarithmic Function with Base a has domain all positive real numbers and is defined by Where and is the inverse function of So and Logarithms are inverses of Exponential
CDS M Phil Econometrics
 CDS M Phil Econometrics an Pillai N 21/10/2009 1 CDS M Phil Econometrics Functional Forms and Growth Rates 2 CDS M Phil Econometrics 1 Beta Coefficients standardized coefficient or beta coefficient Idea
Week 5 Quantitative Analysis of Financial Markets Modeling and Forecasting Trend
 Week 5 Quantitative Analysis of Financial Markets Modeling and Forecasting Trend Christopher Ting http://www.mysmu.edu/faculty/christophert/ Christopher Ting : christopherting@smu.edu.sg : 6828 0364 :
Econometric Forecasting Overview
 Econometric Forecasting Overview April 30, 2014 Econometric Forecasting Econometric models attempt to quantify the relationship between the parameter of interest (dependent variable) and a number of factors
Time Series Analysis. Smoothing Time Series. 2) assessment of/accounting for seasonality. 3) assessment of/exploiting "serial correlation"
 assessment of/accounting for seasonality. 3) assessment of/exploiting serial correlation") Time Series Analysis 2) assessment of/accounting for seasonality This (not surprisingly) concerns the analysis of data collected over time... weekly values, monthly values, quarterly values, yearly values,
Time Series Analysis 2) assessment of/accounting for seasonality This (not surprisingly) concerns the analysis of data collected over time... weekly values, monthly values, quarterly values, yearly values,
Chapter 9: Forecasting
 Chapter 9: Forecasting One of the critical goals of time series analysis is to forecast (predict) the values of the time series at times in the future. When forecasting, we ideally should evaluate the
Modeling and Forecasting Currency in Circulation in Sri Lanka
 Modeling and Forecasting Currency in Circulation in Sri Lanka Rupa Dheerasinghe 1 Abstract Currency in circulation is typically estimated either by specifying a currency demand equation based on the theory
The linear regression model: functional form and structural breaks
 The linear regression model: functional form and structural breaks Ragnar Nymoen Department of Economics, UiO 16 January 2009 Overview Dynamic models A little bit more about dynamics Extending inference
14. Time- Series data visualization. Prof. Tulasi Prasad Sariki SCSE, VIT, Chennai
 14. Time- Series data visualization Prof. Tulasi Prasad Sariki SCSE, VIT, Chennai www.learnersdesk.weebly.com Overview What is forecasting Time series & its components Smooth a data series Moving average
Miller Objectives Alignment Math
 Miller Objectives Alignment Math 1050 1 College Algebra Course Objectives Spring Semester 2016 1. Use algebraic methods to solve a variety of problems involving exponential, logarithmic, polynomial, and
Algebra I. Course Outline
 Algebra I Course Outline I. The Language of Algebra A. Variables and Expressions B. Order of Operations C. Open Sentences D. Identity and Equality Properties E. The Distributive Property F. Commutative
Francis X. Diebold, Elements of Forecasting, 4th Edition
 P1.T2. Quantitative Analysis Francis X. Diebold, Elements of Forecasting, 4th Edition Bionic Turtle FRM Study Notes By David Harper, CFA FRM CIPM www.bionicturtle.com Diebold, Chapter 5 Modeling and Forecasting
7. Forecasting with ARIMA models
 7. Forecasting with ARIMA models 309 Outline: Introduction The prediction equation of an ARIMA model Interpreting the predictions Variance of the predictions Forecast updating Measuring predictability
Regression and Nonlinear Axes
 Introduction to Chemical Engineering Calculations Lecture 2. What is regression analysis? A technique for modeling and analyzing the relationship between 2 or more variables. Usually, 1 variable is designated
Lesson 2: Analysis of time series
 Lesson 2: Analysis of time series Time series Main aims of time series analysis choosing right model statistical testing forecast driving and optimalisation Problems in analysis of time series time problems
Forecasting Unemployment Rates in the UK and EU
 Forecasting Unemployment Rates in the UK and EU Team B9 Rajesh Manivannan (61710602) Kartick B Muthiah (61710764) Debayan Das (61710492) Devesh Kumar (61710353) Chirag Bhardwaj (61710812) Sreeharsha Konga
SCIENCE & TECHNOLOGY
 Pertanika J. Sci. & Technol. 5 (3): 787-796 (017) SCIENCE & TECHNOLOGY Journal homepage: http://www.pertanika.upm.edu.my/ Combination of Forecasts with an Application to Unemployment Rate Muniroh, M. F.
Modelling and Forecasting Australian Domestic Tourism
 Modelling and Forecasting Australian Domestic Tourism George Athanasopoulos & Rob Hyndman Outline Background 1 Background 2 Data 3 Regression models 4 Exponential smoothing via innovations state space
Product and Inventory Management (35E00300) Forecasting Models Trend analysis
 Forecasting Models Trend analysis") Product and Inventory Management (35E00300) Forecasting Models Trend analysis Exponential Smoothing Data Storage Shed Sales Period Actual Value(Y t ) Ŷ t-1 α Y t-1 Ŷ t-1 Ŷ t January 10 = 10 0.1 February
Product and Inventory Management (35E00300) Forecasting Models Trend analysis Exponential Smoothing Data Storage Shed Sales Period Actual Value(Y t ) Ŷ t-1 α Y t-1 Ŷ t-1 Ŷ t January 10 = 10 0.1 February
Identifying Causal Effects in Time Series Models
 Identifying Causal Effects in Time Series Models Aaron Smith UC Davis October 20, 2015 Slides available at http://asmith.ucdavis.edu 1 Identifying Causal Effects in Time Series Models If all the Metrics
Math 137 Exam #3 Review Guide
 Math 7 Exam # Review Guide The third exam will cover Sections.-.6, 4.-4.7. The problems on this review guide are representative of the type of problems worked on homework and during class time. Do not
Forecasting with ARMA Models
 LECTURE 4 Forecasting with ARMA Models Minumum Mean-Square Error Prediction Imagine that y(t) is a stationary stochastic process with E{y(t)} = 0. We may be interested in predicting values of this process
EPPING HIGH SCHOOL ALGEBRA 2 COURSE SYLLABUS
 Course Title: Algebra 2 Course Description This course is designed to be the third year of high school mathematics. The material covered is roughly equivalent to that covered in the first Algebra course
CURRICULUM CATALOG. Algebra II (3135) VA
 VA") 2018-19 CURRICULUM CATALOG Algebra II (3135) VA Table of Contents COURSE OVERVIEW... 1 UNIT 1: STRUCTURE AND FUNCTIONS... 1 UNIT 2: LINEAR FUNCTIONS... 2 UNIT 3: INEQUALITIES AND ABSOLUTE VALUE... 2 UNIT
2018-19 CURRICULUM CATALOG Algebra II (3135) VA Table of Contents COURSE OVERVIEW... 1 UNIT 1: STRUCTURE AND FUNCTIONS... 1 UNIT 2: LINEAR FUNCTIONS... 2 UNIT 3: INEQUALITIES AND ABSOLUTE VALUE... 2 UNIT
Part I State space models
 Part I State space models 1 Introduction to state space time series analysis James Durbin Department of Statistics, London School of Economics and Political Science Abstract The paper presents a broad
Outline. The binary choice model. The multinomial choice model. Extensions of the basic choice model
 Outline The binary choice model Illustration Specification of the binary choice model Interpreting the results of binary choice models ME output The multinomial choice model Illustration Specification