Lecture Prepared By: Mohammad Kamrul Arefin Lecturer, School of Business, North South University
|
|
|
- Leslie Hutchinson
- 5 years ago
- Views:
Transcription


1 Lecture Prepared By: Mohammad Kamrul Arefin Lecturer, School of Business, North South University
2 Modeling for Time Series Forecasting Forecasting is a necessary input to planning, whether in business, or government. Often, forecasts are generated subjectively and at great cost by group discussion, even when relatively simple quantitative methods can perform just as well or, at very least; provide an informed input to such discussions. Statistical Forecasting: The selection and implementation of the proper forecast methodology has always been an important planning and control issue for most firms and agencies. Often, the financial well-being of the entire operation rely on the accuracy of the forecast since such information will likely be used to make interrelated budgetary and operative decisions in areas of personnel management, purchasing, marketing and advertising, capital financing, etc. 2
3 Modeling for Time Series Forecasting For example, any significant over-or-under sales forecast error may cause the firm to be overly burdened with excess inventory carrying costs or else create lost sales revenue through unanticipated item shortages. When demand is fairly stable, e.g., unchanging or else growing or declining at a known constant rate, making an accurate forecast is less difficult. If, on the other hand, the firm has historically experienced an up-and-down sales pattern, then the complexity of the forecasting task is compounded. There are two main approaches to forecasting. Either the estimate of future value is based on an analysis of factors which are believed to influence future values, i.e., the explanatory method, or else the prediction is based on an inferred study of past general data behaviour over time, i.e., the extrapolation method. 3
4 Modeling for Time Series Forecasting For example, the belief that the sale of doll clothing will increase from current levels because of a recent advertising blitz rather than proximity to Christmas illustrates the difference between the two philosophies. It is possible that both approaches will lead to the creation of accurate and useful forecasts, but it must be remembered that, even for a modest degree of desired accuracy, the former method is often more difficult to implement and validate than the latter approach. 4
5 Forecasting Performance Measures If the forecast error is stable, then the distribution of it is approximately normal. With this in mind, we can plot and then analyze forecast errors on the control charts to see if there might be a need to revise the forecasting method being used. To do this, if we divide a normal distribution into zones, with each zone one standard deviation wide, then one obtains the approximate percentage we expect to find in each zone from a stable process. Control limits could be one-standard-error, or two-standard-error, and any point beyond these limits (i.e., outside of the error control limit) is an indication the need to revise the forecasting process. The plotted forecast errors on this chart, not only should remain with the control limits, they should not show any obvious pattern, collectively. We define the best forecast as the one which yields the forecast error with the minimum variance. 5
6 Forecasting Performance Measures and Control Chart for Examine Forecasting Errors 6
7 Regression Analysis Forecasting Methods Trend Analysis: Uses linear and nonlinear regression with time as the explanatory variable, it is used where pattern over time have a long-term trend. Modeling Seasonality and Trend: Seasonality is a pattern that repeats for each period. For example annual seasonal pattern has a cycle that is 12 periods long, if the periods are months, or 4 periods long if the periods are quarters. We need to get an estimate of the seasonal index for each month, or other periods, such as quarter, week, etc, depending on the data availability. 7
8 Forecasting Methods Modeling Seasonality and Trend: Seasonal Index: Seasonal index represents the extent of seasonal influence for a particular segment of the year. The calculation involves a comparison of the expected values of that period to the grand mean. A seasonal index is how much the average for that particular period tends to be above (or below) the grand average. A seasonal index of 1.00 for a particular month indicates that the expected value of that month is 1/12 of the overall average. The formula for computing seasonal factors is: S i = D i /D, where: S i = the seasonal index for ith period, D i = the average values of ith period, D = grand average, i = the ith seasonal period of the cycle. 8
9 Trend + Seasonal Forecasting Method Incorporating seasonality in a forecast is useful when the time series has both trend and seasonal components. The final step in the forecast is to use the seasonal index to adjust the trend projection. One simple way to forecast using a seasonal adjustment is to use a seasonal factor in combination with an appropriate underlying trend of total value of cycles. A Numerical Application: The table on next page provides monthly sales ($1000) at a college bookstore. The sales show a seasonal pattern, with the greatest number when the college is in session and decrease during the summer months. 9
10 M T Trend + Seasonal Forecasting Method Jan Feb Mar Apr May Jun Jul Aug Sep Oct Nov Dec Total Mean: Index: Suppose we wish to calculate seasonal factors and a trend, then calculate the forecasted sales for July in year 5. The first step in the seasonal forecast will be to compute monthly indices using the past four-year sales. For example, for January the index is: S(Jan) = D(Jan)/D = 208.6/ = 1.14 where D(Jan) is the mean of all four January months, and D is the grand mean of all past four-year sales. 10
11 Trend + Seasonal Forecasting Method Next, a linear trend is calculated using the annual sales: Y = T, The main question is whether this equation represents the trend. If we construct a scatter-diagram, we may notice that a Parabola might be a better fit. Using the Polynomial Regression, the estimated quadratic trend is: Y = T + 97T 2 Predicted values using both the linear and the quadratic trends are presented in the table in the next page. Comparing the predicted values of the two models with the actual data indicates that the quadratic trend is a much superior fit than the linear one, as often expected. 11
12 Trend + Seasonal Forecasting Method Determination of the Annual Trend for the Numerical Example Year No: Actual Sales Linear Regression Quadratic Regression We can now forecast the next annual sales; which, corresponds to year 5, or T = 5 in the above quadratic equation: Y = (5) + 97(5)2 = 3171 sales for the following year. The average monthly sales during next year is, therefore: 3171/12 = Finally, the forecast for month of July is calculated by multiplying the average monthly sales forecast by the July seasonal index, which is 0.79; i.e., (264.25).(0.79) or
13 Techniques for Averaging Moving average Weighted moving average Exponential smoothing
14 Simple Moving Average Formula The simple moving average model assumes an average is a good estimator of future behavior. The formula for the simple moving average is: F= A t-1 + A t-2 + A t A t-n t n F t = Forecast for the coming period N = Number of periods to be averaged A t-1 = Actual occurrence in the past period for up to n periods
15 Simple Moving Average Problem (1) Week Demand F= A + A + A +...+A t n t-1 t-2 t-3 t-n Question: What are the 3 week and 6 week moving average forecasts for demand? Assume you only have 3 weeks and 6 weeks of actual demand data for the respective forecasts
16 Calculating the moving averages gives us: Week Demand 3-Week 6-Week = F 4 =( )/ F 7 =( )/6 = The McGraw-Hill Companies, Inc., 2001
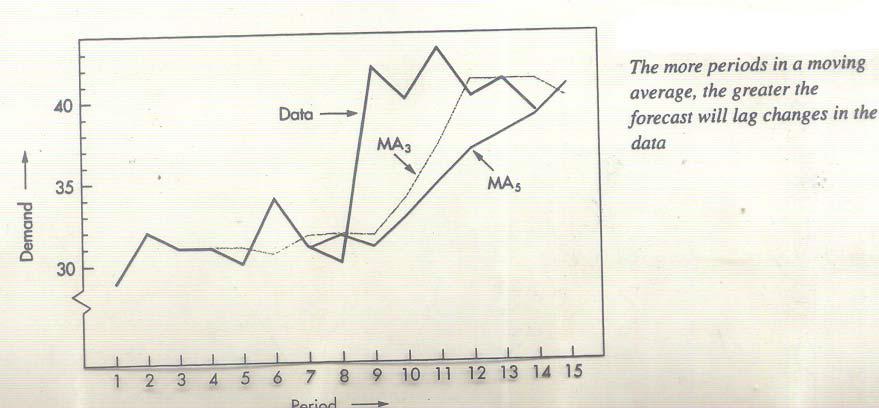
17 Plotting the moving averages and comparing them shows how the lines smooth out to reveal the overall upward trend in this example Demand Week Demand 3-Week 6-Week
18 Simple Moving Average Problem (2) Data Week Demand Question: What is the 3 week moving average forecast for this data? Assume you only have 3 weeks and 5 weeks of actual demand data for the respective forecasts
19 Simple Moving Average Problem (2) Solution Week Demand 3-Week 5-Week
20 Simple Moving Average Figure Actual MA5 MA3 MA n = n i = 1 n A i
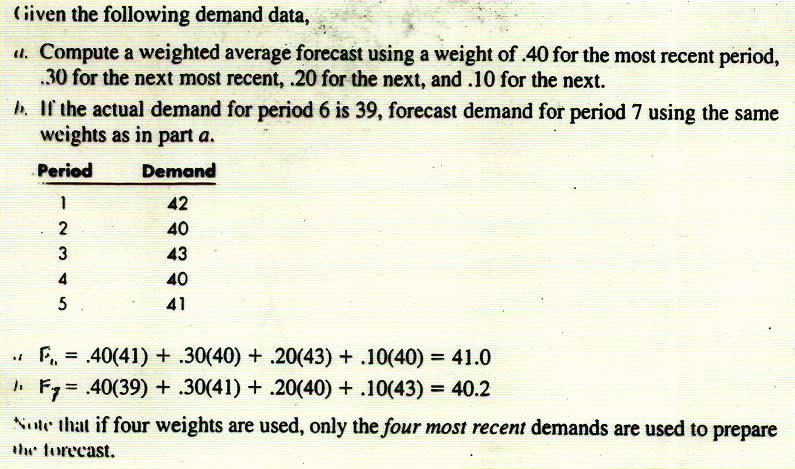
21 Weighted Moving Average Formula While the moving average formula implies an equal weight being placed on each value that is being averaged, the weighted moving average permits an unequal weighting on prior time periods. The formula for the moving average is: F = w A + w A + w A +...+w A t 1 t-1 2 t-2 3 t-3 n t-n w t = weight given to time period t occurrence. (Weights must add to one.) n i=1 w =1 i
22 Weighted Moving Average Problem (1) Data Question: Given the weekly demand and weights, what is the forecast for the 4 th period or Week 4? Week Demand Weights: t-1.5 t-2.3 t-3.2 Note that the weights place more emphasis on the most recent data, that is time period t-1.
23 Weighted Moving Average Problem (1) Solution Week Demand Forecast F 4 = 0.5(720)+0.3(678)+0.2(650)=693.4
24 Compute a three period moving average forecast given demand for shopping carts for the last five periods
25
26 Weighted Moving Average Problem (2) Data Question: Given the weekly demand information and weights, what is the weighted moving average forecast of the 5 th period or week? Week Demand Weights: t-1.7 t-2.2 t-3.1
27 Weighted Moving Average Problem (2) Solution Week Demand Forecast F 5 = (0.1)(755)+(0.2)(680)+(0.7)(655)= 672
28 Exponential Smoothing F t = F t-1 + (A t-1 -F t-1 ) n Premise The most recent observations might have the highest predictive value. Therefore, we should give more weight to the more recent time periods when forecasting.
29 Example of Exponential Smoothing Period Actual Alpha = 0.1 Error Alpha = 0.4 Error
30 Picking a Smoothing Constant Demand Period Actual.1. 4
31 Exponential Smoothing Model F t = F t-1 + (A t-1 -F t-1 ) = smoothing constant Premise: The most recent observations might have the highest predictive value. Therefore, we should give more weight to the more recent time periods when forecasting.
32 Exponential Smoothing Problem (1) Data Week Demand Question: Given the weekly demand data, what are the exponential smoothing forecasts for periods 2 10 using =0.10 and =0.60? Assume F 1 =D 1
33 Answer: The respective alphas columns denote the forecast values. Note that you can only forecast one time period into the future. Week Demand
34 Exponential Smoothing Problem (1) Plotting Note how that the smaller alpha the smoother the line in this example. Demand Week Demand
35 Exponential Smoothing Problem (2) Data Week Demand Question: What are the exponential smoothing forecasts for periods 2-5 using a =0.5? Assume F 1 =D 1
36 Exponential Smoothing Problem (2) Solution F 1 =820+(0.5)( )=820 F 3 =820+(0.5)( )= Week Demand
37
38 Associative Forecasting Predictor variables used to predict values of variable interest Regression technique for fitting a line to a set of points Least squares line minimizes sum of squared deviations around the line
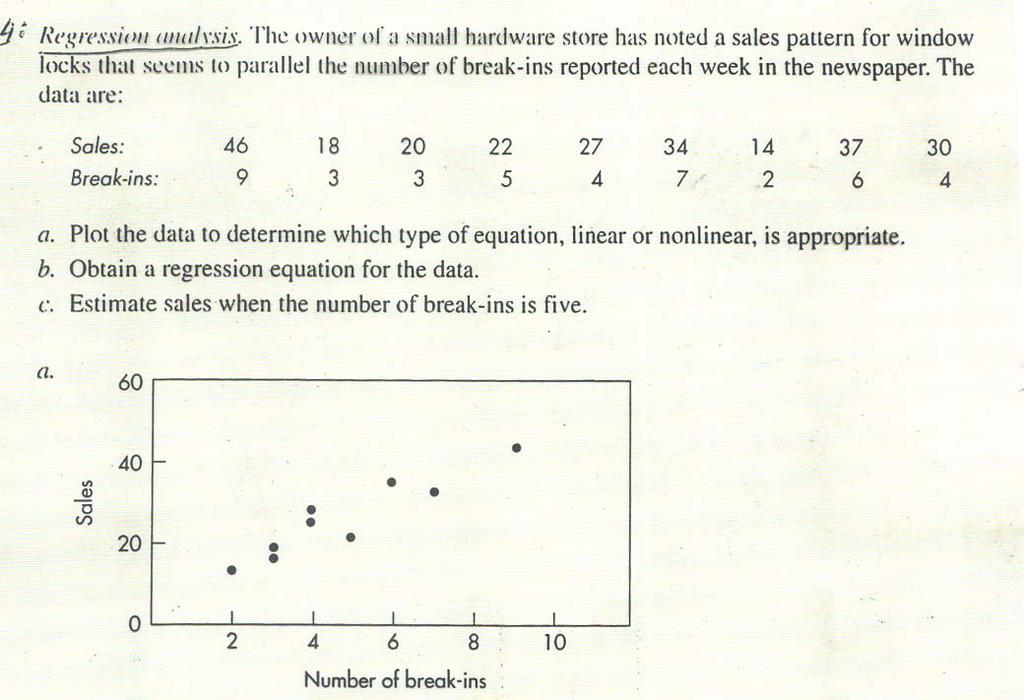
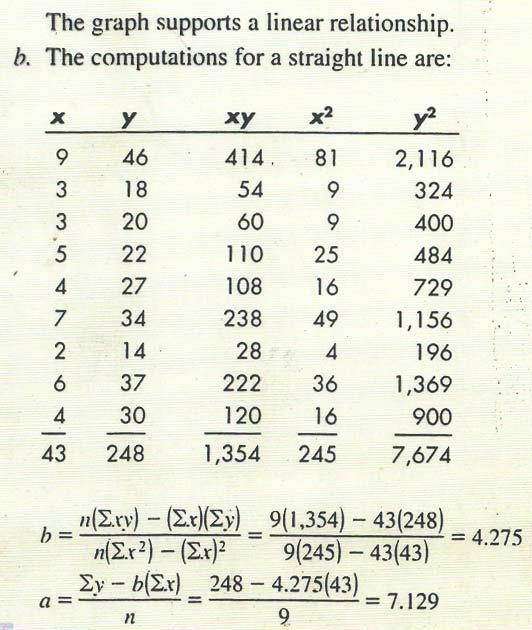
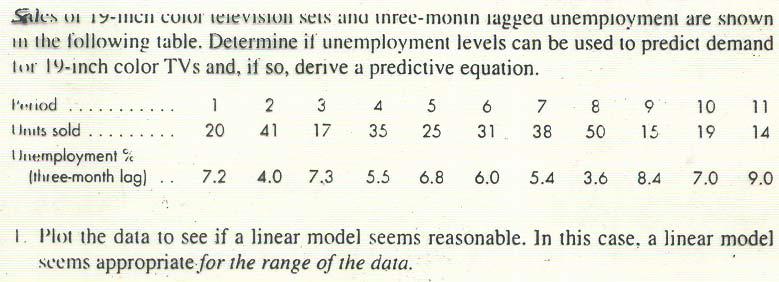
39 Simple Linear Regression Model The simple linear regression model seeks to fit a line through various data over time. Y a x (Time) Y t = a + bx Is the linear regression model. Yt is the regressed forecast value or dependent variable in the model, a is the intercept value of the the regression line, and b is similar to the slope of the regression line. However, since it is calculated with the variability of the data in mind, its formulation is not as straight forward as our usual notion of slope.
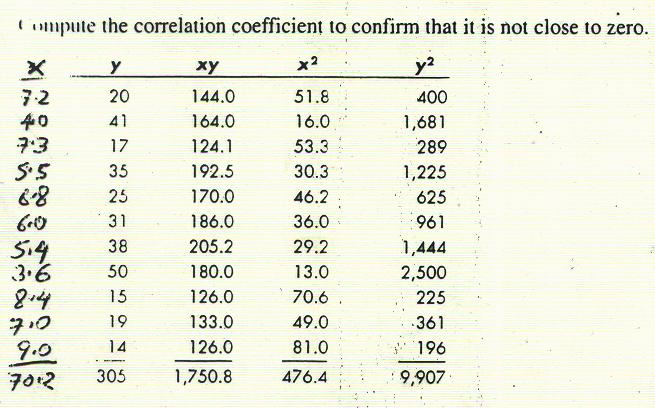
40 Formulas for Calculating a and b a=y-bx b= xy- n(y)(x) 2 2 x -n(x)
41 Reasonable X Y Computed relationship

42
43
44
45
46
47 Common Nonlinear Trends Figure 3-5 Parabolic Exponential Growth
48 Linear Trend Equation Y Y t = a + bt t b is similar to the slope. However, since it is calculated with the variability of the data in mind, its formulation is not as straight-forward as our usual notion of slope.
49 Calculating a and b b = n (ty) - t y n t 2 -( t) 2 a = y - b n t
50 Linear Trend Problem Data Question: Given the data below, what is the linear trend model that can be used to predict sales? Week Sales
51 Linear Trend Equation Example t y Week t 2 Sales ty t = 15 t 2 = 55 y = 812 ty = 2499 ( t) 2 = 225
52 Linear Trend Calculation b = 5 (2499) - 15(812) 5(55) = =6.3 a= (15) 5 = y = t
53 The resulting regression model is: Y t = t 53 Now if we plot the regression generated forecasts against the actual sales we obtain the following chart: Sales Period Sales Forecast The McGraw-Hill Companies, Inc., 2001
54
55
56
57
58 Trend Adjusted Exponential Smoothing Method Or Double Exponential Smoothing Method The trend-adjusted forecast (TAF) is composed of two elements: Exponential smoothed forecast and a trend factor. TAF t+1 = S t+1 + T t+1, Where, S t+1 = Exponential Smoothed Forecast T t+1 = Trend Factor and S t+1 = TAF t + α(a t -TAF t ) T t+1 = T t + β(taf t TAF t-1 T t ) Where α and β are smoothing constants. In order to use this method, one must select values of α and β (usually through trial and error) and make a starting forecast and estimate of trend. 58
59 Initial Trend Estimate = ( )/3 = 9.33 Starting Forecast = = Find trend-adjusted exp. smoothing to prepare forecast from period 5 using α = 0.4 and β = 0.3 Wk Unit Sales St Tt TAFt St+1 Tt ( )= ( )= ( )= (0)= ( )= ( )=
Lecture Prepared By: Mohammad Kamrul Arefin Lecturer, School of Business, North South University
 Lecture 15 20 Prepared By: Mohammad Kamrul Arefin Lecturer, School of Business, North South University Modeling for Time Series Forecasting Forecasting is a necessary input to planning, whether in business,
Introduction to Forecasting
 Introduction to Forecasting Introduction to Forecasting Predicting the future Not an exact science but instead consists of a set of statistical tools and techniques that are supported by human judgment
Operations Management
 3-1 Forecasting Operations Management William J. Stevenson 8 th edition 3-2 Forecasting CHAPTER 3 Forecasting McGraw-Hill/Irwin Operations Management, Eighth Edition, by William J. Stevenson Copyright
Time series and Forecasting
 Chapter 2 Time series and Forecasting 2.1 Introduction Data are frequently recorded at regular time intervals, for instance, daily stock market indices, the monthly rate of inflation or annual profit figures.
Chapter 8 - Forecasting
 Chapter 8 - Forecasting Operations Management by R. Dan Reid & Nada R. Sanders 4th Edition Wiley 2010 Wiley 2010 1 Learning Objectives Identify Principles of Forecasting Explain the steps in the forecasting
PPU411 Antti Salonen. Forecasting. Forecasting PPU Forecasts are critical inputs to business plans, annual plans, and budgets
 - 2017 1 Forecasting Forecasts are critical inputs to business plans, annual plans, and budgets Finance, human resources, marketing, operations, and supply chain managers need forecasts to plan: output
Operations Management
 Operations Management Chapter 4 Forecasting PowerPoint presentation to accompany Heizer/Render Principles of Operations Management, 7e Operations Management, 9e 2008 Prentice Hall, Inc. 4 1 Outline Global
Antti Salonen PPU Le 2: Forecasting 1
 - 2017 1 Forecasting Forecasts are critical inputs to business plans, annual plans, and budgets Finance, human resources, marketing, operations, and supply chain managers need forecasts to plan: output
Antti Salonen KPP Le 3: Forecasting KPP227
 - 2015 1 Forecasting Forecasts are critical inputs to business plans, annual plans, and budgets Finance, human resources, marketing, operations, and supply chain managers need forecasts to plan: output
BUSI 460 Suggested Answers to Selected Review and Discussion Questions Lesson 7
 BUSI 460 Suggested Answers to Selected Review and Discussion Questions Lesson 7 1. The definitions follow: (a) Time series: Time series data, also known as a data series, consists of observations on a
Forecasting. Dr. Richard Jerz rjerz.com
 Forecasting Dr. Richard Jerz 1 1 Learning Objectives Describe why forecasts are used and list the elements of a good forecast. Outline the steps in the forecasting process. Describe at least three qualitative
Forecasting. Chapter Copyright 2010 Pearson Education, Inc. Publishing as Prentice Hall
 Forecasting Chapter 15 15-1 Chapter Topics Forecasting Components Time Series Methods Forecast Accuracy Time Series Forecasting Using Excel Time Series Forecasting Using QM for Windows Regression Methods
GAMINGRE 8/1/ of 7
 FYE 09/30/92 JULY 92 0.00 254,550.00 0.00 0 0 0 0 0 0 0 0 0 254,550.00 0.00 0.00 0.00 0.00 254,550.00 AUG 10,616,710.31 5,299.95 845,656.83 84,565.68 61,084.86 23,480.82 339,734.73 135,893.89 67,946.95
YEAR 10 GENERAL MATHEMATICS 2017 STRAND: BIVARIATE DATA PART II CHAPTER 12 RESIDUAL ANALYSIS, LINEARITY AND TIME SERIES
 YEAR 10 GENERAL MATHEMATICS 2017 STRAND: BIVARIATE DATA PART II CHAPTER 12 RESIDUAL ANALYSIS, LINEARITY AND TIME SERIES This topic includes: Transformation of data to linearity to establish relationships
INTRODUCTION TO FORECASTING (PART 2) AMAT 167
 AMAT 167") INTRODUCTION TO FORECASTING (PART 2) AMAT 167 Techniques for Trend EXAMPLE OF TRENDS In our discussion, we will focus on linear trend but here are examples of nonlinear trends: EXAMPLE OF TRENDS If you
INTRODUCTION TO FORECASTING (PART 2) AMAT 167 Techniques for Trend EXAMPLE OF TRENDS In our discussion, we will focus on linear trend but here are examples of nonlinear trends: EXAMPLE OF TRENDS If you
Determine the trend for time series data
 Extra Online Questions Determine the trend for time series data Covers AS 90641 (Statistics and Modelling 3.1) Scholarship Statistics and Modelling Chapter 1 Essent ial exam notes Time series 1. The value
Forecasting. Copyright 2015 Pearson Education, Inc.
 5 Forecasting To accompany Quantitative Analysis for Management, Twelfth Edition, by Render, Stair, Hanna and Hale Power Point slides created by Jeff Heyl Copyright 2015 Pearson Education, Inc. LEARNING
Decision 411: Class 3
 Decision 411: Class 3 Discussion of HW#1 Introduction to seasonal models Seasonal decomposition Seasonal adjustment on a spreadsheet Forecasting with seasonal adjustment Forecasting inflation Poor man
Decision 411: Class 3
 Decision 411: Class 3 Discussion of HW#1 Introduction to seasonal models Seasonal decomposition Seasonal adjustment on a spreadsheet Forecasting with seasonal adjustment Forecasting inflation Poor man
Decision 411: Class 3
 Decision 411: Class 3 Discussion of HW#1 Introduction to seasonal models Seasonal decomposition Seasonal adjustment on a spreadsheet Forecasting with seasonal adjustment Forecasting inflation Log transformation
FORECASTING COARSE RICE PRICES IN BANGLADESH
 Progress. Agric. 22(1 & 2): 193 201, 2011 ISSN 1017-8139 FORECASTING COARSE RICE PRICES IN BANGLADESH M. F. Hassan*, M. A. Islam 1, M. F. Imam 2 and S. M. Sayem 3 Department of Agricultural Statistics,
STATISTICAL FORECASTING and SEASONALITY (M. E. Ippolito; )
") STATISTICAL FORECASTING and SEASONALITY (M. E. Ippolito; 10-6-13) PART I OVERVIEW The following discussion expands upon exponential smoothing and seasonality as presented in Chapter 11, Forecasting, in
STATISTICAL FORECASTING and SEASONALITY (M. E. Ippolito; 10-6-13) PART I OVERVIEW The following discussion expands upon exponential smoothing and seasonality as presented in Chapter 11, Forecasting, in
DEPARTMENT OF QUANTITATIVE METHODS & INFORMATION SYSTEMS
 DEPARTMENT OF QUANTITATIVE METHODS & INFORMATION SYSTEMS Moving Averages and Smoothing Methods ECON 504 Chapter 7 Fall 2013 Dr. Mohammad Zainal 2 This chapter will describe three simple approaches to forecasting
Multiple Regression Analysis
 1 OUTLINE Analysis of Data and Model Hypothesis Testing Dummy Variables Research in Finance 2 ANALYSIS: Types of Data Time Series data Cross-Sectional data Panel data Trend Seasonal Variation Cyclical
Technical note on seasonal adjustment for M0
 Technical note on seasonal adjustment for M0 July 1, 2013 Contents 1 M0 2 2 Steps in the seasonal adjustment procedure 3 2.1 Pre-adjustment analysis............................... 3 2.2 Seasonal adjustment.................................
Time Series and Forecasting
 Chapter 8 Time Series and Forecasting 8.1 Introduction A time series is a collection of observations made sequentially in time. When observations are made continuously, the time series is said to be continuous;
UNIT-IV CORRELATION AND REGRESSION
 Correlation coefficient: UNIT-IV CORRELATION AND REGRESSION The quantity r, called the linear correlation coefficient, measures the strength and the direction of a linear relationship between two variables.
Pre-Calc Chapter 1 Sample Test. D) slope: 3 4
 slope: 3 4") Pre-Calc Chapter 1 Sample Test 1. Use the graphs of f and g to evaluate the function. f( x) gx ( ) (f o g)(-0.5) 1 1 0 4. Plot the points and find the slope of the line passing through the pair of points.
Pre-Calc Chapter 1 Sample Test 1. Use the graphs of f and g to evaluate the function. f( x) gx ( ) (f o g)(-0.5) 1 1 0 4. Plot the points and find the slope of the line passing through the pair of points.
Forecasting Chapter 3
 Forecasting Chapter 3 Introduction Current factors and conditions Past experience in a similar situation 2 Accounting. New product/process cost estimates, profit projections, cash management. Finance.
Product and Inventory Management (35E00300) Forecasting Models Trend analysis
 Forecasting Models Trend analysis") Product and Inventory Management (35E00300) Forecasting Models Trend analysis Exponential Smoothing Data Storage Shed Sales Period Actual Value(Y t ) Ŷ t-1 α Y t-1 Ŷ t-1 Ŷ t January 10 = 10 0.1 February
Product and Inventory Management (35E00300) Forecasting Models Trend analysis Exponential Smoothing Data Storage Shed Sales Period Actual Value(Y t ) Ŷ t-1 α Y t-1 Ŷ t-1 Ŷ t January 10 = 10 0.1 February
Copyright 2010 Pearson Education, Inc. Publishing as Prentice Hall.
 13 Forecasting PowerPoint Slides by Jeff Heyl For Operations Management, 9e by Krajewski/Ritzman/Malhotra 2010 Pearson Education 13 1 Forecasting Forecasts are critical inputs to business plans, annual
Time Series Analysis
 Time Series Analysis A time series is a sequence of observations made: 1) over a continuous time interval, 2) of successive measurements across that interval, 3) using equal spacing between consecutive
The point is located eight units to the right of the y-axis and two units above the x-axis. A) ( 8, 2) B) (8, 2) C) ( 2, 8) D) (2, 8) E) ( 2, 8)
 ( 8, 2) B) (8, 2) C) ( 2, 8) D) (2, 8) E) ( 2, 8)") Name: Date: 1. Find the coordinates of the point. The point is located eight units to the right of the y-axis and two units above the x-axis. A) ( 8, ) B) (8, ) C) (, 8) D) (, 8) E) (, 8). Find the coordinates
Name: Date: 1. Find the coordinates of the point. The point is located eight units to the right of the y-axis and two units above the x-axis. A) ( 8, ) B) (8, ) C) (, 8) D) (, 8) E) (, 8). Find the coordinates
Chapter 7 Forecasting Demand
 Chapter 7 Forecasting Demand Aims of the Chapter After reading this chapter you should be able to do the following: discuss the role of forecasting in inventory management; review different approaches
Forecasting Using Time Series Models
 Forecasting Using Time Series Models Dr. J Katyayani 1, M Jahnavi 2 Pothugunta Krishna Prasad 3 1 Professor, Department of MBA, SPMVV, Tirupati, India 2 Assistant Professor, Koshys Institute of Management
Chapter 10. Correlation and Regression. McGraw-Hill, Bluman, 7th ed., Chapter 10 1
 Chapter 10 Correlation and Regression McGraw-Hill, Bluman, 7th ed., Chapter 10 1 Chapter 10 Overview Introduction 10-1 Scatter Plots and Correlation 10- Regression 10-3 Coefficient of Determination and
Lecture 4 Forecasting
 King Saud University College of Computer & Information Sciences IS 466 Decision Support Systems Lecture 4 Forecasting Dr. Mourad YKHLEF The slides content is derived and adopted from many references Outline
Chapter 13: Forecasting
 Chapter 13: Forecasting Assistant Prof. Abed Schokry Operations and Productions Management First Semester 2013-2014 Chapter 13: Learning Outcomes You should be able to: List the elements of a good forecast
Ch. 12: Workload Forecasting
 Ch. 12: Workload Forecasting Kenneth Mitchell School of Computing & Engineering, University of Missouri-Kansas City, Kansas City, MO 64110 Kenneth Mitchell, CS & EE dept., SCE, UMKC p. 1/2 Introduction
Chapter 12 - Part I: Correlation Analysis
 ST coursework due Friday, April - Chapter - Part I: Correlation Analysis Textbook Assignment Page - # Page - #, Page - # Lab Assignment # (available on ST webpage) GOALS When you have completed this lecture,
SYSTEM BRIEF DAILY SUMMARY
 SYSTEM BRIEF DAILY SUMMARY * ANNUAL MaxTemp NEL (MWH) Hr Ending Hr Ending LOAD (PEAK HOURS 7:00 AM TO 10:00 PM MON-SAT) ENERGY (MWH) INCREMENTAL COST DAY DATE Civic TOTAL MAXIMUM @Max MINIMUM @Min FACTOR
Suan Sunandha Rajabhat University
 Forecasting Exchange Rate between Thai Baht and the US Dollar Using Time Series Analysis Kunya Bowornchockchai Suan Sunandha Rajabhat University INTRODUCTION The objective of this research is to forecast
Multivariate Regression Model Results
 Updated: August, 0 Page of Multivariate Regression Model Results 4 5 6 7 8 This exhibit provides the results of the load model forecast discussed in Schedule. Included is the forecast of short term system
References. 1. Russel et al., Operations Managemnt, 4 th edition. Management 3. Dr-Ing. Daniel Kitaw, Industrial Management and Engineering Economy
 Forecasting References 1. Russel et al., Operations Managemnt, 4 th edition 2. Buffa et al., Production and Operations Management 3. Dr-Ing. Daniel Kitaw, Industrial Management and Engineering Economy
peak half-hourly New South Wales
 Forecasting long-term peak half-hourly electricity demand for New South Wales Dr Shu Fan B.S., M.S., Ph.D. Professor Rob J Hyndman B.Sc. (Hons), Ph.D., A.Stat. Business & Economic Forecasting Unit Report
Time-Series Analysis. Dr. Seetha Bandara Dept. of Economics MA_ECON
 Time-Series Analysis Dr. Seetha Bandara Dept. of Economics MA_ECON Time Series Patterns A time series is a sequence of observations on a variable measured at successive points in time or over successive
STAT 115: Introductory Methods for Time Series Analysis and Forecasting. Concepts and Techniques
 STAT 115: Introductory Methods for Time Series Analysis and Forecasting Concepts and Techniques School of Statistics University of the Philippines Diliman 1 FORECASTING Forecasting is an activity that
Correlation and Regression Analysis. Linear Regression and Correlation. Correlation and Linear Regression. Three Questions.
 10/8/18 Correlation and Regression Analysis Correlation Analysis is the study of the relationship between variables. It is also defined as group of techniques to measure the association between two variables.
Winter Season Resource Adequacy Analysis Status Report
 Winter Season Resource Adequacy Analysis Status Report Tom Falin Director Resource Adequacy Planning Markets & Reliability Committee October 26, 2017 Winter Risk Winter Season Resource Adequacy and Capacity
Time Series and Forecasting
 Time Series and Forecasting Introduction to Forecasting n What is forecasting? n Primary Function is to Predict the Future using (time series related or other) data we have in hand n Why are we interested?
Monthly Trading Report July 2018
 Monthly Trading Report July 218 Figure 1: July 218 (% change over previous month) % Major Market Indicators 2 2 4 USEP Forecasted Demand CCGT/Cogen/Trigen Supply ST Supply Figure 2: Summary of Trading
SYSTEM BRIEF DAILY SUMMARY
 SYSTEM BRIEF DAILY SUMMARY * ANNUAL MaxTemp NEL (MWH) Hr Ending Hr Ending LOAD (PEAK HOURS 7:00 AM TO 10:00 PM MON-SAT) ENERGY (MWH) INCREMENTAL COST DAY DATE Civic TOTAL MAXIMUM @Max MINIMUM @Min FACTOR
7CORE SAMPLE. Time series. Birth rates in Australia by year,
 C H A P T E R 7CORE Time series What is time series data? What are the features we look for in times series data? How do we identify and quantify trend? How do we measure seasonal variation? How do we
3. If a forecast is too high when compared to an actual outcome, will that forecast error be positive or negative?
 1. Does a moving average forecast become more or less responsive to changes in a data series when more data points are included in the average? 2. Does an exponential smoothing forecast become more or
LOADS, CUSTOMERS AND REVENUE
 EB-00-0 Exhibit K Tab Schedule Page of 0 0 LOADS, CUSTOMERS AND REVENUE The purpose of this evidence is to present the Company s load, customer and distribution revenue forecast for the test year. The
Glossary. The ISI glossary of statistical terms provides definitions in a number of different languages:
 Glossary The ISI glossary of statistical terms provides definitions in a number of different languages: http://isi.cbs.nl/glossary/index.htm Adjusted r 2 Adjusted R squared measures the proportion of the
Lecture # 31. Questions of Marks 3. Question: Solution:
 Lecture # 31 Given XY = 400, X = 5, Y = 4, S = 4, S = 3, n = 15. Compute the coefficient of correlation between XX and YY. r =0.55 X Y Determine whether two variables XX and YY are correlated or uncorrelated
Dummy Variables. Susan Thomas IGIDR, Bombay. 24 November, 2008
 IGIDR, Bombay 24 November, 2008 The problem of structural change Model: Y i = β 0 + β 1 X 1i + ɛ i Structural change, type 1: change in parameters in time. Y i = α 1 + β 1 X i + e 1i for period 1 Y i =
Statistics for IT Managers
 Statistics for IT Managers 95-796, Fall 2012 Module 2: Hypothesis Testing and Statistical Inference (5 lectures) Reading: Statistics for Business and Economics, Ch. 5-7 Confidence intervals Given the sample
Chapter 5: Forecasting
 1 Textbook: pp. 165-202 Chapter 5: Forecasting Every day, managers make decisions without knowing what will happen in the future 2 Learning Objectives After completing this chapter, students will be able
A B C 1 Robert's Drugs 2 3 Week (t ) Sales t. Forec t
 Sales t. Forec t") Chapter 7 Forecasting Quantitative Approaches to Forecasting The Components of a Time Series Measures of Forecast Accuracy Using Smoothing Methods in Forecasting Using Seasonal Components in Forecasting
Chapter 7 Forecasting Quantitative Approaches to Forecasting The Components of a Time Series Measures of Forecast Accuracy Using Smoothing Methods in Forecasting Using Seasonal Components in Forecasting
Time Series and Forecasting
 Time Series and Forecasting Introduction to Forecasting n What is forecasting? n Primary Function is to Predict the Future using (time series related or other) data we have in hand n Why are we interested?
Monthly Trading Report Trading Date: Dec Monthly Trading Report December 2017
 Trading Date: Dec 7 Monthly Trading Report December 7 Trading Date: Dec 7 Figure : December 7 (% change over previous month) % Major Market Indicators 5 4 Figure : Summary of Trading Data USEP () Daily
Euro-indicators Working Group
 Euro-indicators Working Group Luxembourg, 9 th & 10 th June 2011 Item 9.4 of the Agenda New developments in EuroMIND estimates Rosa Ruggeri Cannata Doc 309/11 What is EuroMIND? EuroMIND is a Monthly INDicator
REPORT ON LABOUR FORECASTING FOR CONSTRUCTION
 REPORT ON LABOUR FORECASTING FOR CONSTRUCTION For: Project: XYZ Local Authority New Sample Project Contact us: Construction Skills & Whole Life Consultants Limited Dundee University Incubator James Lindsay
Chapter 3 Multiple Regression Complete Example
 Department of Quantitative Methods & Information Systems ECON 504 Chapter 3 Multiple Regression Complete Example Spring 2013 Dr. Mohammad Zainal Review Goals After completing this lecture, you should be
Public Library Use and Economic Hard Times: Analysis of Recent Data
 Public Library Use and Economic Hard Times: Analysis of Recent Data A Report Prepared for The American Library Association by The Library Research Center University of Illinois at Urbana Champaign April
CHAPTER 1 EXPRESSIONS, EQUATIONS, FUNCTIONS (ORDER OF OPERATIONS AND PROPERTIES OF NUMBERS)
") Aug 29 CHAPTER 1 EXPRESSIONS, EQUATIONS, FUNCTIONS (ORDER OF OPERATIONS AND PROPERTIES OF NUMBERS) Sept 5 No School Labor Day Holiday CHAPTER 1 EXPRESSIONS, EQUATIONS, FUNCTIONS (RELATIONS AND FUNCTIONS)
Aug 29 CHAPTER 1 EXPRESSIONS, EQUATIONS, FUNCTIONS (ORDER OF OPERATIONS AND PROPERTIES OF NUMBERS) Sept 5 No School Labor Day Holiday CHAPTER 1 EXPRESSIONS, EQUATIONS, FUNCTIONS (RELATIONS AND FUNCTIONS)
Name (print, please) ID
 ID") Name (print, please) ID Operations Management I 7- Winter 00 Odette School of Business University of Windsor Midterm Exam I Solution Wednesday, ebruary, 0:00 :0 pm Last Name A-S: Odette B0 Last Name T-Z:
Name (print, please) ID Operations Management I 7- Winter 00 Odette School of Business University of Windsor Midterm Exam I Solution Wednesday, ebruary, 0:00 :0 pm Last Name A-S: Odette B0 Last Name T-Z:
Chapter 3. Regression-Based Models for Developing Commercial Demand Characteristics Investigation
 Chapter Regression-Based Models for Developing Commercial Demand Characteristics Investigation. Introduction Commercial area is another important area in terms of consume high electric energy in Japan.
NSP Electric - Minnesota Annual Report Peak Demand and Annual Electric Consumption Forecast
 Page 1 of 5 7610.0320 - Forecast Methodology NSP Electric - Minnesota Annual Report Peak Demand and Annual Electric Consumption Forecast OVERALL METHODOLOGICAL FRAMEWORK Xcel Energy prepared its forecast
Multiple regression: Model building. Topics. Correlation Matrix. CQMS 202 Business Statistics II Prepared by Moez Hababou
 Multiple regression: Model building CQMS 202 Business Statistics II Prepared by Moez Hababou Topics Forward versus backward model building approach Using the correlation matrix Testing for multicolinearity
Bus 216: Business Statistics II Introduction Business statistics II is purely inferential or applied statistics.
 Bus 216: Business Statistics II Introduction Business statistics II is purely inferential or applied statistics. Study Session 1 1. Random Variable A random variable is a variable that assumes numerical
Cyclical Effect, and Measuring Irregular Effect
 Paper:15, Quantitative Techniques for Management Decisions Module- 37 Forecasting & Time series Analysis: Measuring- Seasonal Effect, Cyclical Effect, and Measuring Irregular Effect Principal Investigator
FEB DASHBOARD FEB JAN FEB MAR APR MAY JUN JUL AUG SEP OCT NOV DEC
 Positive Response Compliance 215 Compliant 215 Non-Compliant 216 Compliant 216 Non-Compliant 1% 87% 96% 86% 96% 88% 89% 89% 88% 86% 92% 93% 94% 96% 94% 8% 6% 4% 2% 13% 4% 14% 4% 12% 11% 11% 12% JAN MAR
CP:
 Adeng Pustikaningsih, M.Si. Dosen Jurusan Pendidikan Akuntansi Fakultas Ekonomi Universitas Negeri Yogyakarta CP: 08 222 180 1695 Email : adengpustikaningsih@uny.ac.id Operations Management Forecasting
2018 Annual Review of Availability Assessment Hours
 2018 Annual Review of Availability Assessment Hours Amber Motley Manager, Short Term Forecasting Clyde Loutan Principal, Renewable Energy Integration Karl Meeusen Senior Advisor, Infrastructure & Regulatory
Comparing the Univariate Modeling Techniques, Box-Jenkins and Artificial Neural Network (ANN) for Measuring of Climate Index
 for Measuring of Climate Index") Applied Mathematical Sciences, Vol. 8, 2014, no. 32, 1557-1568 HIKARI Ltd, www.m-hikari.com http://dx.doi.org/10.12988/ams.2014.4150 Comparing the Univariate Modeling Techniques, Box-Jenkins and Artificial
Applied Mathematical Sciences, Vol. 8, 2014, no. 32, 1557-1568 HIKARI Ltd, www.m-hikari.com http://dx.doi.org/10.12988/ams.2014.4150 Comparing the Univariate Modeling Techniques, Box-Jenkins and Artificial
CHAPTER 14. Time Series Analysis and Forecasting STATISTICS IN PRACTICE:
 CHAPTER 14 Time Series Analysis and Forecasting CONTENTS STATISTICS IN PRACTICE: Nevada Occupational Health Clinic 14.1 Time Series Patterns Horizontal Pattern Trend Pattern Seasonal Pattern Trend and
Linear Regression and Correlation
 Linear Regression and Correlation Chapter 13 McGraw-Hill/Irwin Copyright 2010 by The McGraw-Hill Companies, Inc. All rights reserved. GOALS 1. Understand and interpret the terms dependent and independent
In Centre, Online Classroom Live and Online Classroom Programme Prices
 In Centre, and Online Classroom Programme Prices In Centre Online Classroom Foundation Certificate Bookkeeping Transactions 430 325 300 Bookkeeping Controls 320 245 225 Elements of Costing 320 245 225
Unit 7: Multiple linear regression 1. Introduction to multiple linear regression
 Announcements Unit 7: Multiple linear regression 1. Introduction to multiple linear regression Sta 101 - Fall 2017 Duke University, Department of Statistical Science Work on your project! Due date- Sunday
A Dynamic-Trend Exponential Smoothing Model
 City University of New York (CUNY) CUNY Academic Works Publications and Research Baruch College Summer 2007 A Dynamic-Trend Exponential Smoothing Model Don Miller Virginia Commonwealth University Dan Williams
YACT (Yet Another Climate Tool)? The SPI Explorer
? The SPI Explorer") YACT (Yet Another Climate Tool)? The SPI Explorer Mike Crimmins Assoc. Professor/Extension Specialist Dept. of Soil, Water, & Environmental Science The University of Arizona Yes, another climate tool for
YACT (Yet Another Climate Tool)? The SPI Explorer Mike Crimmins Assoc. Professor/Extension Specialist Dept. of Soil, Water, & Environmental Science The University of Arizona Yes, another climate tool for
Industrial Engineering Prof. Inderdeep Singh Department of Mechanical & Industrial Engineering Indian Institute of Technology, Roorkee
 Industrial Engineering Prof. Inderdeep Singh Department of Mechanical & Industrial Engineering Indian Institute of Technology, Roorkee Module - 04 Lecture - 05 Sales Forecasting - II A very warm welcome
Week 9: An Introduction to Time Series
 BUS41100 Applied Regression Analysis Week 9: An Introduction to Time Series Dependent data, autocorrelation, AR and periodic regression models Max H. Farrell The University of Chicago Booth School of Business
THE APPLICATION OF GREY SYSTEM THEORY TO EXCHANGE RATE PREDICTION IN THE POST-CRISIS ERA
 International Journal of Innovative Management, Information & Production ISME Internationalc20 ISSN 285-5439 Volume 2, Number 2, December 20 PP. 83-89 THE APPLICATION OF GREY SYSTEM THEORY TO EXCHANGE
A look into the factor model black box Publication lags and the role of hard and soft data in forecasting GDP
 A look into the factor model black box Publication lags and the role of hard and soft data in forecasting GDP Marta Bańbura and Gerhard Rünstler Directorate General Research European Central Bank November
CWV Review London Weather Station Move
 CWV Review London Weather Station Move 6th November 26 Demand Estimation Sub-Committee Background The current composite weather variables (CWVs) for North Thames (NT), Eastern (EA) and South Eastern (SE)
CHAPTER 18. Time Series Analysis and Forecasting
 CHAPTER 18 Time Series Analysis and Forecasting CONTENTS STATISTICS IN PRACTICE: NEVADA OCCUPATIONAL HEALTH CLINIC 18.1 TIME SERIES PATTERNS Horizontal Pattern Trend Pattern Seasonal Pattern Trend and
Assistant Prof. Abed Schokry. Operations and Productions Management. First Semester
 Chapter 3 Forecasting Assistant Prof. Abed Schokry Operations and Productions Management First Semester 2010 2011 Chapter 3: Learning Outcomes You should be able to: List the elements of a good forecast
Salem Economic Outlook
 Salem Economic Outlook November 2012 Tim Duy, PHD Prepared for the Salem City Council November 7, 2012 Roadmap US Economic Update Slow and steady Positives: Housing/monetary policy Negatives: Rest of world/fiscal
Sluggish Economy Puts Pinch on Manufacturing Technology Orders
 Updated Release: June 13, 2016 Contact: Penny Brown, AMT, 703-827-5275 pbrown@amtonline.org Sluggish Economy Puts Pinch on Manufacturing Technology Orders Manufacturing technology orders for were down
TIME SERIES ANALYSIS AND FORECASTING USING THE STATISTICAL MODEL ARIMA
 CHAPTER 6 TIME SERIES ANALYSIS AND FORECASTING USING THE STATISTICAL MODEL ARIMA 6.1. Introduction A time series is a sequence of observations ordered in time. A basic assumption in the time series analysis
Introduction to Course
 .. Introduction to Course Oran Kittithreerapronchai 1 1 Department of Industrial Engineering, Chulalongkorn University Bangkok 10330 THAILAND last updated: September 17, 2016 COMP METH v2.00: intro 1/
Math Final Exam Review. 1. The following equation gives the rate at which the angle between two objects is changing during a game:
 Math 131 Spring 2008 c Sherry Scarborough and Heather Ramsey Page 1 Math 131 - Final Exam Review 1. The following equation gives the rate at which the angle between two objects is changing during a game:
Modeling and Forecasting Currency in Circulation in Sri Lanka
 Modeling and Forecasting Currency in Circulation in Sri Lanka Rupa Dheerasinghe 1 Abstract Currency in circulation is typically estimated either by specifying a currency demand equation based on the theory
Chiang Rai Province CC Threat overview AAS1109 Mekong ARCC
 Chiang Rai Province CC Threat overview AAS1109 Mekong ARCC This threat overview relies on projections of future climate change in the Mekong Basin for the period 2045-2069 compared to a baseline of 1980-2005.
ECON 343 Lecture 4 : Smoothing and Extrapolation of Time Series. Jad Chaaban Spring
 ECON 343 Lecture 4 : Smoothing and Extrapolation of Time Series Jad Chaaban Spring 2005-2006 Outline Lecture 4 1. Simple extrapolation models 2. Moving-average models 3. Single Exponential smoothing 4.
Ch 13 & 14 - Regression Analysis
 Ch 3 & 4 - Regression Analysis Simple Regression Model I. Multiple Choice:. A simple regression is a regression model that contains a. only one independent variable b. only one dependent variable c. more