Time-Series Analysis. Dr. Seetha Bandara Dept. of Economics MA_ECON
|
|
|
- Baldric Morrison
- 5 years ago
- Views:
Transcription
1 Time-Series Analysis Dr. Seetha Bandara Dept. of Economics MA_ECON
2 Time Series Patterns A time series is a sequence of observations on a variable measured at successive points in time or over successive periods of time. The measurements may be taken every hour, day, week, month, or year, or at any other regular interval
3 Time series and forcasting If the historical data are restricted to past values of the variable to be forecast, the forecasting procedure is called a time series method and the historical data are referred to as a time series. The objective of time series analysis is to discover a pattern in the historical data or time series and then extrapolate the pattern into the future; the forecast is based solely on past values of the variable and/or on past forecast errors.
4 Cont, Quantitative forecasting methods can be used when (1) past information about the variable being forecast is available, (2) the information can be quantified, and (3) it is reasonable to assume that the pattern of the past will continue into the future. In such cases, a forecast can be developed using a time series method or a causal method.

5 BICYCLE SALES TIME SERIES PLOT

6 TREND REPRESENTED BY A LINEAR FUNCTION FOR THE BICYCLE SALES TIME SERIES

7 Linear trend equation
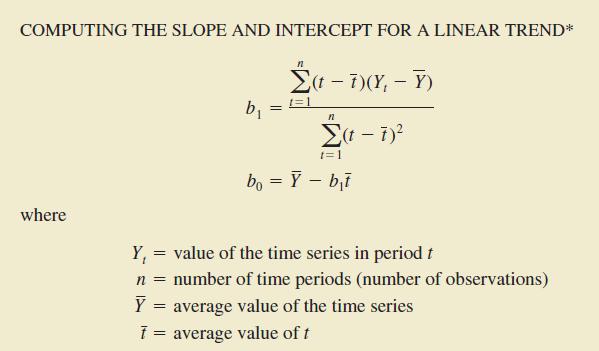
8 Cont,
9 Cont,
10 Cont,

11 SUMMARY OF LINEAR TREND CALCULATIONS FOR THE BICYCLE SALES TIME SERIES
12 The Importance of Business Forecasting Time-Series Data: data obtained at regular periods of time. Very often, we are trying to predict the future. The procedure is called forecasting. The managerial topic is strategic planning.
13 Types of Forecasting Qualitative: very subjective and judgmentoriented. Usually a panel of experts is polled and their opinions are. One process is called the Delphi Method. Quantitative: uses historical data and mathematical techniques. Time-series: base the future values of a variable entirely on past and present values of the variable. Us. Causal: include other related variables in the model in addition to past values of the predicted variable.
14 Components of a time series Any time series can contain some or all of the following components: Trend (T) Cyclical (C) Seasonal (S) Irregular (I)
15 Cont, These components may be combined in different ways. It is usually assumed that they are multiplied or added, i.e., yt = T C S I yt = T + C + S + I To correct for the trend in the first case one divides the first expression by the trend (T). In the second case it is subtracted
16 Trend component (Secular Trend or General Trend) The secular trend is the main component of a time series which results from long term effect of socio-economic and political factors. This trend may show the growth or decline in a time series over a long period. This is the type of tendency which continues to persist for a very long period. Prices, export and imports data, for example, reflect obviously increasing tendencies over time. The trend is the long term pattern of a time series. A trend can be positive or negative depending on whether the time series exhibits an increasing long term pattern or a decreasing long term pattern. If a time series does not show an increasing or decreasing pattern then the series is stationary in the mean.
17 Cyclical component (Cyclical Movements) These are long term oscillation occurring in a time series. These oscillations are mostly observed in economics data and the periods of such oscillations are generally extended from five to twelve years or more. These oscillations are associated to the well known business cycles. These cyclic movements can be studied provided a long series of measurements, free from irregular fluctuations is available. Any pattern showing an up and down movement around a given trend is identified as a cyclical pattern. The duration of a cycle depends on the type of business or industry being analyzed.
18 Seasonal component (Seasonal Movements) Seasonality occurs when the time series exhibits regular fluctuations during the same month (or months) every year, or during the same quarter every year. For instance, retail sales peak during the month of December. These are short term movements occurring in a data due to seasonal factors. The short term is generally considered as a period in which changes occur in a time series with variations in weather or festivities. For example, it is commonly observed that the consumption of ice-cream during summer us generally high and hence sales of an ice-cream dealer would be higher in some months of the year while relatively lower during winter months. Employment, output, export etc. are subjected to change due to variation in weather. Similarly sales of garments, umbrella, greeting cards and fire-work are subjected to large variation during festivals like Valentine s Day, Eid, Christmas, New Year etc. These types of variation in a time series are isolated only when the series is provided biannually, quarterly or monthly.
19 Irregular component (Irregular Fluctuations-Randomness) This component is unpredictable. Every time series has some unpredictable component that makes it a random variable. In prediction, the objective is to model all the components to the point that the only component that remains unexplained is the random component. These are sudden changes occurring in a time series which are unlikely to be repeated, it is that component of a time series which cannot be explained by trend, seasonal or cyclic movements.it is because of this fact these variations some-times called residual or random component. These variations though accidental in nature, can cause a continual change in the trend, seasonal and cyclical oscillations during the forthcoming period. Floods, fires, earthquakes, revolutions, epidemics and strikes etc,. are the root cause of such irregularities.
20 Model and Components The most basic model is the classical multiplicative model. Y i = T i * C i * S i * I i Y i is the dependent variable T i is the trend component C i is the cyclical component S i is the seasonal component I i is the irregular component Sometimes the subscript i is shown as a
21 Components Trend long term behavior e.g. several years Seasonal regular behavior within a 12 month period Cyclical up and down behavior that repeats; intensity might not be constant Irregular similar to OLS residual; what s left over after removing TSC.
22 What does the model mean? The value of Y at any time is the product of Trend, Cyclical, Seasonal, and Irregular components at that time. Annual data does not have S i. Quarterly or Monthly data does have S i.
23 Smoothing the Annual Time Series Remember: annual data has NO Seasonal component. Plot the data. If there is no apparent trend component, then Smoothing is a good approach. There is no apparent trend. The two techniques of interest are: Moving Averages and Exponential Smoothing.
24 Moving Averages There are several ways to do this. We ll use the text rules: Select an odd number of observations to average. Call this odd number L. Example: L = 3. The first MA(3) = (Y 1 +Y 2 +Y 3 )/3 The second MA(3) = (Y 2 +Y 3 +Y 4 )/3 Etc. Plot the value of the MA against the date, or period, of the middle value in the average.
25 More on Moving Averages The first (L-1)/2 and the last (L-1)/2 observations will not have a smoothed value to plot against. L should not be too large. What does your text recommend for maximum L? Greater L means more smooth. Moving Averages cannot be used to forecast.
26 Exponential Smoothing ES can be used to forecast 1 period into the future. All of the previously occurring data points are used to obtain each smoothed data point. Newer observations are given more weight. Formula 16.3 and 16.4.
27 Least-Squares Trend Fitting and Forecasting Y = T*C*S*I If the data set shows no trend, try smoothing the data. If the data set shows a trend, try fitting a trend model: Least Squares (x = time, or some coded value) Other, eg. Double Exponential
28 Least-Squares: Linear Trend Typically code the X values as 0 for the first observation, 1 for the second, etc. Linear use everything you know about simple linear regression; there s a nice interpretation on page 670. Check the r 2 and p-values.
29 Quadratic Trend Model Look at the scatter plot of the data. Quadratic or 2 nd degree polynomial the model appears in Equation Check r 2 and p-values of F test. Interpretations are more difficult with this model.
30 Exponential Trend Model when a series increases at a rate such that the percentage difference from value to value is constant. The models are given on page 672. Check r 2 and p-values of F test.
31 Time Series Forecasting of Monthly or Quarterly Data It shows typical data that requires a Seasonal component in the multiplicative model (Y=TCSI). The data is quarterly. Thus the coded date is expressed in number of quarters. Use dummy variables to tell the equation which quarter.
32 Equation What does it mean? How do you use it? This type of model captures both Trend and Seasonal. How do you decide which model is best?
33 Calculating a 5-Year Moving Average Example Year Sales ($M)
34 (4M + 6M + 5M + 8M + 9M) / 5 = 6.4M The average sales for the second subset of five years ( ), centered around 2006, is 6.6M: (6M + 5M + 8M + 9M + 5M) / 5 = 6.6M The average sales for the third subset of five years ( ), centered around 2007, is 6.6M: (5M + 8M + 9M + 5M + 4M) / 5 = 6.2M Continue calculating each five-year average, until you reach the end of the set ( ). This gives you a series of points (averages) that you can use to plot a chart of moving averages. The following Excel table shows you the moving averages calculated for along with a scatter plot of the data:
35

36
Chapter 7 Forecasting Demand
 Chapter 7 Forecasting Demand Aims of the Chapter After reading this chapter you should be able to do the following: discuss the role of forecasting in inventory management; review different approaches
Cyclical Effect, and Measuring Irregular Effect
 Paper:15, Quantitative Techniques for Management Decisions Module- 37 Forecasting & Time series Analysis: Measuring- Seasonal Effect, Cyclical Effect, and Measuring Irregular Effect Principal Investigator
Introduction to Forecasting
 Introduction to Forecasting Introduction to Forecasting Predicting the future Not an exact science but instead consists of a set of statistical tools and techniques that are supported by human judgment
Time Series Analysis -- An Introduction -- AMS 586
 Time Series Analysis -- An Introduction -- AMS 586 1 Objectives of time series analysis Data description Data interpretation Modeling Control Prediction & Forecasting 2 Time-Series Data Numerical data
14. Time- Series data visualization. Prof. Tulasi Prasad Sariki SCSE, VIT, Chennai
 14. Time- Series data visualization Prof. Tulasi Prasad Sariki SCSE, VIT, Chennai www.learnersdesk.weebly.com Overview What is forecasting Time series & its components Smooth a data series Moving average
Decision 411: Class 3
 Decision 411: Class 3 Discussion of HW#1 Introduction to seasonal models Seasonal decomposition Seasonal adjustment on a spreadsheet Forecasting with seasonal adjustment Forecasting inflation Log transformation
Forecasting. Simon Shaw 2005/06 Semester II
 Forecasting Simon Shaw s.c.shaw@maths.bath.ac.uk 2005/06 Semester II 1 Introduction A critical aspect of managing any business is planning for the future. events is called forecasting. Predicting future
Decision 411: Class 3
 Decision 411: Class 3 Discussion of HW#1 Introduction to seasonal models Seasonal decomposition Seasonal adjustment on a spreadsheet Forecasting with seasonal adjustment Forecasting inflation Poor man
Decision 411: Class 3
 Decision 411: Class 3 Discussion of HW#1 Introduction to seasonal models Seasonal decomposition Seasonal adjustment on a spreadsheet Forecasting with seasonal adjustment Forecasting inflation Poor man
Forecasting Chapter 3
 Forecasting Chapter 3 Introduction Current factors and conditions Past experience in a similar situation 2 Accounting. New product/process cost estimates, profit projections, cash management. Finance.
The Art of Forecasting
 Time Series The Art of Forecasting Learning Objectives Describe what forecasting is Explain time series & its components Smooth a data series Moving average Exponential smoothing Forecast using trend models
A B C 1 Robert's Drugs 2 3 Week (t ) Sales t. Forec t
 Sales t. Forec t") Chapter 7 Forecasting Quantitative Approaches to Forecasting The Components of a Time Series Measures of Forecast Accuracy Using Smoothing Methods in Forecasting Using Seasonal Components in Forecasting
Chapter 7 Forecasting Quantitative Approaches to Forecasting The Components of a Time Series Measures of Forecast Accuracy Using Smoothing Methods in Forecasting Using Seasonal Components in Forecasting
INTRODUCTION TO FORECASTING (PART 2) AMAT 167
 AMAT 167") INTRODUCTION TO FORECASTING (PART 2) AMAT 167 Techniques for Trend EXAMPLE OF TRENDS In our discussion, we will focus on linear trend but here are examples of nonlinear trends: EXAMPLE OF TRENDS If you
INTRODUCTION TO FORECASTING (PART 2) AMAT 167 Techniques for Trend EXAMPLE OF TRENDS In our discussion, we will focus on linear trend but here are examples of nonlinear trends: EXAMPLE OF TRENDS If you
Based on the original slides from Levine, et. all, First Edition, Prentice Hall, Inc
 Based on the original slides from Levine, et. all, First Edition, Prentice Hall, Inc Process of predicting a future event Underlying basis of all business decisions Production Inventory Personnel Facilities
Lecture 4 Forecasting
 King Saud University College of Computer & Information Sciences IS 466 Decision Support Systems Lecture 4 Forecasting Dr. Mourad YKHLEF The slides content is derived and adopted from many references Outline
Forecasting. Chapter Copyright 2010 Pearson Education, Inc. Publishing as Prentice Hall
 Forecasting Chapter 15 15-1 Chapter Topics Forecasting Components Time Series Methods Forecast Accuracy Time Series Forecasting Using Excel Time Series Forecasting Using QM for Windows Regression Methods
CP:
 Adeng Pustikaningsih, M.Si. Dosen Jurusan Pendidikan Akuntansi Fakultas Ekonomi Universitas Negeri Yogyakarta CP: 08 222 180 1695 Email : adengpustikaningsih@uny.ac.id Operations Management Forecasting
CHAPTER 18. Time Series Analysis and Forecasting
 CHAPTER 18 Time Series Analysis and Forecasting CONTENTS STATISTICS IN PRACTICE: NEVADA OCCUPATIONAL HEALTH CLINIC 18.1 TIME SERIES PATTERNS Horizontal Pattern Trend Pattern Seasonal Pattern Trend and
Chapter 5: Forecasting
 1 Textbook: pp. 165-202 Chapter 5: Forecasting Every day, managers make decisions without knowing what will happen in the future 2 Learning Objectives After completing this chapter, students will be able
Time Series Analysis. Smoothing Time Series. 2) assessment of/accounting for seasonality. 3) assessment of/exploiting "serial correlation"
 assessment of/accounting for seasonality. 3) assessment of/exploiting serial correlation") Time Series Analysis 2) assessment of/accounting for seasonality This (not surprisingly) concerns the analysis of data collected over time... weekly values, monthly values, quarterly values, yearly values,
Time Series Analysis 2) assessment of/accounting for seasonality This (not surprisingly) concerns the analysis of data collected over time... weekly values, monthly values, quarterly values, yearly values,
Lecture Prepared By: Mohammad Kamrul Arefin Lecturer, School of Business, North South University
 Lecture 15 20 Prepared By: Mohammad Kamrul Arefin Lecturer, School of Business, North South University Modeling for Time Series Forecasting Forecasting is a necessary input to planning, whether in business,
CHAPTER 14. Time Series Analysis and Forecasting STATISTICS IN PRACTICE:
 CHAPTER 14 Time Series Analysis and Forecasting CONTENTS STATISTICS IN PRACTICE: Nevada Occupational Health Clinic 14.1 Time Series Patterns Horizontal Pattern Trend Pattern Seasonal Pattern Trend and
3 Time Series Regression
 3 Time Series Regression 3.1 Modelling Trend Using Regression Random Walk 2 0 2 4 6 8 Random Walk 0 2 4 6 8 0 10 20 30 40 50 60 (a) Time 0 10 20 30 40 50 60 (b) Time Random Walk 8 6 4 2 0 Random Walk 0
STAT 115: Introductory Methods for Time Series Analysis and Forecasting. Concepts and Techniques
 STAT 115: Introductory Methods for Time Series Analysis and Forecasting Concepts and Techniques School of Statistics University of the Philippines Diliman 1 FORECASTING Forecasting is an activity that
ECON 343 Lecture 4 : Smoothing and Extrapolation of Time Series. Jad Chaaban Spring
 ECON 343 Lecture 4 : Smoothing and Extrapolation of Time Series Jad Chaaban Spring 2005-2006 Outline Lecture 4 1. Simple extrapolation models 2. Moving-average models 3. Single Exponential smoothing 4.
QMT 3001 BUSINESS FORECASTING. Exploring Data Patterns & An Introduction to Forecasting Techniques. Aysun KAPUCUGİL-İKİZ, PhD.
 1 QMT 3001 BUSINESS FORECASTING Exploring Data Patterns & An Introduction to Forecasting Techniques Aysun KAPUCUGİL-İKİZ, PhD. Forecasting 2 1 3 4 2 5 6 3 Time Series Data Patterns Horizontal (stationary)
TIMES SERIES INTRODUCTION INTRODUCTION. Page 1. A time series is a set of observations made sequentially through time
 TIMES SERIES INTRODUCTION A time series is a set of observations made sequentially through time A time series is said to be continuous when observations are taken continuously through time, or discrete
Time Series and Forecasting
 Time Series and Forecasting Introduction to Forecasting n What is forecasting? n Primary Function is to Predict the Future using (time series related or other) data we have in hand n Why are we interested?
Lecture Prepared By: Mohammad Kamrul Arefin Lecturer, School of Business, North South University
 Lecture 15 20 Prepared By: Mohammad Kamrul Arefin Lecturer, School of Business, North South University Modeling for Time Series Forecasting Forecasting is a necessary input to planning, whether in business,
Forecasting. BUS 735: Business Decision Making and Research. exercises. Assess what we have learned
 Forecasting BUS 735: Business Decision Making and Research 1 1.1 Goals and Agenda Goals and Agenda Learning Objective Learn how to identify regularities in time series data Learn popular univariate time
AUTO SALES FORECASTING FOR PRODUCTION PLANNING AT FORD
 FCAS AUTO SALES FORECASTING FOR PRODUCTION PLANNING AT FORD Group - A10 Group Members: PGID Name of the Member 1. 61710956 Abhishek Gore 2. 61710521 Ajay Ballapale 3. 61710106 Bhushan Goyal 4. 61710397
Forecasting Using Time Series Models
 Forecasting Using Time Series Models Dr. J Katyayani 1, M Jahnavi 2 Pothugunta Krishna Prasad 3 1 Professor, Department of MBA, SPMVV, Tirupati, India 2 Assistant Professor, Koshys Institute of Management
Announcements. J. Parman (UC-Davis) Analysis of Economic Data, Winter 2011 February 8, / 45
 Analysis of Economic Data, Winter 2011 February 8, / 45") Announcements Solutions to Problem Set 3 are posted Problem Set 4 is posted, It will be graded and is due a week from Friday You already know everything you need to work on Problem Set 4 Professor Miller
Announcements Solutions to Problem Set 3 are posted Problem Set 4 is posted, It will be graded and is due a week from Friday You already know everything you need to work on Problem Set 4 Professor Miller
Chapter 8 - Forecasting
 Chapter 8 - Forecasting Operations Management by R. Dan Reid & Nada R. Sanders 4th Edition Wiley 2010 Wiley 2010 1 Learning Objectives Identify Principles of Forecasting Explain the steps in the forecasting
DEPARTMENT OF QUANTITATIVE METHODS & INFORMATION SYSTEMS
 DEPARTMENT OF QUANTITATIVE METHODS & INFORMATION SYSTEMS Moving Averages and Smoothing Methods ECON 504 Chapter 7 Fall 2013 Dr. Mohammad Zainal 2 This chapter will describe three simple approaches to forecasting
Glossary. The ISI glossary of statistical terms provides definitions in a number of different languages:
 Glossary The ISI glossary of statistical terms provides definitions in a number of different languages: http://isi.cbs.nl/glossary/index.htm Adjusted r 2 Adjusted R squared measures the proportion of the
Time Series and Forecasting
 Time Series and Forecasting Introduction to Forecasting n What is forecasting? n Primary Function is to Predict the Future using (time series related or other) data we have in hand n Why are we interested?
YEAR 10 GENERAL MATHEMATICS 2017 STRAND: BIVARIATE DATA PART II CHAPTER 12 RESIDUAL ANALYSIS, LINEARITY AND TIME SERIES
 YEAR 10 GENERAL MATHEMATICS 2017 STRAND: BIVARIATE DATA PART II CHAPTER 12 RESIDUAL ANALYSIS, LINEARITY AND TIME SERIES This topic includes: Transformation of data to linearity to establish relationships
Forecasting. Copyright 2015 Pearson Education, Inc.
 5 Forecasting To accompany Quantitative Analysis for Management, Twelfth Edition, by Render, Stair, Hanna and Hale Power Point slides created by Jeff Heyl Copyright 2015 Pearson Education, Inc. LEARNING
Antti Salonen PPU Le 2: Forecasting 1
 - 2017 1 Forecasting Forecasts are critical inputs to business plans, annual plans, and budgets Finance, human resources, marketing, operations, and supply chain managers need forecasts to plan: output
PPU411 Antti Salonen. Forecasting. Forecasting PPU Forecasts are critical inputs to business plans, annual plans, and budgets
 - 2017 1 Forecasting Forecasts are critical inputs to business plans, annual plans, and budgets Finance, human resources, marketing, operations, and supply chain managers need forecasts to plan: output
Time series and Forecasting
 Chapter 2 Time series and Forecasting 2.1 Introduction Data are frequently recorded at regular time intervals, for instance, daily stock market indices, the monthly rate of inflation or annual profit figures.
Antti Salonen KPP Le 3: Forecasting KPP227
 - 2015 1 Forecasting Forecasts are critical inputs to business plans, annual plans, and budgets Finance, human resources, marketing, operations, and supply chain managers need forecasts to plan: output
Ch. 12: Workload Forecasting
 Ch. 12: Workload Forecasting Kenneth Mitchell School of Computing & Engineering, University of Missouri-Kansas City, Kansas City, MO 64110 Kenneth Mitchell, CS & EE dept., SCE, UMKC p. 1/2 Introduction
Public Library Use and Economic Hard Times: Analysis of Recent Data
 Public Library Use and Economic Hard Times: Analysis of Recent Data A Report Prepared for The American Library Association by The Library Research Center University of Illinois at Urbana Champaign April
Forecasting models and methods
 Forecasting models and methods Giovanni Righini Università degli Studi di Milano Logistics Forecasting methods Forecasting methods are used to obtain information to support decision processes based on
Econ 300/QAC 201: Quantitative Methods in Economics/Applied Data Analysis. 17th Class 7/1/10
 Econ 300/QAC 201: Quantitative Methods in Economics/Applied Data Analysis 17th Class 7/1/10 The only function of economic forecasting is to make astrology look respectable. --John Kenneth Galbraith show
CHAPTER 4: DATASETS AND CRITERIA FOR ALGORITHM EVALUATION
 CHAPTER 4: DATASETS AND CRITERIA FOR ALGORITHM EVALUATION 4.1 Overview This chapter contains the description about the data that is used in this research. In this research time series data is used. A time
CHAPTER 1: Decomposition Methods
 CHAPTER 1: Decomposition Methods Prof. Alan Wan 1 / 48 Table of contents 1. Data Types and Causal vs.time Series Models 2 / 48 Types of Data Time series data: a sequence of observations measured over time,
Midterm 2 - Solutions
 Ecn 102 - Analysis of Economic Data University of California - Davis February 24, 2010 Instructor: John Parman Midterm 2 - Solutions You have until 10:20am to complete this exam. Please remember to put
Operations Management
 3-1 Forecasting Operations Management William J. Stevenson 8 th edition 3-2 Forecasting CHAPTER 3 Forecasting McGraw-Hill/Irwin Operations Management, Eighth Edition, by William J. Stevenson Copyright
Chapter 13: Forecasting
 Chapter 13: Forecasting Assistant Prof. Abed Schokry Operations and Productions Management First Semester 2013-2014 Chapter 13: Learning Outcomes You should be able to: List the elements of a good forecast
LOADS, CUSTOMERS AND REVENUE
 EB-00-0 Exhibit K Tab Schedule Page of 0 0 LOADS, CUSTOMERS AND REVENUE The purpose of this evidence is to present the Company s load, customer and distribution revenue forecast for the test year. The
Dennis Bricker Dept of Mechanical & Industrial Engineering The University of Iowa. Forecasting demand 02/06/03 page 1 of 34
 demand -5-4 -3-2 -1 0 1 2 3 Dennis Bricker Dept of Mechanical & Industrial Engineering The University of Iowa Forecasting demand 02/06/03 page 1 of 34 Forecasting is very difficult. especially about the
Applied Time Series Topics
 Applied Time Series Topics Ivan Medovikov Brock University April 16, 2013 Ivan Medovikov, Brock University Applied Time Series Topics 1/34 Overview 1. Non-stationary data and consequences 2. Trends and
Development of Short-term Demand Forecasting Model And its Application in Analysis of Resource Adequacy. For discussion purposes only Draft
 Development of Short-term Demand Forecasting Model And its Application in Analysis of Resource Adequacy For discussion purposes only Draft January 31, 2007 INTRODUCTION In this paper we will present the
Exponential Smoothing. INSR 260, Spring 2009 Bob Stine
 Exponential Smoothing INSR 260, Spring 2009 Bob Stine 1 Overview Smoothing Exponential smoothing Model behind exponential smoothing Forecasts and estimates Hidden state model Diagnostic: residual plots
ANSWERS CHAPTER 15 THINK IT OVER EXERCISES. Nick Lee and Mike Peters think it over. No answers required.
 ANSWERS CHAPTER 15 THINK IT OVER think it over No answers required. EXERCISES 1. (a) Yes it could but you would have to be careful in interpreting the results. Transformers tend to be situated outside
7CORE SAMPLE. Time series. Birth rates in Australia by year,
 C H A P T E R 7CORE Time series What is time series data? What are the features we look for in times series data? How do we identify and quantify trend? How do we measure seasonal variation? How do we
Assistant Prof. Abed Schokry. Operations and Productions Management. First Semester
 Chapter 3 Forecasting Assistant Prof. Abed Schokry Operations and Productions Management First Semester 2010 2011 Chapter 3: Learning Outcomes You should be able to: List the elements of a good forecast
Product and Inventory Management (35E00300) Forecasting Models Trend analysis
 Forecasting Models Trend analysis") Product and Inventory Management (35E00300) Forecasting Models Trend analysis Exponential Smoothing Data Storage Shed Sales Period Actual Value(Y t ) Ŷ t-1 α Y t-1 Ŷ t-1 Ŷ t January 10 = 10 0.1 February
Product and Inventory Management (35E00300) Forecasting Models Trend analysis Exponential Smoothing Data Storage Shed Sales Period Actual Value(Y t ) Ŷ t-1 α Y t-1 Ŷ t-1 Ŷ t January 10 = 10 0.1 February
Forecasting: The First Step in Demand Planning
 Forecasting: The First Step in Demand Planning Jayant Rajgopal, Ph.D., P.E. University of Pittsburgh Pittsburgh, PA 15261 In a supply chain context, forecasting is the estimation of future demand General
3. If a forecast is too high when compared to an actual outcome, will that forecast error be positive or negative?
 1. Does a moving average forecast become more or less responsive to changes in a data series when more data points are included in the average? 2. Does an exponential smoothing forecast become more or
Multiple Regression Analysis
 1 OUTLINE Analysis of Data and Model Hypothesis Testing Dummy Variables Research in Finance 2 ANALYSIS: Types of Data Time Series data Cross-Sectional data Panel data Trend Seasonal Variation Cyclical
Week 9: An Introduction to Time Series
 BUS41100 Applied Regression Analysis Week 9: An Introduction to Time Series Dependent data, autocorrelation, AR and periodic regression models Max H. Farrell The University of Chicago Booth School of Business
Operation and Supply Chain Management Prof. G. Srinivasan Department of Management Studies Indian Institute of Technology, Madras
 Operation and Supply Chain Management Prof. G. Srinivasan Department of Management Studies Indian Institute of Technology, Madras Lecture - 3 Forecasting Linear Models, Regression, Holt s, Seasonality
Forecasting. Dr. Richard Jerz rjerz.com
 Forecasting Dr. Richard Jerz 1 1 Learning Objectives Describe why forecasts are used and list the elements of a good forecast. Outline the steps in the forecasting process. Describe at least three qualitative
Design of a Weather- Normalization Forecasting Model
 Design of a Weather- Normalization Forecasting Model Progress Report Abram Gross Yafeng Peng Jedidiah Shirey 3/4/2014 TABLE OF CONTENTS 1.0 Introduction... 3 2.0 Problem Statement... 3 3.0 Scope... 3 4.0
Determine the trend for time series data
 Extra Online Questions Determine the trend for time series data Covers AS 90641 (Statistics and Modelling 3.1) Scholarship Statistics and Modelling Chapter 1 Essent ial exam notes Time series 1. The value
FORECASTING FLUCTUATIONS OF ASPHALT CEMENT PRICE INDEX IN GEORGIA
 FORECASTING FLUCTUATIONS OF ASPHALT CEMENT PRICE INDEX IN GEORGIA Mohammad Ilbeigi, Baabak Ashuri, Ph.D., and Yang Hui Economics of the Sustainable Built Environment (ESBE) Lab, School of Building Construction
Multiple regression: Model building. Topics. Correlation Matrix. CQMS 202 Business Statistics II Prepared by Moez Hababou
 Multiple regression: Model building CQMS 202 Business Statistics II Prepared by Moez Hababou Topics Forward versus backward model building approach Using the correlation matrix Testing for multicolinearity
Lecture 2. Business Cycle Measurement. Randall Romero Aguilar, PhD II Semestre 2017 Last updated: August 18, 2017
 Lecture 2 Business Cycle Measurement Randall Romero Aguilar, PhD II Semestre 2017 Last updated: August 18, 2017 Universidad de Costa Rica EC3201 - Teoría Macroeconómica 2 Table of contents 1. Introduction
Making sense of Econometrics: Basics
 Making sense of Econometrics: Basics Lecture 4: Qualitative influences and Heteroskedasticity Egypt Scholars Economic Society November 1, 2014 Assignment & feedback enter classroom at http://b.socrative.com/login/student/
Demand Forecasting Models
 E 2017 PSE Integrated Resource Plan Demand Forecasting Models This appendix describes the econometric models used in creating the demand forecasts for PSE s 2017 IRP analysis. Contents 1. ELECTRIC BILLED
SOLVING PROBLEMS BASED ON WINQSB FORECASTING TECHNIQUES
 SOLVING PROBLEMS BASED ON WINQSB FORECASTING TECHNIQUES Mihaela - Lavinia CIOBANICA, Camelia BOARCAS Spiru Haret University, Unirii Street, Constanta, Romania mihaelavinia@yahoo.com, lady.camelia.yahoo.com
Year 10 Mathematics Semester 2 Bivariate Data Chapter 13
 Year 10 Mathematics Semester 2 Bivariate Data Chapter 13 Why learn this? Observations of two or more variables are often recorded, for example, the heights and weights of individuals. Studying the data
A MACRO-DRIVEN FORECASTING SYSTEM FOR EVALUATING FORECAST MODEL PERFORMANCE
 A MACRO-DRIVEN ING SYSTEM FOR EVALUATING MODEL PERFORMANCE Bryan Sellers Ross Laboratories INTRODUCTION A major problem of forecasting aside from obtaining accurate forecasts is choosing among a wide range
STATISTICAL FORECASTING and SEASONALITY (M. E. Ippolito; )
") STATISTICAL FORECASTING and SEASONALITY (M. E. Ippolito; 10-6-13) PART I OVERVIEW The following discussion expands upon exponential smoothing and seasonality as presented in Chapter 11, Forecasting, in
STATISTICAL FORECASTING and SEASONALITY (M. E. Ippolito; 10-6-13) PART I OVERVIEW The following discussion expands upon exponential smoothing and seasonality as presented in Chapter 11, Forecasting, in
Bus 216: Business Statistics II Introduction Business statistics II is purely inferential or applied statistics.
 Bus 216: Business Statistics II Introduction Business statistics II is purely inferential or applied statistics. Study Session 1 1. Random Variable A random variable is a variable that assumes numerical
Industrial Engineering Prof. Inderdeep Singh Department of Mechanical & Industrial Engineering Indian Institute of Technology, Roorkee
 Industrial Engineering Prof. Inderdeep Singh Department of Mechanical & Industrial Engineering Indian Institute of Technology, Roorkee Module - 04 Lecture - 05 Sales Forecasting - II A very warm welcome
Copyright 2010 Pearson Education, Inc. Publishing as Prentice Hall.
 13 Forecasting PowerPoint Slides by Jeff Heyl For Operations Management, 9e by Krajewski/Ritzman/Malhotra 2010 Pearson Education 13 1 Forecasting Forecasts are critical inputs to business plans, annual
LECTURE 9: GENTLE INTRODUCTION TO
 LECTURE 9: GENTLE INTRODUCTION TO REGRESSION WITH TIME SERIES From random variables to random processes (cont d) 2 in cross-sectional regression, we were making inferences about the whole population based
Operations Management
 Operations Management Chapter 4 Forecasting PowerPoint presentation to accompany Heizer/Render Principles of Operations Management, 7e Operations Management, 9e 2008 Prentice Hall, Inc. 4 1 Outline Global
Advances in promotional modelling and analytics
 Advances in promotional modelling and analytics High School of Economics St. Petersburg 25 May 2016 Nikolaos Kourentzes n.kourentzes@lancaster.ac.uk O u t l i n e 1. What is forecasting? 2. Forecasting,
Diploma Part 2. Quantitative Methods. Examiner s Suggested Answers
 Diploma Part Quantitative Methods Examiner s Suggested Answers Question 1 (a) The standard normal distribution has a symmetrical and bell-shaped graph with a mean of zero and a standard deviation equal
The flu example from last class is actually one of our most common transformations called the log-linear model:
 The Log-Linear Model The flu example from last class is actually one of our most common transformations called the log-linear model: ln Y = β 1 + β 2 X + ε We can use ordinary least squares to estimate
Lecture 12. Functional form
 Lecture 12. Functional form Multiple linear regression model β1 + β2 2 + L+ β K K + u Interpretation of regression coefficient k Change in if k is changed by 1 unit and the other variables are held constant.
The Development of Time-Series Based Outage Distribution Models For Feeder Lines In South Western Nigeria
 IOSR Journal of Engineering (IOSRJEN) e-issn: 2250-3021, p-issn: 2278-8719 Vol. 3, Issue 7 (July. 2013), V1 PP 47-54 The Development of Time-Series Based Outage Distribution Models For Feeder Lines In
15 yaş üstü istihdam ( )
") Forecasting 1-2 Forecasting 23 000 15 yaş üstü istihdam (2005-2008) 22 000 21 000 20 000 19 000 18 000 17 000 - What can we say about this data? - Can you guess the employement level for July 2013? 1-3
Forecasting 1-2 Forecasting 23 000 15 yaş üstü istihdam (2005-2008) 22 000 21 000 20 000 19 000 18 000 17 000 - What can we say about this data? - Can you guess the employement level for July 2013? 1-3
BUSI 460 Suggested Answers to Selected Review and Discussion Questions Lesson 7
 BUSI 460 Suggested Answers to Selected Review and Discussion Questions Lesson 7 1. The definitions follow: (a) Time series: Time series data, also known as a data series, consists of observations on a
Forecasting. Operations Analysis and Improvement Spring
 Forecasting Operations Analysis and Improvement 2015 Spring Dr. Tai-Yue Wang Industrial and Information Management Department National Cheng Kung University 1-2 Outline Introduction to Forecasting Subjective
Autoregressive models with distributed lags (ADL)
") Autoregressive models with distributed lags (ADL) It often happens than including the lagged dependent variable in the model results in model which is better fitted and needs less parameters. It can be
Autoregressive models with distributed lags (ADL) It often happens than including the lagged dependent variable in the model results in model which is better fitted and needs less parameters. It can be
Defining Normal Weather for Energy and Peak Normalization
 Itron White Paper Energy Forecasting Defining Normal Weather for Energy and Peak Normalization J. Stuart McMenamin, Ph.D Managing Director, Itron Forecasting 2008, Itron Inc. All rights reserved. 1 Introduction
Euro-indicators Working Group
 Euro-indicators Working Group Luxembourg, 9 th & 10 th June 2011 Item 9.4 of the Agenda New developments in EuroMIND estimates Rosa Ruggeri Cannata Doc 309/11 What is EuroMIND? EuroMIND is a Monthly INDicator
at least 50 and preferably 100 observations should be available to build a proper model
 III Box-Jenkins Methods 1. Pros and Cons of ARIMA Forecasting a) need for data at least 50 and preferably 100 observations should be available to build a proper model used most frequently for hourly or
References. 1. Russel et al., Operations Managemnt, 4 th edition. Management 3. Dr-Ing. Daniel Kitaw, Industrial Management and Engineering Economy
 Forecasting References 1. Russel et al., Operations Managemnt, 4 th edition 2. Buffa et al., Production and Operations Management 3. Dr-Ing. Daniel Kitaw, Industrial Management and Engineering Economy
Abram Gross Yafeng Peng Jedidiah Shirey
 Abram Gross Yafeng Peng Jedidiah Shirey Contents Context Problem Statement Method of Analysis Forecasting Model Way Forward Earned Value NOVEC Background (1 of 2) Northern Virginia Electric Cooperative
STA 6104 Financial Time Series. Moving Averages and Exponential Smoothing
 STA 6104 Financial Time Series Moving Averages and Exponential Smoothing Smoothing Our objective is to predict some future value Y n+k given a past history {Y 1, Y 2,..., Y n } of observations up to time
Forecasting: Principles and Practice. Rob J Hyndman. 1. Introduction to forecasting OTexts.org/fpp/1/ OTexts.org/fpp/2/3
 Rob J Hyndman Forecasting: Principles and Practice 1. Introduction to forecasting OTexts.org/fpp/1/ OTexts.org/fpp/2/3 Forecasting: Principles and Practice 1 Resources Slides Exercises Textbook Useful
A COMPARISON OF REGIONAL FORECASTING TECHNIQUES
 A COMPARISON OF REGIONAL FORECASTING TECHNIQUES John E. Connaughton and Ronald A. Madsen* 1. Introduction The need for regional econometric forecasting models and the uses of their results has increased