Multiple Regression Analysis
|
|
|
- Matilda Snow
- 5 years ago
- Views:
Transcription
1 1
2 OUTLINE Analysis of Data and Model Hypothesis Testing Dummy Variables Research in Finance 2
3 ANALYSIS: Types of Data Time Series data Cross-Sectional data Panel data Trend Seasonal Variation Cyclical Variation Irregular Variation 1-dimensional Data set Observing many subjects (size, company, counties, etc) at the same time Multi-dimensional data set Time-Series + Cross- Sectional Data MULTIPLE REGRESSION 3

4 Trend Component Persistent, overall upward or downward pattern Due to population, technology etc. Several years duration Response Mo., Qtr., Yr T/Maker Co.
5 Trend Component Overall Upward or Downward Movement Data Taken Over a Period of Years Sales Time

6 Cyclical Component Repeating up & down movements Due to interactions of factors influencing economy Usually 2-10 years duration Response Cycle Mo., Qtr., Yr.
7 Cyclical Component Upward or Downward Swings May Vary in Length Usually Lasts 2-10 Years Sales Time

8 Seasonal Component Regular pattern of up & down fluctuations Due to weather, customs etc. Occurs within one year Response Summer Mo., Qtr T/Maker Co.
9 Seasonal Component Upward or Downward Swings Regular Patterns Observed Within One Year Sales Time (Monthly or Quarterly)
10 Irregular Component Erratic, unsystematic, residual fluctuations Due to random variation or unforeseen events Union strike War Short duration & nonrepeating
11 Apr-75 May-76 Jun-77 Jul-78 Aug-79 Sep-80 Oct-81 Nov-82 Dec-83 Jan-85 Feb-86 Mar-87 Apr-88 May-89 Jun-90 Jul-91 Aug-92 Sep-93 Oct-94 Nov-95 Dec-96 Jan-98 Feb-99 Mar-00 Apr-01 May-02 Jun-03 Jul-04 Aug-05 Sep-06 Oct-07 Nov-08 Dec-09 Jan-11 Feb-12 Mar-13 Apr-14 May-15 Jun-16 Jul-17 Time Series Data SET Index
12 Cross Sectional Data
13 Pool (Panel) Data


14 ANALYSIS: Type of Estimator Least Square Estimator Maximum Likelihood Estimator Y i = β 1 + β 2 X 1i + β 3 X 2i + u i 14
15 ANALYSIS: Type of Model Linear model Non Linear Model DTAC t = α + β 1 X 1t + β 2 X 2t + ε t Y t = AIS RETURN 15
16 ANALYSIS: Fitted Regression on Model Y ~ regressand var response var dependent var observed var Y = a + b x X ~ regressor independent variable explanatory variable predictor Variable Time series Time-Series with Condition Panel Model Multiple Regression ARMA/ ARIMA ARCH/GARCH Pooled or Panel Model Fixed-Effect Model Random-Effect Model 16
17 ANALYSIS: Fitted Regression on Model Y = a + b x Logit Model Y is discrete Probit Model 17
18 ANALYSIS: Fitted Regression on Model Y = a + b x Y and X are Dynamic Vector Auto Regression (VAR) Error Correction Model (ECM) 18
19 ANALYSIS: Expansion from Simple Regression to Multiple Regression FITTED REGRESSION MODEL Y = a + b x 19
20 x is the independent variable y is the dependent variable The regression model is simple linear regression y 0 1 x The model has two variables, the independent or explanatory variable, x, and the dependent variable y, the variable whose variation is to be explained. The relationship between x and y is a linear or straight line relationship. Two parameters to estimate the slope of the line β 1 and the y- intercept β 0 (where the line crosses the vertical axis). ε is the unexplained, random, or error component. Much more on this later.
21 The regression model is Regression line y 0 1 x Data about x and y are obtained from a sample. From the sample of values of x and y, estimates b 0 of β 0 and b 1 of β 1 are obtained using the least squares or another method. The resulting estimate of the model is ŷ yˆ b0 b1 x The symbol is termed y hat and refers to the predicted values of the dependent variable y that are associated with values of x, given the linear model.
22 Income hrs/week Income hrs/week
23 Summer Income as a Function of Hours Worked Income Hours per Week

24 yˆ x R 2 = 0.311
25
26
27 Outliers Rare, extreme values may distort the outcome. Could be an error. Could be a very important observation. Outlier: more than 3 standard deviations from the mean.
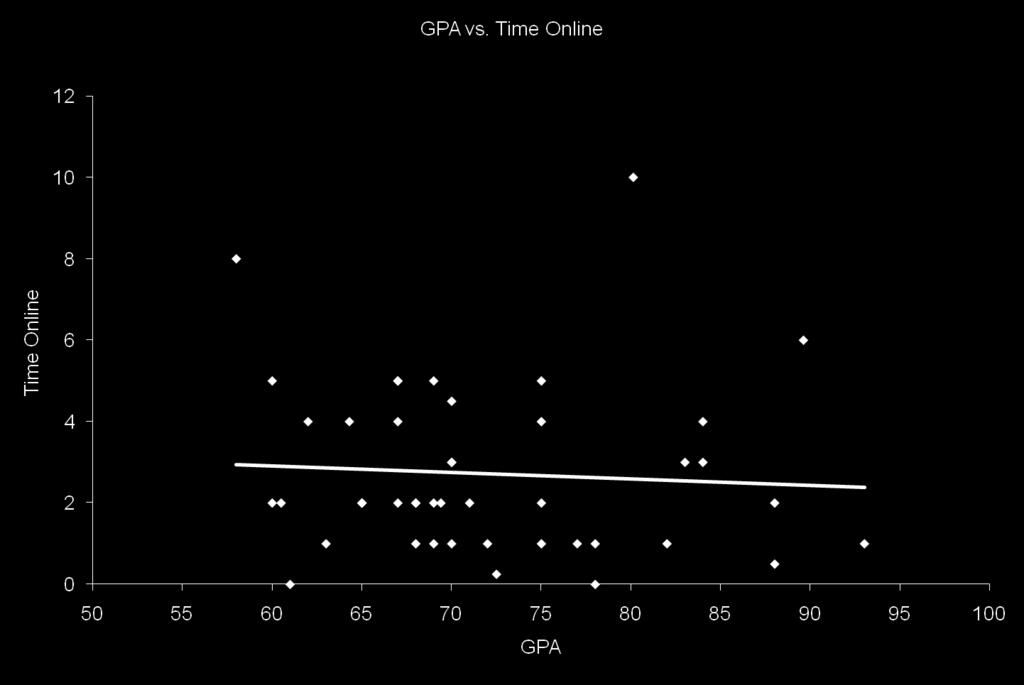
28 GPA vs. Time Online Time Online GPA
29 GPA vs. Time Online Time Online GPA
30 U-Shaped Relationship OMITTED VARIABLE Correlation = Y X
31 TESTING MULTIPLE HYPOTHESIS: F-test F-Test is of interest to test more than one coefficient simultaneously. F-Test Conditional to Reject H0: Significant if p-value <
32 TESTING MULTIPLE HYPOTHESIS: t-test t-test is of interest to test ONLY one coefficient t-test Conditional to Reject H0: Significant if p-value < 0.05 Oh my gosh!!!! It fails to reject H 0, what does it mean? What I should do? Cut it or leave it? 32

33 Example I: Stock Asset Price Regression TMB 1990M M12 RP1 BBL NPL FRN JAS DJ NIKKEI 33

34 Example II: Hedonic Pricing Model Dependent Variable : Y ~ Rental Values Definitions 34
35 TESTING MULTIPLE HYPOTHESIS: Goodness of Fit Testing R 2 R 2 is desirable to answer how well regression model actually fits the data In other words, R 2 is desirable to answer how well does the model containing the explanatory variables 0 R 2 1 R 2 = 1 0 < R 2 < 1 35
36 TESTING MULTIPLE HYPOTHESIS: Problem with using R 2 Cannot compare R 2 of two models with same X but change Y R 2 never falls if more regressors are added to the regression R 2 2 R 1 2 R2 can take values of 0.9 or higher for time series regressions, and hence it is not good at discrimanating between models 36
37 TESTING MULTIPLE HYPOTHESIS: Adjusted R 2 If an extra regressor is added to the model, k increases and unless R2 increases by a more than off-setting amount, will actually fall. If model contains a lot of significant and insignificant variables, can be negative 37
38 DUMMY VARIABLE: How to Create Dummy Dummy is variables that assume such 0 and 1 values If a model contains M categories, then only M-1 dummy variables should be created. Otherwise, multicollinearity Problem Category for which no dummy variable is assigned is known as base, benchmark 2 types of dummy variables: Intercept vs. slope change dummy 38
39 DUMMY VARIABLE: 2 Type of Dummy Variables I. Different Intercept II. Different Slope R t R f = α + β 1 R M R f + β 2 SMB + β 3 HML + β 4 JAN RENT t = α + β 1 LNAGE + β 2 NOROOM + β 3 DIST + β 4 DDIST JAN is dummy = 1 if January = 0 otherwise D is dummy = 1 if Safe Area = 0 Otherwise Y Regression for JAN RENT Regression for Safe Area Slop = Β 3 + β 4 D α +β 4 α β 4 Regression for Other months X α Regression for Criminal Area DISTANT 39
40 STEP BY STEP Quantitative Analysis (Multiple Regression) 1. Conceptual Framework 2. Choose Type of regression (Linear vs. Non Linear) 3. Group Variables 4. Analyze Data (Take logarithm or not) 5. Look at the sign of estimated parameters. 6. Test Hypothesis 7. Take a look at Adjust R 2 40
) Eugene Fama Kenneth R.")
41 RESEARCH PAPER: THREE FACTOR MODEL Three Factor Model (Fama and French (1992)) Eugene Fama Kenneth R. French 41
42 42
43 43

44 WORK SHOP #1 44
45 WORK ORDERS : Multiple Regression (1) Using Three Factor Model to regress Multiple Regression on your group assignment (2) Interpret F-test, and T-Test. (3) Explain Adjusted R 2 (4) Create Dummy variables o Monthly Data : (1) Window Dressing in June and (2) End-Year Effect. o Annual Data : (1) Asian Crisis during , (2) Subprime Crisis during , (3) Europe Debt crisis during (5) Redo Work Orders (1) (4) with new model 45
Time Series and Forecasting
 Time Series and Forecasting Introduction to Forecasting n What is forecasting? n Primary Function is to Predict the Future using (time series related or other) data we have in hand n Why are we interested?
Time Series and Forecasting
 Time Series and Forecasting Introduction to Forecasting n What is forecasting? n Primary Function is to Predict the Future using (time series related or other) data we have in hand n Why are we interested?
Based on the original slides from Levine, et. all, First Edition, Prentice Hall, Inc
 Based on the original slides from Levine, et. all, First Edition, Prentice Hall, Inc Process of predicting a future event Underlying basis of all business decisions Production Inventory Personnel Facilities
The Art of Forecasting
 Time Series The Art of Forecasting Learning Objectives Describe what forecasting is Explain time series & its components Smooth a data series Moving average Exponential smoothing Forecast using trend models
Introduction to Forecasting
 Introduction to Forecasting Introduction to Forecasting Predicting the future Not an exact science but instead consists of a set of statistical tools and techniques that are supported by human judgment
GAMINGRE 8/1/ of 7
 FYE 09/30/92 JULY 92 0.00 254,550.00 0.00 0 0 0 0 0 0 0 0 0 254,550.00 0.00 0.00 0.00 0.00 254,550.00 AUG 10,616,710.31 5,299.95 845,656.83 84,565.68 61,084.86 23,480.82 339,734.73 135,893.89 67,946.95
14. Time- Series data visualization. Prof. Tulasi Prasad Sariki SCSE, VIT, Chennai
 14. Time- Series data visualization Prof. Tulasi Prasad Sariki SCSE, VIT, Chennai www.learnersdesk.weebly.com Overview What is forecasting Time series & its components Smooth a data series Moving average
YEAR 10 GENERAL MATHEMATICS 2017 STRAND: BIVARIATE DATA PART II CHAPTER 12 RESIDUAL ANALYSIS, LINEARITY AND TIME SERIES
 YEAR 10 GENERAL MATHEMATICS 2017 STRAND: BIVARIATE DATA PART II CHAPTER 12 RESIDUAL ANALYSIS, LINEARITY AND TIME SERIES This topic includes: Transformation of data to linearity to establish relationships
Technical note on seasonal adjustment for M0
 Technical note on seasonal adjustment for M0 July 1, 2013 Contents 1 M0 2 2 Steps in the seasonal adjustment procedure 3 2.1 Pre-adjustment analysis............................... 3 2.2 Seasonal adjustment.................................
Introduction to Regression Analysis. Dr. Devlina Chatterjee 11 th August, 2017
 Introduction to Regression Analysis Dr. Devlina Chatterjee 11 th August, 2017 What is regression analysis? Regression analysis is a statistical technique for studying linear relationships. One dependent
Multiple Regression Analysis
 1 OUTLINE Basic Concept: Multiple Regression MULTICOLLINEARITY AUTOCORRELATION HETEROSCEDASTICITY REASEARCH IN FINANCE 2 BASIC CONCEPTS: Multiple Regression Y i = β 1 + β 2 X 1i + β 3 X 2i + β 4 X 3i +
BUSI 460 Suggested Answers to Selected Review and Discussion Questions Lesson 7
 BUSI 460 Suggested Answers to Selected Review and Discussion Questions Lesson 7 1. The definitions follow: (a) Time series: Time series data, also known as a data series, consists of observations on a
Lecture Prepared By: Mohammad Kamrul Arefin Lecturer, School of Business, North South University
 Lecture 15 20 Prepared By: Mohammad Kamrul Arefin Lecturer, School of Business, North South University Modeling for Time Series Forecasting Forecasting is a necessary input to planning, whether in business,
Dummy Variables. Susan Thomas IGIDR, Bombay. 24 November, 2008
 IGIDR, Bombay 24 November, 2008 The problem of structural change Model: Y i = β 0 + β 1 X 1i + ɛ i Structural change, type 1: change in parameters in time. Y i = α 1 + β 1 X i + e 1i for period 1 Y i =
Determine the trend for time series data
 Extra Online Questions Determine the trend for time series data Covers AS 90641 (Statistics and Modelling 3.1) Scholarship Statistics and Modelling Chapter 1 Essent ial exam notes Time series 1. The value
Public Library Use and Economic Hard Times: Analysis of Recent Data
 Public Library Use and Economic Hard Times: Analysis of Recent Data A Report Prepared for The American Library Association by The Library Research Center University of Illinois at Urbana Champaign April
NATCOR Regression Modelling for Time Series
 Universität Hamburg Institut für Wirtschaftsinformatik Prof. Dr. D.B. Preßmar Professor Robert Fildes NATCOR Regression Modelling for Time Series The material presented has been developed with the substantial
Forecasting using R. Rob J Hyndman. 1.3 Seasonality and trends. Forecasting using R 1
 Forecasting using R Rob J Hyndman 1.3 Seasonality and trends Forecasting using R 1 Outline 1 Time series components 2 STL decomposition 3 Forecasting and decomposition 4 Lab session 5 Forecasting using
Time Series Analysis
 Time Series Analysis A time series is a sequence of observations made: 1) over a continuous time interval, 2) of successive measurements across that interval, 3) using equal spacing between consecutive
Lecture 4 Forecasting
 King Saud University College of Computer & Information Sciences IS 466 Decision Support Systems Lecture 4 Forecasting Dr. Mourad YKHLEF The slides content is derived and adopted from many references Outline
Annual Average NYMEX Strip Comparison 7/03/2017
 Annual Average NYMEX Strip Comparison 7/03/2017 To Year to Year Oil Price Deck ($/bbl) change Year change 7/3/2017 6/1/2017 5/1/2017 4/3/2017 3/1/2017 2/1/2017-2.7% 2017 Average -10.4% 47.52 48.84 49.58
Lecture Prepared By: Mohammad Kamrul Arefin Lecturer, School of Business, North South University
 Lecture 15 20 Prepared By: Mohammad Kamrul Arefin Lecturer, School of Business, North South University Modeling for Time Series Forecasting Forecasting is a necessary input to planning, whether in business,
Rob J Hyndman. Forecasting using. 3. Autocorrelation and seasonality OTexts.com/fpp/2/ OTexts.com/fpp/6/1. Forecasting using R 1
 Rob J Hyndman Forecasting using 3. Autocorrelation and seasonality OTexts.com/fpp/2/ OTexts.com/fpp/6/1 Forecasting using R 1 Outline 1 Time series graphics 2 Seasonal or cyclic? 3 Autocorrelation Forecasting
SYSTEM BRIEF DAILY SUMMARY
 SYSTEM BRIEF DAILY SUMMARY * ANNUAL MaxTemp NEL (MWH) Hr Ending Hr Ending LOAD (PEAK HOURS 7:00 AM TO 10:00 PM MON-SAT) ENERGY (MWH) INCREMENTAL COST DAY DATE Civic TOTAL MAXIMUM @Max MINIMUM @Min FACTOR
Alterations to the Flat Weight For Age Scale BHA Data Published 22 September 2016
 Alterations to the Flat Weight For Age Scale BHA Data Published 22 September 2016 Introduction What is weight for age? It is an allowance given to younger horses, usually three-year-olds, to enable them
Making sense of Econometrics: Basics
 Making sense of Econometrics: Basics Lecture 4: Qualitative influences and Heteroskedasticity Egypt Scholars Economic Society November 1, 2014 Assignment & feedback enter classroom at http://b.socrative.com/login/student/
FinQuiz Notes
 Reading 10 Multiple Regression and Issues in Regression Analysis 2. MULTIPLE LINEAR REGRESSION Multiple linear regression is a method used to model the linear relationship between a dependent variable
SYSTEM BRIEF DAILY SUMMARY
 SYSTEM BRIEF DAILY SUMMARY * ANNUAL MaxTemp NEL (MWH) Hr Ending Hr Ending LOAD (PEAK HOURS 7:00 AM TO 10:00 PM MON-SAT) ENERGY (MWH) INCREMENTAL COST DAY DATE Civic TOTAL MAXIMUM @Max MINIMUM @Min FACTOR
Single and multiple linear regression analysis
 Single and multiple linear regression analysis Marike Cockeran 2017 Introduction Outline of the session Simple linear regression analysis SPSS example of simple linear regression analysis Additional topics
Technical note on seasonal adjustment for Capital goods imports
 Technical note on seasonal adjustment for Capital goods imports July 1, 2013 Contents 1 Capital goods imports 2 1.1 Additive versus multiplicative seasonality..................... 2 2 Steps in the seasonal
2016 Year-End Benchmark Oil and Gas Prices (Average of Previous 12 months First-Day-of-the Month [FDOM] Prices)
![2016 Year-End Benchmark Oil and Gas Prices (Average of Previous 12 months First-Day-of-the Month [FDOM] Prices)](/thumbs/85/92418365.jpg "2016 Year-End Benchmark Oil and Gas Prices (Average of Previous 12 months First-Day-of-the Month [FDOM] Prices)") Oil and Gas Benchmark Prices to Estimate Year-End Petroleum Reserves and Values Using U.S. Securities and Exchange Commission Guidelines from the Modernization of Oil and Gas Reporting Effective January
Oil and Gas Benchmark Prices to Estimate Year-End Petroleum Reserves and Values Using U.S. Securities and Exchange Commission Guidelines from the Modernization of Oil and Gas Reporting Effective January
EXAMINATIONS OF THE ROYAL STATISTICAL SOCIETY
 EXAMINATIONS OF THE ROYAL STATISTICAL SOCIETY GRADUATE DIPLOMA, 011 MODULE 3 : Stochastic processes and time series Time allowed: Three Hours Candidates should answer FIVE questions. All questions carry
Average 175, , , , , , ,046 YTD Total 1,098,649 1,509,593 1,868,795 1,418, ,169 1,977,225 2,065,321
 AGRICULTURE 01-Agriculture JUL 2,944-4,465 1,783-146 102 AUG 2,753 6,497 5,321 1,233 1,678 744 1,469 SEP - 4,274 4,183 1,596 - - 238 OCT 2,694 - - 1,032 340-276 NOV 1,979-5,822 637 3,221 1,923 1,532 DEC
Average 175, , , , , , ,940 YTD Total 944,460 1,284,944 1,635,177 1,183, ,954 1,744,134 1,565,640
 AGRICULTURE 01-Agriculture JUL 2,944-4,465 1,783-146 102 AUG 2,753 6,497 5,321 1,233 1,678 744 1,469 SEP - 4,274 4,183 1,596 - - 238 OCT 2,694 - - 1,032 340-276 NOV 1,979-5,822 637 3,221 1,923 1,532 DEC
Operations Management
 Operations Management Chapter 4 Forecasting PowerPoint presentation to accompany Heizer/Render Principles of Operations Management, 7e Operations Management, 9e 2008 Prentice Hall, Inc. 4 1 Outline Global
Statistics for IT Managers
 Statistics for IT Managers 95-796, Fall 2012 Module 2: Hypothesis Testing and Statistical Inference (5 lectures) Reading: Statistics for Business and Economics, Ch. 5-7 Confidence intervals Given the sample
Suan Sunandha Rajabhat University
 Forecasting Exchange Rate between Thai Baht and the US Dollar Using Time Series Analysis Kunya Bowornchockchai Suan Sunandha Rajabhat University INTRODUCTION The objective of this research is to forecast
Jackson County 2013 Weather Data
 Jackson County 2013 Weather Data 61 Years of Weather Data Recorded at the UF/IFAS Marianna North Florida Research and Education Center Doug Mayo Jackson County Extension Director 1952-2008 Rainfall Data
Forecasting. Copyright 2015 Pearson Education, Inc.
 5 Forecasting To accompany Quantitative Analysis for Management, Twelfth Edition, by Render, Stair, Hanna and Hale Power Point slides created by Jeff Heyl Copyright 2015 Pearson Education, Inc. LEARNING
ENGINE SERIAL NUMBERS
 ENGINE SERIAL NUMBERS The engine number was also the serial number of the car. Engines were numbered when they were completed, and for the most part went into a chassis within a day or so. However, some
Forecasting the Canadian Dollar Exchange Rate Wissam Saleh & Pablo Navarro
 Forecasting the Canadian Dollar Exchange Rate Wissam Saleh & Pablo Navarro Research Question: What variables effect the Canadian/US exchange rate? Do energy prices have an effect on the Canadian/US exchange
In Centre, Online Classroom Live and Online Classroom Programme Prices
 In Centre, and Online Classroom Programme Prices In Centre Online Classroom Foundation Certificate Bookkeeping Transactions 430 325 300 Bookkeeping Controls 320 245 225 Elements of Costing 320 245 225
The Effects of Weather on Urban Trail Use: A National Study
 The Effects of Weather on Urban Trail Use: A National Study Alireza Ermagun, Tracy Haden-Loh, Greg Lindsey May 3, 2016 Rails to Trails Conservancy Trail Modeling and Assessment Platform Objectives Monitor
INDIAN INSTITUTE OF SCIENCE STOCHASTIC HYDROLOGY. Lecture -12 Course Instructor : Prof. P. P. MUJUMDAR Department of Civil Engg., IISc.
 INDIAN INSTITUTE OF SCIENCE STOCHASTIC HYDROLOGY Lecture -12 Course Instructor : Prof. P. P. MUJUMDAR Department of Civil Engg., IISc. Summary of the previous lecture Data Extension & Forecasting Moving
7CORE SAMPLE. Time series. Birth rates in Australia by year,
 C H A P T E R 7CORE Time series What is time series data? What are the features we look for in times series data? How do we identify and quantify trend? How do we measure seasonal variation? How do we
TILT, DAYLIGHT AND SEASONS WORKSHEET
 TILT, DAYLIGHT AND SEASONS WORKSHEET Activity Description: Students will use a data table to make a graph for the length of day and average high temperature in Utah. They will then answer questions based
A look into the factor model black box Publication lags and the role of hard and soft data in forecasting GDP
 A look into the factor model black box Publication lags and the role of hard and soft data in forecasting GDP Marta Bańbura and Gerhard Rünstler Directorate General Research European Central Bank November
Modeling and Forecasting Currency in Circulation in Sri Lanka
 Modeling and Forecasting Currency in Circulation in Sri Lanka Rupa Dheerasinghe 1 Abstract Currency in circulation is typically estimated either by specifying a currency demand equation based on the theory
Pre-Calc Chapter 1 Sample Test. D) slope: 3 4
 slope: 3 4") Pre-Calc Chapter 1 Sample Test 1. Use the graphs of f and g to evaluate the function. f( x) gx ( ) (f o g)(-0.5) 1 1 0 4. Plot the points and find the slope of the line passing through the pair of points.
Pre-Calc Chapter 1 Sample Test 1. Use the graphs of f and g to evaluate the function. f( x) gx ( ) (f o g)(-0.5) 1 1 0 4. Plot the points and find the slope of the line passing through the pair of points.
Chapter 3 Multiple Regression Complete Example
 Department of Quantitative Methods & Information Systems ECON 504 Chapter 3 Multiple Regression Complete Example Spring 2013 Dr. Mohammad Zainal Review Goals After completing this lecture, you should be
FinQuiz Notes
 Reading 9 A time series is any series of data that varies over time e.g. the quarterly sales for a company during the past five years or daily returns of a security. When assumptions of the regression
Time-Series Analysis. Dr. Seetha Bandara Dept. of Economics MA_ECON
 Time-Series Analysis Dr. Seetha Bandara Dept. of Economics MA_ECON Time Series Patterns A time series is a sequence of observations on a variable measured at successive points in time or over successive
Time Series Analysis -- An Introduction -- AMS 586
 Time Series Analysis -- An Introduction -- AMS 586 1 Objectives of time series analysis Data description Data interpretation Modeling Control Prediction & Forecasting 2 Time-Series Data Numerical data
Asitha Kodippili. Deepthika Senaratne. Department of Mathematics and Computer Science,Fayetteville State University, USA.
 Forecasting Tourist Arrivals to Sri Lanka Using Seasonal ARIMA Asitha Kodippili Department of Mathematics and Computer Science,Fayetteville State University, USA. akodippili@uncfsu.edu Deepthika Senaratne
Chapter 3 ANALYSIS OF RESPONSE PROFILES
 Chapter 3 ANALYSIS OF RESPONSE PROFILES 78 31 Introduction In this chapter we present a method for analysing longitudinal data that imposes minimal structure or restrictions on the mean responses over
Jackson County 2018 Weather Data 67 Years of Weather Data Recorded at the UF/IFAS Marianna North Florida Research and Education Center
 Jackson County 2018 Weather Data 67 Years of Weather Data Recorded at the UF/IFAS Marianna North Florida Research and Education Center Doug Mayo Jackson County Extension Director 1952-2008 Rainfall Data
Time Series Analysis of United States of America Crude Oil and Petroleum Products Importations from Saudi Arabia
 International Journal of Applied Science and Technology Vol. 5, No. 5; October 2015 Time Series Analysis of United States of America Crude Oil and Petroleum Products Importations from Saudi Arabia Olayan
Regression Models. Chapter 4. Introduction. Introduction. Introduction
 Chapter 4 Regression Models Quantitative Analysis for Management, Tenth Edition, by Render, Stair, and Hanna 008 Prentice-Hall, Inc. Introduction Regression analysis is a very valuable tool for a manager
TIME SERIES ANALYSIS AND FORECASTING USING THE STATISTICAL MODEL ARIMA
 CHAPTER 6 TIME SERIES ANALYSIS AND FORECASTING USING THE STATISTICAL MODEL ARIMA 6.1. Introduction A time series is a sequence of observations ordered in time. A basic assumption in the time series analysis
Time series and Forecasting
 Chapter 2 Time series and Forecasting 2.1 Introduction Data are frequently recorded at regular time intervals, for instance, daily stock market indices, the monthly rate of inflation or annual profit figures.
Ch 13 & 14 - Regression Analysis
 Ch 3 & 4 - Regression Analysis Simple Regression Model I. Multiple Choice:. A simple regression is a regression model that contains a. only one independent variable b. only one dependent variable c. more
The point is located eight units to the right of the y-axis and two units above the x-axis. A) ( 8, 2) B) (8, 2) C) ( 2, 8) D) (2, 8) E) ( 2, 8)
 ( 8, 2) B) (8, 2) C) ( 2, 8) D) (2, 8) E) ( 2, 8)") Name: Date: 1. Find the coordinates of the point. The point is located eight units to the right of the y-axis and two units above the x-axis. A) ( 8, ) B) (8, ) C) (, 8) D) (, 8) E) (, 8). Find the coordinates
Name: Date: 1. Find the coordinates of the point. The point is located eight units to the right of the y-axis and two units above the x-axis. A) ( 8, ) B) (8, ) C) (, 8) D) (, 8) E) (, 8). Find the coordinates
Hypothesis testing Goodness of fit Multicollinearity Prediction. Applied Statistics. Lecturer: Serena Arima
 Applied Statistics Lecturer: Serena Arima Hypothesis testing for the linear model Under the Gauss-Markov assumptions and the normality of the error terms, we saw that β N(β, σ 2 (X X ) 1 ) and hence s
Jackson County 2014 Weather Data
 Jackson County 2014 Weather Data 62 Years of Weather Data Recorded at the UF/IFAS Marianna North Florida Research and Education Center Doug Mayo Jackson County Extension Director 1952-2008 Rainfall Data
Lecture 5: Omitted Variables, Dummy Variables and Multicollinearity
 Lecture 5: Omitted Variables, Dummy Variables and Multicollinearity R.G. Pierse 1 Omitted Variables Suppose that the true model is Y i β 1 + β X i + β 3 X 3i + u i, i 1,, n (1.1) where β 3 0 but that the
FEB DASHBOARD FEB JAN FEB MAR APR MAY JUN JUL AUG SEP OCT NOV DEC
 Positive Response Compliance 215 Compliant 215 Non-Compliant 216 Compliant 216 Non-Compliant 1% 87% 96% 86% 96% 88% 89% 89% 88% 86% 92% 93% 94% 96% 94% 8% 6% 4% 2% 13% 4% 14% 4% 12% 11% 11% 12% JAN MAR
Multiple Regression. Peerapat Wongchaiwat, Ph.D.
 Peerapat Wongchaiwat, Ph.D. wongchaiwat@hotmail.com The Multiple Regression Model Examine the linear relationship between 1 dependent (Y) & 2 or more independent variables (X i ) Multiple Regression Model
ECON 4230 Intermediate Econometric Theory Exam
 ECON 4230 Intermediate Econometric Theory Exam Multiple Choice (20 pts). Circle the best answer. 1. The Classical assumption of mean zero errors is satisfied if the regression model a) is linear in the
YACT (Yet Another Climate Tool)? The SPI Explorer
? The SPI Explorer") YACT (Yet Another Climate Tool)? The SPI Explorer Mike Crimmins Assoc. Professor/Extension Specialist Dept. of Soil, Water, & Environmental Science The University of Arizona Yes, another climate tool for
YACT (Yet Another Climate Tool)? The SPI Explorer Mike Crimmins Assoc. Professor/Extension Specialist Dept. of Soil, Water, & Environmental Science The University of Arizona Yes, another climate tool for
Inference with Simple Regression
 1 Introduction Inference with Simple Regression Alan B. Gelder 06E:071, The University of Iowa 1 Moving to infinite means: In this course we have seen one-mean problems, twomean problems, and problems
Figure 1. Time Series Plot of arrivals from Western Europe
 FORECASTING TOURIST ARRIVALS TO SRI LANKA FROM WESTERN EUROPE K. M. U. B. Konarasinghe 1 * 1 Institute of Mathematics & Management, Nugegoda, Sri Lanka INTRODUCTION Sri Lanka was re-emerging after defeating
The Spectrum of Broadway: A SAS
 The Spectrum of Broadway: A SAS PROC SPECTRA Inquiry James D. Ryan and Joseph Earley Emporia State University and Loyola Marymount University Abstract This paper describes how to use the sophisticated
P7.7 A CLIMATOLOGICAL STUDY OF CLOUD TO GROUND LIGHTNING STRIKES IN THE VICINITY OF KENNEDY SPACE CENTER, FLORIDA
 P7.7 A CLIMATOLOGICAL STUDY OF CLOUD TO GROUND LIGHTNING STRIKES IN THE VICINITY OF KENNEDY SPACE CENTER, FLORIDA K. Lee Burns* Raytheon, Huntsville, Alabama Ryan K. Decker NASA, Marshall Space Flight
peak half-hourly New South Wales
 Forecasting long-term peak half-hourly electricity demand for New South Wales Dr Shu Fan B.S., M.S., Ph.D. Professor Rob J Hyndman B.Sc. (Hons), Ph.D., A.Stat. Business & Economic Forecasting Unit Report
DAILY QUESTIONS 28 TH JUNE 18 REASONING - CALENDAR
 DAILY QUESTIONS 28 TH JUNE 18 REASONING - CALENDAR LEAP AND NON-LEAP YEAR *A non-leap year has 365 days whereas a leap year has 366 days. (as February has 29 days). *Every year which is divisible by 4
Lesson 8: Variability in a Data Distribution
 Classwork Example 1: Comparing Two Distributions Robert s family is planning to move to either New York City or San Francisco. Robert has a cousin in San Francisco and asked her how she likes living in
How Well Are Recessions and Recoveries Forecast? Prakash Loungani, Herman Stekler and Natalia Tamirisa
 How Well Are Recessions and Recoveries Forecast? Prakash Loungani, Herman Stekler and Natalia Tamirisa 1 Outline Focus of the study Data Dispersion and forecast errors during turning points Testing efficiency
WHEN IS IT EVER GOING TO RAIN? Table of Average Annual Rainfall and Rainfall For Selected Arizona Cities
 WHEN IS IT EVER GOING TO RAIN? Table of Average Annual Rainfall and 2001-2002 Rainfall For Selected Arizona Cities Phoenix Tucson Flagstaff Avg. 2001-2002 Avg. 2001-2002 Avg. 2001-2002 October 0.7 0.0
STAT 212 Business Statistics II 1
 STAT 1 Business Statistics II 1 KING FAHD UNIVERSITY OF PETROLEUM & MINERALS DEPARTMENT OF MATHEMATICAL SCIENCES DHAHRAN, SAUDI ARABIA STAT 1: BUSINESS STATISTICS II Semester 091 Final Exam Thursday Feb
TIGER: Tracking Indexes for the Global Economic Recovery By Eswar Prasad, Karim Foda, and Ethan Wu
 TIGER: Tracking Indexes for the Global Economic Recovery By Eswar Prasad, Karim Foda, and Ethan Wu Technical Appendix Methodology In our analysis, we employ a statistical procedure called Principal Component
Charting Employment Loss in North Carolina Textiles 1
 P. Conway 14 January 2004 Charting Employment Loss in North Carolina Textiles 1 The job losses in North Carolina manufacturing, and the textiles industry in particular, are most often attributed to the
Chapter 4: Regression Models
 Sales volume of company 1 Textbook: pp. 129-164 Chapter 4: Regression Models Money spent on advertising 2 Learning Objectives After completing this chapter, students will be able to: Identify variables,
. regress lchnimp lchempi lgas lrtwex befile6 affile6 afdec6 t
 BOSTON COLLEGE Department of Economics EC 228 Econometrics, Prof. Baum, Ms. Yu, Fall 2003 Problem Set 7 Solutions Problem sets should be your own work. You may work together with classmates, but if you
LECTURE 10. Introduction to Econometrics. Multicollinearity & Heteroskedasticity
 LECTURE 10 Introduction to Econometrics Multicollinearity & Heteroskedasticity November 22, 2016 1 / 23 ON PREVIOUS LECTURES We discussed the specification of a regression equation Specification consists
How are adding integers and subtracting integers related? Work with a partner. Use integer counters to find 4 2. Remove 2 positive counters.
 . How are adding integers and subtracting integers related? ACTIVITY: Work with a partner. Use integer counters to find 4. Start with 4 positive counters. Remove positive counters. What is the total number
Long-term Water Quality Monitoring in Estero Bay
 Long-term Water Quality Monitoring in Estero Bay Keith Kibbey Laboratory Director Lee County Environmental Laboratory Division of Natural Resource Management Estero Bay Monitoring Programs Three significant
Summary of Seasonal Normal Review Investigations CWV Review
 Summary of Seasonal Normal Review Investigations CWV Review DESC 31 st March 2009 1 Contents Stage 1: The Composite Weather Variable (CWV) An Introduction / background Understanding of calculation Stage
Outline. Nature of the Problem. Nature of the Problem. Basic Econometrics in Transportation. Autocorrelation
 1/30 Outline Basic Econometrics in Transportation Autocorrelation Amir Samimi What is the nature of autocorrelation? What are the theoretical and practical consequences of autocorrelation? Since the assumption
Econometrics Review questions for exam
 Econometrics Review questions for exam Nathaniel Higgins nhiggins@jhu.edu, 1. Suppose you have a model: y = β 0 x 1 + u You propose the model above and then estimate the model using OLS to obtain: ŷ =
Changing Hydrology under a Changing Climate for a Coastal Plain Watershed
 Changing Hydrology under a Changing Climate for a Coastal Plain Watershed David Bosch USDA-ARS, Tifton, GA Jeff Arnold ARS Temple, TX and Peter Allen Baylor University, TX SEWRU Objectives 1. Project changes
Winter Season Resource Adequacy Analysis Status Report
 Winter Season Resource Adequacy Analysis Status Report Tom Falin Director Resource Adequacy Planning Markets & Reliability Committee October 26, 2017 Winter Risk Winter Season Resource Adequacy and Capacity
ANSWERS CHAPTER 15 THINK IT OVER EXERCISES. Nick Lee and Mike Peters think it over. No answers required.
 ANSWERS CHAPTER 15 THINK IT OVER think it over No answers required. EXERCISES 1. (a) Yes it could but you would have to be careful in interpreting the results. Transformers tend to be situated outside
Chapter 5: Forecasting
 1 Textbook: pp. 165-202 Chapter 5: Forecasting Every day, managers make decisions without knowing what will happen in the future 2 Learning Objectives After completing this chapter, students will be able
Mr. XYZ. Stock Market Trading and Investment Astrology Report. Report Duration: 12 months. Type: Both Stocks and Option. Date: Apr 12, 2011
 Mr. XYZ Stock Market Trading and Investment Astrology Report Report Duration: 12 months Type: Both Stocks and Option Date: Apr 12, 2011 KT Astrologer Website: http://www.softwareandfinance.com/magazine/astrology/kt_astrologer.php
Regression Models - Introduction
 Regression Models - Introduction In regression models there are two types of variables that are studied: A dependent variable, Y, also called response variable. It is modeled as random. An independent
Econ 300/QAC 201: Quantitative Methods in Economics/Applied Data Analysis. 17th Class 7/1/10
 Econ 300/QAC 201: Quantitative Methods in Economics/Applied Data Analysis 17th Class 7/1/10 The only function of economic forecasting is to make astrology look respectable. --John Kenneth Galbraith show
Analysis. Components of a Time Series
 Module 8: Time Series Analysis 8.2 Components of a Time Series, Detection of Change Points and Trends, Time Series Models Components of a Time Series There can be several things happening simultaneously
TIGER: Tracking Indexes for the Global Economic Recovery By Eswar Prasad and Karim Foda
 TIGER: Tracking Indexes for the Global Economic Recovery By Eswar Prasad and Karim Foda Technical Appendix Methodology In our analysis, we employ a statistical procedure called Principal Compon Analysis
2003 Water Year Wrap-Up and Look Ahead
 2003 Water Year Wrap-Up and Look Ahead Nolan Doesken Colorado Climate Center Prepared by Odie Bliss http://ccc.atmos.colostate.edu Colorado Average Annual Precipitation Map South Platte Average Precipitation
Algae and Dissolved Oxygen Dynamics of Landa Lake and the Upper Spring Run
 Algae and Dissolved Oxygen Dynamics of Landa Lake and the Upper Spring Run Why study algae and dissolved oxygen dynamics of Landa Lake and the Upper Spring Run? During low-flow conditions, extensive algal