Chapter 9: Assessing Studies Based on Multiple Regression. Copyright 2011 Pearson Addison-Wesley. All rights reserved.
|
|
|
- Suzanna Dorsey
- 6 years ago
- Views:
Transcription
1 Chapter 9: Assessing Studies Based on Multiple Regression
2 Outline 1. Internal and External Validity 2. Threats to Internal Validity a) Omitted variable bias b) Functional form misspecification c) Errors-in-variables bias d) Missing data and sample selection bias e) Simultaneous causality bias 3. Application to Test Scores 9-2
3 Internal and External Validity Is there a systematic way to assess (critique) regression studies? We know the strengths of multiple regression but what are the pitfalls? We will list the most common reasons that multiple regression estimates, based on observational data, can result in biased estimates of the causal effect of interest. In the test score application, let us try to address these threats and assess what threats remain. After all, what have we learned about the effect on test scores of class size reduction? 9-3
4 A Framework for Assessing Statistical Studies: Internal and External Validity Internal validity: the statistical inferences about causal effects are valid for the population being studied. External validity: the statistical inferences can be generalized to other populations and settings (legal, political, institutional, social, physical, demographic variations) 9-4
5 Threats to External Validity Assessing threats to external validity requires detailed knowledge and judgment on a case-by-case basis. How do results about test scores in California generalize? Differences in populations California in 2011? Massachusetts in 2011? Mexico in 2011? Differences in settings different legal requirements (e.g. special education) different treatment of bilingual education Differences in teacher characteristics 9-5
6 Threats to Internal Validity of Multiple Regression Analysis Internal validity: the statistical inferences about causal effects are valid for the population being studied. Five threats to the internal validity of regression studies: Omitted variable bias Wrong functional form Errors-in-variables bias Sample selection bias Simultaneous causality bias All imply that E(u i X 1i,,X ki ) 0 (or conditional mean independence fails) making OLS biased & inconsistent 9-6
7 1. Omitted variable bias Omitted variable bias arises if an omitted variable is both: I. a determinant of Y II. correlated with at least one regressor If the multiple regression includes control variables, we still need to ask whether there are OVs that are not adequately controlled for. The concern remains that the error term is correlated with the variable of interest even after including control variables. 9-7
8 Solutions to omitted variable bias 1. If the omitted causal variable can be measured, include it as an additional regressor in multiple regression; 2. If you have data on one or more controls and they are adequate (in the sense of conditional mean independence plausibly holding) then include the control variables; 3. Possibly, use panel data in which each entity (individual) is observed more than once (to be studied later); 4. If the omitted variable(s) cannot be measured, use instrumental variables regression (to be studied later); 5. Run a randomized controlled experiment. Remember, if X is randomly assigned, then X necessarily will be distributed independently of u; thus E(u X = x) =
9 2. Misspecified/Wrong functional form Arises if the functional form is incorrect for example, an interaction or polynomial term is omitted. Then term becomes part of error term, causing correlation b/w error and regressor, biasing OLS estimates. Solutions to functional form misspecification 1. If dependent variable is continuous: Use the appropriate nonlinear specifications in X (logarithms, interactions, etc.) scatter plots are suggestive 2. If dependent variable is discrete (eg binary): Need an extension of multiple regression methods ( probit or logit analysis for binary dependent variables) (to be studied later) 9-9
10 3. Errors-in-variables bias So far we have assumed that X is measured without error. In reality, economic data often have measurement error Data entry errors Recollection errors in surveys (When did you start your current job?) Ambiguous questions (What was your income last year?) Dishonest responses to surveys (What is the value of your financial assets? How often do you drink and drive?) 9-10
11 Errors-in-variables bias, ctd. In general, measurement error in a regressor results in errors-in-variables bias. A bit of math shows that errors-in-variables typically leads to correlation between the measured variable and the regression error. Consider the single-regressor model: Y i = β 0 + β 1 X i + u i and suppose E(u i X i ) = 0). Let X i = unmeasured true value of X (unbserved) = mis-measured version of X (observed) 9-11
12 Then Y i = β 0 + β 1 X i + u i = β 0 + β 1 + [β 1 (X i X ) + u i ] i So the regression you run is, ũ Y i = β 0 + β 1 +, where = β 1 (X i ) + u i X i ũ i Typically is correlated with so is biased: cov(, ) = cov(, β 1 (X i ) + u i ) ũ i ũi 1 = β 1 cov(, X i ) + cov(,u i ) It is often plausible that cov(,u i ) = 0 (if E(u i X i ) = 0 then i X cov(,u i ) = 0 if the measurement error in is uncorrelated with u i ). But typically cov(, X i ) 0 i ˆβ 9-12
13 Errors-in-variables bias, ctd. ũ i Y i = β 0 + β 1 X +, where = β 1 (X i i ũ i ) + u i cov(, ũ ) = β 1 cov( X, X i ) if cov(,u i ) = 0 i i To get some intuition for the problem, consider two special cases: A.Classical measurement error B. Best guess measurement error X i 9-13
14 A. Classical measurement error The classical measurement error model assumes that = X i + v i, where v i is mean-zero random noise with corr(x i, v i ) = 0 and corr(u i, v i ) = 0. Under the classical measurement error model, is biased towards zero. Intuition: Suppose you add to the true variable X a huge amount of random noise to X ~ create. Then X will be virtually uncorrelated to Y i (and to everything else), i and the OLS estimate will have expectation zero (recall the estimate is a ratio, with numerator = cov(y,x) in case of single regressor). If you add just a bit of noise, you still dilute correlation with Y and lower OLS estimate toward 0. ˆ 1 ˆβ 9-14
15 Classical measurement error: the math = X i + v i, where corr(x i, v i ) = 0 and corr(u i, v i ) = 0. Then var( ) = + so ˆβ 2 2 σ X σ v 2 X X σ v cov(, X i ) = cov(x i + v i, v i ) = i cov(, ) = β 1 i i ũ σ v so = ˆβ 1 1 p β σ 2 v 1 β1 σ 2 X So is biased towards zero. 2 2 v 1 2 σ X σ X = = Classical measurement error model does assume corr(x i, v i )=0. σ β1 σ β1 2 2 v 2 σ X σ σ 2 X 2 2 X + σ v β1 9-15
16 B. Best Guess measurement error Suppose the respondent doesn t remember X i, but makes a best guess of the form X = E(X i W i ), where E(u i W i ) = 0. i Then, ũ cov(, ) = cov(, β 1 (X i ) + u i ) cov(, X i i X i X X i X X i X X i = β 1 cov(, X i ) + cov(,u i ) 1 i i ) = 0 because = E(X i W i ) (because is the best guess, the error X i is uncorrelated with ). Cov(,u i ) = 0 because E(u i W i ) = 0 ( is a function of W i and E(u i W i ) = 0). ũ i Thus cov(, ) = 0, so is unbiased - exception. ˆβ
17 Best guess measurement error model, ctd. Under the Best Guess model, you still have measurement error you don t observe the true value of X i but there this measurement error doesn t introduce bias into! ˆβ 1 The best guess model is extreme it isn t enough to make a good guess, you need the best guess = E(X i W i ), that is, the conditional expectation of X given W, where E(u i W i ) = 0. Unbiasedness is good news, no? Yes, except that the best guess model assumes extreme rationality in the form of precise conditional expectations not realistic 9-17
18 Lessons from the classical & best-guess models: The amount of bias in depends on the nature of the measurement error these models are two special cases. If there is pure noise added to X i, then is biased towards zero. The best guess model is unrealistic ˆβ 1 In general, if you think there is measurement error, you should worry about measurement error bias. The potential importance of measurement error bias depends on how the data are collected. Some administrative data (e.g. number of teachers in a school district) are often quite accurate. Survey data on sensitive questions (How much do you earn?) often have considerable measurement error ˆβ 1
19 Solutions to errors-in-variables bias 1. Obtain better data (often easier said than done). 2. Develop a specific model of the measurement error process. This is only possible if a lot is known about the nature of the measurement error for example a subsample of the data are cross-checked using administrative records and the discrepancies are analyzed and modeled. (Very specialized; we won t pursue this here.) 3. Instrumental variables regression (to be studied later) 9-19
20 4. Missing data and sample selection bias Data are often missing. Sometimes missing data introduces bias, sometimes it doesn t. It is useful to consider three cases: 1. Data are missing at random. 2. Data are missing based on the value of one or more X s 3. Data are missing based in part on the value of Y or u Cases 1, 2 do not introduce bias: the standard errors are larger ˆβ 1 than otherwise but is unbiased. Case 3 introduces sample selection bias. 9-20
21 Missing data: Case 1 1. Data are missing at random Suppose you took a simple random sample of 100 workers and recorded the answers on paper but your dog ate 20 of the response sheets (selected at random) before you could enter them into the computer. This is equivalent to you having taken a simple random sample of 80 workers, so the accident didn t introduce bias. 9-21
22 Missing data: Case 2 2. Data are missing based on a value of one of the X s In the test score/class size application, suppose you restrict your analysis to the subset of school districts with STR < 20. By only considering districts with small class sizes you won t be able to say anything about districts with large class sizes, but focusing on just the small-class districts doesn t introduce bias. This is equivalent to having missing data, where the data are missing if STR > 20. Generally, if data are missing based only on the X s, no bias is introduced in the OLS estimator. 9-22
23 Missing data: Case 3 3. Data are missing based in part on the value of Y or u In general this type of missing data does introduce bias into the OLS estimator. This type of bias is also called sample selection bias. Sample selection bias arises when a selection process: (i) influences the availability of data, and (ii) is related to the dependent variable 9-23
24 Example #1: Height of undergraduates To estimate the mean height of undergraduate males, you collect your data (obtain your sample) by standing outside the basketball team s locker room and measuring heights of passers-by! Is this a good design of sampling Will it yield an unbiased estimate of undergraduate height? No! You have sampled individuals in a way that is related to the outcome Y (height), which causes bias. Another example: Landon wins! anecdote in textbook. 9-24
25 Example #2: Mutual funds Do actively managed mutual funds outperform hold-themarket funds? Empirical strategy: Sampling scheme: simple random sampling of mutual funds available to the public on a given date. Data: returns for the preceding 10 years. Estimator: average ten-year return of the sample mutual funds, minus ten-year return on S&P500 Is there sample selection bias? (Equivalently, are data missing based in part on the value of Y or u?) Yes, there is survivorship bias sampling misses data on mutual funds that performed so poorly that they were canceled in the interim. 9-25
26 Sample selection bias induces correlation between a regressor and the error term. Mutual fund example: return i = β 0 + β 1 managed_fund i + u i Being a managed fund in the sample (managed_fund i = 1) means that your return was better than failed managed funds, which are not in the sample so corr(managed_fund i,u i ) 0. The surviving mutual funds are the basketball players of mutual funds. 9-26
27 Example #3: returns to education What is the return to an additional year of education? Empirical strategy: Sampling scheme: simple random sample of employed college grads (employed, so we have wage data) Data: earnings and years of education Estimator: regress ln(earnings) on years_education Ignore issues of omitted variable bias and measurement error is there sample selection bias? How does this relate to the basketball player example? One is sampling only the employed what about the unemployed who are college grads? Selection bias again. 9-27
28 Solutions to sample selection bias Collect the sample in a way that avoids sample selection. Basketball player example: obtain a true random sample of undergraduates, e.g. select students at random from the enrollment administrative list. Mutual funds example: change the sample population from those available at the end of the ten-year period, to those available at the beginning of the period (include failed funds) Returns to education example: sample college graduates, not workers (include the unemployed) Randomized controlled experiment. Construct a model of the sample selection problem and estimate it (more sophisticated material). 9-28
29 5. Simultaneous causality bias So far we have assumed that X causes Y. What if Y causes X, too? Example: Class size effect Low STR results in better test scores What if districts with low test scores are given extra resources and pressure to lower STR as a partial solution? What does this mean for a regression of TestScore on STR? 9-29
30 Simultaneous causality bias in equations (a) Causal effect on Y of X: Y i = β 0 + β 1 X i + u i (b) Causal effect on X of Y: X i = γ 0 + γ 1 Y i + v i Large u i means large Y i, which implies large X i (if γ 1 >0) Thus corr(x i,u i ) 0 ˆβ 1 Thus is biased and inconsistent. Example: A district with particularly bad test scores given the STR (negative u i ) receives extra resources, thereby lowering its STR; so STR i and u i are correlated 9-30
31 Solutions to simultaneous causality bias 1. Run a randomized controlled experiment. Because X i is chosen at random by the experimenter, there is no feedback from the outcome variable to Y i (assuming perfect compliance). 2. Develop and estimate a complete model of both directions of causality. This is the idea behind many large macro models (e.g. Federal Reserve Bank-US). This is extremely difficult in practice. 3. Use instrumental variables regression to estimate the causal effect of interest (effect of X on Y, ignoring effect of Y on X) to be studied later, ch
32 Internal and External Validity When the Regression is Used for Forecasting Forecasting and estimation of causal effects are quite different objectives. For forecasting, R 2 matters (a lot!) Omitted variable bias isn t a problem! Interpreting coefficients in forecasting models is not important the important thing is a good fit and a model you can trust to work in your application External validity is paramount: the model estimated using historical data must hold into the (near) future More on forecasting when we take up time series data 9-32
33 Applying External and Internal Validity: Test Scores and Class Size Objective: Assess the threats to the internal and external validity of the empirical analysis of the California test scores External validity Compare results for California and Massachusetts Think Internal validity Go through the list of five potential threats to internal validity and think 9-33
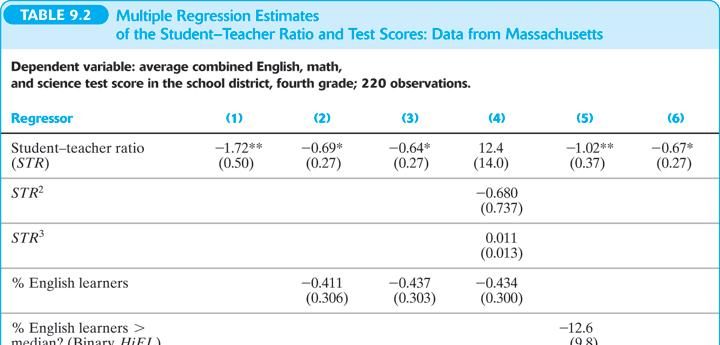
34 Check of external validity We will compare the California study to one in Massachusetts The Massachusetts data set 220 elementary school districts Test: 1998 MCAS test fourth grade total (Math + English + Science) Variables: STR, TestScore, PctEL, LunchPct, Income 9-34

35 The MA data: summary statistics 9-35
36 Test scores vs. Income & regression lines: MA data 9-36
37 9-37

38 How do the Mass and California results compare? Logarithmic v. cubic function for STR? About same, cubic better Evidence of nonlinearity in TestScore-STR relation? No: F Is there a significant HiEL STR interaction? No: (3)vs(6);(5) 9-38
39 Predicted effects for a class size reduction of Linear specification (2) for Mass: TestScore = STR 0.437PctEL 0.582LunchPct (21.3) (0.27) (0.303) (0.097) 3.07Income Income Income 3 (2.35) (0.085 (0.0010) Estimated effect = (-2) = 1.28 ˆβ 1 Standard error = = 0.54 NOTE: var(ay) = a 2 var(y); SE(a ) = a SE( ) 95% CI = 1.28 ± = (0.22, 2.34) 9-39
40 Predicted effects in nonlinear models Use the before and after method: TestScore = STR 0.680STR STR PctEL 0.587LunchPct 3.48Income Income Income 3 Estimated reduction from 20 students to 18: TestScore = [ ] [ ] = 1.98 Compare with estimate from linear model of 1.28 SE of this estimated effect: use the rearrange the regression ( transform the regressors ) method 9-40
41 Summary of Findings for Massachusetts Coefficient on STR falls from 1.72 to 0.69 when control variables for student and district characteristics are included an indication that the original estimate had OV bias. The class size effect is statistically significant at the 1% significance level, after controlling for student and district characteristics No statistical evidence on nonlinearities in the TestScore STR relation No statistical evidence of STR PctEL interaction 9-41

42 Comparison of estimated class size effects: CA vs. MA 9-42
43 Summary: Comparison of California and Massachusetts Regression Analyses Class size effect falls in both CA, MA data when student and district control variables are added. Class size effect statistically significant in both CA, MA data Estimated effect of a 2-student reduction in STR is quantitatively similar for CA, MA: test scores rise about 0.08 standard deviations (small, equivalent to one tenth of difference b/w 50 th, 75 th percentiles) Neither data set shows evidence of STR PctEL interaction. Some evidence of STR nonlinearity in CA data, but not in MA data 9-43
44 Step back: what are the remaining threats to internal validity in the test score/class size example? 1. Omitted variable bias? What causal factors are missing? Student characteristics such as native ability Access to outside learning opportunities Other district quality measures such as teacher quality The regressions attempt to control for these omitted factors using control variables that are not necessarily causal but are correlated with the omitted causal variables: district demographics (income, % free lunch eligible) Fraction of English learners 9-44
45 Omitted variable bias, ctd. Are the control variables effective? That is, after including the control variables, is the error term uncorrelated with STR? Answering this requires using judgment. There is some evidence that they are effective: The STR coefficient doesn t change much when the control variables specifications change The results for California and Massachusetts are similar so if there is OV bias remaining, that OV bias would need to be similar in the two data sets 9-45
46 2. Wrong functional form? We have tried quite a few different functional forms, in both the California and Mass. data Nonlinear effects are modest Plausibly, this is not a major threat at this point. 3. Errors-in-variables bias? The data are administrative so it s unlikely that there are substantial reporting/typo type errors. STR is a district-wide measure, so students who take the test might not have experienced the measured STR for the district a complicated type of measurement error Ideally we would like data on individual students, by grade level. 9-46
47 4. Sample selection bias? Sample is all elementary public school districts (in California and in Mass.) there are no missing data No reason to think that selection is a problem. 5. Simultaneous causality bias? School funding equalization based on test scores could cause simultaneous causality. This was not in place in California or Mass. during these samples, so simultaneous causality bias is arguably not important. 9-47
48 Additional example for class discussion Does appearing on America s Most Wanted TV show increase your chance of being caught? reference: Thomas Miles (2005), Estimating the Effect of America s Most Wanted: A Duration Analysis of Wanted Fugitives, Journal of Law and Economics, Observational unit: Fugitive criminals Sampling scheme: 1200 male fugitives, from FBI, NYCPD, LAPD, PhilaPD, USPS, Federal Marshalls Web sites (all data were downloaded from the Web) Dependent variable: length of spell (years until capture) Regressors: o Appearance on America s Most Wanted (175 of the 1200) (then airing on Fox, Saturdays, 9pm) o type of offence, personal characteristics 9-48
49 America s Most Wanted: Threats to Internal and External Validity External validity: What would you want to extrapolate the results to having the show air longer? Putting on a second show of the same type? Selection of cases? Be precise. Internal validity: How important are these threats? 1. Omitted variable bias 2. Wrong functional form 3. Errors-in-variables bias 4. Sample selection bias 5. Simultaneous causality bias 9-49
Assessing Studies Based on Multiple Regression
 Assessing Studies Based on Multiple Regression Outline 1. Internal and External Validity 2. Threats to Internal Validity a. Omitted variable bias b. Functional form misspecification c. Errors-in-variables
Introduction to Econometrics. Assessing Studies Based on Multiple Regression
 Introduction to Econometrics The statistical analysis of economic (and related) data STATS301 Assessing Studies Based on Multiple Regression Titulaire: Christopher Bruffaerts Assistant: Lorenzo Ricci 1
6. Assessing studies based on multiple regression
 6. Assessing studies based on multiple regression Questions of this section: What makes a study using multiple regression (un)reliable? When does multiple regression provide a useful estimate of the causal
Linear Regression with Multiple Regressors
 Linear Regression with Multiple Regressors (SW Chapter 6) Outline 1. Omitted variable bias 2. Causality and regression analysis 3. Multiple regression and OLS 4. Measures of fit 5. Sampling distribution
Linear Regression with Multiple Regressors
 Linear Regression with Multiple Regressors (SW Chapter 6) Outline 1. Omitted variable bias 2. Causality and regression analysis 3. Multiple regression and OLS 4. Measures of fit 5. Sampling distribution
Nonlinear Regression Functions
 Nonlinear Regression Functions (SW Chapter 8) Outline 1. Nonlinear regression functions general comments 2. Nonlinear functions of one variable 3. Nonlinear functions of two variables: interactions 4.
Chapter 6: Linear Regression With Multiple Regressors
 Chapter 6: Linear Regression With Multiple Regressors 1-1 Outline 1. Omitted variable bias 2. Causality and regression analysis 3. Multiple regression and OLS 4. Measures of fit 5. Sampling distribution
Regression with a Single Regressor: Hypothesis Tests and Confidence Intervals
 Regression with a Single Regressor: Hypothesis Tests and Confidence Intervals (SW Chapter 5) Outline. The standard error of ˆ. Hypothesis tests concerning β 3. Confidence intervals for β 4. Regression
Applied Statistics and Econometrics
 Applied Statistics and Econometrics Lecture 6 Saul Lach September 2017 Saul Lach () Applied Statistics and Econometrics September 2017 1 / 53 Outline of Lecture 6 1 Omitted variable bias (SW 6.1) 2 Multiple
Hypothesis Tests and Confidence Intervals in Multiple Regression
 Hypothesis Tests and Confidence Intervals in Multiple Regression (SW Chapter 7) Outline 1. Hypothesis tests and confidence intervals for one coefficient. Joint hypothesis tests on multiple coefficients
Introduction to Econometrics. Multiple Regression (2016/2017)
") Introduction to Econometrics STAT-S-301 Multiple Regression (016/017) Lecturer: Yves Dominicy Teaching Assistant: Elise Petit 1 OLS estimate of the TS/STR relation: OLS estimate of the Test Score/STR relation:
Introduction to Econometrics STAT-S-301 Multiple Regression (016/017) Lecturer: Yves Dominicy Teaching Assistant: Elise Petit 1 OLS estimate of the TS/STR relation: OLS estimate of the Test Score/STR relation:
4. Nonlinear regression functions
 4. Nonlinear regression functions Up to now: Population regression function was assumed to be linear The slope(s) of the population regression function is (are) constant The effect on Y of a unit-change
Introduction to Econometrics
 Introduction to Econometrics STAT-S-301 Experiments and Quasi-Experiments (2016/2017) Lecturer: Yves Dominicy Teaching Assistant: Elise Petit 1 Why study experiments? Ideal randomized controlled experiments
The F distribution. If: 1. u 1,,u n are normally distributed; and 2. X i is distributed independently of u i (so in particular u i is homoskedastic)
") The F distribution If: 1. u 1,,u n are normally distributed; and. X i is distributed independently of u i (so in particular u i is homoskedastic) then the homoskedasticity-only F-statistic has the F q,n-k
The F distribution If: 1. u 1,,u n are normally distributed; and. X i is distributed independently of u i (so in particular u i is homoskedastic) then the homoskedasticity-only F-statistic has the F q,n-k
Applied Statistics and Econometrics
 Applied Statistics and Econometrics Lecture 7 Saul Lach September 2017 Saul Lach () Applied Statistics and Econometrics September 2017 1 / 68 Outline of Lecture 7 1 Empirical example: Italian labor force
ECO321: Economic Statistics II
 ECO321: Economic Statistics II Chapter 6: Linear Regression a Hiroshi Morita hmorita@hunter.cuny.edu Department of Economics Hunter College, The City University of New York a c 2010 by Hiroshi Morita.
Experiments and Quasi-Experiments
 Experiments and Quasi-Experiments (SW Chapter 13) Outline 1. Potential Outcomes, Causal Effects, and Idealized Experiments 2. Threats to Validity of Experiments 3. Application: The Tennessee STAR Experiment
Introduction to Econometrics. Multiple Regression
 Introduction to Econometrics The statistical analysis of economic (and related) data STATS301 Multiple Regression Titulaire: Christopher Bruffaerts Assistant: Lorenzo Ricci 1 OLS estimate of the TS/STR
The Simple Linear Regression Model
 The Simple Linear Regression Model Lesson 3 Ryan Safner 1 1 Department of Economics Hood College ECON 480 - Econometrics Fall 2017 Ryan Safner (Hood College) ECON 480 - Lesson 3 Fall 2017 1 / 77 Bivariate
Chapter 7. Hypothesis Tests and Confidence Intervals in Multiple Regression
 Chapter 7 Hypothesis Tests and Confidence Intervals in Multiple Regression Outline 1. Hypothesis tests and confidence intervals for a single coefficie. Joint hypothesis tests on multiple coefficients 3.
An example to start off with
 Impact Evaluation Technical Track Session IV Instrumental Variables Christel Vermeersch Human Development Human Network Development Network Middle East and North Africa Region World Bank Institute Spanish
2. Linear regression with multiple regressors
 2. Linear regression with multiple regressors Aim of this section: Introduction of the multiple regression model OLS estimation in multiple regression Measures-of-fit in multiple regression Assumptions
Linear Regression with one Regressor
 1 Linear Regression with one Regressor Covering Chapters 4.1 and 4.2. We ve seen the California test score data before. Now we will try to estimate the marginal effect of STR on SCORE. To motivate these
Introduction to Econometrics
 Introduction to Econometrics STAT-S-301 Panel Data (2016/2017) Lecturer: Yves Dominicy Teaching Assistant: Elise Petit 1 Regression with Panel Data A panel dataset contains observations on multiple entities
 STOCKHOLM UNIVERSITY Department of Economics Course name: Empirical Methods Course code: EC40 Examiner: Lena Nekby Number of credits: 7,5 credits Date of exam: Friday, June 5, 009 Examination time: 3 hours
Introduction to Econometrics. Regression with Panel Data
 Introduction to Econometrics The statistical analysis of economic (and related) data STATS301 Regression with Panel Data Titulaire: Christopher Bruffaerts Assistant: Lorenzo Ricci 1 Regression with Panel
8. Instrumental variables regression
 8. Instrumental variables regression Recall: In Section 5 we analyzed five sources of estimation bias arising because the regressor is correlated with the error term Violation of the first OLS assumption
Applied Statistics and Econometrics
 Applied Statistics and Econometrics Lecture 13 Nonlinearities Saul Lach October 2018 Saul Lach () Applied Statistics and Econometrics October 2018 1 / 91 Outline of Lecture 13 1 Nonlinear regression functions
Empirical approaches in public economics
 Empirical approaches in public economics ECON4624 Empirical Public Economics Fall 2016 Gaute Torsvik Outline for today The canonical problem Basic concepts of causal inference Randomized experiments Non-experimental
ECON Introductory Econometrics. Lecture 16: Instrumental variables
 ECON4150 - Introductory Econometrics Lecture 16: Instrumental variables Monique de Haan (moniqued@econ.uio.no) Stock and Watson Chapter 12 Lecture outline 2 OLS assumptions and when they are violated Instrumental
Review of Econometrics
 Review of Econometrics Zheng Tian June 5th, 2017 1 The Essence of the OLS Estimation Multiple regression model involves the models as follows Y i = β 0 + β 1 X 1i + β 2 X 2i + + β k X ki + u i, i = 1,...,
ECONOMETRICS HONOR S EXAM REVIEW SESSION
 ECONOMETRICS HONOR S EXAM REVIEW SESSION Eunice Han ehan@fas.harvard.edu March 26 th, 2013 Harvard University Information 2 Exam: April 3 rd 3-6pm @ Emerson 105 Bring a calculator and extra pens. Notes
Multiple Regression. Midterm results: AVG = 26.5 (88%) A = 27+ B = C =
 A = 27+ B = C =") Economics 130 Lecture 6 Midterm Review Next Steps for the Class Multiple Regression Review & Issues Model Specification Issues Launching the Projects!!!!! Midterm results: AVG = 26.5 (88%) A = 27+ B =
Economics 130 Lecture 6 Midterm Review Next Steps for the Class Multiple Regression Review & Issues Model Specification Issues Launching the Projects!!!!! Midterm results: AVG = 26.5 (88%) A = 27+ B =
Chapter 11. Regression with a Binary Dependent Variable
 Chapter 11 Regression with a Binary Dependent Variable 2 Regression with a Binary Dependent Variable (SW Chapter 11) So far the dependent variable (Y) has been continuous: district-wide average test score
 STOCKHOLM UNIVERSITY Department of Economics Course name: Empirical Methods Course code: EC40 Examiner: Lena Nekby Number of credits: 7,5 credits Date of exam: Saturday, May 9, 008 Examination time: 3
Hypothesis Tests and Confidence Intervals. in Multiple Regression
 ECON4135, LN6 Hypothesis Tests and Confidence Intervals Outline 1. Why multipple regression? in Multiple Regression (SW Chapter 7) 2. Simpson s paradox (omitted variables bias) 3. Hypothesis tests and
Linear Models in Econometrics
 Linear Models in Econometrics Nicky Grant At the most fundamental level econometrics is the development of statistical techniques suited primarily to answering economic questions and testing economic theories.
Introduction to Econometrics
 Introduction to Econometrics Lecture 3 : Regression: CEF and Simple OLS Zhaopeng Qu Business School,Nanjing University Oct 9th, 2017 Zhaopeng Qu (Nanjing University) Introduction to Econometrics Oct 9th,
Instrumental Variables
 Instrumental Variables Department of Economics University of Wisconsin-Madison September 27, 2016 Treatment Effects Throughout the course we will focus on the Treatment Effect Model For now take that to
Write your identification number on each paper and cover sheet (the number stated in the upper right hand corner on your exam cover).
.") STOCKHOLM UNIVERSITY Department of Economics Course name: Empirical Methods in Economics 2 Course code: EC2402 Examiner: Peter Skogman Thoursie Number of credits: 7,5 credits (hp) Date of exam: Saturday,
STOCKHOLM UNIVERSITY Department of Economics Course name: Empirical Methods in Economics 2 Course code: EC2402 Examiner: Peter Skogman Thoursie Number of credits: 7,5 credits (hp) Date of exam: Saturday,
Applied Health Economics (for B.Sc.)
") Applied Health Economics (for B.Sc.) Helmut Farbmacher Department of Economics University of Mannheim Autumn Semester 2017 Outlook 1 Linear models (OLS, Omitted variables, 2SLS) 2 Limited and qualitative
Applied Health Economics (for B.Sc.) Helmut Farbmacher Department of Economics University of Mannheim Autumn Semester 2017 Outlook 1 Linear models (OLS, Omitted variables, 2SLS) 2 Limited and qualitative
EMERGING MARKETS - Lecture 2: Methodology refresher
 EMERGING MARKETS - Lecture 2: Methodology refresher Maria Perrotta April 4, 2013 SITE http://www.hhs.se/site/pages/default.aspx My contact: maria.perrotta@hhs.se Aim of this class There are many different
WISE International Masters
 WISE International Masters ECONOMETRICS Instructor: Brett Graham INSTRUCTIONS TO STUDENTS 1 The time allowed for this examination paper is 2 hours. 2 This examination paper contains 32 questions. You are
1 Motivation for Instrumental Variable (IV) Regression
 Regression") ECON 370: IV & 2SLS 1 Instrumental Variables Estimation and Two Stage Least Squares Econometric Methods, ECON 370 Let s get back to the thiking in terms of cross sectional (or pooled cross sectional) data
ECON 370: IV & 2SLS 1 Instrumental Variables Estimation and Two Stage Least Squares Econometric Methods, ECON 370 Let s get back to the thiking in terms of cross sectional (or pooled cross sectional) data
Economics 113. Simple Regression Assumptions. Simple Regression Derivation. Changing Units of Measurement. Nonlinear effects
 Economics 113 Simple Regression Models Simple Regression Assumptions Simple Regression Derivation Changing Units of Measurement Nonlinear effects OLS and unbiased estimates Variance of the OLS estimates
Notes 11: OLS Theorems ECO 231W - Undergraduate Econometrics
 Notes 11: OLS Theorems ECO 231W - Undergraduate Econometrics Prof. Carolina Caetano For a while we talked about the regression method. Then we talked about the linear model. There were many details, but
Introduction to Econometrics
 Introduction to Econometrics T H I R D E D I T I O N Global Edition James H. Stock Harvard University Mark W. Watson Princeton University Boston Columbus Indianapolis New York San Francisco Upper Saddle
Ch 7: Dummy (binary, indicator) variables
 variables") Ch 7: Dummy (binary, indicator) variables :Examples Dummy variable are used to indicate the presence or absence of a characteristic. For example, define female i 1 if obs i is female 0 otherwise or male
Ch 7: Dummy (binary, indicator) variables :Examples Dummy variable are used to indicate the presence or absence of a characteristic. For example, define female i 1 if obs i is female 0 otherwise or male
Problem Set #6: OLS. Economics 835: Econometrics. Fall 2012
 Problem Set #6: OLS Economics 835: Econometrics Fall 202 A preliminary result Suppose we have a random sample of size n on the scalar random variables (x, y) with finite means, variances, and covariance.
Simple Regression Model. January 24, 2011
 Simple Regression Model January 24, 2011 Outline Descriptive Analysis Causal Estimation Forecasting Regression Model We are actually going to derive the linear regression model in 3 very different ways
ECON The Simple Regression Model
 ECON 351 - The Simple Regression Model Maggie Jones 1 / 41 The Simple Regression Model Our starting point will be the simple regression model where we look at the relationship between two variables In
Lab 07 Introduction to Econometrics
 Lab 07 Introduction to Econometrics Learning outcomes for this lab: Introduce the different typologies of data and the econometric models that can be used Understand the rationale behind econometrics Understand
Econometrics Honor s Exam Review Session. Spring 2012 Eunice Han
 Econometrics Honor s Exam Review Session Spring 2012 Eunice Han Topics 1. OLS The Assumptions Omitted Variable Bias Conditional Mean Independence Hypothesis Testing and Confidence Intervals Homoskedasticity
Making sense of Econometrics: Basics
 Making sense of Econometrics: Basics Lecture 2: Simple Regression Egypt Scholars Economic Society Happy Eid Eid present! enter classroom at http://b.socrative.com/login/student/ room name c28efb78 Outline
Final Exam. Economics 835: Econometrics. Fall 2010
 Final Exam Economics 835: Econometrics Fall 2010 Please answer the question I ask - no more and no less - and remember that the correct answer is often short and simple. 1 Some short questions a) For each
ECON Introductory Econometrics. Lecture 6: OLS with Multiple Regressors
 ECON4150 - Introductory Econometrics Lecture 6: OLS with Multiple Regressors Monique de Haan (moniqued@econ.uio.no) Stock and Watson Chapter 6 Lecture outline 2 Violation of first Least Squares assumption
Introduction to Econometrics. Review of Probability & Statistics
 1 Introduction to Econometrics Review of Probability & Statistics Peerapat Wongchaiwat, Ph.D. wongchaiwat@hotmail.com Introduction 2 What is Econometrics? Econometrics consists of the application of mathematical
ECON Introductory Econometrics. Lecture 17: Experiments
 ECON4150 - Introductory Econometrics Lecture 17: Experiments Monique de Haan (moniqued@econ.uio.no) Stock and Watson Chapter 13 Lecture outline 2 Why study experiments? The potential outcome framework.
Econ Spring 2016 Section 9
 Econ 140 - Spring 2016 Section 9 GSI: Fenella Carpena March 31, 2016 1 Assessing Studies Based on Multiple Regression 1.1 Internal Validity Threat to Examples/Cases Internal Validity OVB Example: wages
Econometrics -- Final Exam (Sample)
") Econometrics -- Final Exam (Sample) 1) The sample regression line estimated by OLS A) has an intercept that is equal to zero. B) is the same as the population regression line. C) cannot have negative and
Econometrics -- Final Exam (Sample) 1) The sample regression line estimated by OLS A) has an intercept that is equal to zero. B) is the same as the population regression line. C) cannot have negative and
Education Production Functions. April 7, 2009
 Education Production Functions April 7, 2009 Outline I Production Functions for Education Hanushek Paper Card and Krueger Tennesee Star Experiment Maimonides Rule What do I mean by Production Function?
WISE MA/PhD Programs Econometrics Instructor: Brett Graham Spring Semester, Academic Year Exam Version: A
 WISE MA/PhD Programs Econometrics Instructor: Brett Graham Spring Semester, 2015-16 Academic Year Exam Version: A INSTRUCTIONS TO STUDENTS 1 The time allowed for this examination paper is 2 hours. 2 This
Applied Statistics and Econometrics
 Applied Statistics and Econometrics Lecture 5 Saul Lach September 2017 Saul Lach () Applied Statistics and Econometrics September 2017 1 / 44 Outline of Lecture 5 Now that we know the sampling distribution
Basic econometrics. Tutorial 3. Dipl.Kfm. Johannes Metzler
 Basic econometrics Tutorial 3 Dipl.Kfm. Introduction Some of you were asking about material to revise/prepare econometrics fundamentals. First of all, be aware that I will not be too technical, only as
Econometrics Problem Set 11
 Econometrics Problem Set WISE, Xiamen University Spring 207 Conceptual Questions. (SW 2.) This question refers to the panel data regressions summarized in the following table: Dependent variable: ln(q
Click to edit Master title style
 Impact Evaluation Technical Track Session IV Click to edit Master title style Instrumental Variables Christel Vermeersch Amman, Jordan March 8-12, 2009 Click to edit Master subtitle style Human Development
Unless provided with information to the contrary, assume for each question below that the Classical Linear Model assumptions hold.
 Economics 345: Applied Econometrics Section A01 University of Victoria Midterm Examination #2 Version 1 SOLUTIONS Spring 2015 Instructor: Martin Farnham Unless provided with information to the contrary,
Econometrics I KS. Module 2: Multivariate Linear Regression. Alexander Ahammer. This version: April 16, 2018
 Econometrics I KS Module 2: Multivariate Linear Regression Alexander Ahammer Department of Economics Johannes Kepler University of Linz This version: April 16, 2018 Alexander Ahammer (JKU) Module 2: Multivariate
Econ 1123: Section 2. Review. Binary Regressors. Bivariate. Regression. Omitted Variable Bias
 Contact Information Elena Llaudet Sections are voluntary. My office hours are Thursdays 5pm-7pm in Littauer Mezzanine 34-36 (Note room change) You can email me administrative questions to ellaudet@gmail.com.
Chapter 8 Conclusion
 1 Chapter 8 Conclusion Three questions about test scores (score) and student-teacher ratio (str): a) After controlling for differences in economic characteristics of different districts, does the effect
Recitation Notes 6. Konrad Menzel. October 22, 2006
 Recitation Notes 6 Konrad Menzel October, 006 Random Coefficient Models. Motivation In the empirical literature on education and earnings, the main object of interest is the human capital earnings function
Introduction to Econometrics Third Edition James H. Stock Mark W. Watson The statistical analysis of economic (and related) data
 data") Introduction to Econometrics Third Edition James H. Stock Mark W. Watson The statistical analysis of economic (and related) data 1/2/3-1 1/2/3-2 Brief Overview of the Course Economics suggests important
Introduction to Econometrics Third Edition James H. Stock Mark W. Watson The statistical analysis of economic (and related) data 1/2/3-1 1/2/3-2 Brief Overview of the Course Economics suggests important
Exam ECON3150/4150: Introductory Econometrics. 18 May 2016; 09:00h-12.00h.
 Exam ECON3150/4150: Introductory Econometrics. 18 May 2016; 09:00h-12.00h. This is an open book examination where all printed and written resources, in addition to a calculator, are allowed. If you are
Applied Statistics and Econometrics. Giuseppe Ragusa Lecture 15: Instrumental Variables
 Applied Statistics and Econometrics Giuseppe Ragusa Lecture 15: Instrumental Variables Outline Introduction Endogeneity and Exogeneity Valid Instruments TSLS Testing Validity 2 Instrumental Variables Regression
Inference in Regression Model
 Inference in Regression Model Christopher Taber Department of Economics University of Wisconsin-Madison March 25, 2009 Outline 1 Final Step of Classical Linear Regression Model 2 Confidence Intervals 3
ECON3150/4150 Spring 2015
 ECON3150/4150 Spring 2015 Lecture 3&4 - The linear regression model Siv-Elisabeth Skjelbred University of Oslo January 29, 2015 1 / 67 Chapter 4 in S&W Section 17.1 in S&W (extended OLS assumptions) 2
Regression Analysis. Ordinary Least Squares. The Linear Model
 Regression Analysis Linear regression is one of the most widely used tools in statistics. Suppose we were jobless college students interested in finding out how big (or small) our salaries would be 20
Econometrics I Lecture 3: The Simple Linear Regression Model
 Econometrics I Lecture 3: The Simple Linear Regression Model Mohammad Vesal Graduate School of Management and Economics Sharif University of Technology 44716 Fall 1397 1 / 32 Outline Introduction Estimating
Multiple Linear Regression CIVL 7012/8012
 Multiple Linear Regression CIVL 7012/8012 2 Multiple Regression Analysis (MLR) Allows us to explicitly control for many factors those simultaneously affect the dependent variable This is important for
ECNS 561 Multiple Regression Analysis
 ECNS 561 Multiple Regression Analysis Model with Two Independent Variables Consider the following model Crime i = β 0 + β 1 Educ i + β 2 [what else would we like to control for?] + ε i Here, we are taking
THE AUSTRALIAN NATIONAL UNIVERSITY. Second Semester Final Examination November, Econometrics II: Econometric Modelling (EMET 2008/6008)
") THE AUSTRALIAN NATIONAL UNIVERSITY Second Semester Final Examination November, 2014 Econometrics II: Econometric Modelling (EMET 2008/6008) Reading Time: 5 Minutes Writing Time: 90 Minutes Permitted Materials:
THE AUSTRALIAN NATIONAL UNIVERSITY Second Semester Final Examination November, 2014 Econometrics II: Econometric Modelling (EMET 2008/6008) Reading Time: 5 Minutes Writing Time: 90 Minutes Permitted Materials:
Two-Variable Regression Model: The Problem of Estimation
 Two-Variable Regression Model: The Problem of Estimation Introducing the Ordinary Least Squares Estimator Jamie Monogan University of Georgia Intermediate Political Methodology Jamie Monogan (UGA) Two-Variable
2 Prediction and Analysis of Variance
 2 Prediction and Analysis of Variance Reading: Chapters and 2 of Kennedy A Guide to Econometrics Achen, Christopher H. Interpreting and Using Regression (London: Sage, 982). Chapter 4 of Andy Field, Discovering
Notes 6: Multivariate regression ECO 231W - Undergraduate Econometrics
 Notes 6: Multivariate regression ECO 231W - Undergraduate Econometrics Prof. Carolina Caetano 1 Notation and language Recall the notation that we discussed in the previous classes. We call the outcome
Metrics Honors Review
 Metrics Honors Review petertu@fas.harvard.edu Harvard University Department of Economics 26 March 2015 : Logistics Exam Date: Wednesday, April 8 from 3-6pm in Sever Hall 113 The exam covers material from
WISE MA/PhD Programs Econometrics Instructor: Brett Graham Spring Semester, Academic Year Exam Version: A
 WISE MA/PhD Programs Econometrics Instructor: Brett Graham Spring Semester, 2016-17 Academic Year Exam Version: A INSTRUCTIONS TO STUDENTS 1 The time allowed for this examination paper is 2 hours. 2 This
Rewrap ECON November 18, () Rewrap ECON 4135 November 18, / 35
 Rewrap ECON 4135 November 18, / 35") Rewrap ECON 4135 November 18, 2011 () Rewrap ECON 4135 November 18, 2011 1 / 35 What should you now know? 1 What is econometrics? 2 Fundamental regression analysis 1 Bivariate regression 2 Multivariate
Rewrap ECON 4135 November 18, 2011 () Rewrap ECON 4135 November 18, 2011 1 / 35 What should you now know? 1 What is econometrics? 2 Fundamental regression analysis 1 Bivariate regression 2 Multivariate
Controlling for Time Invariant Heterogeneity
 Controlling for Time Invariant Heterogeneity Yona Rubinstein July 2016 Yona Rubinstein (LSE) Controlling for Time Invariant Heterogeneity 07/16 1 / 19 Observables and Unobservables Confounding Factors
Job Training Partnership Act (JTPA)
") Causal inference Part I.b: randomized experiments, matching and regression (this lecture starts with other slides on randomized experiments) Frank Venmans Example of a randomized experiment: Job Training
Causal inference Part I.b: randomized experiments, matching and regression (this lecture starts with other slides on randomized experiments) Frank Venmans Example of a randomized experiment: Job Training
Quadratic Equations Part I
 Quadratic Equations Part I Before proceeding with this section we should note that the topic of solving quadratic equations will be covered in two sections. This is done for the benefit of those viewing
2) For a normal distribution, the skewness and kurtosis measures are as follows: A) 1.96 and 4 B) 1 and 2 C) 0 and 3 D) 0 and 0
 For a normal distribution, the skewness and kurtosis measures are as follows: A) 1.96 and 4 B) 1 and 2 C) 0 and 3 D) 0 and 0") Introduction to Econometrics Midterm April 26, 2011 Name Student ID MULTIPLE CHOICE. Choose the one alternative that best completes the statement or answers the question. (5,000 credit for each correct
Introduction to Econometrics Midterm April 26, 2011 Name Student ID MULTIPLE CHOICE. Choose the one alternative that best completes the statement or answers the question. (5,000 credit for each correct
Problem Set - Instrumental Variables
 Problem Set - Instrumental Variables 1. Consider a simple model to estimate the effect of personal computer (PC) ownership on college grade point average for graduating seniors at a large public university:
FNCE 926 Empirical Methods in CF
 FNCE 926 Empirical Methods in CF Lecture 5 Instrumental Variables Professor Todd Gormley Announcements n Exercise #2 due; should have uploaded it to Canvas already 2 Background readings n Roberts and Whited
Applied Quantitative Methods II
 Applied Quantitative Methods II Lecture 4: OLS and Statistics revision Klára Kaĺıšková Klára Kaĺıšková AQM II - Lecture 4 VŠE, SS 2016/17 1 / 68 Outline 1 Econometric analysis Properties of an estimator
Potential Outcomes Model (POM)
") Potential Outcomes Model (POM) Relationship Between Counterfactual States Causality Empirical Strategies in Labor Economics, Angrist Krueger (1999): The most challenging empirical questions in economics
Potential Outcomes Model (POM) Relationship Between Counterfactual States Causality Empirical Strategies in Labor Economics, Angrist Krueger (1999): The most challenging empirical questions in economics
Introduction to Regression Analysis. Dr. Devlina Chatterjee 11 th August, 2017
 Introduction to Regression Analysis Dr. Devlina Chatterjee 11 th August, 2017 What is regression analysis? Regression analysis is a statistical technique for studying linear relationships. One dependent
Lecture 4: Linear panel models
 Lecture 4: Linear panel models Luc Behaghel PSE February 2009 Luc Behaghel (PSE) Lecture 4 February 2009 1 / 47 Introduction Panel = repeated observations of the same individuals (e.g., rms, workers, countries)
Teaching Causal Inference in Undergraduate Econometrics
 Teaching Causal Inference in Undergraduate Econometrics October 24, 2012 Abstract This paper argues that the current way in which the undergraduate introductory econometrics course is taught is neither
Econometrics Problem Set 6
 Econometrics Problem Set 6 WISE, Xiamen University Spring 2016-17 Conceptual Questions 1. This question refers to the estimated regressions shown in Table 1 computed using data for 1988 from the CPS. The
ECON Introductory Econometrics. Lecture 11: Binary dependent variables
 ECON4150 - Introductory Econometrics Lecture 11: Binary dependent variables Monique de Haan (moniqued@econ.uio.no) Stock and Watson Chapter 11 Lecture Outline 2 The linear probability model Nonlinear probability