Introduction to Econometrics. Assessing Studies Based on Multiple Regression
|
|
|
- Lillian Mills
- 6 years ago
- Views:
Transcription
 data STATS301")

1 Introduction to Econometrics The statistical analysis of economic (and related) data STATS301 Assessing Studies Based on Multiple Regression Titulaire: Christopher Bruffaerts Assistant: Lorenzo Ricci 1
2 Assessing Studies Based on Multiple Regression Multiple regression has some key virtues: It provides an estimate of the effect on Y of arbitrary changes ΔX. It resolves the problem of omitted variable bias, if an omitted variable can be measured and included. It can handle nonlinear relations (effects that vary with the X s) Still, OLS might yield a biased estimator of the true causal effect. 2
3 A Framework for Assessing Statistical Studies Internal and External Validity Internal validity: the statistical inferences about causal effects are valid for the population being studied. External validity: the statistical inferences can be generalized from the population and setting studied to other populations and settings, where the setting refers to the legal, policy, and physical environment and related salient features. 3
4 Threats to External Validity How far can we generalize class size results from California school districts? Differences in populations o California in 2005? o Massachusetts in 2005? o Mexico in 2005? Differences in settings o different legal requirements concerning special education o different treatment of bilingual education o differences in teacher characteristics 4
5 Assessing Studies Based on Multiple Regression Threats to Internal Validity of Multiple Regression Analysis 5
6 Threats to Internal Validity Internal validity: the statistical inferences about causal effects are valid for the population being studied. Five threats to the internal validity of regression studies: 1. Omitted variable bias 2. Wrong functional form 3. Errors-in-variables bias 4. Sample selection bias 5. Simultaneous causality bias All of these imply that E(u i X 1i,,X ki ) 0 6
7 1 - Omitted variable bias Arises if an omitted variable both (i) is a determinant of Y and (ii) is correlated with at least one included regressor. Potential solutions to omitted variable bias If the variable can be measured, include it as a regressor in multiple regression; Possibly, use panel data in which each entity (individual) is observed more than once; If the variable cannot be measured, use instrumental variables regression; Run a randomized controlled experiment. 7
8 2 - Wrong functional form Arises if the functional form is incorrect for example, an interaction term is incorrectly omitted; then inferences on causal effects will be biased. Potential solutions to functional form misspecification Continuous dependent variable: use the appropriate nonlinear specifications in X (logarithms, interactions, etc.) Discrete (example: binary) dependent variable: need an extension of multiple regression methods ( probit or logit analysis for binary dependent variables). 8
9 3 - Errors-in-variables bias So far we have assumed that X is measured without error. In reality, economic data often have measurement error Data entry errors in administrative data Recollection errors in surveys o when did you start your current job? Ambiguous questions problems o what was your income last year? Intentionally false response problems with surveys o What is the current value of your financial assets? o How often do you drink and drive? In general, measurement error in a regressor results in errors-in-variables bias. 9
10 Errors-in-variables bias: Illustration Suppose that Y i = β 0 + β 1 X i + u i is correct in the sense that the three least squares assumptions hold (in particular E(u i X i ) = 0). Let X i = unmeasured true value of X X i = imprecisely measured version of X Then Y i = β 0 + β 1 X i + u i = β 0 + β 1 X i + [β 1 (X i X i ) + u i ] or Y i = β 0 + β 1 X i + u i, where u i = β 1 (X i X i ) + u i If X i is correlated with u i then ˆ β 1 will be biased 10
11 Errors-in-variables bias: Illustration cov( X i, u i ) = cov( X i,β 1 (X i X i ) + u i ) = β 1 cov( X i, X i X i ) + cov( X i,u i ) = β 1 cov( X i, X i ) β 1 var( X i ) because in general cov( X i,x i ) 0 and var( X i ) 0. If X i is measured with error, X i is in general correlated with u i, so ˆ β 1 is biased and inconsistent. It is possible to derive formulas for this bias, but they require making specific mathematical assumptions about the measurement error process. Those formulas are special and particular, but the observation that measurement error in X results in bias is general. 11
12 Potential solutions to errors-in-variables bias Obtain better data. Develop a specific model of the measurement error process. This is only possible if a lot is known about the nature of the measurement error for example a subsample of the data are cross-checked using administrative records and the discrepancies are analyzed and modeled. Instrumental variables regression. Very specialized; we won t pursue this here. 12
13 4 - Sample selection bias So far we have assumed simple random sampling of the population. In some cases, simple random sampling is thwarted because the sample, in effect, selects itself. Sample selection bias arises when a selection process (i) influences the availability of data and (ii) that process is related to the dependent variable. 13
14 Example #1: Mutual funds Do actively managed mutual funds outperform hold-the-market funds? Empirical strategy: o Sampling scheme: simple random sampling of mutual funds available to the public on a given date. o Data: returns for the preceding 10 years. o Estimator: average ten-year return of the sample mutual funds, minus ten-year return on S&P500 return i = β 0 + β 1 managed_fund i + u i Is there sample selection bias? Being a managed fund in the sample (managed_fund i = 1) means that your return was better than failed managed funds, which are not in the sample so corr(managed_fund i,u i ) 0. 14
15 Potential solutions to sample selection bias Collect the sample in a way that avoids sample selection. o Mutual funds example: change the sample population from those available at the end of the tenyear period, to those available at the beginning of the period (include failed funds) Randomized controlled experiment. Construct a model of the sample selection problem and estimate that model (we will not do this). 15
16 5 - Simultaneous causality bias So far we have assumed that X causes Y. What if Y causes X, too? Example: Class size effect Low STR results in better test scores But suppose districts with low test scores are given extra resources: as a result of a political process they also have low STR What does this mean for a regression of TestScore on STR? 16
17 Simultaneous causality bias in equations (a) Causal effect of X on Y: Y i = β 0 + β 1 X i + u i (b) Causal effect of Y on X: X i = γ 0 + γ 1 Y i + v i Large u i means large Y i, which implies large X i (if γ 1 >0) Thus corr(x i,u i ) 0 Thus ˆ β 1 is biased and inconsistent. Ex: A district with particularly bad test scores given the STR (negative u i ) receives extra resources, thereby lowering its STR; so STR i and u i are correlated 17
18 Potential solutions to simultaneous causality bias Randomized controlled experiment. Because X i is chosen at random by the experimenter, there is no feedback from the outcome variable to Y i (assuming perfect compliance). Develop and estimate a complete model of both directions of causality. This is the idea behind many large macro models (e.g. Federal Reserve Bank-US). This is extremely difficult in practice. Use instrumental variables regression to estimate the causal effect of interest (effect of X on Y, ignoring effect of Y on X). 18
19 Applying this Framework: Test Scores and Class Size Objective: Assess the threats to the internal and external validity of the empirical analysis of the California test score data. External validity o Compare results for California and Massachusetts o Think hard Internal validity o Go through the list of five potential threats to internal validity and think hard 19
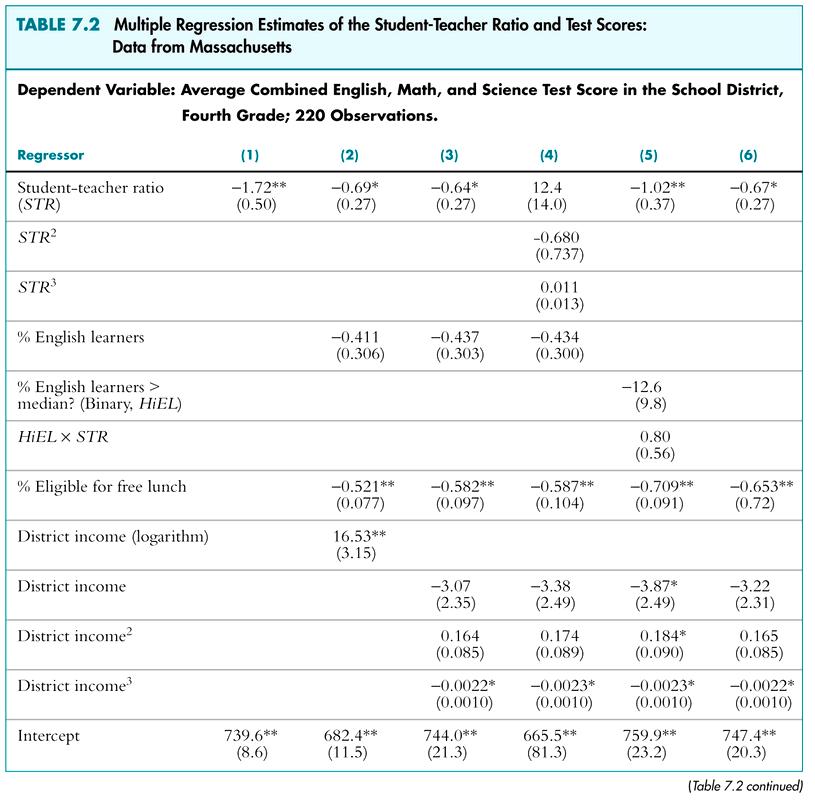
20 Check of external validity compare the California study to one using Massachusetts data The Massachusetts data set 220 elementary school districts Test: 1998 MCAS test fourth grade total (Math + English + Science) Variables: STR, TestScore, PctEL, LunchPct, Income 20

21 The Massachusetts data: summary statistics 21
22 22
23 23
24 Logarithmic versus cubic function for STR? Evidence of nonlinearity in TestScore-STR relation? Is there a significant HiEL STR interaction? 24
25 Predicted effects for a class size reduction of 2 Linear specification TestScore = STR 0.437PctEL 0.582LunchPct (21.3) (0.27) (0.303) (0.097) 3.07Income Income Income 3 (2.35) (0.085) (0.0010) Estimated effect = (-2) = 1.28 Standard error = = 0.54 NOTE: var(ay) = a 2 var(y); SE(aβ 1 ) = a SE( β 1) ˆ ˆ CI 95% = [ 1.28 ± ]= [0.22, 2.34] 25
26 Predicted effects for a class size reduction of 2 nonlinear specification Use the before and after method: TestScore = STR 0.680STR STR PctEL 0.587LunchPct 3.48Income Income Income 3 Estimated reduction from 20 students to 18: ΔTestScore = [ ] [ ] = 1.98 compare with estimate from linear model of 1.28 SE of this estimated effect: use the rearrange the regression ( transform the regressors ) method 26
27 Summary of Findings for Massachusetts 1. Coefficient on STR falls from 1.72 to 0.69 when control variables for student and district characteristics are included an indication that the original estimate contained omitted variable bias. 2. The class size effect is statistically significant at the 1% significance level, after controlling for student and district characteristics 3. No statistical evidence on nonlinearities in the TestScore STR relation 4. No statistical evidence of STR PctEL interaction 27

28 Comparison of estimated class size effects: CA vs. MA 28
29 Summary: Comparison of CA and MA Analyses Class size effect falls in both CA, MA data when student and district control variables are added. Class size effect is statistically significant in both CA, MA data. Estimated effect of a 2-student reduction in STR is quantitatively similar for CA, MA. Neither data set shows evidence of STR PctEL interaction. Some evidence of STR nonlinearities in CA data, but not in MA data. 29
30 Remaining threats to internal validity What the CA v. MA comparison does and does not show 30
31 1. Omitted variable bias This analysis controls for: district demographics (income) some student characteristics (English speaking) What is missing? Additional student characteristics, Access to outside learning opportunities Teacher quality for example native ability (but is this correlated with STR?) perhaps better teachers are attracted to schools with lower STR We have controlled for many relevant omitted factors; The nature of this omitted variable bias would need to be similar in California and Massachusetts to be consistent with these results; In this application we will be able to compare these estimates based on observational data with estimates based on experimental data a check of this multiple regression methodology. 31
32 2. Wrong functional form We have tried quite a few different functional forms, in both the California and Massachussetts data Nonlinear effects are modest Plausibly, this is not a major threat at this point. 3. Errors-in-variables bias STR is a district-wide measure Presumably there is some measurement error students who take the test might not have experienced the measured STR for the district Ideally we would like data on individual students, by grade level. 32
33 4. Selection Sample is all elementary public school districts (in California; in Massachussetts) no reason that selection should be a problem. 5. Simultaneous Causality School funding equalization based on test scores could cause simultaneous causality. This was not in place in California or Massachussetts during these samples, so simultaneous causality bias is arguably not important. 33
34 Summary Framework for evaluating regression studies: o Internal validity o External validity Five threats to internal validity: 1. Omitted variable bias 2. Wrong functional form 3. Errors-in-variables bias 4. Sample selection bias 5. Simultaneous causality bias Rest of course focuses on econometric methods for addressing these threats. 34
Assessing Studies Based on Multiple Regression
 Assessing Studies Based on Multiple Regression Outline 1. Internal and External Validity 2. Threats to Internal Validity a. Omitted variable bias b. Functional form misspecification c. Errors-in-variables
Chapter 9: Assessing Studies Based on Multiple Regression. Copyright 2011 Pearson Addison-Wesley. All rights reserved.
 Chapter 9: Assessing Studies Based on Multiple Regression 1-1 9-1 Outline 1. Internal and External Validity 2. Threats to Internal Validity a) Omitted variable bias b) Functional form misspecification
6. Assessing studies based on multiple regression
 6. Assessing studies based on multiple regression Questions of this section: What makes a study using multiple regression (un)reliable? When does multiple regression provide a useful estimate of the causal
Linear Regression with Multiple Regressors
 Linear Regression with Multiple Regressors (SW Chapter 6) Outline 1. Omitted variable bias 2. Causality and regression analysis 3. Multiple regression and OLS 4. Measures of fit 5. Sampling distribution
Introduction to Econometrics. Regression with Panel Data
 Introduction to Econometrics The statistical analysis of economic (and related) data STATS301 Regression with Panel Data Titulaire: Christopher Bruffaerts Assistant: Lorenzo Ricci 1 Regression with Panel
Introduction to Econometrics. Multiple Regression
 Introduction to Econometrics The statistical analysis of economic (and related) data STATS301 Multiple Regression Titulaire: Christopher Bruffaerts Assistant: Lorenzo Ricci 1 OLS estimate of the TS/STR
Linear Regression with one Regressor
 1 Linear Regression with one Regressor Covering Chapters 4.1 and 4.2. We ve seen the California test score data before. Now we will try to estimate the marginal effect of STR on SCORE. To motivate these
Introduction to Econometrics
 Introduction to Econometrics T H I R D E D I T I O N Global Edition James H. Stock Harvard University Mark W. Watson Princeton University Boston Columbus Indianapolis New York San Francisco Upper Saddle
Nonlinear Regression Functions
 Nonlinear Regression Functions (SW Chapter 8) Outline 1. Nonlinear regression functions general comments 2. Nonlinear functions of one variable 3. Nonlinear functions of two variables: interactions 4.
Chapter 6: Linear Regression With Multiple Regressors
 Chapter 6: Linear Regression With Multiple Regressors 1-1 Outline 1. Omitted variable bias 2. Causality and regression analysis 3. Multiple regression and OLS 4. Measures of fit 5. Sampling distribution
Linear Regression with Multiple Regressors
 Linear Regression with Multiple Regressors (SW Chapter 6) Outline 1. Omitted variable bias 2. Causality and regression analysis 3. Multiple regression and OLS 4. Measures of fit 5. Sampling distribution
Regression with a Single Regressor: Hypothesis Tests and Confidence Intervals
 Regression with a Single Regressor: Hypothesis Tests and Confidence Intervals (SW Chapter 5) Outline. The standard error of ˆ. Hypothesis tests concerning β 3. Confidence intervals for β 4. Regression
Introduction to Econometrics
 Introduction to Econometrics STAT-S-301 Panel Data (2016/2017) Lecturer: Yves Dominicy Teaching Assistant: Elise Petit 1 Regression with Panel Data A panel dataset contains observations on multiple entities
Applied Health Economics (for B.Sc.)
") Applied Health Economics (for B.Sc.) Helmut Farbmacher Department of Economics University of Mannheim Autumn Semester 2017 Outlook 1 Linear models (OLS, Omitted variables, 2SLS) 2 Limited and qualitative
Applied Health Economics (for B.Sc.) Helmut Farbmacher Department of Economics University of Mannheim Autumn Semester 2017 Outlook 1 Linear models (OLS, Omitted variables, 2SLS) 2 Limited and qualitative
Review of Econometrics
 Review of Econometrics Zheng Tian June 5th, 2017 1 The Essence of the OLS Estimation Multiple regression model involves the models as follows Y i = β 0 + β 1 X 1i + β 2 X 2i + + β k X ki + u i, i = 1,...,
Introduction to Econometrics. Multiple Regression (2016/2017)
") Introduction to Econometrics STAT-S-301 Multiple Regression (016/017) Lecturer: Yves Dominicy Teaching Assistant: Elise Petit 1 OLS estimate of the TS/STR relation: OLS estimate of the Test Score/STR relation:
Introduction to Econometrics STAT-S-301 Multiple Regression (016/017) Lecturer: Yves Dominicy Teaching Assistant: Elise Petit 1 OLS estimate of the TS/STR relation: OLS estimate of the Test Score/STR relation:
Applied Statistics and Econometrics
 Applied Statistics and Econometrics Lecture 6 Saul Lach September 2017 Saul Lach () Applied Statistics and Econometrics September 2017 1 / 53 Outline of Lecture 6 1 Omitted variable bias (SW 6.1) 2 Multiple
ECONOMETRICS HONOR S EXAM REVIEW SESSION
 ECONOMETRICS HONOR S EXAM REVIEW SESSION Eunice Han ehan@fas.harvard.edu March 26 th, 2013 Harvard University Information 2 Exam: April 3 rd 3-6pm @ Emerson 105 Bring a calculator and extra pens. Notes
Introduction to Econometrics
 Introduction to Econometrics STAT-S-301 Experiments and Quasi-Experiments (2016/2017) Lecturer: Yves Dominicy Teaching Assistant: Elise Petit 1 Why study experiments? Ideal randomized controlled experiments
ECO321: Economic Statistics II
 ECO321: Economic Statistics II Chapter 6: Linear Regression a Hiroshi Morita hmorita@hunter.cuny.edu Department of Economics Hunter College, The City University of New York a c 2010 by Hiroshi Morita.
THE AUSTRALIAN NATIONAL UNIVERSITY. Second Semester Final Examination November, Econometrics II: Econometric Modelling (EMET 2008/6008)
") THE AUSTRALIAN NATIONAL UNIVERSITY Second Semester Final Examination November, 2014 Econometrics II: Econometric Modelling (EMET 2008/6008) Reading Time: 5 Minutes Writing Time: 90 Minutes Permitted Materials:
THE AUSTRALIAN NATIONAL UNIVERSITY Second Semester Final Examination November, 2014 Econometrics II: Econometric Modelling (EMET 2008/6008) Reading Time: 5 Minutes Writing Time: 90 Minutes Permitted Materials:
Econometrics Honor s Exam Review Session. Spring 2012 Eunice Han
 Econometrics Honor s Exam Review Session Spring 2012 Eunice Han Topics 1. OLS The Assumptions Omitted Variable Bias Conditional Mean Independence Hypothesis Testing and Confidence Intervals Homoskedasticity
2. Linear regression with multiple regressors
 2. Linear regression with multiple regressors Aim of this section: Introduction of the multiple regression model OLS estimation in multiple regression Measures-of-fit in multiple regression Assumptions
Hypothesis Tests and Confidence Intervals in Multiple Regression
 Hypothesis Tests and Confidence Intervals in Multiple Regression (SW Chapter 7) Outline 1. Hypothesis tests and confidence intervals for one coefficient. Joint hypothesis tests on multiple coefficients
Applied Statistics and Econometrics
 Applied Statistics and Econometrics Lecture 13 Nonlinearities Saul Lach October 2018 Saul Lach () Applied Statistics and Econometrics October 2018 1 / 91 Outline of Lecture 13 1 Nonlinear regression functions
4. Nonlinear regression functions
 4. Nonlinear regression functions Up to now: Population regression function was assumed to be linear The slope(s) of the population regression function is (are) constant The effect on Y of a unit-change
Chapter 7. Hypothesis Tests and Confidence Intervals in Multiple Regression
 Chapter 7 Hypothesis Tests and Confidence Intervals in Multiple Regression Outline 1. Hypothesis tests and confidence intervals for a single coefficie. Joint hypothesis tests on multiple coefficients 3.
8. Instrumental variables regression
 8. Instrumental variables regression Recall: In Section 5 we analyzed five sources of estimation bias arising because the regressor is correlated with the error term Violation of the first OLS assumption
ECON Introductory Econometrics. Lecture 6: OLS with Multiple Regressors
 ECON4150 - Introductory Econometrics Lecture 6: OLS with Multiple Regressors Monique de Haan (moniqued@econ.uio.no) Stock and Watson Chapter 6 Lecture outline 2 Violation of first Least Squares assumption
The F distribution. If: 1. u 1,,u n are normally distributed; and 2. X i is distributed independently of u i (so in particular u i is homoskedastic)
") The F distribution If: 1. u 1,,u n are normally distributed; and. X i is distributed independently of u i (so in particular u i is homoskedastic) then the homoskedasticity-only F-statistic has the F q,n-k
The F distribution If: 1. u 1,,u n are normally distributed; and. X i is distributed independently of u i (so in particular u i is homoskedastic) then the homoskedasticity-only F-statistic has the F q,n-k
Multiple Linear Regression CIVL 7012/8012
 Multiple Linear Regression CIVL 7012/8012 2 Multiple Regression Analysis (MLR) Allows us to explicitly control for many factors those simultaneously affect the dependent variable This is important for
 STOCKHOLM UNIVERSITY Department of Economics Course name: Empirical Methods Course code: EC40 Examiner: Lena Nekby Number of credits: 7,5 credits Date of exam: Saturday, May 9, 008 Examination time: 3
ECON Introductory Econometrics. Lecture 17: Experiments
 ECON4150 - Introductory Econometrics Lecture 17: Experiments Monique de Haan (moniqued@econ.uio.no) Stock and Watson Chapter 13 Lecture outline 2 Why study experiments? The potential outcome framework.
Econ 1123: Section 5. Review. Internal Validity. Panel Data. Clustered SE. STATA help for Problem Set 5. Econ 1123: Section 5.
 Outline 1 Elena Llaudet 2 3 4 October 6, 2010 5 based on Common Mistakes on P. Set 4 lnftmpop = -.72-2.84 higdppc -.25 lackpf +.65 higdppc * lackpf 2 lnftmpop = β 0 + β 1 higdppc + β 2 lackpf + β 3 lackpf
Applied Statistics and Econometrics
 Applied Statistics and Econometrics Lecture 7 Saul Lach September 2017 Saul Lach () Applied Statistics and Econometrics September 2017 1 / 68 Outline of Lecture 7 1 Empirical example: Italian labor force
Chapter 11. Regression with a Binary Dependent Variable
 Chapter 11 Regression with a Binary Dependent Variable 2 Regression with a Binary Dependent Variable (SW Chapter 11) So far the dependent variable (Y) has been continuous: district-wide average test score
Hypothesis Tests and Confidence Intervals. in Multiple Regression
 ECON4135, LN6 Hypothesis Tests and Confidence Intervals Outline 1. Why multipple regression? in Multiple Regression (SW Chapter 7) 2. Simpson s paradox (omitted variables bias) 3. Hypothesis tests and
Wooldridge, Introductory Econometrics, 3d ed. Chapter 9: More on specification and data problems
 Wooldridge, Introductory Econometrics, 3d ed. Chapter 9: More on specification and data problems Functional form misspecification We may have a model that is correctly specified, in terms of including
WISE International Masters
 WISE International Masters ECONOMETRICS Instructor: Brett Graham INSTRUCTIONS TO STUDENTS 1 The time allowed for this examination paper is 2 hours. 2 This examination paper contains 32 questions. You are
Experiments and Quasi-Experiments
 Experiments and Quasi-Experiments (SW Chapter 13) Outline 1. Potential Outcomes, Causal Effects, and Idealized Experiments 2. Threats to Validity of Experiments 3. Application: The Tennessee STAR Experiment
Empirical approaches in public economics
 Empirical approaches in public economics ECON4624 Empirical Public Economics Fall 2016 Gaute Torsvik Outline for today The canonical problem Basic concepts of causal inference Randomized experiments Non-experimental
Lab 07 Introduction to Econometrics
 Lab 07 Introduction to Econometrics Learning outcomes for this lab: Introduce the different typologies of data and the econometric models that can be used Understand the rationale behind econometrics Understand
Introduction to Econometrics
 Introduction to Econometrics Lecture 3 : Regression: CEF and Simple OLS Zhaopeng Qu Business School,Nanjing University Oct 9th, 2017 Zhaopeng Qu (Nanjing University) Introduction to Econometrics Oct 9th,
The Simple Linear Regression Model
 The Simple Linear Regression Model Lesson 3 Ryan Safner 1 1 Department of Economics Hood College ECON 480 - Econometrics Fall 2017 Ryan Safner (Hood College) ECON 480 - Lesson 3 Fall 2017 1 / 77 Bivariate
EMERGING MARKETS - Lecture 2: Methodology refresher
 EMERGING MARKETS - Lecture 2: Methodology refresher Maria Perrotta April 4, 2013 SITE http://www.hhs.se/site/pages/default.aspx My contact: maria.perrotta@hhs.se Aim of this class There are many different
1 Motivation for Instrumental Variable (IV) Regression
 Regression") ECON 370: IV & 2SLS 1 Instrumental Variables Estimation and Two Stage Least Squares Econometric Methods, ECON 370 Let s get back to the thiking in terms of cross sectional (or pooled cross sectional) data
ECON 370: IV & 2SLS 1 Instrumental Variables Estimation and Two Stage Least Squares Econometric Methods, ECON 370 Let s get back to the thiking in terms of cross sectional (or pooled cross sectional) data
Economics 113. Simple Regression Assumptions. Simple Regression Derivation. Changing Units of Measurement. Nonlinear effects
 Economics 113 Simple Regression Models Simple Regression Assumptions Simple Regression Derivation Changing Units of Measurement Nonlinear effects OLS and unbiased estimates Variance of the OLS estimates
Econometrics Problem Set 11
 Econometrics Problem Set WISE, Xiamen University Spring 207 Conceptual Questions. (SW 2.) This question refers to the panel data regressions summarized in the following table: Dependent variable: ln(q
Rewrap ECON November 18, () Rewrap ECON 4135 November 18, / 35
 Rewrap ECON 4135 November 18, / 35") Rewrap ECON 4135 November 18, 2011 () Rewrap ECON 4135 November 18, 2011 1 / 35 What should you now know? 1 What is econometrics? 2 Fundamental regression analysis 1 Bivariate regression 2 Multivariate
Rewrap ECON 4135 November 18, 2011 () Rewrap ECON 4135 November 18, 2011 1 / 35 What should you now know? 1 What is econometrics? 2 Fundamental regression analysis 1 Bivariate regression 2 Multivariate
Multiple Regression. Midterm results: AVG = 26.5 (88%) A = 27+ B = C =
 A = 27+ B = C =") Economics 130 Lecture 6 Midterm Review Next Steps for the Class Multiple Regression Review & Issues Model Specification Issues Launching the Projects!!!!! Midterm results: AVG = 26.5 (88%) A = 27+ B =
Economics 130 Lecture 6 Midterm Review Next Steps for the Class Multiple Regression Review & Issues Model Specification Issues Launching the Projects!!!!! Midterm results: AVG = 26.5 (88%) A = 27+ B =
 STOCKHOLM UNIVERSITY Department of Economics Course name: Empirical Methods Course code: EC40 Examiner: Per Pettersson-Lidbom Number of creds: 7,5 creds Date of exam: Thursday, January 15, 009 Examination
Introduction to Econometrics Third Edition James H. Stock Mark W. Watson The statistical analysis of economic (and related) data
 data") Introduction to Econometrics Third Edition James H. Stock Mark W. Watson The statistical analysis of economic (and related) data 1/2/3-1 1/2/3-2 Brief Overview of the Course Economics suggests important
Introduction to Econometrics Third Edition James H. Stock Mark W. Watson The statistical analysis of economic (and related) data 1/2/3-1 1/2/3-2 Brief Overview of the Course Economics suggests important
Introduction to Econometrics. Review of Probability & Statistics
 1 Introduction to Econometrics Review of Probability & Statistics Peerapat Wongchaiwat, Ph.D. wongchaiwat@hotmail.com Introduction 2 What is Econometrics? Econometrics consists of the application of mathematical
Chapter 8 Conclusion
 1 Chapter 8 Conclusion Three questions about test scores (score) and student-teacher ratio (str): a) After controlling for differences in economic characteristics of different districts, does the effect
ECON Introductory Econometrics. Lecture 11: Binary dependent variables
 ECON4150 - Introductory Econometrics Lecture 11: Binary dependent variables Monique de Haan (moniqued@econ.uio.no) Stock and Watson Chapter 11 Lecture Outline 2 The linear probability model Nonlinear probability
Economics 300. Econometrics Multiple Regression: Extensions and Issues
 Economics 300 Econometrics Multiple : Extensions and Dennis C. Plott University of Illinois at Chicago Department of Economics www.dennisplott.com Fall 2014 Dennis C. Plott (UIC) ECON 300 Fall 2014 1 /
Topic 4: Model Specifications
 Topic 4: Model Specifications Advanced Econometrics (I) Dong Chen School of Economics, Peking University 1 Functional Forms 1.1 Redefining Variables Change the unit of measurement of the variables will
Economics 300. Econometrics Multiple Regression: Extensions and Issues
 Economics 300 Econometrics Multiple : Extensions and Dennis C. Plott University of Illinois at Chicago Department of Economics www.dennisplott.com Fall 2014 Dennis C. Plott (UIC) ECON 300 Fall 2014 1 /
WISE MA/PhD Programs Econometrics Instructor: Brett Graham Spring Semester, Academic Year Exam Version: A
 WISE MA/PhD Programs Econometrics Instructor: Brett Graham Spring Semester, 2015-16 Academic Year Exam Version: A INSTRUCTIONS TO STUDENTS 1 The time allowed for this examination paper is 2 hours. 2 This
Final Exam. Economics 835: Econometrics. Fall 2010
 Final Exam Economics 835: Econometrics Fall 2010 Please answer the question I ask - no more and no less - and remember that the correct answer is often short and simple. 1 Some short questions a) For each
ECON Introductory Econometrics. Lecture 13: Internal and external validity
 ECON4150 - Introductory Econometrics Lecture 13: Internal and external validity Monique de Haan (moniqued@econ.uio.no) Stock and Watson Chapter 9 Lecture outline 2 Definitions of internal and external
Write your identification number on each paper and cover sheet (the number stated in the upper right hand corner on your exam cover).
.") Formatmall skapad: 2011-12-01 Uppdaterad: 2015-03-06 / LP Department of Economics Course name: Empirical Methods in Economics 2 Course code: EC2404 Semester: Spring 2015 Type of exam: MAIN Examiner: Peter
Formatmall skapad: 2011-12-01 Uppdaterad: 2015-03-06 / LP Department of Economics Course name: Empirical Methods in Economics 2 Course code: EC2404 Semester: Spring 2015 Type of exam: MAIN Examiner: Peter
Honors General Exam Part 3: Econometrics Solutions. Harvard University
 Honors General Exam Part 3: Econometrics Solutions Harvard University April 6, 2016 Lead Pipes and Homicides In the second half of the nineteenth century, many U.S. cities built water supply systems. Some
Econ Spring 2016 Section 9
 Econ 140 - Spring 2016 Section 9 GSI: Fenella Carpena March 31, 2016 1 Assessing Studies Based on Multiple Regression 1.1 Internal Validity Threat to Examples/Cases Internal Validity OVB Example: wages
Introduction to Regression Analysis. Dr. Devlina Chatterjee 11 th August, 2017
 Introduction to Regression Analysis Dr. Devlina Chatterjee 11 th August, 2017 What is regression analysis? Regression analysis is a statistical technique for studying linear relationships. One dependent
Multivariate Regression: Part I
 Topic 1 Multivariate Regression: Part I ARE/ECN 240 A Graduate Econometrics Professor: Òscar Jordà Outline of this topic Statement of the objective: we want to explain the behavior of one variable as a
Causal Inference Lecture Notes: Causal Inference with Repeated Measures in Observational Studies
 Causal Inference Lecture Notes: Causal Inference with Repeated Measures in Observational Studies Kosuke Imai Department of Politics Princeton University November 13, 2013 So far, we have essentially assumed
I 1. 1 Introduction 2. 2 Examples Example: growth, GDP, and schooling California test scores Chandra et al. (2008)...
...") Part I Contents I 1 1 Introduction 2 2 Examples 4 2.1 Example: growth, GDP, and schooling.......................... 4 2.2 California test scores.................................... 5 2.3 Chandra et al.
Part I Contents I 1 1 Introduction 2 2 Examples 4 2.1 Example: growth, GDP, and schooling.......................... 4 2.2 California test scores.................................... 5 2.3 Chandra et al.
Gov 2002: 4. Observational Studies and Confounding
 Gov 2002: 4. Observational Studies and Confounding Matthew Blackwell September 10, 2015 Where are we? Where are we going? Last two weeks: randomized experiments. From here on: observational studies. What
ECON Introductory Econometrics. Lecture 4: Linear Regression with One Regressor
 ECON4150 - Introductory Econometrics Lecture 4: Linear Regression with One Regressor Monique de Haan (moniqued@econ.uio.no) Stock and Watson Chapter 4 Lecture outline 2 The OLS estimators The effect of
Write your identification number on each paper and cover sheet (the number stated in the upper right hand corner on your exam cover).
.") STOCKHOLM UNIVERSITY Department of Economics Course name: Empirical Methods in Economics 2 Course code: EC2402 Examiner: Peter Skogman Thoursie Number of credits: 7,5 credits (hp) Date of exam: Saturday,
STOCKHOLM UNIVERSITY Department of Economics Course name: Empirical Methods in Economics 2 Course code: EC2402 Examiner: Peter Skogman Thoursie Number of credits: 7,5 credits (hp) Date of exam: Saturday,
ECON2228 Notes 8. Christopher F Baum. Boston College Economics. cfb (BC Econ) ECON2228 Notes / 35
 ECON2228 Notes / 35") ECON2228 Notes 8 Christopher F Baum Boston College Economics 2014 2015 cfb (BC Econ) ECON2228 Notes 6 2014 2015 1 / 35 Functional form misspecification Chapter 9: More on specification and data problems
ECON2228 Notes 8 Christopher F Baum Boston College Economics 2014 2015 cfb (BC Econ) ECON2228 Notes 6 2014 2015 1 / 35 Functional form misspecification Chapter 9: More on specification and data problems
Linear Models in Econometrics
 Linear Models in Econometrics Nicky Grant At the most fundamental level econometrics is the development of statistical techniques suited primarily to answering economic questions and testing economic theories.
Sociology 593 Exam 2 Answer Key March 28, 2002
 Sociology 59 Exam Answer Key March 8, 00 I. True-False. (0 points) Indicate whether the following statements are true or false. If false, briefly explain why.. A variable is called CATHOLIC. This probably
2) For a normal distribution, the skewness and kurtosis measures are as follows: A) 1.96 and 4 B) 1 and 2 C) 0 and 3 D) 0 and 0
 For a normal distribution, the skewness and kurtosis measures are as follows: A) 1.96 and 4 B) 1 and 2 C) 0 and 3 D) 0 and 0") Introduction to Econometrics Midterm April 26, 2011 Name Student ID MULTIPLE CHOICE. Choose the one alternative that best completes the statement or answers the question. (5,000 credit for each correct
Introduction to Econometrics Midterm April 26, 2011 Name Student ID MULTIPLE CHOICE. Choose the one alternative that best completes the statement or answers the question. (5,000 credit for each correct
Simultaneous Equation Models Learning Objectives Introduction Introduction (2) Introduction (3) Solving the Model structural equations
 Introduction (3) Solving the Model structural equations") Simultaneous Equation Models. Introduction: basic definitions 2. Consequences of ignoring simultaneity 3. The identification problem 4. Estimation of simultaneous equation models 5. Example: IS LM model
Simultaneous Equation Models. Introduction: basic definitions 2. Consequences of ignoring simultaneity 3. The identification problem 4. Estimation of simultaneous equation models 5. Example: IS LM model
Basic econometrics. Tutorial 3. Dipl.Kfm. Johannes Metzler
 Basic econometrics Tutorial 3 Dipl.Kfm. Introduction Some of you were asking about material to revise/prepare econometrics fundamentals. First of all, be aware that I will not be too technical, only as
 STOCKHOLM UNIVERSITY Department of Economics Course name: Empirical Methods Course code: EC40 Examiner: Lena Nekby Number of credits: 7,5 credits Date of exam: Friday, June 5, 009 Examination time: 3 hours
PhD/MA Econometrics Examination January 2012 PART A
 PhD/MA Econometrics Examination January 2012 PART A ANSWER ANY TWO QUESTIONS IN THIS SECTION NOTE: (1) The indicator function has the properties: (2) Question 1 Let, [defined as if using the indicator
WISE MA/PhD Programs Econometrics Instructor: Brett Graham Spring Semester, Academic Year Exam Version: A
 WISE MA/PhD Programs Econometrics Instructor: Brett Graham Spring Semester, 2016-17 Academic Year Exam Version: A INSTRUCTIONS TO STUDENTS 1 The time allowed for this examination paper is 2 hours. 2 This
2 Prediction and Analysis of Variance
 2 Prediction and Analysis of Variance Reading: Chapters and 2 of Kennedy A Guide to Econometrics Achen, Christopher H. Interpreting and Using Regression (London: Sage, 982). Chapter 4 of Andy Field, Discovering
Econ Spring 2016 Section 9
 Econ 140 - Spring 2016 Section 9 GSI: Fenella Carpena March 31, 2016 1 Assessing Studies Based on Multiple Regression 1.1 Internal Validity Threat to Examples/Cases Internal Validity OVB Example: wages
Introduction to Econometrics
 Introduction to Econometrics STAT-S-301 Introduction to Time Series Regression and Forecasting (2016/2017) Lecturer: Yves Dominicy Teaching Assistant: Elise Petit 1 Introduction to Time Series Regression
Binary Dependent Variable. Regression with a
 Beykent University Faculty of Business and Economics Department of Economics Econometrics II Yrd.Doç.Dr. Özgür Ömer Ersin Regression with a Binary Dependent Variable (SW Chapter 11) SW Ch. 11 1/59 Regression
ECO220Y Simple Regression: Testing the Slope
 ECO220Y Simple Regression: Testing the Slope Readings: Chapter 18 (Sections 18.3-18.5) Winter 2012 Lecture 19 (Winter 2012) Simple Regression Lecture 19 1 / 32 Simple Regression Model y i = β 0 + β 1 x
Notes 11: OLS Theorems ECO 231W - Undergraduate Econometrics
 Notes 11: OLS Theorems ECO 231W - Undergraduate Econometrics Prof. Carolina Caetano For a while we talked about the regression method. Then we talked about the linear model. There were many details, but
LECTURE 10. Introduction to Econometrics. Multicollinearity & Heteroskedasticity
 LECTURE 10 Introduction to Econometrics Multicollinearity & Heteroskedasticity November 22, 2016 1 / 23 ON PREVIOUS LECTURES We discussed the specification of a regression equation Specification consists
Quantitative Economics for the Evaluation of the European Policy
 Quantitative Economics for the Evaluation of the European Policy Dipartimento di Economia e Management Irene Brunetti Davide Fiaschi Angela Parenti 1 25th of September, 2017 1 ireneb@ec.unipi.it, davide.fiaschi@unipi.it,
Selection on Observables: Propensity Score Matching.
 Selection on Observables: Propensity Score Matching. Department of Economics and Management Irene Brunetti ireneb@ec.unipi.it 24/10/2017 I. Brunetti Labour Economics in an European Perspective 24/10/2017
Statistical Inference with Regression Analysis
 Introductory Applied Econometrics EEP/IAS 118 Spring 2015 Steven Buck Lecture #13 Statistical Inference with Regression Analysis Next we turn to calculating confidence intervals and hypothesis testing
ECON Introductory Econometrics. Lecture 16: Instrumental variables
 ECON4150 - Introductory Econometrics Lecture 16: Instrumental variables Monique de Haan (moniqued@econ.uio.no) Stock and Watson Chapter 12 Lecture outline 2 OLS assumptions and when they are violated Instrumental
Linear Regression. Junhui Qian. October 27, 2014
 Linear Regression Junhui Qian October 27, 2014 Outline The Model Estimation Ordinary Least Square Method of Moments Maximum Likelihood Estimation Properties of OLS Estimator Unbiasedness Consistency Efficiency
Chapter 6 Stochastic Regressors
 Chapter 6 Stochastic Regressors 6. Stochastic regressors in non-longitudinal settings 6.2 Stochastic regressors in longitudinal settings 6.3 Longitudinal data models with heterogeneity terms and sequentially
Session IV Instrumental Variables
 Impact Evaluation Session IV Instrumental Variables Christel M. J. Vermeersch January 008 Human Development Human Network Development Network Middle East and North Africa Middle East Region and North Africa
Treatment Effects. Christopher Taber. September 6, Department of Economics University of Wisconsin-Madison
 Treatment Effects Christopher Taber Department of Economics University of Wisconsin-Madison September 6, 2017 Notation First a word on notation I like to use i subscripts on random variables to be clear
Metrics Honors Review
 Metrics Honors Review petertu@fas.harvard.edu Harvard University Department of Economics 26 March 2015 : Logistics Exam Date: Wednesday, April 8 from 3-6pm in Sever Hall 113 The exam covers material from
Job Training Partnership Act (JTPA)
") Causal inference Part I.b: randomized experiments, matching and regression (this lecture starts with other slides on randomized experiments) Frank Venmans Example of a randomized experiment: Job Training
Causal inference Part I.b: randomized experiments, matching and regression (this lecture starts with other slides on randomized experiments) Frank Venmans Example of a randomized experiment: Job Training
Addressing Analysis Issues REGRESSION-DISCONTINUITY (RD) DESIGN
 DESIGN") Addressing Analysis Issues REGRESSION-DISCONTINUITY (RD) DESIGN Overview Assumptions of RD Causal estimand of interest Discuss common analysis issues In the afternoon, you will have the opportunity to
Addressing Analysis Issues REGRESSION-DISCONTINUITY (RD) DESIGN Overview Assumptions of RD Causal estimand of interest Discuss common analysis issues In the afternoon, you will have the opportunity to
PSC 504: Instrumental Variables
 PSC 504: Instrumental Variables Matthew Blackwell 3/28/2013 Instrumental Variables and Structural Equation Modeling Setup e basic idea behind instrumental variables is that we have a treatment with unmeasured
MGEC11H3Y L01 Introduction to Regression Analysis Term Test Friday July 5, PM Instructor: Victor Yu
 Last Name (Print): Solution First Name (Print): Student Number: MGECHY L Introduction to Regression Analysis Term Test Friday July, PM Instructor: Victor Yu Aids allowed: Time allowed: Calculator and one