Represent processes and observations that span multiple levels (aka multi level models) R 2
|
|
|
- Rhoda Stevenson
- 6 years ago
- Views:
Transcription
1 Hierarchical models
2 Hierarchical models Represent processes and observations that span multiple levels (aka multi level models) R 1 R 2 R 3 N 1 N 2 N 3 N 4 N 5 N 6 N 7 N 8 N 9 N i = true abundance on a plot Consider factors that govern abundance at the plot scale R j = true abundance in a region Consider factors that govern abundance at the regional scale Consider processes important at each scale or at many scales
3 Hierarchical models Add additional levels N 1 R 1 N 2 N 3 ρ λ state processes o 1 o 2 o n o 1 o 2 o n o 1 o 2 o n p observation process Define parameters for each level Hierarchical, because parameters at one level govern parameters at lower level
4 Two level hierarchical model y ij ~ N(θ i, σ i2 ) level 1, i = sites, j = surveys Key idea: Consider an attribute of a sample unit, θ i, as having been drawn from an underlying distribution. We don t estimate θ i s for each sample unit, but instead we estimate parameters of the distribution from which θs were drawn θ i ~ N(θ, σ 2 ) level 2 Parameters of interest are θ and σ 2, which in this case are the mean and variance of the distribution of θ i s; we estimate these from data
5 Two level hierarchical model Key idea: Estimate parameters of the upper level distribution assumed to govern processes that give rise to data observed at lower levels Parameters from all levels are estimated simultaneously Important because uncertainty at one level affects inferences at other levels Most alternative modeling frameworks do not allow us to model state and observation processes simultaneously Modeling density with Program DISTANCE? Modeling abundance in Program MARK?
6 Hierarchical models Two common types: 1) Latent variable models 2) Mixed effects models N 3 λ o 1 o 2 o n p
7 Hierarchical models in ecology Ecological Process Model for describing state variables (latent or unobserved): abundance, occupancy, survival Parameters: λ, ψ, φ Site / individual covariates Observation Process Model for describing the detection process Parameter: p Site / individual covariates Survey covariates Realized Data: y 1, y 2, y 3,, y n


8 Imperfect observations
9 Imperfect observations Wish to estimate abundance of a species on a plot, N i Use a survey method that yields counts on plots, C i, e.g, point counts, line transects, removals, etc. Probability that we observe an individual that is present, β, is often <1 No. individuals counted is related to true abundance: C = β N, where β ranges from 0 1 Translate C into an estimate of abundance: Example: Count 5 quail on a plot; if β = 0.25, then: =5/0.25=20
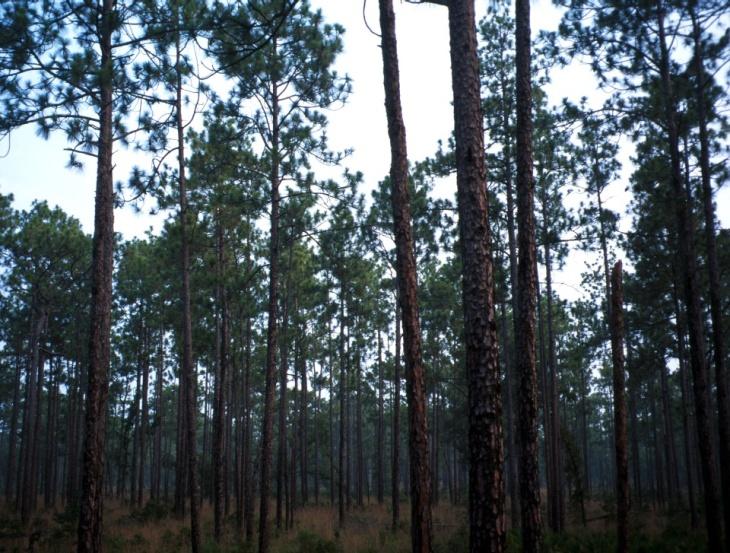
10 Occupancy, single season
11 Presence absence data Classifying a species as present or absent across space is the basis for studying biogeography (study of distributions) and many types of habitat analyses Changes in present absent status over time is the basis for patch dynamics and metapopulation dynamics Problem: when detection process is imperfect, we cannot distinguish non detection from absence Estimates of the area occupied will be biased
12 What is occupancy? Occupancy proportion of area, patches, or other sample unit occupied by a species Probability of occupancy probability (ψ) that any given unit within a sampling frame is occupied Single season goal: estimate ψ when p < 1 during a single season Multi season goal: dynamics = colonization and extinction

13 Changes in geographic range Has purple loosestrife spread across the Lake Erie basin? If so, how fast? Are eradication methods working?


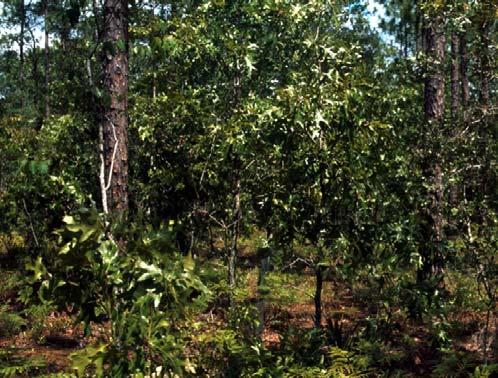
14 Habitat relationships and resource selection Identify habitat features associated with selection Classify presence absence of species on sample units, then assess with logistic regression Does not account for false absences = imperfect detection
15 Occupancy as a parameter Trade offs: Not as sensitive as abundance to changes over time ψ = 1 Year 1 Year 2 Year 3 Value of ψ is a function of size of sample units (sites) Ψ = 4/4 = 1.0 Ψ = 9/25 = 0.36
16 Basic sampling scheme Select a sample of s units ( sites ) from a larger set of S units (population) Survey each site K times and record whether species of interest is detected or not = temporal replication Resurvey all sites in sample, even those where species detected previously forms the basis for estimating detection probability Sampling can be direct (visual) or indirect (tracks)

17 Occupancy: hierarchical structure Season 1 Sites 1 2 S Surveys 1 2 K K 2 Closure
18 Encounter histories 0, 1, 0, 1, 1 1, 0, 1, 1, 1 0, 0, 0, 0, 0 Detection No Detection
19 Encounter histories Survey results: 1 = detected 0 = not detected Survey history for each site: When surveys complete, we have two types of sites: Detection Occupied Site ID A B C D E F G No Detection Not occupied Occupied, but not detected
20 Ideas underlying estimates Site Survey 1 Survey 2 Survey 3 Survey If surveys were perfect, would indicate true absence, so we could estimate ψ as proportion of sites with 1 detection Naïve estimate of ψ = ¾ or 0.75 If surveys imperfect, estimate p from sites with 1detections p = ( ) / 3 = 0.58
21 Estimate ψ and p Use a model based approach to estimate occupancy and detection parameters simultaneously Consider two stochastic process: Occupancy: a site will either be occupied with probability ψ or unoccupied with probability 1 ψ Detection: if site unoccupied, species cannot be detected; if site occupied, then at each survey there is some probability of detecting the species (p): Species detected = ψ Species not detected = 1 ψ or ψ(1 p)
22 Binomial distribution Discrete distribution. Represents the outcome of a number of independent Bernoulli trials = events with two possible outcomes Notation: Bin(n, p) Parameters: n = number of trials, p = prob. of success each trial p = 0.1 (blue) p = 0.5 (green) p = 0.8 (red) n = 20
23 Occupancy: single season Ecological Process Z i ~ Bin(1, ψ) Unobservable true occupancy (state) Binomial distribution Probability of occupancy Observation Process y ij ~ Bin(1, Z i p) Observed outcome Binomial distribution Unobservable true state of occupancy Probability of detection
24 Logistic regression Binary response, so represent the response (stochastic part) with binomial distribution; mean is a probability or proportion (p) Link function is the logit (log odds): logit(y) = β 0 + β 1 x 1 + β 2 x 2 + Occupancy state: logit(ψ i ), i = no. sites Observation process: logit(p ij ), j = no. visits/site Binomial distribution y ~ Bin(N, p) Observed outcome Number trials Prob(occupancy) or Prob(detection)
25 Assumptions Species never falsely detected when absent Detection of a species at a site independent of detecting species at other sites Sites closed to changes in occupancy state during survey period (no colonization or extinction) ψ and p constant across sites, unless heterogeneity in parameters is explained by covariates
26 Accounting for heterogeneity with covariates Consider additional factors to explain variation in ψ and p ψ can be modeled as a function of site level covariates covariates for ψ must remain constant during survey period; e.g., plant community, patch size p can be modeled as a function of: site level covariates; e.g., vegetation cover survey level covariates; e.g., cloud cover, air temperature, observer
27 Covariates Two types: Site level covariates (for ψ and p) Observation level covariates (for p) Surv.1 Surv.2 Surv.3 Surv.4 Buffel% Time.1 Time.2 Time.3 Time.4 Site M E M E Site E M E M Site E M E M Site M E M E M = morning E = evening
28 Adding covariates Extend models with Generalized Linear Modeling framework that allow us to model linear functions regardless of the distribution of the response Ecological and Observation Processes y ij ~ Bin(N i, p ij ) logit(p) = β 0 + β 1 X 1 + β 2 X 2 + +β n X n
29 Run models to estimate parameters For estimates based on maximum likelihood methods: Code directly in R Use UNMARKED package in R For estimates based on Bayesian methods: WinBUGS OpenBUGS JAGS
30 Fitting models in Unmarked Develop and fit a set of candidate models for the state variable (here, occupancy) and detection process robject < occu (~detect ~occupancy, UMF) time.buff < occu (~time ~buffel, goagumf) timedate.buffyear < occu (~time + date ~ buff + year, goagumf) Use model selection or frequentist methods to establish model for inference
Occupancy models. Gurutzeta Guillera-Arroita University of Kent, UK National Centre for Statistical Ecology
 Occupancy models Gurutzeta Guillera-Arroita University of Kent, UK National Centre for Statistical Ecology Advances in Species distribution modelling in ecological studies and conservation Pavia and Gran
High-Throughput Sequencing Course
 High-Throughput Sequencing Course DESeq Model for RNA-Seq Biostatistics and Bioinformatics Summer 2017 Outline Review: Standard linear regression model (e.g., to model gene expression as function of an
Topic 12 Overview of Estimation
 Topic 12 Overview of Estimation Classical Statistics 1 / 9 Outline Introduction Parameter Estimation Classical Statistics Densities and Likelihoods 2 / 9 Introduction In the simplest possible terms, the
Proposed methods for analyzing microbial community dynamics. Zaid Abdo March 23, 2011
 Proposed methods for analyzing microbial community dynamics Zaid Abdo March 23, 2011 Goals Data Model Preliminary Results There are two main goals for the data analysis as I see it: 1. Provide a viable,
Estimating abundance of unmarked animal populations: accounting for imperfect detection and other sources of zero inflation
 Methods in Ecology and Evolution 2015, 6, 543 556 doi: 10.1111/2041-210X.12333 Estimating abundance of unmarked animal populations: accounting for imperfect detection and other sources of zero inflation
Introduction to Occupancy Models. Jan 8, 2016 AEC 501 Nathan J. Hostetter
 Introduction to Occupancy Models Jan 8, 2016 AEC 501 Nathan J. Hostetter njhostet@ncsu.edu 1 Occupancy Abundance often most interesting variable when analyzing a population Occupancy probability that a
Incorporating Boosted Regression Trees into Ecological Latent Variable Models
 Incorporating Boosted Regression Trees into Ecological Latent Variable Models Rebecca A. Hutchinson, Li-Ping Liu, Thomas G. Dietterich School of EECS, Oregon State University Motivation Species Distribution
Bayesian Learning (II)
") Universität Potsdam Institut für Informatik Lehrstuhl Maschinelles Lernen Bayesian Learning (II) Niels Landwehr Overview Probabilities, expected values, variance Basic concepts of Bayesian learning MAP
Universität Potsdam Institut für Informatik Lehrstuhl Maschinelles Lernen Bayesian Learning (II) Niels Landwehr Overview Probabilities, expected values, variance Basic concepts of Bayesian learning MAP
Equivalence of random-effects and conditional likelihoods for matched case-control studies
 Equivalence of random-effects and conditional likelihoods for matched case-control studies Ken Rice MRC Biostatistics Unit, Cambridge, UK January 8 th 4 Motivation Study of genetic c-erbb- exposure and
Variability within multi-component systems. Bayesian inference in probabilistic risk assessment The current state of the art
 PhD seminar series Probabilistics in Engineering : g Bayesian networks and Bayesian hierarchical analysis in engeering g Conducted by Prof. Dr. Maes, Prof. Dr. Faber and Dr. Nishijima Variability within
Latent Variable Models for Binary Data. Suppose that for a given vector of explanatory variables x, the latent
 Latent Variable Models for Binary Data Suppose that for a given vector of explanatory variables x, the latent variable, U, has a continuous cumulative distribution function F (u; x) and that the binary
CHAPTER 21. Occupancy models
 CHAPTER 21 Occupancy models Brian D. Gerber, Brittany Mosher, Daniel Martin, Larissa Bailey, Colorado State University Thierry Chambert, Penn State University & USGS As ecologists and conservation biologists,
Approach to Field Research Data Generation and Field Logistics Part 1. Road Map 8/26/2016
 Approach to Field Research Data Generation and Field Logistics Part 1 Lecture 3 AEC 460 Road Map How we do ecology Part 1 Recap Types of data Sampling abundance and density methods Part 2 Sampling design
Probability and Information Theory. Sargur N. Srihari
 Probability and Information Theory Sargur N. srihari@cedar.buffalo.edu 1 Topics in Probability and Information Theory Overview 1. Why Probability? 2. Random Variables 3. Probability Distributions 4. Marginal
STA216: Generalized Linear Models. Lecture 1. Review and Introduction
 STA216: Generalized Linear Models Lecture 1. Review and Introduction Let y 1,..., y n denote n independent observations on a response Treat y i as a realization of a random variable Y i In the general
STA 216, GLM, Lecture 16. October 29, 2007
 STA 216, GLM, Lecture 16 October 29, 2007 Efficient Posterior Computation in Factor Models Underlying Normal Models Generalized Latent Trait Models Formulation Genetic Epidemiology Illustration Structural
Spatial Statistics with Image Analysis. Outline. A Statistical Approach. Johan Lindström 1. Lund October 6, 2016
 Spatial Statistics Spatial Examples More Spatial Statistics with Image Analysis Johan Lindström 1 1 Mathematical Statistics Centre for Mathematical Sciences Lund University Lund October 6, 2016 Johan Lindström
multilevel modeling: concepts, applications and interpretations
 multilevel modeling: concepts, applications and interpretations lynne c. messer 27 october 2010 warning social and reproductive / perinatal epidemiologist concepts why context matters multilevel models
Biometrics Unit and Surveys. North Metro Area Office C West Broadway Forest Lake, Minnesota (651)
") Biometrics Unit and Surveys North Metro Area Office 5463 - C West Broadway Forest Lake, Minnesota 55025 (651) 296-5200 QUANTIFYING THE EFFECT OF HABITAT AVAILABILITY ON SPECIES DISTRIBUTIONS 1 Geert Aarts
Biometrics Unit and Surveys North Metro Area Office 5463 - C West Broadway Forest Lake, Minnesota 55025 (651) 296-5200 QUANTIFYING THE EFFECT OF HABITAT AVAILABILITY ON SPECIES DISTRIBUTIONS 1 Geert Aarts
Bayesian Hierarchical Models
 Bayesian Hierarchical Models Gavin Shaddick, Millie Green, Matthew Thomas University of Bath 6 th - 9 th December 2016 1/ 34 APPLICATIONS OF BAYESIAN HIERARCHICAL MODELS 2/ 34 OUTLINE Spatial epidemiology
Lecture 09 - Patch Occupancy and Patch Dynamics
 WILD 7970 - Analysis of Wildlife Populations 1 of 11 Lecture 09 - Patch Occupancy and Patch Dynamics Resources Site Occupancy D. I. MacKenzie, J. D. Nichols, G. D. Lachman, S. Droege, J. A. Royle, and
Review of Panel Data Model Types Next Steps. Panel GLMs. Department of Political Science and Government Aarhus University.
 Panel GLMs Department of Political Science and Government Aarhus University May 12, 2015 1 Review of Panel Data 2 Model Types 3 Review and Looking Forward 1 Review of Panel Data 2 Model Types 3 Review
Logistic regression: Why we often can do what we think we can do. Maarten Buis 19 th UK Stata Users Group meeting, 10 Sept. 2015
 Logistic regression: Why we often can do what we think we can do Maarten Buis 19 th UK Stata Users Group meeting, 10 Sept. 2015 1 Introduction Introduction - In 2010 Carina Mood published an overview article
Stat Lecture 20. Last class we introduced the covariance and correlation between two jointly distributed random variables.
 Stat 260 - Lecture 20 Recap of Last Class Last class we introduced the covariance and correlation between two jointly distributed random variables. Today: We will introduce the idea of a statistic and
A.I. in health informatics lecture 2 clinical reasoning & probabilistic inference, I. kevin small & byron wallace
 A.I. in health informatics lecture 2 clinical reasoning & probabilistic inference, I kevin small & byron wallace today a review of probability random variables, maximum likelihood, etc. crucial for clinical
Generalized Linear Models. Last time: Background & motivation for moving beyond linear
 Generalized Linear Models Last time: Background & motivation for moving beyond linear regression - non-normal/non-linear cases, binary, categorical data Today s class: 1. Examples of count and ordered
Reconstruction of individual patient data for meta analysis via Bayesian approach
 Reconstruction of individual patient data for meta analysis via Bayesian approach Yusuke Yamaguchi, Wataru Sakamoto and Shingo Shirahata Graduate School of Engineering Science, Osaka University Masashi
ECE521 Tutorial 11. Topic Review. ECE521 Winter Credits to Alireza Makhzani, Alex Schwing, Rich Zemel and TAs for slides. ECE521 Tutorial 11 / 4
 ECE52 Tutorial Topic Review ECE52 Winter 206 Credits to Alireza Makhzani, Alex Schwing, Rich Zemel and TAs for slides ECE52 Tutorial ECE52 Winter 206 Credits to Alireza / 4 Outline K-means, PCA 2 Bayesian
Modern Methods of Statistical Learning sf2935 Lecture 5: Logistic Regression T.K
 Lecture 5: Logistic Regression T.K. 10.11.2016 Overview of the Lecture Your Learning Outcomes Discriminative v.s. Generative Odds, Odds Ratio, Logit function, Logistic function Logistic regression definition
Introduction to mtm: An R Package for Marginalized Transition Models
 Introduction to mtm: An R Package for Marginalized Transition Models Bryan A. Comstock and Patrick J. Heagerty Department of Biostatistics University of Washington 1 Introduction Marginalized transition
Generalized Linear Models for Non-Normal Data
 Generalized Linear Models for Non-Normal Data Today s Class: 3 parts of a generalized model Models for binary outcomes Complications for generalized multivariate or multilevel models SPLH 861: Lecture
Linear Regression. Data Model. β, σ 2. Process Model. ,V β. ,s 2. s 1. Parameter Model
 Regression: Part II Linear Regression y~n X, 2 X Y Data Model β, σ 2 Process Model Β 0,V β s 1,s 2 Parameter Model Assumptions of Linear Model Homoskedasticity No error in X variables Error in Y variables
Theory of Maximum Likelihood Estimation. Konstantin Kashin
 Gov 2001 Section 5: Theory of Maximum Likelihood Estimation Konstantin Kashin February 28, 2013 Outline Introduction Likelihood Examples of MLE Variance of MLE Asymptotic Properties What is Statistical
Making rating curves - the Bayesian approach
 Making rating curves - the Bayesian approach Rating curves what is wanted? A best estimate of the relationship between stage and discharge at a given place in a river. The relationship should be on the
Previous lecture. P-value based combination. Fixed vs random effects models. Meta vs. pooled- analysis. New random effects testing.
 Previous lecture P-value based combination. Fixed vs random effects models. Meta vs. pooled- analysis. New random effects testing. Interaction Outline: Definition of interaction Additive versus multiplicative
Chapter 5 Lecture. Metapopulation Ecology. Spring 2013
 Chapter 5 Lecture Metapopulation Ecology Spring 2013 5.1 Fundamentals of Metapopulation Ecology Populations have a spatial component and their persistence is based upon: Gene flow ~ immigrations and emigrations
Darryl I. MacKenzie 1
 Aust. N. Z. J. Stat. 47(1), 2005, 65 74 WAS IT THERE? DEALING WITH IMPERFECT DETECTION FOR SPECIES PRESENCE/ABSENCE DATA Darryl I. MacKenzie 1 Proteus Wildlife Research Consultants Summary Species presence/absence
AGEC 661 Note Fourteen
 AGEC 661 Note Fourteen Ximing Wu 1 Selection bias 1.1 Heckman s two-step model Consider the model in Heckman (1979) Y i = X iβ + ε i, D i = I {Z iγ + η i > 0}. For a random sample from the population,
Two-step centered spatio-temporal auto-logistic regression model
 Two-step centered spatio-temporal auto-logistic regression model Anne Gégout-Petit, Shuxian Li To cite this version: Anne Gégout-Petit, Shuxian Li. Two-step centered spatio-temporal auto-logistic regression
Lecture 3.1 Basic Logistic LDA
 y Lecture.1 Basic Logistic LDA 0.2.4.6.8 1 Outline Quick Refresher on Ordinary Logistic Regression and Stata Women s employment example Cross-Over Trial LDA Example -100-50 0 50 100 -- Longitudinal Data
Plausible Values for Latent Variables Using Mplus
 Plausible Values for Latent Variables Using Mplus Tihomir Asparouhov and Bengt Muthén August 21, 2010 1 1 Introduction Plausible values are imputed values for latent variables. All latent variables can
CIMAT Taller de Modelos de Capture y Recaptura Known Fate Survival Analysis
 CIMAT Taller de Modelos de Capture y Recaptura 2010 Known Fate urvival Analysis B D BALANCE MODEL implest population model N = λ t+ 1 N t Deeper understanding of dynamics can be gained by identifying variation
Multilevel Statistical Models: 3 rd edition, 2003 Contents
 Multilevel Statistical Models: 3 rd edition, 2003 Contents Preface Acknowledgements Notation Two and three level models. A general classification notation and diagram Glossary Chapter 1 An introduction
Human-Oriented Robotics. Probability Refresher. Kai Arras Social Robotics Lab, University of Freiburg Winter term 2014/2015
 Probability Refresher Kai Arras, University of Freiburg Winter term 2014/2015 Probability Refresher Introduction to Probability Random variables Joint distribution Marginalization Conditional probability
Logistic Regression for Distribution Modeling
 Logistic Regression for Distribution Modeling GIS5306 GIS Applications in Environmental Systems Presented by: Andrea Palmiotto John Perry Theory Familiar Territory Linear Regression Relevant Assumptions
Bayesian Methods for Machine Learning
 Bayesian Methods for Machine Learning CS 584: Big Data Analytics Material adapted from Radford Neal s tutorial (http://ftp.cs.utoronto.ca/pub/radford/bayes-tut.pdf), Zoubin Ghahramni (http://hunch.net/~coms-4771/zoubin_ghahramani_bayesian_learning.pdf),
Bayesian course - problem set 6 (lecture 7)
") Bayesian course - problem set 6 (lecture 7) Ben Lambert December 7, 2016 1 A meta-analysis of beta blocker trials Table 1 shows the results of some of the 22 trials included in a meta-analysis of clinical
Bayesian course - problem set 6 (lecture 7) Ben Lambert December 7, 2016 1 A meta-analysis of beta blocker trials Table 1 shows the results of some of the 22 trials included in a meta-analysis of clinical
Frequentist-Bayesian Model Comparisons: A Simple Example
 Frequentist-Bayesian Model Comparisons: A Simple Example Consider data that consist of a signal y with additive noise: Data vector (N elements): D = y + n The additive noise n has zero mean and diagonal
Chapter 4: Factor Analysis
 Chapter 4: Factor Analysis In many studies, we may not be able to measure directly the variables of interest. We can merely collect data on other variables which may be related to the variables of interest.
FREQUENTIST BEHAVIOR OF FORMAL BAYESIAN INFERENCE
 FREQUENTIST BEHAVIOR OF FORMAL BAYESIAN INFERENCE Donald A. Pierce Oregon State Univ (Emeritus), RERF Hiroshima (Retired), Oregon Health Sciences Univ (Adjunct) Ruggero Bellio Univ of Udine For Perugia
DS-GA 1002 Lecture notes 11 Fall Bayesian statistics
 DS-GA 100 Lecture notes 11 Fall 016 Bayesian statistics In the frequentist paradigm we model the data as realizations from a distribution that depends on deterministic parameters. In contrast, in Bayesian
Probability Review - Bayes Introduction
 Probability Review - Bayes Introduction Statistics 220 Spring 2005 Copyright c 2005 by Mark E. Irwin Advantages of Bayesian Analysis Answers the questions that researchers are usually interested in, What
Graduate Econometrics I: What is econometrics?
 Graduate Econometrics I: What is econometrics? Yves Dominicy Université libre de Bruxelles Solvay Brussels School of Economics and Management ECARES Yves Dominicy Graduate Econometrics I: What is econometrics?
Multi-level Models: Idea
 Review of 140.656 Review Introduction to multi-level models The two-stage normal-normal model Two-stage linear models with random effects Three-stage linear models Two-stage logistic regression with random
Ninth ARTNeT Capacity Building Workshop for Trade Research "Trade Flows and Trade Policy Analysis"
 Ninth ARTNeT Capacity Building Workshop for Trade Research "Trade Flows and Trade Policy Analysis" June 2013 Bangkok, Thailand Cosimo Beverelli and Rainer Lanz (World Trade Organization) 1 Selected econometric
,..., θ(2),..., θ(n)
,..., θ(n)") Likelihoods for Multivariate Binary Data Log-Linear Model We have 2 n 1 distinct probabilities, but we wish to consider formulations that allow more parsimonious descriptions as a function of covariates.
Likelihoods for Multivariate Binary Data Log-Linear Model We have 2 n 1 distinct probabilities, but we wish to consider formulations that allow more parsimonious descriptions as a function of covariates.
MS&E 226: Small Data
 MS&E 226: Small Data Lecture 9: Logistic regression (v2) Ramesh Johari ramesh.johari@stanford.edu 1 / 28 Regression methods for binary outcomes 2 / 28 Binary outcomes For the duration of this lecture suppose
Metapopulations with infinitely many patches
 Metapopulations with infinitely many patches Phil. Pollett The University of Queensland UQ ACEMS Research Group Meeting 10th September 2018 Phil. Pollett (The University of Queensland) Infinite-patch metapopulations
A Discussion of the Bayesian Approach
 A Discussion of the Bayesian Approach Reference: Chapter 10 of Theoretical Statistics, Cox and Hinkley, 1974 and Sujit Ghosh s lecture notes David Madigan Statistics The subject of statistics concerns
Design and Analysis of Ecological Data Landscape of Statistical Methods: Part 2
 Design and Analysis of Ecological Data Landscape of Statistical Methods: Part 2 1. Correlated errors.............................................................. 2 1.1 Temporal correlation......................................................
Mixed Models for Longitudinal Ordinal and Nominal Outcomes
 Mixed Models for Longitudinal Ordinal and Nominal Outcomes Don Hedeker Department of Public Health Sciences Biological Sciences Division University of Chicago hedeker@uchicago.edu Hedeker, D. (2008). Multilevel
Introduction to Statistical Analysis
 Introduction to Statistical Analysis Changyu Shen Richard A. and Susan F. Smith Center for Outcomes Research in Cardiology Beth Israel Deaconess Medical Center Harvard Medical School Objectives Descriptive
Intro to Probability. Andrei Barbu
 Intro to Probability Andrei Barbu Some problems Some problems A means to capture uncertainty Some problems A means to capture uncertainty You have data from two sources, are they different? Some problems
Part 8: GLMs and Hierarchical LMs and GLMs
 Part 8: GLMs and Hierarchical LMs and GLMs 1 Example: Song sparrow reproductive success Arcese et al., (1992) provide data on a sample from a population of 52 female song sparrows studied over the course
Goal. Background and motivation
 Biodiversity dynamics under intransitive competition and habitat destruction Matthew J. Labrum Department of Mathematics, Washington State University, Pullman, USA Goal To investigate how biodiversity
Clinical Trials. Olli Saarela. September 18, Dalla Lana School of Public Health University of Toronto.
 Introduction to Dalla Lana School of Public Health University of Toronto olli.saarela@utoronto.ca September 18, 2014 38-1 : a review 38-2 Evidence Ideal: to advance the knowledge-base of clinical medicine,
Statistics 572 Semester Review
 Statistics 572 Semester Review Final Exam Information: The final exam is Friday, May 16, 10:05-12:05, in Social Science 6104. The format will be 8 True/False and explains questions (3 pts. each/ 24 pts.
Stat 542: Item Response Theory Modeling Using The Extended Rank Likelihood
 Stat 542: Item Response Theory Modeling Using The Extended Rank Likelihood Jonathan Gruhl March 18, 2010 1 Introduction Researchers commonly apply item response theory (IRT) models to binary and ordinal
MS&E 226: Small Data
 MS&E 226: Small Data Lecture 12: Logistic regression (v1) Ramesh Johari ramesh.johari@stanford.edu Fall 2015 1 / 30 Regression methods for binary outcomes 2 / 30 Binary outcomes For the duration of this
Bayesian Inference. Chapter 4: Regression and Hierarchical Models
 Bayesian Inference Chapter 4: Regression and Hierarchical Models Conchi Ausín and Mike Wiper Department of Statistics Universidad Carlos III de Madrid Master in Business Administration and Quantitative
Machine Learning. Lecture 3: Logistic Regression. Feng Li.
 Machine Learning Lecture 3: Logistic Regression Feng Li fli@sdu.edu.cn https://funglee.github.io School of Computer Science and Technology Shandong University Fall 2016 Logistic Regression Classification
Random Variable. Discrete Random Variable. Continuous Random Variable. Discrete Random Variable. Discrete Probability Distribution
 Random Variable Theoretical Probability Distribution Random Variable Discrete Probability Distributions A variable that assumes a numerical description for the outcome of a random eperiment (by chance).
Signal Modeling, Statistical Inference and Data Mining in Astrophysics
 ASTRONOMY 6523 Spring 2013 Signal Modeling, Statistical Inference and Data Mining in Astrophysics Course Approach The philosophy of the course reflects that of the instructor, who takes a dualistic view
Probability Theory for Machine Learning. Chris Cremer September 2015
 Probability Theory for Machine Learning Chris Cremer September 2015 Outline Motivation Probability Definitions and Rules Probability Distributions MLE for Gaussian Parameter Estimation MLE and Least Squares
An introduction to biostatistics: part 1
 An introduction to biostatistics: part 1 Cavan Reilly September 6, 2017 Table of contents Introduction to data analysis Uncertainty Probability Conditional probability Random variables Discrete random
NELS 88. Latent Response Variable Formulation Versus Probability Curve Formulation
 NELS 88 Table 2.3 Adjusted odds ratios of eighth-grade students in 988 performing below basic levels of reading and mathematics in 988 and dropping out of school, 988 to 990, by basic demographics Variable
Brett Skelly, Katharine Lewis, Reina Tyl, Gordon Dimmig & Christopher Rota West Virginia University
 CHAPTER 22 Occupancy models multi-species Brett Skelly, Katharine Lewis, Reina Tyl, Gordon Dimmig & Christopher Rota West Virginia University Ecological communities are composed of multiple interacting
Introduction to capture-markrecapture
 E-iNET Workshop, University of Kent, December 2014 Introduction to capture-markrecapture models Rachel McCrea Overview Introduction Lincoln-Petersen estimate Maximum-likelihood theory* Capture-mark-recapture
Spring 2012 Math 541B Exam 1
 Spring 2012 Math 541B Exam 1 1. A sample of size n is drawn without replacement from an urn containing N balls, m of which are red and N m are black; the balls are otherwise indistinguishable. Let X denote
Single-level Models for Binary Responses
 Single-level Models for Binary Responses Distribution of Binary Data y i response for individual i (i = 1,..., n), coded 0 or 1 Denote by r the number in the sample with y = 1 Mean and variance E(y) =
H-LIKELIHOOD ESTIMATION METHOOD FOR VARYING CLUSTERED BINARY MIXED EFFECTS MODEL
 H-LIKELIHOOD ESTIMATION METHOOD FOR VARYING CLUSTERED BINARY MIXED EFFECTS MODEL Intesar N. El-Saeiti Department of Statistics, Faculty of Science, University of Bengahzi-Libya. entesar.el-saeiti@uob.edu.ly
Supplementary Note on Bayesian analysis
 Supplementary Note on Bayesian analysis Structured variability of muscle activations supports the minimal intervention principle of motor control Francisco J. Valero-Cuevas 1,2,3, Madhusudhan Venkadesan
2.3 Estimating PDFs and PDF Parameters
 .3 Estimating PDFs and PDF Parameters estimating means - discrete and continuous estimating variance using a known mean estimating variance with an estimated mean estimating a discrete pdf estimating a
Bayesian Inference by Density Ratio Estimation
 Bayesian Inference by Density Ratio Estimation Michael Gutmann https://sites.google.com/site/michaelgutmann Institute for Adaptive and Neural Computation School of Informatics, University of Edinburgh
Ecology Regulation, Fluctuations and Metapopulations
 Ecology Regulation, Fluctuations and Metapopulations The Influence of Density on Population Growth and Consideration of Geographic Structure in Populations Predictions of Logistic Growth The reality of
The Naïve Bayes Classifier. Machine Learning Fall 2017
 The Naïve Bayes Classifier Machine Learning Fall 2017 1 Today s lecture The naïve Bayes Classifier Learning the naïve Bayes Classifier Practical concerns 2 Today s lecture The naïve Bayes Classifier Learning
Data Analysis and Monte Carlo Methods
 Lecturer: Allen Caldwell, Max Planck Institute for Physics & TUM Recitation Instructor: Oleksander (Alex) Volynets, MPP & TUM General Information: - Lectures will be held in English, Mondays 16-18:00 -
Physician Performance Assessment / Spatial Inference of Pollutant Concentrations
 Physician Performance Assessment / Spatial Inference of Pollutant Concentrations Dawn Woodard Operations Research & Information Engineering Cornell University Johns Hopkins Dept. of Biostatistics, April
Introduction to lnmle: An R Package for Marginally Specified Logistic-Normal Models for Longitudinal Binary Data
 Introduction to lnmle: An R Package for Marginally Specified Logistic-Normal Models for Longitudinal Binary Data Bryan A. Comstock and Patrick J. Heagerty Department of Biostatistics University of Washington
Estimation of Optimally-Combined-Biomarker Accuracy in the Absence of a Gold-Standard Reference Test
 Estimation of Optimally-Combined-Biomarker Accuracy in the Absence of a Gold-Standard Reference Test L. García Barrado 1 E. Coart 2 T. Burzykowski 1,2 1 Interuniversity Institute for Biostatistics and
Bayesian spatial quantile regression
 Brian J. Reich and Montserrat Fuentes North Carolina State University and David B. Dunson Duke University E-mail:reich@stat.ncsu.edu Tropospheric ozone Tropospheric ozone has been linked with several adverse
Supplementary Materials for Molecular QTL Discovery Incorporating Genomic Annotations using Bayesian False Discovery Rate Control
 Supplementary Materials for Molecular QTL Discovery Incorporating Genomic Annotations using Bayesian False Discovery Rate Control Xiaoquan Wen Department of Biostatistics, University of Michigan A Model
PATTERN RECOGNITION AND MACHINE LEARNING CHAPTER 2: PROBABILITY DISTRIBUTIONS
 PATTERN RECOGNITION AND MACHINE LEARNING CHAPTER 2: PROBABILITY DISTRIBUTIONS Parametric Distributions Basic building blocks: Need to determine given Representation: or? Recall Curve Fitting Binary Variables
Lecture 14 Bayesian Models for Spatio-Temporal Data
 Lecture 14 Bayesian Models for Spatio-Temporal Data Dennis Sun Stats 253 August 13, 2014 Outline of Lecture 1 Recap of Bayesian Models 2 Empirical Bayes 3 Case 1: Long-Lead Forecasting of Sea Surface Temperatures
Bayesian Inference. Chapter 4: Regression and Hierarchical Models
 Bayesian Inference Chapter 4: Regression and Hierarchical Models Conchi Ausín and Mike Wiper Department of Statistics Universidad Carlos III de Madrid Advanced Statistics and Data Mining Summer School
Machine Learning Linear Classification. Prof. Matteo Matteucci
 Machine Learning Linear Classification Prof. Matteo Matteucci Recall from the first lecture 2 X R p Regression Y R Continuous Output X R p Y {Ω 0, Ω 1,, Ω K } Classification Discrete Output X R p Y (X)
2. A Basic Statistical Toolbox
 . A Basic Statistical Toolbo Statistics is a mathematical science pertaining to the collection, analysis, interpretation, and presentation of data. Wikipedia definition Mathematical statistics: concerned
Mark your answers ON THE EXAM ITSELF. If you are not sure of your answer you may wish to provide a brief explanation.
 CS 189 Spring 2015 Introduction to Machine Learning Midterm You have 80 minutes for the exam. The exam is closed book, closed notes except your one-page crib sheet. No calculators or electronic items.