UNIVERSITE DE BOURGOGNE
|
|
|
- Edith Phelps
- 6 years ago
- Views:
Transcription


 Rapporteur SYLVESTRE Thibaut Chargé de Recherche, FEMTO, Université de Franche-Comté Examinateur VIGREUX")
1 UNIVERSITE DE BOURGOGNE Laboratoire Interdisciplinaire Carnot de Bourgogne (ICB) Département OMR Equipe SLCO UMR 6303 CNRS UNIVERSITE DE BOURGOGNE - DIJON - FRANCE THÈSE Pour obtenir le grade de Docteur de l Université de Bourgogne Discipline : Chimie-Physique (Sciences des Matériaux) Par Oussama MOUAWAD le 5 December 2014 Génération de Supercontinuum Infrarouge et Enjeux de Vieillissement au Sein de Fibres Optiques à Cœur Suspendu Hautement Non Linéaires en Verre de Chalcogénures à Base de Sulfures Devant le jury composé de : Directeur de thèse : Pr. Frédéric SMEKTALA CARDINAL Thierry Directeur de Recherche, ICMCB, Université de Bordeaux Rapporteur OHISHI Yasutake Professeur, Toyota Technological Institute (Japon) Rapporteur MESSADDEQ Younès Professeur, C.O.P.L. Université Laval (Canada) Rapporteur SYLVESTRE Thibaut Chargé de Recherche, FEMTO, Université de Franche-Comté Examinateur VIGREUX Caroline Maître de Conférences, I.C.G., Université de Montpellier 2 Examinateur SMEKTALA Frédéric Professeur, ICB, Université de Bourgogne Directeur
2
3 UNIVERSITE DE BOURGOGNE Laboratoire Interdisciplinaire Carnot de Bourgogne (ICB) Département OMR Equipe SLCO UMR 6303 CNRS UNIVERSITE DE BOURGOGNE - DIJON - FRANCE A dissertation In Partial Fulfillment of the requirements for the Degree of DOCTOR OF PHILOSOPHY Chemistry-Physics (Materials science) Submitted by Oussama MOUAWAD The 5 th December 2014 Infrared Supercontinuum Generation and Aging Challenges in Sulfur-Based Chalcogenide Glasses Suspended Core Highly Non Linear Optical Fibers Thesis supervisor: Pr. Frédéric SMEKTALA Committee members : CARDINAL Thierry Directeur de Recherche, ICMCB, Université de Bordeaux OHISHI Yasutake Professor, Toyota Technological Institute (Japan) MESSADDEQ Younès Professor, C.O.P.L. Laval University, Canada SYLVESTRE Thibaut Chargé de Recherche, FEMTO, Université de Franche-Comté VIGREUX Caroline Associate Professor, I.C.G., Université de Montpellier 2 SMEKTALA Frédéric Professor, ICB, Université de Bourgogne
4
5 ACKNOWLEDGEMENTS It is with immense gratitude that I acknowledge in this short foreword the support of all the people who have contributed to the preparation and completion of this research work. I wish to thank, first and foremost, my supervisor Pr. Frederic SMEKTALA. He continually and convincingly conveyed a spirit of courage and adventure in regard to research. Without his guidance and persistent help, completion of this work would not have been possible. I hope to be remembered as one of his proud students. I would like to express the deepest appreciation and share the credit of my work with my advisors Dr Frederic DESEVEDAVY, Dr Jean-Charles JULES and Dr Gregory GADRET for their incredible support and guidance in the helpful group meetings. It gives me great pleasure in acknowledging the support and confidence of Pr. Guy MILLOT and Pr. Frederic SMEKTALA for the opportunity to join their group SLCO (Solitons, Lasers and Optical Communications) I gratefully acknowledge The Centre Nationale de Recherche Scientifique (CNRS) and the Conseil Régional de Bourgogne (CRB) for their financial support to the project. I would like to thank and share the credit of my work with Dr Bertrand KIBLER and Dr Julien FATOME. I would like to thank my committee members, Pr. Yasutake OHISHI, Pr. Younes MESSADEQ, Dr. Thierry CARDINAL, Dr. Thibaut SYLVESTRE, and Dr. Caroline VIGREUX. Throughout my work I had the opportunity and pleasure to collaborate with Toyota Technological Institute (TTI)-Nagoya, Japan and with whose contribution NonLinear Experiments. I would like to thank Pr. Eric LESNIEWSKA and Pauline VITRY who contributed to carry out the AFM measurements. I would like to thank Dr. Olivier HEINTZ for his contribution the XPS measurements. i
6 I would like to thank all my friends and acquaintances who have come and gone throughout my academic career and throughout life. Many thanks to all my colleagues for the privilege of working with you. Finally, I wish to express my love and gratitude to my parents for the endless support and encouragement throughout this whole educational adventure. I would like to give you my sincerest thanks because without your sacrifices and help I would not be what I am. ii
7 PUBLICATIONS AND CONFERENCES Publications 1. Savelii, O. Mouawad, J. Fatome, B. Kibler, F. Désévédavy, G. Gadret, J-C Jules, P-Y Bony, H. Kawashima, W. Gao, T. Kohoutek, T. Suzuki, Y. Ohishi, and F. Smektala, "Mid-infrared 2000-nm bandwidth supercontinuum generation in suspended-core microstructured Sulfide and Tellurite optical fibers," Opt. Express 20, (2012). 2. O. Mouawad, J. Picot-Clémente, F. Amrani, C. Strutynski, J. Fatome, B. Kibler, F. Désévédavy, G. Gadret, J. C. Jules, D. Deng, Y. Ohishi, and F. Smektala, "Multioctave midinfrared supercontinuum generation in suspended-core chalcogenide fibers," Optics Letters 39, O. Mouawad, F. Amrani, B. Kibler, J. Picot-Clémente, C. Strutynski, J. Fatome, F. Désévédavy, G. Gadret, J. C. Jules, O. Heintz, E. Lesniewska, and F. Smektala, "Impact of optical and structural aging in As 2 S 3 microstructured optical fibers on midinfrared supercontinuum generation," Optics Express 22, (2014). 4. O. Mouawad, C. Strutynski, J. Picot-Clémente, F. Désévédavy, G. Gadret, J. C. Jules, and F. Smektala, "Optical aging behaviour naturally induced on As 2 S 3 microstructured optical fibres," Optical Materials Express 4, (2014). 5. O. Mouawad,P. Vitry, C. Strutynski, J. Picot-Clémente, F. Désévédavy, G. Gadret, J-C Jules, E. Lesniewskaand F. Smektala, Further Demonstration of Atmospheric Optical Aging and Surface Degradation in As 2 S 3 Optical Fibers. Submitted to Optical Materials Journal. Conferences in international congresses 1. O. Mouawad, F. Désévédavy, Savelii, J. C. Jules, G. Gadret, M. Duhant, G. Canat, Y. Ohishi, H. Kawashima, L. Brilland, J Troles and F. Smektala, As 2 S 3 Microstructured Optical Fibers Pumped Near 2 µm For Infrared Broadband Sources., 18th Symposium on Non-Oxide and New Optical Glasses (ISNOG)Saint Malo, France, 1-5 Juillet O. Mouawad, F. Désévédavy, J. Picot-Clemente, J. C. Jules, G. Gadret, B. Kibler, J. Fatome, W. Gao, H. Kawashima, Y. Ohishi, and F. Smektala, 2000nm spanning iii
8 supercontinuum in suspended-core As 2 S 3 microstructured optical fibers, 23th Symposium on International Congress on Glass (ICG)Prague, République Tchèque, 1-5 Juillet O. Mouawad, F. Désévédavy, J. Picot-Clemente, J. C. Jules, G. Gadret, B. Kibler, J. Fatome, W. Gao, H. Kawashima, Y. Ohishi, and F. Smektala, 2000nm spanning supercontinuum in suspended-core As 2 S 3 microstructured optical fibers, 23th Symposium on International Congress on Glass (ICG)Prague, République Tchèque, Septembre Conferences in national congresses 1. O. Mouawad, F. Désévédavy, I. Savelii, J. C. Jules, G. Gadret, B. Kibler, J. Fatome, W. Gao, H. Kawashima, Y. Ohishi, and F. Smektala, 2000nm spanning supercontinuum in suspended-core As 2 S 3 microstructured optical fibers. Journée de la photonique, Besançon, France - 13 Novembre O. Mouawad, F. Désévédavy, I. Savelii, J. C. Jules, G. Gadret, B. Kibler, J. Fatome, W. Gao, H. Kawashima, Y. Ohishi, and F. Smektala, 2000nm spanning supercontinuum in suspended-core As 2 S 3 microstructured optical fibers. XIVème Journées de l école doctorale Carnot-Pasteur (XIVème JED), Dijon, France, mai 2013 Grant for a collaboration program 1. Projet MIWaTSU : Mid-Infrared Widely Tunable coherent fibered SoUrces Sources fibrées cohérentes largement accordables dans le moyen infrarouge Bourse de programme PRC CNRS-JSPS Franco-Japonais, Bourse de stage au Japon, Nagoya, Japon, Novembre Labex ACTION Programme ANR-11-LABX Programme ANR CONFIAN : CONtinuum à Fibres Infrarouges hautement Non linéaires. 3. Programme Hubert Curien : PHC Sakura CNRS (France) - JSPS (Japon)-Ultra octave coherent light source development. 4. Programme PHOTCOM : Programme PARI du Conseil Régional de Bourgogne (CRB): Photonique avancée pour les télécommunications et sources lasers de nouvelle génération. iv
9 TABLE OF CONTENTS ACKNOWLEDGEMENTS i PUBLICATIONS AND CONFERENCES iii TABLE OF CONTENTS v LIST OF FIGURES ix LIST OF TABLES xvi LIST OF APPENDIX xvii ABBREVIATIONS xviii GENERAL INTRODUCTION 1 Part 1: Optical Nonlinearities, Vitreous Materials: a General Overview 5 I. Introduction 7 II. Light transmission in conventional optical fibers 8 II.1 Total internal reflection (TIR). 8 II.2 Classical structure of glass fiber 11 II.3 Light transmission in optical fiber by total internal reflection. 11 II.4 Modes propagation inside an optical fiber 12 II.5 Conventional glass optical fibers 13 II.6 Dispersion of guided signal 14 II.7 Microstructured optical fibers (MOFs) 17 II.8 Light transmission and dispersion properties of MOFs. 18 II.8.1 Light transmission in MOFs 18 II.8.2 Single mode MOF 18 II.8.3 Group velocity dispersion of MOFs 19 III. Signal attenuation and losses in optical fibers 19 III.1 Material absorptions 20 v
10 III.2 Optical scattering 21 III.2.1 Rayleigh scattering 21 III.2.2 Mie scattering 22 III.3 Bending losses 22 III.3.1 Macrobending losses 22 III.3.2 Microbending losses 23 III.4 Optical pumping and coupling losses 23 III.5 Loss measurements by cut-back technique 24 IV. Nonlinear optics 26 IV.1 Interaction light-matter and polarization behavior in isotropic medium 27 IV.2 Optical Kerr effect (OKE) 28 IV.2.1 Self-phase modulation (SPM) 29 IV.2.2 Solitons 30 IV.2.3 Cross-phase modulation (XPM) 30 IV.2.4 Four wave mixing (FWM) 30 IV.3 Inelastic nonlinear effects 30 IV.3.1 Raman scattering (RS) 31 IV.3.2 Brillouin scattering (BS) 31 IV.4 Supercontinuum generation 32 V. Conclusion 32 VI. References 34 Chapter 2 : Glass materials for infrared supercontinuum generation: state of the art. 37 I. What is a glass? 38 I.1 Definition of glass system. 38 I.2 Thermodynamic properties of glass system. 38 I.3 Structure of glass materials 39 II. Optical properties of soft-glass materials. 40 II.1 Transmission window and loss characteristics 41 vi
11 II.1.1 Multiphonon absorption 41 II.1.2 Extrinsic transmission losses. 43 II.2 Linear and Nonlinear refractive index 46 II.3 Dispersion 48 III. Supercontinuum generation records in soft-glasses 49 IV. Conclusion 52 V. References 53 Part 2 :Mid-Infrared Supercontinuum Generation In As 2 S 3 Microstructured Optical Fibers 61 I. Introduction 62 II. Glass Synthesis, Preform fabrication and Fiber drawing 66 II.1 Synthesis of bulk. 66 II.2 Preform elaboration. 70 II.3 Fiber drawing. 71 III. References 74 IV. Article 1 79 V. Article 2 99 VI. Article VII. Conclusion 126 Part 3: Optical, Topological and Structural Aging in As 2 S 3 Microstructured Optical Fibers and Impact on Mid-Infrared Supercontinuum Spanning 129 I. Introduction 130 II. Article 1: 133 III. Article IV. SumUp. 178 vii
12 V. Conclusion 179 Part 4: Green Chalcogenide Ge-Based Glass Fibers Exempt of Toxic Arsenic and Antimony Components 181 I. Introduction 182 II. Glass systems 182 II.1 Ge-S glass system 182 II.2 Ge-Ga-S glass system 184 II.3 Ge-S-Se glass system 185 III. Preparation of chalcogenide glasses. 186 III.1 Generalities about glass fabrication 186 III.2 Silica ampoule 187 III.2.1 Ampoule dimensions 188 III.2.2 Time-temperature regime of glass synthesis process 189 III.3 Glass-melt quenching. 190 IV. Materials' optical properties - Transmission window 191 V. Thermal properties - Transition and crystallization temperatures 192 VI. Fiber drawing essays. 194 VII. Conclusion 197 VIII. References 198 GENERAL CONCLUSIONS and FUTURE WORK 201 APPENDIX 205 viii
13 LIST OF FIGURES Figure 1: The luminous fountain of Colladon Figure 2: Behavior of incident ray as it passes from high index medium to lower index medium (n 1 >n 2 ) as a function of the incident angle. β i, β c and β i represent the incident, the critical and the reflected angles Figure 3: Schematic illustration of evanescent wave Figure 4: Schematic representation of glass fiber Figure 5: Schematic representation of light guidance inside a conventional step-index glass fiber Figure 6: Overview of fundamental fiber types Figure 7: Material and waveguide contributions for dispersion-shifted step-index fiber Figure 8: Illustration of pulse time broadening by group-velocity dispersion Figure 9: (a) Transverse cross sections of three holes suspended-core MOF and (b) schematic representation of corresponding refractive index profile. (c) Transverse cross sections of classical MOF with 3 rings of air holes around a solid central core, and (d) schematic representation of corresponding refractive index profile Figure 10: Dispersion for a three-ring MOF as a function of (a) hole diameter d (Ʌ=1.55µm), and (b) Pitch (d=0.8µm) [14] Figure 11: Schematic diagram of the transmission-loss mechanism in low-oh-content As 2 S 3 optical fibers as printed from [15]. This spectrum shows a typical Urbach tail, multiphonon absorption, scattering losses as well as extrinsic absorptions. Extrinsic absorption bands appear as inclusions interrupting the transmission window Figure 12: Sketch of the fundamental mode filed in a curved optical fiber Figure 13: Various configurations for multimode fibers with cleaved terminations Figure 14: Schematic representation of cut-back technique used to measure the losses in optical fibers Figure 15: Illustration of the mechanism of self phase modulation (SPM). (a) Gaussian profile of the input pulse, (b) frequency chirp Δω for Gaussian pulses and (c) profile of the frequency modulated pulse ix
14 Figure 16: Illustration of the Raman scattering Figure 17: Isobaric relationship between volume and temperature in the liquid, glassy, and crystalline states. T m is the melting temperature, and T g is the glass transition temperature. T g depends upon the cooling rate, T ga and T gb are the glass transition temperatures corresponding to slow (a) and fast (b) cooling rates [5] Figure 18: Schematic arrangement in crystal and amorphous solid Figure 19: Transmission window of various families of glasses (a) and zoom on the multiphonon absorption edge of the corresponding glass fibers (b) as printed from [25] Figure 20: Summary of the trends in nonlinear refractive index "n 2 " measured at 1.5 µm (a) and its relation to the linear refractive index "n" for different families of glasses (b) as reprinted from [25, 73] Figure 21: Record continuum registered in centimeter scale step-index ZBLAN fiber [83] Figure 22: Record continuum registered in sub-centimeter suspended core tellurite fiber [84] Figure 23: SC spectrum covering from 1.9 μm to 4.8 μm from a single mode step-index As 2 S 3 fiber pumped at 2.45 μm and the measured fiber loss. [85] Figure 24: Glass synthesis set-up Figure 25: Schematic illustration of the synthesis set-up. Inset a photo of the capillary container Figure 26: Sulfur multi-distillation process Figure 27: Schematic of the inclined furnace synthesis ampoule system Figure 28: Temperature-time schedule applied during sulfur static distillation, glass synthesis and batch annealing processes Figure 29: Cross section profile of preform design adopted in this work Figure 30: Glass rod geometrical evolution during drawing process (left) and drawing tower (right) Figure 31: Geometric profile of the chalcogenide As 2 S 3 suspended-core fiber captured by means of a scanning electron microscope drawn from the preform depicted in Figure x
15 Figure 32: Transmittance of the tellurite bulk as a function of wavelength measured on a 4- mm thick sample. Glass casted under room atmosphere (red solid line), glass casted under dry atmosphere in a glove box (blue solid line) Figure 33: (a) Profile of the tellurite fiber captured by means of a scanning electron microscope. (b) Fiber losses as a function of wavelength measured on a quasi mono-index fiber Figure 34: Chromatic dispersion curve of the suspended-core tellurite fiber. Circle: experimental data, solid-line: numerical modeling Figure 35: (a) Profile of the chalcogenide As 2 S 3 suspended-core fiber captured by means of a scanning electron microscope (b) Fiber losses of the quasi mono-index chalcogenide fiber as a function of wavelength (solid-line) and losses of the suspended core fiber measured at fixed wavelengths 1.06 and 1.55 µm (Triangles) Figure 36: Chromatic dispersion curve of the suspended-core chalcogenide fiber. Circle: experimental data, solid-line: numerical modeling Figure 37: Experimental set-up used to generate supercontinua in tellurite and chalcogenide suspended-core fibers. FUT: Fiber under test Figure 38: (a) Experimental recording of supercontinua generation in a 40-cm long suspended-core Tellurite fiber as a function of pump power. (b) Corresponding numerical simulations Figure 39: Modeled group index curve as a function of wavelength for the suspended-core tellurite fiber (red solid line) as well as experimental short and long wavelength edges of resulting supercontinua as a function of average power (circles) Figure 40: (a) Experimental recording of supercontinuum generation in a 45-mm long sample of suspended-core chalcogenide fiber for a pump power of 70 mw (b) Corresponding numerical simulations (c) Corresponding numerical simulations without OH group absorption peaks Figure 41: (a) Profile of the chalcogenide As 2 S 3 suspended-core fiber captured by means of scanning electronic microscopy (b) Chalcogenide bulk transmission (c) Optical loss of the mono-index large core multimode fiber as a function of wavelength. Loss measured at 1.55 µm for the suspended core MOF (star) xi
16 Figure 42: Numerical modeling of the fundamental mode of the suspended-core chalcogenide fiber. Chromatic dispersion curve (black line) and effective mode area (blue curve) Figure 43: Experimental setup used for supercontinuum generation in the suspended-core chalcogenide fiber. FUT: fiber under-test Figure 44: Experimental recording of supercontinuum generation in a 20-mm long sample of suspended-core chalcogenide fiber for pump peak power increasing from 1.25 to 4.86 kw. Main features of the As 2 S 3 transmission window are also displayed by means of hashed areas, the glass band gap (hashed zone at 0.6 µm) and SH absorption band (hashed zone at 4.0 µm) Figure 45: Attenuation spectrum of freshly drawn single index fiber (black solid line) and attenuation of the MOF measured at 1.55µm (blue star). Note that the absorption peak around 3.4μm is not related to the transmission of our fiber (i.e. artefact of our experimental setup [Article 1-9]). Inset: Cross-section image of our As 2 S 3 - suspended-small-core MOF captured by means of a scanning electron microscope Figure 46: (a) Experimental SC generated in a 45-mm-long sample of MOF, (b1-e1) Corresponding numerical simulations taking into account different levels of OH and SH absorption bands depicted in (b2-e2), respectively Figure 47: FTIR transmission spectra of large-core As 2 S 3 MOF registered in-situ as a function of exposure time to atmospheric conditions Figure 48: Top view of AFM 3D-pictures of the As 2 S 3 bulk glass surface: (a) fresh sample; (b) 12 days of exposure Figure 49: XPS spectra of As 3d core level of As 2 S 3 glass: (a) fresh glass; (b) exposed to air during 7 days Figure 50:.Experimental supercontinuum registered on 20-mm-long segment of MOF protected from aging factors by storing in dry atmosphere [10] Figure 51: Profile of the tested chalcogenide As 2 S 3 suspended-core fibre captured by means of SEM xii
17 Figure 52: Transmission spectra registered on As 2 S 3 MOF with amplification of absorption bands for an exposition time of (a) 0 to 46 h (b) 46 to 384 h Figure 53: Ratio of Near-Infrared spectra after 32 h (a) and 103 h (b) of exposure, showing sloping background and the linear correction adopted for background subtraction Figure 54: Deconvoluted absorption spectra over time scale (a) 4 h, (b) 6 h, (c) 24 h and (d) 32 h respectively Figure 55: Additional attenuation for 2.8m of As 2 S 3 MOF as a function of exposure time to ambient conditions Figure 56: Kinetic of peaks height evolution of different OH groups vibration modes Figure 57: Schematic representation of fibre sections considered for studying the longitudinal distribution of absorbing species Figure 58: Attenuation spectra of sections S 1 and S 4 of the 384 h aged As 2 S 3 MOF, located at different distances from the fibre's output: (a) Attenuation of section S 1, the first 7 cm of the MOF; (b) Attenuation of section S 4 located at ~100 cm from the MOF end Figure 59: Attenuation (black) of 1.92 µm absorption band and absolute content (blue) of corresponding OH groups as a function of distance from the fibre edge. Results reported for an As 2 S 3 MOF exposed for 384 hours to room atmosphere Figure 60: IR transmission spectra of airproofed As 2 S 3 MOF as a function of time exposure to ambient atmosphere Figure 61: Cross section profiles of the probed (a) large-core microstructured fiber and (b) rectangular fiber Figure 62: MIR-FTIR survey spectra registered on 0.5 m length of 8 µm core diameter of an As 2 S 3 MOF upon storing in ambient conditions at C and RH 50-60% Figure 63: Top view of AFM 3D-pictures of As 2 S 3 fiber surface: (a) fresh sample; SI after (b) 7 days and (c) 23 days of exposure Figure 64: Top view of AFM 3D-pictures As 2 S 3 fiber surfaceregistered after 23 days of exposure for SI (a), SII (b) and SIII (c) respectively xiii
18 Figure 65: Heights evolution of defect growing at 50 C, on the surface of samples SI, SII and SIII, as a function of exposure time Figure 66: Top view of AFM 3D-pictures of the surface of As 2 S 3 glass fibers: (a) fresh sample; (b) 6 months of storage in dry atmosphere at room temperature; (c) 6 months of storage in air at room temperature Figure 67: Illustration of investigated zones on the cross section of the glass fiber Figure 68: Friction micrographs revealing the fracture feature on the cross section of As 2 S 3 fiber. (a)-(b) Fracture features on fiber exposed to dry atmosphere during 6 months on the surface and the center respectively; (c)-(d) Fracture features on fiber exposed to ambient atmospheric conditions during 7 days on the surface and the center, respectively. The black arrow shows the inward direction from the surface to the center of the fiber Figure 69: SEM images of the surface of As 2 S 3 rectangular fibers: (a) preserved in dry atmosphere; (b) conserved 7 days in ambient laboratory atmosphere at 25 C and 65% RH. The black arrows point on the cracks and craters evolving on the fiber surface upon aging Figure 70: overall conclusions arising from this work summarized in schematic illustration Figure 71: Phase diagram of Ge-S system [6, 7]. Glasscompositions studied in this work are gathered on the Phase diagram Figure 72: Glass formation in the Ge-Ga-S ternary system as determined by Abe and al. [11]. The fraction of Ge, Ga and S are expressed in %atm. Circles: glasses formed by slow air cooling; triangles: glass formed by fast iced-water quenching; dark circle: crystallized glasses. Bleu stars represent the glass compositions studied in this work Figure 73: Glass formation in the Ge-S-Se ternary system as determined by Alekseeva and al. for low cooling rate. Regions I and II represent the forming regions of homogenous glasses. Black dots represent compositions for which glass stratifies Figure 74: Glass formation in the Ge-S-Se ternary system as determined by Migolinets and al. for high cooling rate [18, 19]. Regions I and III represent the forming region of homogenous glasses. Regions II and IV represent the regions suffering from xiv
19 crystallization and stratification, respectively. Blue stars represent the glass compositions studied in this work Figure 75: Typical temperature profile for glass melting of 50 g of glass Figure 76: Glass samples used for transmission measurements Figure 77: Optical transmission of the GeS 3 (6.72 mm), Ge 25 Ga 5 S 70 (5.9 mm), GeSe 4 (5.73 mm) and Ge 25 S 55 Se 20 (7.15 mm) glass systems Figure 78: Differential scanning calorimetry curves for several glasses study Figure 79: GeS 3 sample crystallised during fiber drawing attempt Figure 80: Early attenuation spectrum for un-purified Ge 23.8 S 57.1 Se 19.1 fiber Figure 81: Model of oscillating diatomic molecules vibrating around an equilibrium distance "r 0 " Figure 82 : Vibrational transitions in harmonic and anharmonic oscillators Figure 83 : Schematic diagram of the Michelson Interferometer Figure 84 : Scheme of the AFM in which the main components are indicated: the cantilever with the tip at its end, the sample mounted on top of the piezo scanner and the optical system for the cantilever deflection detection (a), and AFM image to show the vertical deviation of the aged glass sample surface (b) Figure 85 : Torsional and lateral movement of cantilever: AFM and LFM Figure 86 : XPS survey spectrum of As 2 S 3 exposed to atmospheric conditions xv
20 LIST OF TABLES Table 1: Lowest loss levels achieved on silica, fluoride, tellurite and chalcogenides glass fibers Table 2: Nonlinear optical constants for different glass compositions, of highly linear chalcogenide glasses. n 2 : non linear refractive index. Parameters were measured at µm wavelength Table 3: Summarize of various key properties of soft glasses and silica for comparison [8].. 48 Table 4: Assignment of absorption bands in As 2 S 3 chalcogenide glass in the µm range in As 2 S 3 glass. [2, 10, 27-37] Table 5: Attenuations for each deconvoluted peak after background corrections, for 2.8 meters of As 2 S 3 MOF Table 6 : Compositions of Germanium-based mono-chalcogenide (GeS and GeGaS) and dichalcogenide (GeSSe) glasses prepared in frame of this work. D I and T represent the inner diameter and the thickness of the various ampoules used to prepare the glass rods Table 7: Fiber drawing ability, crystallization tendency and guidance potentials of different chalcogenide glass compositions Table 8 : Compositions of Germanium-based mono-chalcogenide (GeS and GeGaS) and dichalcogenide (GeSSe) glasses prepared in frame of this work. D I and T represent the inner diameter and the thickness of the various ampoules used to prepare the glass rods Table 9 : Fiber drawing ability, crystallization tendency and guidance potentials of different chalcogenide glass compositions xvi
21 LIST OF APPENDIX Appendix 1 : Fourrier Transform Infrared Spectroscopy (FTIR) Appendix 2 : Atomic Force Microscopy (AFM) and Lateral Force Microscopy (LFM) Appendix 3 : X-ray photoelectron spectroscopy (XPS) Appendix 4 : Germanium-based glass system xvii
22 ABBREVIATIONS AFM LFM XPS SIF MOF ZDW GVD OKE RS BS FWM XPM SPM SC SCG OPO OSA FTIR Vis IR MidIR TIR ChG NLO NL HMO Atomic Force Microscopy Lateral Force Microsciopy X-ray Photoelectron Spectroscopy Step Index Fiber Microstructured Optical Fiber Zero Dispersive Wavelength Group Velocity Dispersion Optical Kerr Effect Raman Scattering Brillouin Scatering Four Wave Mixing Cross Wave Modulation Self Phase Modulation SuperContinuum Supercontinuum Generation Optical Parametric Oscillator Optical Spectrum Analyser Fourrier Transform Infrared Spectroscopy Visible Infrared MidInfrared Total Internal Reflection Chalcogenide Glasses NonLinear Optics NonLinear Heavy Metal Oxide xviii
23 GENERAL INTRODUCTION The use of glass-based technologies in different fields such as telecommunication, photonics, spectroscopy, medical and other sectors is unavoidable in our daily modern life. Improving the technical and economic performance of these technologies is required. Thus, the glass has been subjected to continuous investigations in fundamental materials science allowing innovation in glass properties and fabrication processes. A variety of glass systems and geometries have been developed. Among the various glass systems, chalcogenide glasses stand out as the only family of optical glasses that are transparent across the atmospheric transmission windows according to the glass composition [1]. In addition, these glasses may also be stably drawn into extended optical fibres [1, 2]. Moreover, chalcogenides exhibit higher optical nonlinearities than most promising glasses in the mid-infrared region [3]. These exceptional features predict promising outcome in the sector of linear and nonlinear optics, among the others, supercontinuum generation. However, chalcogenides suffers from high material dispersion and low damage threshold. Thus, the requirements and specifications of chalcogenide fibres for spectral broadening demand more versatility to manipulate light that challenge the capabilities of traditional step-index optical fibres. After the first report on Microstructured Optical Fibers (MOFs) in 1973 by Kaiser and al. [4], the fibre optics field has knew an exceptional leap following the development of photonic crystal fibers (PCF) from 1996 [5]. These structures exhibit unique optical properties and a high level of versatility, including the possibility of tuning the dispersion over a wide wavelength range and enhancing the nonlinear coefficient by strong light confinement. The advent of the PCF technologies allowed to engineer the dispersive properties of the chalcogenide-based optical fibers. After a first attempt in 2002 [6], the first guiding chalcogenide PCF was reported in 2006 [7], and have since been used in demonstrating supercontinuum generation. Following the fruitful experimental demonstration of near IR supercontinuum generation in As 2 S 3 PCF [8, 9], the idea came up to explore further the potentials of these glass fibers, in view to generate a spectral broadening spreading from 1.0 to 6.0 µm. The remainder of this dissertation is organized as follows: 1
24 - Part I is the theoretical background review. It comprises two chapters. Chapter 1 gives an overview of optical processes involved in supercontinuum generation, taking place as an optical pulse crossing an optical fibre. We focus on the linear and nonlinear phenomena allowing to understand results presented in later chapters. Chapter 2 is an introduction to the basics optical properties of glass materials, discussing especially the optical properties of different soft glass families as regards their application to MIR supercontinuum generation. - Part II gathers results of the nonlinear optics experiments performed during this work. These results are presented on the basis of published articles. This part comprises three published articles. The first article report on 2000 nm spectral broadening on As 2 S 3 suspended-core microstructured fiber (MOF), and presume an optical aging of this fiber. The second article report on enhancement of spectral broadening on carefully preserved fiber specimen. The third article presents a theoretical investigation studying the interdependence between the spectral broadening potentials of the As 2 S 3 MOF and his optical aging. This presumed aging is experimentally confirmed by means of different techniques. - Part III gathers results of the material's aging experiments performed during this work, which investigated in details the aging phenomena previously reported in the third article of Part II. These results are presented on the basis of one published article and one submitted article. The first provides an extensive study of the natural optical aging of the As 2 S 3 MOF. The second article studies the surface aging of As 2 S 3 fibers, and confirms the oxidation and hydrolysis of the glass structure under the atmospheric conditions. - Part IV focuses on the selection of new arsenic- and antimony-free germanium-based glass systems, with the goal to use them as substituent to arsenic containing glasses in optical fiber technologies. The synthesis procedure is optimized and successful fiber drawing attempts are reported. - A summary of the results obtained in this thesis is presented in the end. 2
25 References 1. J.-L. Adam, and X. Zhang, Chalcogenide Glasses: Preparation, Properties and Applications ( Woodhead Publishing, 2014). 2. G. E. Snopatin, V. S. Shiryaev, V. G. Plotnichenko, E. M. Dianov, and M. F. Churbanov, "High-purity chalcogenide glasses for fiber optics," Inorganic Materials 45, (2009). 3. J. H. V. Price, T. M. Monro, H. Ebendorff-Heidepriem, F. Poletti, P. Horak, V. Finazzi, J. Y. Y. Leong, P. Petropoulos, J. C. Flanagan, G. Brambilla, F. Xian, and D. J. Richardson, "Mid-IR supercontinuum generation from nonsilica microstructured optical fibers," IEEE Journal of selected topics in quantum electronics 13, (2007). 4. P. Kaiser, E. A. J. Marcatili, and S. Miller, "A new optical fiber," The Bell system Technological Journal 52, (1973). 5. J. C. Knight, T. A. Birks, P. S. J. Russell, and D. M. Atkin, "All-silica single-mode optical fiber with photonic crystal cladding," Optics Letters 21, (1996). 6. T. M. Monro, Y. D. West, D. W. Hewak, N. G. R. Broderick, and D. J. Richardson, "Chalcogenide holey fibres," Electronics Letters 36, (2000). 7. L. Brilland, F. Smektala, G. Renversez, T. Chartier, J. Troles, T. Nguyen, N. Traynor, and A. Monteville, "Fabrication of complex structures of Holey Fibers in Chalcogenide glass," Optics Express 14, (2006). 8. M. El-Amraoui, J. Fatome, J. C. Jules, B. Kibler, G. Gadret, C. Fortier, F. Smektala, I. Skripatchev, C. F. Polacchini, Y. Messaddeq, J. Troles, L. Brilland, M. Szpulak, and G. Renversez, "Strong infrared spectral broadening in low-loss As-S chalcogenide suspended core microstructured optical fibers," Optics Express 18, (2010). 9. M. El-Amraoui, G. Gadret, J. C. Jules, J. Fatome, C. Fortier, F. Désévédavy, I. Skripatchev, Y. Messaddeq, J. Troles, L. Brilland, W. Gao, T. Suzuki, Y. Ohishi, and F. Smektala, "Microstructured chalcogenide optical fibers from As 2 S 3 glass: towards new IR broadband sources," Optics Express 18, (2010). 3
26 4
27 Part 1 : Optical Nonlinearities, Vitreous Materials: a General Overview Part 1: Optical Nonlinearities, Vitreous Materials: a General Overview 5
28 Part 1 : Optical Nonlinearities, Vitreous Materials: a General Overview Chapter I : Linear and nonlinear optical properties of fibers Chapter 1 : Linear and Nonlinear Optical Properties of Fibers 6
.")
29 Part 1 : Optical Nonlinearities, Vitreous Materials: a General Overview Chapter 1 : Linear and nonlinear optical properties of fibers I. Introduction The study of light transmission is very old, already in 1841, J-D Colladon showed that light was guided into the filaments of a fountain in Geneva (Figure 1). The following year, in 1842, Jacques Babinet noted the same thing in the water streams and glass sticks. In 1880, William Wheeler employed glass tubes to illuminate a place with a light source placed elsewhere: light could be guided by the glass. In 1888, Roth and Reuss used glass tubes in medicine for illuminating cavities and viscera of the body [1]. Figure 1: The luminous fountain of Colladon. In 1927, Baird and Hansell had the idea to work on fiber optics in the sense we understand it today. The first successful application of optical fiber appeared only in 1950 with the fibroscope, created by Van Heel. Thanks to this device, we could observe with much more efficiency the inside of the human body and welds inside the aircraft engines. Unfortunately, the optical quality of the silica glasses did not allow the use of this device over long lengths of fiber. By the late 1960s born the idea of making pure silica optical fibers to transmit light over long distances, while having the lowest possible attenuation. 7
30 Part 1 : Optical Nonlinearities, Vitreous Materials: a General Overview Chapter 1 : Linear and nonlinear optical properties of fibers In 1966, C. Kao and al. demonstrate the possible use of silica fibers in optical data transmission [2]. In 1970, three inventors in Corning glass company succeeded to reduce the loss level down to 20 db/km at ~1550 nm [3]. Their optical fiber was capable of carrying 65,000 times more information than a copper cable [4]. In 1979, NTT demonstrate losses of about 0.2 db/km measured at the wavelength of 1.55 µm [5]. Such progress allowed a long distance (around a hundred km) transmission of information without using repeaters. In parallel to efforts devoted to enhance the optical quality of silica glass fibers, other alternatives were explored for the same purpose. In 1973, P. Kaiser proposed a new geometry assumed to improve the light guiding efficiency of the fiber [6]. This work has given rise to a new type of optical fibers: microstructured optical fibers (MOFs). In 1996, Group of Optoelectronics at the University of Bath described the manufacture of microstructured optical fiber obtained by implantation of a periodic array of air holes around a silica core [7]. This particular architecture induces unusual propagation properties unreachable using conventional fibers. This work signaled the beginning of the development of fiber geometries using glasses of different compositions. After this history summary, we will discuss optical fibers in more details since they are the object of our work. We will describe the specific mechanisms of light guidance in optical fiber, the limitations due especially to optical loss, as well as the nonlinear optical effects involved during the propagation of light pulses along the fiber. II. Light transmission in conventional optical fibers II.1 Total internal reflection (TIR). The guidance of the light beam through the optical fiber takes place because of total internal reflection. The mathematical expression that governs this phenomenon has appeared in the early XVII century. The modern laws explaining the TIR has been developed by Snell (1621) and Descartes (1637). Consequently, laws that rule this phenomenon are known as "Snell- Descartes Laws". 8
31 Part 1 : Optical Nonlinearities, Vitreous Materials: a General Overview Chapter 1 : Linear and nonlinear optical properties of fibers Snell and Descartes introduced firstly the "refractive index" as the ability of each medium to "slow down and deflect" the light. The refractive index "n" of a substance is equal to the ratio velocity of light in a vacuum to its phase velocity in that substance. It is given as follow: n = c/v (1) Where c ( m/s) is the velocity of light in vacuum and v represents the velocity of light in the considered medium. β i β c β ref β i β ref n 2 n 2 n 2 n 1 β 2 n 1 n 1 β i < β c Refraction β i = β c Refraction limits β i > β c Total internal reflection Figure 2: Behavior of incident ray as it passes from high index medium to lower index medium (n 1 >n 2 ) as a function of the incident angle. β i, β c and β i represent the incident, the critical and the reflected angles. When a light ray passes from one medium to another having a different refractive index, its velocity and direction of propagation change. The beam propagating in the same medium symmetrically (with respect to the normal at the incidence point) to the incident ray is called reflected ray" (Figure 2-right). The reflection angle equals the angle of incidence. The transmitted beam is called "refracted ray" (Figure 2-left). According to Snell's law, if a ray is incident at the lower index medium interface, the transmitted ray is bent away from the normal, and the angle of refraction is greater than the angle incidence (Figure 2-left). These laws are described by the following equation: n 1 sinβ i = n 2 sinβ 2 (2) Herein, n 1 and n 2 represent the refractive index of the first and second medium respectively, whereas the angles that make the incident and the refracted rays with the normal are represented by β i and β 2, respectively. 9
32 Part 1 : Optical Nonlinearities, Vitreous Materials: a General Overview Chapter 1 : Linear and nonlinear optical properties of fibers Since the angle of refraction grows faster than the angle of incidence, refracted ray may be transmitted perpendicularly to the normal (Figure 2-middle). The angle of incidence, for which the angle of refraction with the surface normal is 90, is known as the critical angle and is often denoted by β c. It is expressed by: β c = sin 1 n 2 n 1 (3) When the angle of incidence exceeds the characteristic critical angle β c, the ray is not refracted anymore but reflected symmetrically at the same angle with respect to the normal. This phenomenon is called "total internal reflection (TIR)". In this case, the wave theory of light implies that a portion of the energy of the incident wave is transmitted into the second medium as a so-called "evanescent" wave. Its energy density exponentially decreases through the normal at the interface, and eventually vanishes at a distance of the same order of magnitude of the incident wavelength. A schematic representation of the evanescence phenomenon is provided in the figure below. ~ λ wavelength d E Figure 3: Schematic illustration of evanescent wave Previous knowledge of the refractive index of two mediums and of the angle of incidence allows to predict the behavior of the light beam (Figure 2). Thus, in the cases where the incident angle is lower than or equal to the critical angle, the reflection phenomenon is observed (Figure 2-middle & left). At normal incidence, the reflection coefficient (R) is given by equation (4), where n 1 and n 2 are the refractive indices of the two media: R = n 2 2 n 1 n 2 +n 1 The transmission coefficient (T) is given by T=1-R for non-absorbent medium. The decrease of the transmitted energy due to reflection is called "Fresnel losses". When light propagates in the atmosphere before entering a high refractive index material, the loss of intensity is (4) 10
33 Part 1 : Optical Nonlinearities, Vitreous Materials: a General Overview Chapter 1 : Linear and nonlinear optical properties of fibers substantial, due to the large refractive indices difference. Chalcogenide glasses are known as high index materials, and hence the light experiences high reflection losses when entering and exiting chalcogenide plates or fibers. These light intensity losses are estimated around 17% per interface for As 2 S 3 glasses [8]. II.2 Classical structure of glass fiber A glass fiber consists of a cylindrical central core embedded within a surrounding clad by a material of slightly lower refractive index. The light guidance is allowed by ensuring the light confinement within the fiber core. Several glass systems suffering from mechanical weakness, corresponding glass fibers are reinforced with an external polymeric cladding giving them greater resistance to physical constraints at which they are exposed during real operation conditions. Fiber cladding Polymeric jacket Fiber core Figure 4: Schematic representation of glass fiber. II.3 Light transmission in optical fiber by total internal reflection. All incident rays launched into the entrance facet of the fiber will not be guided in the core. There is a threshold (limit) incidence angle beyond which guidance of signal in the core is not insured (i m in Figure 5), hence defining the "acceptance cone" (Figure 5). Striking the fiber entrance with incidence angle smaller than the threshold, the ray will be guided in the fiber in a direction parallel to the axis of the fiber. A ray whose incidence is within the acceptance cone will be guided following the principle of total internal reflection at the core-cladding interface. A schematic illustration of these phenomena is gathered in Figure 5. The sine of the limit angle (i m ) of the incident, often called "numerical aperture", is a characteristic parameter of optical fibers. It is given by the following equation: 11

34 Part 1 : Optical Nonlinearities, Vitreous Materials: a General Overview Chapter 1 : Linear and nonlinear optical properties of fibers NA = sin i m = n 2 2 c n cd 1 2 (5) where, NA, i m, n cd and n c represent the numerical aperture, the limit incidence angle, the clad refractive index and the core refractive index, respectively. Acceptance Cone Un-guided ray Guided ray i m n c n cd Figure 5: Schematic representation of light guidance inside a conventional step-index glass fiber. II.4 Modes propagation inside an optical fiber Geometrical optics presume that everything happens as if only a discrete number of incidence angles within the acceptance cone give rise to light propagation inside the fiber. These different values of incident angles are associated with different "propagation modes". Rigorously speaking, the concept of "modes" results from solving the light propagation equation in the optical fiber through the involvement of the electromagnetic field boundary conditions (continuity at the core-cladding interface) and the symmetry of the medium (fiber geometry). An estimation of how many modes can propagate along the fiber is furnished by the key fiber parameter "V", often referred to as the "normalized frequency". For a step-index fiber, the "V" parameter is given as follows: V = 2πa λ n 2 c n 2 cd = 2πa λ NA (6) Where a is the core radius, λ the light wavelength, n cd and n c representing the refractive index of the clad and the core, respectively. 12

35 Part 1 : Optical Nonlinearities, Vitreous Materials: a General Overview Chapter 1 : Linear and nonlinear optical properties of fibers If the normalized frequency is below for a given wavelength, the fiber is single mode at this wavelength. In order to characterize a single mode fiber, we introduce the concept of cutoff wavelength as the wavelength below which the optical fiber is no longer single-mode. In multimode fiber, the approximate number of distinguishable modes that can propagate in the fiber is given by: M = V 2 2 (7) Where M represents the number of modes. II.5 Conventional glass optical fibers Conventional fibers are mainly classified, on the one hand by the index profile of the fiber, and on the other hand by the mode propagation ability. As was previously suggested, there are therefore single and multimode fibers. A schematic presentation of the various categories of conventional fibers is provided in Figure 6. Fibre types Cross Sections Index profile Signal guiding Multimode Step-Index Mono-mode Step-Index Multimode Gradient-Index Figure 6: Overview of fundamental fiber types Multimode silica fibers were the first to appear on the market. They exist in the form of stepindex or gradient-index fibers. Fiber owing large numerical aperture exhibits an important light-gathering capacity. This allows to increase the amount of light coupled into the fiber. However, any given light source 13
36 Part 1 : Optical Nonlinearities, Vitreous Materials: a General Overview Chapter 1 : Linear and nonlinear optical properties of fibers delivers signal which is never truly monochromatic but composed of various spectral frequencies. Thus, rays take different times to propagate through a given length of the fiber (Figure 6-top). In other words, pulses propagate in several modes inside a multimode fiber and undergo temporal broadening (intermodal dispersion) upon propagation. Graded index fibers were conceived in order to reduce impact of the intermodal dispersion caused by the differences in the group velocities of the modes within a multimode fiber, while maintaining a high numerical aperture. These fibers exhibit a parabolic-index profile, with a maximum in the center and a minimum at the core-cladding bounding (Figure 6-bottom). The transmitted modes are guided following a sinusoidal path, from the center to the cladding. Consequently, the velocity of modes is reduced in the center and increased with the radial distance. Modes undergoing a longer distance propagate at average higher velocity. The excess in distances are balanced by opposite excess in mode velocities, and the intermodal dispersion is significantly reduced. A step-index fiber which exhibits a small core diameter (a few microns) and a low refractive index contrast (less than 0.5%), is denoted as single mode fiber (Figure 6-middle). Such fiber supports only one mode that propagates through the fiber. This mode is also referred to as the "fundamental mode". Unlike the multimode fiber, the intermodal dispersion within a single mode fiber is significantly neglected, which explains the pioneering role of such fibers in the transmission of light pulses over large distances. II.6 Dispersion of guided signal The signal dispersion also known as "intramodal dispersion" includes two components, the dispersion of the glass material and that of the waveguide. The light pulse is never truly monochromatic but composed of various spectral frequencies. Since the refractive index of the fiber material is wavelength dependent, the travel velocities for different signal components will not be the same, leading to a temporal broadening of the pulse. The refractive index as a function of wavelength is given by Sellmeier equation [9, 10]: n 2 (ω) = 1 + m B j λ 2 j=1 λ 2 λ2 (8) j 14
37 Part 1 : Optical Nonlinearities, Vitreous Materials: a General Overview Chapter 1 : Linear and nonlinear optical properties of fibers Where λ is the vacuum wavelength, λ j is the j t absorption resonance wavelength and B j is the strength of the j t resonance. ω represents the signal frequency expressed as ω = 2π λ c. The Sellmeier parameters are usually obtained from experimental data. The summation is extended over all material absorption resonances that contribute to the frequency range of interest. Since the propagation velocity of a monochromatic wave in a medium of refractive index n (ω) is given by c/n(ω) (c is the light velocity in vacuum), when a multi-component pulse propagates through an optical fiber, the velocities at which the different spectral components are traveling along the fiber vary. This results in significantly different transmission delays or arrival times for the various spectral components of the signal, leading eventually to pulse temporal broadening. In general, we use the propagation constant β(ω) which is expended in Taylor series about the central frequency ω 0 of the pulse spectrum, in order to assess the dispersion effects of the fiber [9, 10]. β ω = n eff ω ω c = β 0 + β 1 ω ω β 2 ω ω β 3 ω ω 0 3 (9) β 2 parameter represents the dependence of the energy propagation velocity versus the frequency of the guided wave. It is called "second order dispersion parameter" and is expressed in ps²/nm. β 2 is also called "coefficient of group velocity dispersion" (GVD). The dispersion parameter D, related to β 2 by the following relation, is commonly used in place of β 2 [11]: β 2 = 1 v g 2 v g ω (10) D = 2πc λ 2 β 2 By definition, the GVD represents the δλ (I, nm) spectral width pulse time duration broadening (in ps) by fiber length unit (in km). Therefore, GVD is expressed in "ps.nm -1.km -1 ". The dispersion of a fiber is defined as the sum of the material dispersion (D material ) and waveguide dispersion (D waveguide ), which originates from the chromatic dispersion of the effective index. It is defined as follow: D total = D material + D waveguide (11) 15
.")
38 Part 1 : Optical Nonlinearities, Vitreous Materials: a General Overview Chapter 1 : Linear and nonlinear optical properties of fibers The influence of the waveguide dispersion is lower and depends on the light confinement due to opto-geometric properties of the fiber. Generally, both phenomena exhibit an opposite evolution as a function of wavelength (Figure 7). Their opposite contribution can be balanced, so the disparities in material dispersion can be compensated by opposite disparities in waveguide dispersion. As a consequence, the total dispersion at certain wavelengths can be set to zero. This characteristic wavelength is often called "zero dispersion wavelength" (ZDW). Figure 7: Material and waveguide contributions for dispersion-shifted step-index fiber. One can also conceive a suitable ZDW by manipulating the core diameter and/or the refractive index contrast between the core and the cladding. The pulse dispersion behaviors and the signal guidance regime within the fiber change depending on the sign of the GVD parameter. Figure 8 shows the properties of the pulse broadening by GVD. The spectral region located below the ZDW is called normal or negative dispersion regime (D<0; β 2 >0; Figure 8-bottom). The long-wavelength components (red-edge) under the pulse envelop propagates faster than the short-wavelength components (blue-edge) of the same pulse. For wavelengths longer than the ZDW, the opposite effect occurs. This region is called anomalous or positive dispersion regime (D>0; β 2 <0; Figure 8-top). The anomalous-dispersion regime is of major interest because in this regime, optical fibers support solitons. 16

![7 Microstructured optical fibers (MOFs) Microstructured optical fibers consist in guiding hollow or solid core surrounded by periodic array of air holes running along their length [7, 12].](/docs-images/75/72114754/images/39-2.jpg "Light transmission within solid-core MOF is governed by total internal reflection (TIR).")
39 Part 1 : Optical Nonlinearities, Vitreous Materials: a General Overview Chapter 1 : Linear and nonlinear optical properties of fibers Anomalous dispersion regime D>0 Normal dispersion regime D<0 Figure 8: Illustration of pulse time broadening by group-velocity dispersion II.7 Microstructured optical fibers (MOFs) Microstructured optical fibers consist in guiding hollow or solid core surrounded by periodic array of air holes running along their length [7, 12]. Light transmission within solid-core MOF is governed by total internal reflection (TIR). Careful managing of the MOF optogeometrical parameters (air hole diameter (d) and inter-hole spacing also called pitch (Ʌ); Figure 9), allows to control the guidance properties. solid core a solid core c d Cladding Air holes Air holes Ʌ solid core d solid core Ʌ b d Figure 9: (a) Transverse cross sections of three holes suspended-core MOF and (b) schematic representation of corresponding refractive index profile. (c) Transverse cross sections of classical MOF with 3 rings of air holes around a solid central core, and (d) schematic representation of corresponding refractive index profile. 17
40 Part 1 : Optical Nonlinearities, Vitreous Materials: a General Overview Chapter 1 : Linear and nonlinear optical properties of fibers II.8 Light transmission and dispersion properties of MOFs. II.8.1 Light transmission in MOFs The solid-core MOFs have many similarities with the standard step-index fibers. The periodic arrangement of air holes forms a cladding of effective index (n geff ) lower than the index of the base material that makes up the core. In practice, n geff corresponds to the effective refractive index of the higher order mode allowable to propagate in the core. The light guiding is governed by total internal reflection. However, the confinement of light in a solid-core microstructured fiber is much stronger than that in a step-index fiber. To ensure the light guiding in the MOF's core, the propagation constant β has to fulfill the condition (12), for which only an evanescent wave can exist in the cladding. The range defined in 12 determines the maneuverability range of β while maintaining an efficient guidance in the core. If the value of β is below the maximum propagation constant allowable in the cladding, the light will leak in the cladding. kn cl < β < kn c (12) where kn cl define the maximum propagation constant allowable in the clad for efficient core guiding, kn c define the maximum propagation constant allowable in the core for efficient core guiding, n g and n c represent the refractive index of cladding and core, respectively. II.8.2 Single mode MOF The guiding properties of the MOF depend on their opto-geometrical parameters. For example, for a high core index fiber, appropriate ratio of hole area to total cladding area (d/ʌ) allow to achieve single-mode propagation throughout the transparency range of the fiber. For step-index fiber, the single-mode propagation corresponds to a normalized frequency (V) less than In order to calculate the normalized frequency (V) for MOFs, we use the same equation (13) as that applied for the step-index fiber, wherein the refractive index of the cladding is replaced by the effective index of the microstructured cladding. Thereby, for a ratio of hole diameter to inter-hole spacing (d/ʌ) below 0.4, the fibers may be single mode regardless of the wavelength. It is therefore possible to achieve a broadband 18
41
42 Part 1 : Optical Nonlinearities, Vitreous Materials: a General Overview Chapter 1 : Linear and nonlinear optical properties of fibers pulse. One generally distinguishes those originating from the material (absorption, diffusion) of those revealing a "leakage" of energy from the fiber (propagation). Figure 11 shows the attenuation spectrum on As 2 S 3 glass as printed from [15]. Band gap Multiphonon absorption Extrinsic OH absorption bands Scattering Losses Figure 11: Schematic diagram of the transmission-loss mechanism in low-oh-content As 2 S 3 optical fibers as printed from [15]. This spectrum shows a typical Urbach tail, multiphonon absorption, scattering losses as well as extrinsic absorptions. Extrinsic absorption bands appear as inclusions interrupting the transmission window. III.1 Material absorptions There are two types of material's absorption: intrinsic and extrinsic absorptions. The intrinsic one is caused by interaction of the guided light with major constituents of the glass: in the short wavelengths range, the radiation energy is sufficient to excite the outer electrons of the atoms constituting the glass and curtail the transmission spectrum. By analogy with crystalline semiconductors, corresponding cut-off wavelength is called "gap". In the long wavelengths range, the radiation energy corresponds to vibrational energy of the constituent chemical 20
43 Part 1 : Optical Nonlinearities, Vitreous Materials: a General Overview Chapter 1 : Linear and nonlinear optical properties of fibers bonds of the glass (multiphonon absorption), and beyond the glass becomes opaque. These two absorption bands limit the transparency window of the glass and determine the minimum possible losses within this window. Extrinsic absorption originates from the interaction of the guided light with impurities present in the glass. These impurities may be transition metallic ions (such as Fe 2+, Cu 2+, Cr 3+, V 4+ ) [16], which absorb in the wavelength range lying between 600 nm and 1600 nm. In silica fiber, a concentration of 1 ppm of these metallic impurities results in attenuation losses ranging between 1 and 3 db/km. Rigorous purification of raw materials allows to significantly reduce the concentration of these impurities to 1 ppb threshold. Hydroxyl ions (OH) present in glass are also considered as extrinsic impurities. Corresponding absorption bands appear within the wavelength range extended from 600 nm to 6300 nm. These impurities are difficult to remove. Currently, with new manufacturing technologies, it is possible to obtain silica fibers with concentrations of OH ions below 1 ppm [17]. III.2 Optical scattering The scattering losses are due to the interaction of guided light with the material constituting base of the guiding structure. There are two types of scattering: linear scattering (elastic), for which the scattered photons maintain the same frequencies as the incident photons, and the nonlinear scattering (inelastic), for which the scattered photons change their frequencies compared to incident photons. There are two sub-types of linear scattering, Rayleigh and Mie scattering. III.2.1 Rayleigh scattering The electric field of an electromagnetic wave incident onto an atom distorts the electron cloud of this atom, leading to the creation of an induced electrical dipole. This induced dipole emits isotropic radiations at the same wavelength of the incidence ray. This interaction process is known as the Rayleigh scattering. The scattering intensity is inversely proportional to the fourth power of the wavelength: I~ 1 λ 4. Thus, the attenuation due to Rayleigh scattering increases towards shorter wavelengths [18]. 21
44 Part 1 : Optical Nonlinearities, Vitreous Materials: a General Overview Chapter 1 : Linear and nonlinear optical properties of fibers III.2.2 Mie scattering Mie scattering is caused by the interaction of the guided light with particles of size of the same order of magnitude as the incident wavelength. This scattering originates from the presence of refractive index fluctuations in the core and the cladding (glass inhomogeneities, impurities, defects...). The scattered intensity is inversely proportional to the square of the wavelength: I~ 1 λ 2. Reduction or even elimination of this diffusion process is possible by improving the glass quality. Nowadays, silica fibers with low Mie scattering levels are available in the market [19]. III.3 Bending losses Bending can increase the attenuation of optical fiber by two mechanisms: macrobending and microbending. Propagating modes within the fiber might be accompanied with an electric field distribution with maxima inside the fiber and evanescent fields that extend outside the fiber core into the surrounding cladding. Figure 12: Sketch of the fundamental mode filed in a curved optical fiber. III.3.1 Macrobending losses Macrobending losses of an optical fiber are associated with bending or wrapping the fiber. Electromagnetic field can leak out of the fiber when it is bent. As the bend becomes more 22
45 Part 1 : Optical Nonlinearities, Vitreous Materials: a General Overview Chapter 1 : Linear and nonlinear optical properties of fibers acute, leakage becomes more severe [20]. Bending losses are related to the curvature radius. The critical radius of curvature R c is the threshold radius at which bending loss sharply increases from negligible values to intolerably high values. This is delineated as follows [21]: R c = 3nλ 4π NA 3 (14) Where R c is the critical radius of bending, n is the refractive index of the clad, NA is the numerical aperture of the fiber and λ is the wavelength. III.3.2 Microbending losses Microbending losses of an optical fiber lead to attenuations associated to random axial distortions of the core-clad interface generated from mechanical tensile forces during drawing when the fiber is pressed against surface that is not perfectly smooth [20]. These losses may be avoided by careful fiber drawing, avoiding excessive mechanical forces, and controlling the temperature variations of the fiber. III.4 Optical pumping and coupling losses The term pumping losses refers to an optical fiber not being able to propagate all the incoming light rays from an optical source. This phenomenon occurs during the process of coupling light into the fiber. There are also initial face (Fresnel) losses due to reflections at the entrance aperture. The Fresnel losses are greater if the fiber-source coupling is performed in free space. Coupling losses are associated with the coupling of the output of one fiber with the input of another fiber or other components. Significant losses may arise in fiber connectors and splices of the cores of the joined fibers having unequal diameters or misaligned centers, or if their axes are tilted. There are other connection losses such as offsets or tilts or air gaps between fibers, and poor surface finishes. Some of these are illustrated in Figure

46 Part 1 : Optical Nonlinearities, Vitreous Materials: a General Overview Chapter 1 : Linear and nonlinear optical properties of fibers d 1 Differing fiber diameters d 2 Differing numerical aperture Differing index of refraction profiles Transverse misalignment Axial gap Surface reflections Angular misalignment Figure 13: Various configurations for multimode fibers with cleaved terminations. III.5 Loss measurements by cut-back technique Any process that results in a reduction in the light intensity during propagation through a material contributes to the observed optical attenuation. According to Beer-Lambert law, optical power exhibits an exponential decrease with distance as it propagates within the fiber: P = P 0 e α totalz (15) T(%) = P P (16) 0 where P 0 is the power at distance z=0, P the power at distance z, α total the total attenuation coefficient and T the transmission. As clearly seen in equation 15, a rigorous measurement of the input and output powers is required in order to calculate the total attenuation coefficient. Such measurement is not trivial. The cut-back technique as illustrated in Figure 14 allows overcoming this limitation by 24
47
48 IV. Nonlinear optics Part 1 : Optical Nonlinearities, Vitreous Materials: a General Overview Chapter 1 : Linear and nonlinear optical properties of fibers In the frame of this work, we are interested in the effect of spectral broadening of a high peak power pulse as it propagates into a fiber made of a highly optically nonlinear material, wherein the confinement of guided modes is important. This spectral broadening, called "supercontinuum" (SC) originates from a number of nonlinear optical effects. An important parameter to obtain a supercontinuum is the peak power of the pump pulses. From a historical perspective, nonlinear optics experiments was not possible until the 1960s with the advent of laser technology [22], and particularly pulsed lasers. The first significant spectral enlargements were observed for the first time in 1963 [23]. Generation of a wide spectrum covering the whole visible, in a bulk material (a borosilicate glass BK7) was performed by Alfano and Shapiro in 1970 [24] using picosecond pulses (5 mj energy at 532 nm). In 1976, and for the first time, Lin and Stolen have reported on spectral broadening in fiber (silica fiber) [25]. The spectrum spread over 200 THz toward wavelengths greater than those of the pump [25]. The most remarkable results have been obtained with the development of the microstructured optical fibers (MOFs) in the 1990s. These fibers are known for their ability to effectively confine the light. The freedom degrees provided by these fibers through their geometry allow to adjust their dispersive properties to the pump wavelength. At the same time, the high nonlinearity of MOFs enables the use of lower peak power pulses. In 2000, JK Ranka and al [26] coupled 100 fs pulses at 770 nm in a 75 cm microstructured optical fiber whose zero dispersion was located around 770 nm. The coupled signal enabled a spectral broadening extending from 400 to 1500 nm. SC generation has found applications in spectroscopy, metrology, medicine and military fields [27-30]. The efficiency of the spectral broadening observed at the output of a MOF depends on several parameters (fiber length, injected peak power and wavelength of the pump pulse), but the phenomena originate from the nonlinear optical properties of the material. We will therefore in the following, after a brief reminder of the linear and nonlinear polarizations generated in a material subjected to an electromagnetic field, describe the resulting nonlinear optical phenomena involved in the supercontinuum generation. 26
49 Part 1 : Optical Nonlinearities, Vitreous Materials: a General Overview Chapter 1 : Linear and nonlinear optical properties of fibers IV.1 Interaction light-matter and polarization behavior in isotropic medium When a dielectric medium is submitted to an external electric field, it becomes polarized. When the applied electric field is weak, the induced polarization is proportional to that field. Whereas, when the applied electric field reaches values of the same order of magnitude as the intra-atomic electric fields, the induced polarization is no longer proportional to that field: at this stage, we enter the domain of nonlinear optics. From a microscopic point of view, each atom or molecule of a dielectric medium is surrounded by an electron cloud susceptible to deformation under the effect of an electric field, thereby creating an electric dipole (electronic polarizability). This dipole, for a small deformation, is proportional to the field, but this is no longer the case when the deformation becomes more acute. The vectorial summation of microscopic dipoles generates macroscopic polarization. This polarization can be written in its most general form as follows: P = ε 0 {χ 1 E + χ 2 E. E + χ 3 E. E. E + } (19) where E is the amplitude of the electric field, ε 0 is the electrical permittivity of free space, χ i represents the i th order of dielectric susceptibility, which are characteristic of the material. This polarization consists of a linear component (21) and a nonlinear contribution (22), expressed as follow: P = P L + P NL (20) P L = ε 0 χ 1 E (21) P NL = ε 0 {χ 2 E. E + χ 3 E. E. E + } (22) The linear component (21) describes the conventional linear optics (Snell laws, Rayleigh...), for which the resulting (irradiated) wave maintains the same frequency as that of the incident wave. Nonlinear effects can be classified according to different orders. 27
50 Part 1 : Optical Nonlinearities, Vitreous Materials: a General Overview Chapter 1 : Linear and nonlinear optical properties of fibers For amorphous (glasses) or crystalline materials having a center of symmetry (center of inversion), the nonlinear susceptibility of the second order χ 2 vanishes. This is of course valid for all the even (pair) orders of polarization effects. Nonlinear phenomena of the third order have lower amplitude than those of the second order. However, in practice, they are very important because they are the first non-linear effects encountered in the glass. According to the involved mechanism, the nonlinear polarization effects induced by the third order susceptibility can be divided into: elastic effects without any exchange of energy between the incident radiation and the crossed medium (Kerr effect), inelastic effects or nonlinear scattering, which involve an energy exchange between the incident radiation and the material (Raman and Brillouin scattering). IV.2 Optical Kerr effect (OKE) The optical Kerr effect (OKE) can be described as the modification of the refractive index of a material under the effect of an electric field. Materials whose are prone to this phenomenon are known as "Kerr media". In particular, when a Kerr medium is exposed to the electric field of a light wave of intensity I, its refractive index can be written as follows: n = n 0 + n 2 I (23) where n is the refractive index, n 0 is the linear refractive index, n 2 is the nonlinear refractive index and I is the intensity of the light beam. As claimed in equation (23), the refractive index consists of a linear component related to first-order dielectric susceptibility, and a nonlinear component related to the third order dielectric susceptibility. When the intensity of the applied electric field is high, the nonlinear contribution to the refractive index must be taken into account. For silica glasses, the nonlinear refractive index is measured around 3,2 x m 2 /W at 1.06 µm [10]. As 2 S 3 glass exhibits a nonlinear refractive index around 594 x m 2 /W at 1.55 µm [29]. 28
51 Part 1 : Optical Nonlinearities, Vitreous Materials: a General Overview Chapter 1 : Linear and nonlinear optical properties of fibers The Kerr effect leads to various nonlinear effects, like self-phase modulation (SPM) and cross-phase modulation (XPM) phenomena. IV.2.1 Self-phase modulation (SPM) Upon interaction between an electric field and a nonlinear Kerr medium, a modification occurs in the refractive index due to the Kerr effect. This momentary and local change induces in turn a phase modulation of the electric field. This effect leads to the decrease of the instantaneous frequency of the leading edge of the pulse, and to the increase of the frequency of its trailing edge (Figure 15). Self-phase modulation introduces therefore a broadening of the pulse's spectrum, but the corresponding temporal envelope remains unchanged. The combination of dispersion and self-phase modulation allows to generate low dispersion pulses often called "temporal solitons". These solitons are usually used in telecommunication technology to carry data over long distances. Figure 15: Illustration of the mechanism of self phase modulation (SPM). (a) Gaussian profile of the input pulse, (b) frequency chirp Δω for Gaussian pulses and (c) profile of the frequency modulated pulse. 29
52 Part 1 : Optical Nonlinearities, Vitreous Materials: a General Overview Chapter 1 : Linear and nonlinear optical properties of fibers IV.2.2 Solitons In general, a soliton is defined as a pulse which propagates without changes in its temporal shape, ignoring the classical laws of dispersion of energy. This pulse is sufficiently intense to induce a nonlinear effect that will counteract the normal dispersion effects [31, 32]. In optics, one distinguishes two types of solitons: temporal solitons resulting from dispersion effects and Kerr nonlinearity spatial solitons resulting from the diffraction effects and Kerr nonlinearity IV.2.3 Cross-phase modulation (XPM) Another consequence of the Kerr effect is observed in the case where multiple pulses propagate in the fiber. The refractive index induced by one of these pulses is modified by the Kerr effect generated by others copropagating pulses. This phenomenon is known as cross phase modulation (XPM). IV.2.4 Four wave mixing (FWM) This phenomenon corresponds to the interaction of three co-propagating electromagnetic waves, which generate or amplify a fourth one. Their frequencies are related by the following expression: ω 4 = ω 1 ± ω 2 ± ω 3 (24) Theoretically, different combinations of frequencies are possible. However, in general, it is difficult to have FWM of high efficiency in optical fibers owing to the difficulties in satisfying the phase-matching condition for such processes. IV.3 Inelastic nonlinear effects Inelastic nonlinear effects involve energy exchange between the electromagnetic field and the dielectric medium. We distinguish two effects: Raman and Brillouin scattering [33]. At low pulse power, their contribution is negligible but can become important at high power. The first experimental observation of Raman and Brillouin scattering in optical fibers has been reported in 1970 [34-37]. 30
53 Part 1 : Optical Nonlinearities, Vitreous Materials: a General Overview Chapter 1 : Linear and nonlinear optical properties of fibers IV.3.1 Raman scattering (RS) This effect consists of an exchange of energy between the incident photon and the atom (or molecule) via the creation or annihilation of an optical phonon. As the result of such interaction is obtained, in addition to a phonon, a photon with upshifted frequency (lower energy) from the incident photon, called "Stokes shift". (Figure 16-middle). If the interaction of an incident photon with a phonon leads to the emission of a photon having energy higher than that of the incident photon, it is called anti-stokes shift (Figure 16-left). In both cases, the scattered photon does not have the same wavelength as the incident one. If such interaction does not involve any energy exchange between the incident photon and the molecules or atoms, the scattering is elastic and the wavelength of the scattered photon is not shifted, one finds the Rayleigh scattering already described (Figure 16-right). Inelastic Scattering Elastic Scattering ω in +ω p ω in -ω p ω in ω in ω in ω in ω p Anti-Stocks Raman Stocks Raman Rayleigh Scattering Figure 16: Illustration of the Raman scattering IV.3.2 Brillouin scattering (BS) The light scattering caused by interaction with acoustic phonons of a medium is called Brillouin scattering. The energy of molecular vibrations delivers acoustic phonons capable of interacting with light to generate photons and acoustic phonons, through a process similar to that involved in the Raman scattering process. 31
54 Part 1 : Optical Nonlinearities, Vitreous Materials: a General Overview Chapter 1 : Linear and nonlinear optical properties of fibers The generated acoustic wave modulates the refractive index of the medium by creating a local network of Bragg grating type, which then reflects a portion of incident light in the form of Stokes photons. Brillouin scattering is therefore produced in the opposite direction to the incident light propagation direction. The BS frequency shifts are observed in the range of 1 to 200 GHz, compared to Raman shifts (over 300 GHz). Brillouin bandwidth is narrower than that of the Raman bands. Brillouin scattering may be observed spontaneously even at low pump power. However, the development of stimulated Brillouin scattering (SBR), wherein the involved acoustic phonons are generated by the optical photon itself, requires significant power. IV.4 Supercontinuum generation The set of non-linear effects discussed above contributes to generate a spectral broadening of the light pulses propagating in a Kerr medium. This is known as supercontinuum. The magnitude of this broadening strongly depends on the time-regime of the input pulse launched from the pump source. Thus, so-called "ultra-short" femtosecond pulses promote self-phase modulation and the creation of solitons, while nanosecond pulses regimes foster the Raman and Brillouin effects. In optical fibers, Raman scattering and self-phase modulation are responsible for spectral broadening towards longer wavelengths [38], whereas cross phase modulation intervenes in the spectral broadening towards the shorter wavelengths. Spectral components generated by four wave mixing (FWM) can also contribute to the spectral broadening. In addition to Kerr nonlinearity introduced by the material, other parameters can influence the efficiency of nonlinear effects involved in supercontinuum generation, particularly the fiber length used for this purpose (cumulative effect). However, the optical losses in this case must be taken into account. V. Conclusion This chapter provides a theoretical background of the main optical topics required to understand some of the results presented in this dissertation. 32
55 Part 1 : Optical Nonlinearities, Vitreous Materials: a General Overview Chapter 1 : Linear and nonlinear optical properties of fibers An introduction of the pulse transmission along the fiber, with the emphasis of the guidance mechanisms and the general definitions are given. In addition, a brief preliminary description of various conventional, as well as microstructured fibers geometries is provided. The general background of the dispersive and the nonlinear effects in optical fiber is described in this chapter. Finally, a few of the most relevant nonlinear effects and concepts are reviewed for reference in following chapters. 33
56 Part 1 : Optical Nonlinearities, Vitreous Materials: a General Overview Chapter 1 : Linear and nonlinear optical properties of fibers - References VI. References 1. B. R. (Burgami.com). 2. K. C. Kao, and G. A. Hockham, "Dielectric-fibre surface waveguides for optical frequencies," Proceedings of the Institution of Electrical Engineers 113, (1966). 3. D. Keck, and P. Schultz, "Method of producing optical waveguide fibers," US Patent (1970). 4. R. Maurer, D. Beck, and P. Schultz, "Fused silica optical waveguide," US Patent (1970). 5. T. Miya, Y. Terunma, T. Hosaka, and T. Miyashita, "Ultimate low-loss single-mode fiber at 1.55 µm," Electronic Letters 15, (1979). 6. P. Kaiser, E. A. J. Marcatili, and S. Miller, "A new optical fiber," The Bell System Technological Journal 52, (1973). 7. J. C. Knight, T. A. Birks, P. S. J. Russell, and D. M. Atkin, "All-silica single-mode optical fiber with photonic crystal cladding," Optics Letters 21, (1996). 8. J. S. Sanghera, I. D. Aggrawal, L. B. Shaw, C. M. Florea, P. Pureza, V. Q. Nguyen, and F. Kung, "Nonlinear properties of chalcogenide glass fibers," Journal of Optoelectronics and Advanced Materials 8, (2006). 9. M. Bass, E. Van Stryland, D. Williams, and W. Wolfe, Handbook of optics, Volume II, Part 5, Chp. 38&39 (McGraw-Hill, 1996). 10. G. P. Agrawal, Nonlinear fiber optics (Academic press, 2007). 11. D. Mogilevtsev, T. A. Birks, and P. S. J. Russell, "Group-velocity dispersion in photonic crystal fibers," Optics Letters 23, (1998). 12. A. Y. Chamorovskiy, and S. A. Nikitov, "Nonlinear optical devices based on suspendedcore microstructured optical fibers," Journal of Communications Technology and Electronics 58, (2013). 13. J. C. Knight, T. A. Birks, P. S. J. Russell, and J. P. de Sandro, "Properties of photonic crystal fiber and the effective index model," Journal of the Optical Society of America A 15, (1998). 14. B. Kuhlmey, G. Renversez, and D. Maystre, "Chromatic dispersion and losses of microstructured optical fibers," Applied Optics 42, (2003). 34
57 Part 1 : Optical Nonlinearities, Vitreous Materials: a General Overview Chapter 1 : Linear and nonlinear optical properties of fibers - References 15. T. Kanamori, Y. Terunuma, S. Takahashi, and T. Miyashita, "Transmission loss characteristics of As 40 S 60 and As 38 Ge 5 Se 57 glass unclad fibers," Journal of Non- Crystalline Solids 69, (1985). 16. M. F. Churbanov, G. E. Snopatin, V. S. Shiryaev, V. G. Plotnichenko, and E. M. Dianov, "Recent advances in preparation of high-purity glasses based on arsenic chalcogenides for fiber optics," Journal of Non-Crystalline Solids 357, (2011). 17. G. A. Thomas, B. I. Shraiman, P. F. Glodis, and M. J. Stephen, "Towards the clarity limit in optical fibre," Nature 404, (2000). 18. M. Born, and E. Wolf, Principles of optics (Cambridge University Press, 1999). 19. S. J. Russell, "Holey new fibers," Optical Fiber Communication Conference,OSA Technical Digest Series (Optical Society of America, 2001) Papier TuL1, Anheim California, USA (2001). 20. Laferrière, J. a. Lietaert, G. a. Taws, and S. R and Wolszczok, Reference guide to fiber optic testing (JDS Uniphase Corporation, 2007). 21. A. Zendehnam, M. Mirzaei, A. Farashiani, and L. Horabadi Farahani, "Investigation of bending loss in a single-mode optical fibre," Pramana 74, (2010). 22. G. Vitrant, "Effets non linéaires en optique guidée," Collection de la Société Française d'optique 6, (6) (1998). 23. B. P. Stoicheff, "Characteristics of stimulated Raman radiation generated by coherent light," Physics Letters 7, (1963). 24. R. R. Alfano, and S. L. Shapiro, "Emission in the region 4000 to 7000 Å via four-photon coupling in glass," Physical Review Letters 24, (1970). 25. C. Lin, and R. H. Stolen, "New nanosecond continuum for excited-state spectroscopy," Applied Physics Letters 28, (1976). 26. J. K. Ranka, R. S. Windeler, and A. J. Stentz, "Visible continuum generation in air-silica microstructure optical fibers with anomalous dispersion at 800 nm," Optics Letters 25, (2000). 27. R. Holzwarth, T. Udem, T. W. Hansch, J. C. Knight, W. J. Wadsworth, and P. S. J. Russell, "Optical frequency synthesizer for precision spectroscopy," Physical Review Letters 85, (2000). 28. I. Hartl, X. D. Li, C. Chudoba, R. K. Ghanta, T. H. Ko, J. G. Fujimoto, J. K. Ranka, and R. S. Windeler, "Ultrahigh-resolution optical coherence tomography using continuum generation in an air-silica microstructure optical fiber," Optics Letters 26, (2001). 35
58 Part 1 : Optical Nonlinearities, Vitreous Materials: a General Overview Chapter 1 : Linear and nonlinear optical properties of fibers - References 29. J. H. V. Price, T. M. Monro, H. Ebendorff-Heidepriem, F. Poletti, P. Horak, V. Finazzi, J. Y. Y. Leong, P. Petropoulos, J. C. Flanagan, G. Brambilla, F. Xian, and D. J. Richardson, "Mid-IR supercontinuum generation from nonsilica microstructured optical fibers," IEEE Journal of Selected Topics in Quantum Electronics 13, (2007). 30. V. L. Kalashnikov, E. Sorokin, and I. T. Sorokina, "Raman effects in the infrared supercontinuum generation in soft-glass PCFs," Applied Physics B 87, (2007). 31. V. E. Zakharov, and S. Wabnitz, Optical Solitons: Theoretical Challenges and Industrial Perspectives (Springer Berlin Heidelberg, 1998). 32. Y. V. Kartashov, V. A. Vysloukh, and L. Torner, "Soliton shape and mobility control in optical lattices," Progress in Optics 52, (2009). 33. R. W. Boyd, "Nonlinear optics" (Academic Press, 1992). 34. R. H. Stolen, E. P. Ippen, and A. R. Tynes, "Raman oscillation in glass optical waveguide" Appiled Physics Letters 21, (1971). 35. E. P. Ippen, and R. H. Stolen, "Stimulated Brillouin scattering in optical fibers " Appiled Physics Letters 21, (1972). 36. D. Cotter, "Observation of stimulated Brillouin scattering in low-loss silica fibre at 1.3 µm," Electronics Letters 18, (1982). 37. R. W. Tkach, A. R. Chraplyvy, and R. M. Derosier, "Spontaneous Brillouin scattering for single-mode optical fiber characterization," Electronics Letters 22, (1986). 38. J. M. Dudley, and J. R. Taylor, Supercontinuum Generation in Optical Fibers (Cambridge University, 2010). 36
59 Part 1 : Optical Nonlinearities, Vitreous Materials: a General Overview Chapter 2 : Glass materials for infrared supercontinuum generation: state of the art. Chapter 2 : Glass materials for infrared supercontinuum generation: state of the art. 37
60 Part 1 : Optical Nonlinearities, Vitreous Materials: a General Overview Chapter 2 : Glass materials for infrared supercontinuum generation: state of the art. I. What is a glass? I.1 Definition of glass system. The American Society of Testing Materials (ASTM) defines the glass as: an inorganic product of fusion which has cooled to a rigid condition without crystallizing (absence of X- ray diffraction pattern) [1, 2]. Another definition of glass system is proposed by Zarzycki, who defines the glass as a non crystallized solid which exhibits the phenomenon of glass transition [3]. I.2 Thermodynamic properties of glass system. The dynamics and thermodynamics of solidified material depend on temporal and thermal regime of cooling process [4]. It allows to explain physical properties of solidified materials. In general, during cooling of molten solution, at critical temperature, solidification and brutal reduction of molar volume occur, Figure 17. This is due to the growth of crystals. It is the melting temperature (T m ). It is characteristic of crystalline phase. It is adopted as first orderphase transition. Resulting liquid material that manages to get below T m without crystallization are so called supercooled liquid [4]. Its viscosity undergoes gradual increase on temperature reduction. They become harder with further lowering of temperature. Gradual decrease of molar volume is registered. Maintaining cooling rates avoiding crystal s nucleation and growth, leads to form glassy materials. Such state is achieved at the secondorder transition phase localized at the glass transition temperature (T g ), see Figure 17. Temperature at which mobility inside glass materials is almost blocked; it takes long time compared to the time scale of the experimental observation. Viscosity of cooled materials attains an order of magnitude of Poises, the same as that for solid materials. Glass molar volume is relative to expansion coefficient. It continues to decrease as temperature is lowered but maintain values higher to that of crystalline state. In both cases, atomic vibrations which are very similar dominate thermal expansion coefficient [4]. 38

61 Part 1 : Optical Nonlinearities, Vitreous Materials: a General Overview Chapter 2 : Glass materials for infrared supercontinuum generation: state of the art. Figure 17: Isobaric relationship between volume and temperature in the liquid, glassy, and crystalline states. T m is the melting temperature, and T g is the glass transition temperature. T g depends upon the cooling rate, T ga and T gb are the glass transition temperatures corresponding to slow (a) and fast (b) cooling rates [5]. Figure 17 shows that glass formation is kinetically dependant process. I.3 Structure of glass materials All solids that do not have long range periodicity in their atoms arrangement can be termed as amorphous or structureless. They are best defined when compared to a crystalline solid which has a distinctive regular spatial arrangement of atoms throughout the whole material. In fact they are often simply referred to as non-crystalline materials. Although their structure appears random over the long range, an amorphous substance still has a high degree of short range spatial order in its atomic structure. This is because individual atoms in an amorphous solid must still fulfill their requirement for valence bonding. However, unlike their crystalline counterpart, there are some small deviations in the bonding angles between adjacent atoms and this leads to a disruption of the periodicity in the material. An example of crystalline and amorphous material is given in Figure 18 showing the difference between the atomic arrangements. Zachariasen proposed this model of a relatively open structure of glass (Figure 18.b) as compared to the crystalline structure ( Figure 18.a) of the same material, in this case silicon oxide [6]. 39
62 Part 1 : Optical Nonlinearities, Vitreous Materials: a General Overview Chapter 2 : Glass materials for infrared supercontinuum generation: state of the art. a b Figure 18: Schematic arrangement in crystal and amorphous solid. Si O II. Optical properties of soft-glass materials. Soft-glasses (low T g ), can be classified in three main families: heavy oxides as tellurite, fluoride and chalcogenide glasses. In the following section, the fundamental characteristics of these glass families will be reviewed from the viewpoint of use as infrared transparent and highly nonlinear glass fibers. Nonlinear optics (NLO) requires intense incident light beam and a strong interaction with material. Planar waveguides and fiber geometry are of major interest. They allow to reduce waveguide s core dimension down to the submicron scales. This permits a tight mode confinement increasing the light power density. Fibers provide long light path, lengthens its interaction with the glass, these scale factors provide apparent enhancements of nonlinear (NL) effects in glasses [7-9]. The first successful SC generation in optical fiber was reported in 1976 [8, 10]. In particular, the spectral broadening was registered in standard silica-based optical fiber with zero group velocity dispersion (GVD) wavelength around 1.3 µm. Consequently, it was obvious that the following researches will focus on the silica fiber. Thus, supercontinuum generation (SCG) in silica based fibers was extensively studied in the following years. It yielded to commercialize a silica-based fiber supercontinuum source, delivering energy in a wide output spectrum that covers the entire nm region [11]. However, extending further the SC infrared edge is a challenging task due to the multiphonon absorption edge of silica glass network, which limits the transmission window in the infrared region [12, 13]. 40
63 Part 1 : Optical Nonlinearities, Vitreous Materials: a General Overview Chapter 2 : Glass materials for infrared supercontinuum generation: state of the art. Thus, beyond a wavelength of 2.4 μm (Figure 19-b), it is necessary to consider the use of nonsilica glasses also known as soft-glasses. SCG research with soft glass fibers has benefitted from the understanding of the mechanisms leading to the formation of the continuum obtained from prior work with silica fibres [7, 9]. Soft-glasses are low phonon energy materials, having their phonon absorptions in the long wavelength region. In addition, they are known as soft-glass materials due to their low melting temperature and fragile nature comparing to silica glass. The main advantage of soft glasses over silica glass is that the first glass category has a wider IR transmission window, and therefore allows further spanning of the SC IR edge. But the losses for the soft glasses fibers are higher, and for some, the material's dispersion is located far in the MIR. II.1 Transmission window and loss characteristics II.1.1 Multiphonon absorption Figure 19 compares the transmission spectra and the position of infrared wavelength edge, routinely registered for different families of glasses according to their composition. Family of heavy metal oxide (HMO) glasses exhibit lower phonon energies than silica. HMO glasses include among others tellurite and germanate compounds based on the glass-network formers tellurium and germanium dioxide (TeO 2 and GeO 2 ). Certain compositions of these glasses can transmit light beyond 5 μm up to 7 µm [14]. The cut-off edge of fluoride glass family is more extended in the IR compared to silica. Heavy metal fluoride glasses are transparent in the infrared (IR) region up to µm [14-16] depending on the thickness of the sample and the glass composition. By analogy with harmonic oscillator law, phonon resonance frequency is synonymous with weak bond strength [17] and large atomic masses. The IR cut-off is shifted by the nature of the lighter cation and its concentration. As a general rule, the position of IR edge is shifted toward longer wavelengths according to the sequence: AlF 3 < ZrF 4 < HfF 4 < ScF 3 < GaF 3 < InF 3 [18]. The most popular fluoride glass for fabrication into fibers is the fluorozirconate glass of which the most common are ZBLAN (ZrF 4 -BaF 2 -LaF 3 -AlF 3 -NaF). ZBLAN fibers exhibit a transmission window from 0.3 µm to 4.5 µm (Figure 19). This transparency window is IR shifted on indium fluoride glasses. Indium fluoride glass fibers have a transmission window extended 41
64 Part 1 : Optical Nonlinearities, Vitreous Materials: a General Overview Chapter 2 : Glass materials for infrared supercontinuum generation: state of the art. from 0.3 to 5.5 µm. It is 1.5 µm much larger than ZBLAN fiber's window, without any absorption peaks [19]. a b Figure 19: Transmission window of various families of glasses (a) and zoom on the multiphonon absorption edge of the corresponding glass fibers (b) as printed from [25]. Chalcogenide glasses are known for their broad mid-ir transparency window resulting from an extremely low phonon energy and lack of deleterious molecular resonances interrupting the continuity of the IR transmission. For this glass family, the transmission multiphonon edge lies in the mid-ir due to large atomic masses and relatively weak bond strengths. From the periodic table of the elements, we have M S < M Se < M Te. Thus, as a general rule, the position of IR edge is shifted toward longer wavelengths according to the sequence: S < Se < Te. In general and as shown in Figure 19-a, the mid-ir transparency edge on bulk 42
65 Part 1 : Optical Nonlinearities, Vitreous Materials: a General Overview Chapter 2 : Glass materials for infrared supercontinuum generation: state of the art. specimen is 12 μm for sulfide based glasses, 15 μm for selenide glasses and 20 μm for telluride glasses [20]. However, this characteristic wavelength decreases on fiber samples to reach 7 μm, 10 μm, and 12 μm, respectively (Figure 19-b) [21, 22]. Chalcogenide glasses suffer from small band-gap edge resulting in a poor transparency in the visible region [22]. Sulfides usually are transparent in the high wavelength range of the visible region where selenides or tellurides are completely opaque [14, 22-24]. II.1.2 Extrinsic transmission losses. The presence of impurities is responsible for optical absorptions bands at characteristic frequencies in the transmission window edge. This interrupts the continuity of the transmission and reduces the width of the fiber s bandwidth. One of the primary absorbing species common to all families of glass fibers are hydroxyl groups (H 2 O or -OH) [14, 15, 26-31]. The fundamental resonances for hydroxyl species, associated with bending and stretching modes of vibrations, occur mainly around 2.8 µm [26, 29, 31-33]. Other absorption bands arise at different wavelengths, depending on the considered glass system, as well as, according to the combination of different vibration modes of a variety of hydroxyl groups tightly as weakly linked to the glass network [15, 26, 28, 30, 31]. In photonic applications such as supercontinuum generation (SCG), low OH content has become relevant for fibers whose optical performance is related to OH overtones absorption bands [29, 34-38]. These absorbing moieties severely reduce the efficiency of the various nonlinear optical effects, responsible of the spectral broadening, and consequently prevent the extension of the SC spectrum further in the IR region [29, 34, 37, 39]. This has serious implications for the development of low-loss fiber optic [29, 37, 38, 40]. The use of reactive chemicals and batch drying method can substantially reduce the amount of impurities incorporated into the glass [29, 41-43]. Such techniques allow to remove the moistures traces present on the grain surface and / or interface in the starting products used to fabricate different glasses such as tellurite, fluoride and chalcogenide. Others allow to trap the hydroxyl components present within the glass melt. This technique was successfully used on tellurite glasses in our laboratory. Fruitful work of fluoridation of the melt batch allowed to reduce by one order of magnitude the optical losses on single index fiber [29]. 43
66 Part 1 : Optical Nonlinearities, Vitreous Materials: a General Overview Chapter 2 : Glass materials for infrared supercontinuum generation: state of the art. Several researches were conducted to develop low loss fluoride glass fibers. This technological achievement, has resulted in impressive low transmission loss values [44-47]. ZBLAN (ZrF 4 -BaF 2 -LaF 3 -AlF 3 -NaF) glass system are the most known to fabricate fluoride fibers. Early in the 1990 th, the minimum optical loss in ZBLAN fiber was lowered to db/m around 2.35 µm [44]. Nowadays, commercial ZBLAN fibers are available in the market with typical background loss of db/m due to the extrinsic scattering and absorption that are relatively difficult to control in the fabrication process [45]. Nishida and al. [46] have reported low loss PbF 2 -InF 3 based fluoride glass fibers with a minimum attenuation of db/m at 3.33 μm [46]. One year later, they succeeded to reduce this value to db/m on InF 3 -GaF 3 glass fibers [48]. Recently, a multimode fluoride-based fibers with an optical loss of 0.85 db/m at 1.3 μm was achieved using a fluorination process during the glass melting [47, 49-51]. In light of efforts to produce low loss chalcogenide glasses, binary glass system such as As-S, As-Se, Ge-S and Ge-Se compounds were investigated [52-60]. These efforts have coincided with extensive studies in order to reach high-quality optical fibers in view of special features of chalcogenide fibers. Snopatin and al. [52, 53] have optimized the synthesis process of As 2 S 3 glasses and managed to beat the record of minimum optical losses in optical fibers produced from As 2 S 3 glass. The minimum optical losses registered on optical fiber produced from this glass were db/m at 3.0 μm and db/m at 4.8 μm [52, 53]. This loss threshold slightly increases in single-mode As S glass fibers, but remains below 0.1 db/m in the µm range [53]. Here, glass fibers with a core diameter from 3 to 20 µm and a clad diameter of 125 µm were prepared by the double-crucible method. In optical fibers from As 38 S 25 Se 37 (core) and As 38 S 27 Se 35 (clad) produced by the double-crucible method with core/clad diameters of 300/400 and 200/400 µm and numerical aperture of 0.28, the lowest optical loss was found to be 0.06 db/m at 4.8 µm and db/m between 4 and 6 µm [54]. Te-As-Se glass compounds were extensively developed. Consequently, low loss single-index and multimode core clad Te-As-Se based fiber are reported in the literature. An unclad fiber from As 40 Se 30 Te 30 glass with optical losses of 3.5 db/m at 10.6 µm was reported in [59]. The minimal optical loss was enhanced to reach 0.07 db/m at 7.3µm for As 40 Se 35 Te 25 glass fiber and decreases to 0.04 db/m at 6.7 µm for As 30 Se 50 Te 20 based fiber [60]. Recently, new record 44
67 Part 1 : Optical Nonlinearities, Vitreous Materials: a General Overview Chapter 2 : Glass materials for infrared supercontinuum generation: state of the art. of minimum loss level of 0.33 db/m at 7.5 µm was reported on As 39 Se 42.4 Te 18.6 / As 39 Se 42.7 Te 18.3 core clad single-mode optical fibers [55]. These fibers were drawn with core diameter of 20 µm embedded within clad of 450 µm external diameter [56]. A single-index fiber based on Ge 30 As 10 Se 30 Te 30 glass has been reported with optical losses of 0.11 and 1.88 db/m at, 6.6 and 10.6 µm, respectively [56]. These are the minimal optical losses ever registered for Ge 30 As 10 Se 30 Te 30 glass fiber [57]. Using double crucible technique, Shiryaev and al. [57] have succeeded to improve the fiber quality, and to manufacture high purity GeAsSeTe based step index fiber. The fiber exhibited 210 µm core diameter that consisted of Ge 2 As 38 Se 40 Te 20 and 330 µm clad diameter which consisted of Ge 2 As 36 Se 44 Te 18 glass. This Multimode fiber exhibited a minimum optical losses of db/m in the wavelength range of 6-7 µm and losses less than 1.0 db/m in the µm range [57]. Table 1: Lowest loss levels achieved on silica, fluoride, tellurite and chalcogenides glass fibers. Silica Tellurite Fluoride Chalcogenide Glass Minimum optical losses on fibers α min (10-3.dB/m) λ (µm) [61] SiO [62] TZN < [29] ZBLAN [48] InF 3 -FaF 3 /ZBLAN [63] As 2 S [53] As 38 S 25 Se [60] As 40 Se 35 Te [56] Ge 30 As 10 Se 30 Te In addition to extrinsic absorption species, local defects induce scattering losses and contribute to increase the transmission losses. These scattering centers (bubble, metallic impurities.) come from starting products, synthesis and drawing process. These imperfections can be divided into volume and surface defects. These scattering sites depend on the melting and quenching conditions during glass fabrication. Volume defects such as bubbles, un-dissolved particles and crystals are imperfections within the glass matrices that are principally formed during glass melting. Surface defects grow with surface 45
68 Part 1 : Optical Nonlinearities, Vitreous Materials: a General Overview Chapter 2 : Glass materials for infrared supercontinuum generation: state of the art. contaminations, micro-cracks and surface crystallization originate from the reaction of the glass surface with moisture from the atmosphere of fiber fabrication or storage [52]. Records of purity reported on different glass families are gathered in Table 1. II.2 Linear and Nonlinear refractive index The linear refractive index "n" is a macroscopic material parameter characterizing the phase propagation velocity of the light depending on microscopic dielectric polarization p(ω) of the medium by the optical E-field. Hence, it is related to the chemical composition of the material and depends on individual ions present in the glass, their packing along with their polarizability. Furthermore, the refractive index generally increases with increasing size of ions [25], as by introducing a heavy-metal components within the glass medium. Below we briefly report several studies to provide a complete picture of evolution of both linear and nonlinear optical properties of different soft glass families. In tellurite glasses the nonlinearity is presumably due to large non-linear electronic polarization of TeO 2 entities [64]. Tellurite based glass TZN (TeO 2 -ZnO 2 -Na 2 O), exhibit significant improvement of nonlinearity by introducing Nb 2 O 5 components. Whereas, opposite behavior appears when Nb 2 O 5 is replaced by BaO. The increased nonlinearity with Nb 2 O 5 doping is likely associated with the higher oxygen-to-cation ratio effectively increasing the polarizability of the glass [64] although the exact mechanism is not clear [65]. While Nb 2 O 5 appears to function as a intermediate network former [66], resulting in a more stable glass matrix, BaO should enter the glass network as a network modifier, which are known to decrease the nonlinear properties of TeO 2 based glasses [67]. Similar results are also reported in [68], where the presence of GeO 2 decreases the value of the nonlinear refractive index [69]. Refractive index in heavy metal fluoride glasses is changed by systematic substitution of cations elements in standard glass fluorozirconate glasses including ZBLA (ZrF 4 BaF 2 LaF 3 AlF 3 ) and ZBLAN (ZrF 4 BaF 2 LaF 3 AlF 3 NaF) [18]. This process allowed to modify the polarizibility within the glass network. However, substantial change of refractive index has not been reported by composition manipulation. Here, the maneuver merge is limited by a set of requirements, in particular the minimum stability of the vitreous phases against devitrification. 46
69 Part 1 : Optical Nonlinearities, Vitreous Materials: a General Overview Chapter 2 : Glass materials for infrared supercontinuum generation: state of the art. In chalcogenide glasses, depending on the chemical composition, the nonlinear refractive index n 2 has been measured to be between 100 to 1000 times larger than for silica glass [70]. In sulfur- and selenide-based chalcogenide glasses, both S and Se exhibit two electronic lone pairs [24]. It has been confirmed that Se-based chalcogenide glasses possess higher nonlinearity than S-based chalcogenide glasses which may be attributed to the excess of selenium-selenium or selenium-sulfur covalent bonds [24]. One can note also that in case of selenium, electronic lone pairs are higher in energy than that of sulfur. On the other hand, the minor substitution of selenium having two electronic lone pairs by germanium exempt of electronic lone pairs, sharply decreases the non-linear refractive index. Furthermore, it seems that addition of tellurium does not enhance significantly the nonlinear refraction index, but exalts more the nonlinear absorption [71]. Table 2 presents evolution of nonlinear optical properties of various chalcogenide glasses according to corresponding chemical composition. Table 2: Nonlinear optical constants for different glass compositions, of highly linear chalcogenide glasses. n 2 : non linear refractive index. Parameters were measured at µm wavelength. Composition n 2 (10-18 m 2.W -1 ) [23, 71] As 40 S [23, 72] As 40 Se [23] Ge 20 Se [72] Ge 10 As 10 Se [23] Ge 20 As 40 Se [72] Ge 10 As 10 Se 70 Te [72] Ge 10 As 10 Se 60 Te [23] Ge 20 Se Figure 20 displays the merges of nonlinear refractive index, and its relation to linear index with the glass classification. It is clearly seen that the glass nonlinearity follows the polarizability of anions, and as a general rule, both linear and nonlinear refractive index increase according to the sequence: F - < O 2- < S 2- < Se 2- respectively. 47
70
71 Part 1 : Optical Nonlinearities, Vitreous Materials: a General Overview Chapter 2 : Glass materials for infrared supercontinuum generation: state of the art. Microstructured optical fibers (MOFs) technology allowed to overcome limitations of the material's dispersion [25, 74], especially for those owing ZDW far in the IR such as chalcogenide glasses. MOF geometry successfully permitted to modify the guidance properties within the glass fibers and to tailor the fiber chromatic dispersion [74-77] and are well suited as the basis of a supercontinuum source. These effects are achievable by carefully engineered patterns of well defined parameters of the MOF. III. Supercontinuum generation records in soft-glasses Despite numerous successful [78, 79] spectral broadening reported on bulk specimens by self focusing (filamentation) technique, we believe that such strategy is disadvantageous at many levels. First, self-focusing requires the use of high pulse intensities, usually close to the damage threshold of the operated glass system [80, 81]. In addition, output SC suffers from reduced brightness and coherence, caused by the multiple filament that can occur within the illuminated bulk when power above the self focusing threshold is applied [82]. These constraints are overcome on fiber geometry. In a first approach, a fiber provides a long path length requiring relatively low power to enable the spectral broadening. In addition, special structure of fiber, known as MOF allows to engineer its ZDW and improve the light confinement highly suitable for the sequence of events in supercontinuum generation [82]. Thus, in this section, we exclusively review experiments on mid-infrared supercontinuum generation on dispersion engineered fluoride, tellurite and chalcogenide glass fibers. Quin and al. [83] succeeded to registered a 6000 nm supercontinuum spectrum in a fluoride fiber by The fibre used in this experiment was a ZrF 4 BaF 2 LaF 3 AlF 3 NaF (ZBLAN) step-index fiber. The fiber has a core diameter of 9 µm, a numerical aperture (NA) of 0.2. A short 2 cm length of fibre was used in this experiment to overcome the substantial propagation losses that occur at longer wavelengths. The specimen was seeded in the normal dispersion regime at 1450 nm using femtosecond laser. When the fiber is seeded with peak power of 50 MW, it enables a broadening extended from ~0.35 nm in the UV up to 6.28 µm (Figure 21). 49
72 Part 1 : Optical Nonlinearities, Vitreous Materials: a General Overview Chapter 2 : Glass materials for infrared supercontinuum generation: state of the art. Figure 21: Record continuum registered in centimeter scale step-index ZBLAN fiber [83]. SC Spanning record extended over 4000 nm was successfully registered on tellurite fiber and reported by Domachuk and al. in 2008 [84]. The fiber was fabricated using an extrusion process from a bulk tellurite glass billet with stoichiometry 75TeO 2-12ZnO-5PbO-3PbF 2-5Nb 2 O 5. The fiber was designed to tailor the fiber ZDW down to 1380 nm in order to allow anomalous dispersion pumping. Microstructure consists of six thin struts of 120 nm thickness, supporting a suspended core of 2.5 μm of diameter. Short fiber (8 mm) length was used in order to decrease the substantial material's loss of the MOF at long wavelengths. When pumped with a 1550 nm femtosecond source, a SC extending from 0.79 to 4.87 µm is measured (Figure 22). Figure 22: Record continuum registered in sub-centimeter suspended core tellurite fiber [84] 50
73 Part 1 : Optical Nonlinearities, Vitreous Materials: a General Overview Chapter 2 : Glass materials for infrared supercontinuum generation: state of the art. Shaw and al. [85] reported a SC spectrum spreading over ~2.9 µm from a As 2 S 3 step index nonlinear optical fiber. The 2 m long fiber used in this experiment exhibits a 10 µm core diameter and is pumped in the normal dispersion regime at 2.45 µm by means of fibered femtosecond laser source. Following light coupling in the fiber, the spectral broadening extends from 1.9 to 4.8 µm (Figure 23). The relatively high loss level can be mitigated using short fiber length and / or by ensuring anomalous dispersion pumping increasing the non linear effects efficiency. Both scenarios can not be reached on step index fiber which imposes a transition to MOF allowing chromatic dispersion engineering in order to pump in the anomalous dispersion regime. In addition, MOF ensure high confinement of coupled signal, enhancing thus the non linear optical effects efficiency and reducing significantly the fiber length required to ensure the spectral broadening. Figure 23: SC spectrum covering from 1.9 μm to 4.8 μm from a single mode step-index As 2 S 3 fiber pumped at 2.45 μm and the measured fiber loss. [85]. Spectral enlargement records reported on both tellurite and fluoride glasses outstandingly overcome the corresponding multiphonon absorption edge located below 4.5 µm (Figure 19- b). In order to bypass this detrimental material absorption, the later achievements required the use of short length samples and high peak power pump lasers. In addition, SC spectra suffer from low flatness and low dynamic power. 51
74 Part 1 : Optical Nonlinearities, Vitreous Materials: a General Overview Chapter 2 : Glass materials for infrared supercontinuum generation: state of the art. Despite the spectral spanning registered on chalcogenide-based fibers has not exceeded those reported for tellurite and fluoride-based fibers, chalcogenides remain significantly advantageous when seeking to cover the midinfrared and infrared region. IV. Conclusion Chalcogenide glasses are characterized by a wide IR transmission and high nonlinearity comparing to fluoride and tellurite glasses. These features make these glasses promising candidate for SCG covering both atmospheric transmission windows, extended between 3-5 and 8-12 µm, respectively. Sulfide based chalcogenide glasses are the most transparent in the near visible range, it is around 500 nm for As 2 S 3 [14]. Compared to the previous glass materials, chalcogenide nonlinearity is very high. As 2 S 3 ZDW (4.8 µm) is one of the lowest among chalcogenide glasses, furthermore microstructured profile allows to lower the ZDW of the fibres [25, 80, 86-88]. Moreover, in suspended core case, sulfide glasses low ZDW leads to core diameter bigger than selenide glasses which is an advantage for light coupling. In addition, latest improvement of glass fabrication technology allowed to fabricate chalcogenide fibers with optical losses close to their corresponding theoretical threshold. Besides that, microstructured optical fiber technology has enabled engineering of the fiber chromatic dispersion allowing thus to pump the fiber with commercially available laser sources. The combination of these features predicts promising results for supercontinuum generation. For the following works about supercontinuum generation in fiber, among chalcogenide glasses we selected a sulfide one: As 2 S 3. 52
75 Part 1 : Optical Nonlinearities, Vitreous Materials: a General Overview Chapter 2: Glass materials for infrared supercontinuum generation: state of the art-references V. References 1. A. K. Varshneya, and J. C. Mauro, "Comment on misconceived ASTM definition of Glass by A. C. Wright," Glass Technology 51, (2010). 2. M. D.-Y. SEUNG, "Approche structurale et étude de la conduction ionique de verres a base de thioarsenite de lithium et de verres a formateur mixte, thioborate et thioarsenite de lithium," PhD in Université Sciences et Technologies - Bordeaux I (Université de Bordeaux I, France, 1995). 3. J. Zarzycki, Les verres et l'état vitreux (Masson, 1982). 4. M. D. Ediger, C. A. Angell, and S. R. Nagel, "Supercooled liquids and glasses," The Journal of Physical Chemistry 100, (1996). 5. P. G. Debenedetti, and F. H. Stillinger, "Supercooled liquids and the glass transition," Nature 410, (2001). 6. H. Rawson, Glasses and their applications (Institute of Metals, London, 1991). 7. G. P. Agrawal, Nonlinear fiber optics (Academic press, 2007). 8. J. M. Dudley, G. Genty, and S. Coen, "Supercontinuum generation in photonic crystal fiber," Reviews of Modern Physics 78, (2006). 9. J. M. Dudley, and J. R. Taylor, Supercontinuum Generation in Optical Fibers (Cambridge University, 2010). 10. C. Lin, and R. H. Stolen, "New nanosecond continuum for excited-state spectroscopy," Applied Physics Letters 28, (1976) J. Fatome, B. Kibler, M. El-Amraoui, J. C. Jules, G. Gadret, F. Desevedavy, and F. Smektala, "Mid-infrared extension of supercontinuum in chalcogenide suspended core fibre through soliton gas pumping," Electronics Letters 47, (2011). 13. X. Chenan, M. Kumar, C. Ming-Yuan, O. P. Kulkarni, M. N. Islam, A. Galvanauskas, F. L. Terry, M. J. Freeman, D. A. Nolan, and W. A. Wood, "Supercontinuum generation in silica fibers by amplified nanosecond laser diode pulses," IEEE Journal of Selected Topics in Quantum Electronics 13, (2007). 14. D. Lezal, "Chalcogenide glasses - survey and progress," Journal of Optoelectronics and Advanced Materials 5, (2003). 15. F. Huang, Y. Ma, W. Li, X. Liu, L. Hu, and D. Chen, "2.7 µm emission of high thermally and chemically durable glasses based on AlF 3," Scientific Reports 4, 1-6 (2014). 53
76 Part 1 : Optical Nonlinearities, Vitreous Materials: a General Overview Chapter 2: Glass materials for infrared supercontinuum generation: state of the art-references 16. X. Zhu, and N. Peyghambarian, "High-power ZBLAN glass fiber lasers: review and prospect," Advances in OptoElectronics 2010, 1-23 (2010). 17. J. Lucas, "Infrared glasses," Current Opinion in Solid State and Materials Science 4, (1999). 18. M. Poulain, A. Soufiane, Y. Messaddeq, and M. A. Aegerter, "Fluoride glasses: synthesis and properties " Brazilian Journal of Physics 22, (1992). 19. F. g. fibers, "Fluoride glass fibers," in Photonics Society Summer Topical Meeting Series, 2011 IEEE (IEEE, Montreal, QC, M Saad). 20. J. A. Savage, and S. Nielsen, "Chalcogenide glasses transmitting in the infrared between 1 and 20 µm a state of the art review," Infrared Physics 5, (1965). 21. V. Kokorina, Glasses for infrared optics (The CRC Press, 1996). 22. J.-L. Adam, and X. Zhang, Chalcogenide Glasses: Preparation, Properties and Applications (Woodhead Publishing, 2014). 23. C. Quémard, F. Smektala, V. Couderc, A. Barthélémy, and J. Lucas, "Chalcogenide glasses with high non linear optical properties for telecommunications," Journal of Physics and Chemistry of Solids 62, (2001). 24. T. Cardinal, K. A. Richardson, H. Shim, A. Schulte, R. Beatty, K. Le Foulgoc, C. Meneghini, J. F. Viens, and A. Villeneuve, "Non-linear optical properties of chalcogenide glasses in the system As-S-Se," Journal of Non-Crystalline Solids , (1999). 25. J. H. V. Price, T. M. Monro, H. Ebendorff-Heidepriem, F. Poletti, P. Horak, V. Finazzi, J. Y. Y. Leong, P. Petropoulos, J. C. Flanagan, G. Brambilla, F. Xian, and D. J. Richardson, "Mid-IR supercontinuum generation from nonsilica microstructured optical fibers," IEEE Journal of Selected Topics in Quantum Electronics 13, (2007). 26. E. Stolper, "Water in silicate glasses: an infrared spectroscopic study," Contributions to Mineralogy and Petrology 81, 1-17 (1982). 27. B. Richards, A. Jha, Y. Tsang, D. Binks, J. Lousteau, F. Fusari, A. Lagatsky, C. Brown, and W. Sibbett, "Tellurite glass lasers operating close to 2 μm," Laser Physics. Letters 7, (2010). 28. P. Toupin, L. Brilland, D. Mechin, J. Adam, and J. Troles, "Optical aging of chalcogenide microstructured optical fibers," Journal of Lightwave Technology, 32, (2014). 29. I. Savelii, F. Desevedavy, J.-C. Jules, G. Gadret, J. Fatome, B. Kibler, H. Kawashima, Y. Ohishi, and F. Smektala, "Management of OH absorption in tellurite optical fibers and related supercontinuum generation," Optical Materials 35, (2013). 54
77 Part 1 : Optical Nonlinearities, Vitreous Materials: a General Overview Chapter 2: Glass materials for infrared supercontinuum generation: state of the art-references 30. M. Saito, "Optical loss increase in an As-S glass infrared fiber due to water diffusion," Applied Optics 26, (1987). 31. V. G. Plotnichenko, V. O. Sokolov, and E. M. Dianov, "Hydroxyl groups in high-purity silica glass," Journal of Non-Crystalline Solids 261, (2000). 32. A. M. Efimov, and V. G. Pogareva, "Water-related IR absorption spectra for some phosphate and silicate glasses," Journal of Non-Crystalline Solids 275, (2000). 33. A. M. Efimov, and V. G. Pogareva, "IR absorption spectra of vitreous silica and silicate glasses: The nature of bands in the 1300 to 5000 cm -1 region," Chemical Geology 229, (2006). 34. I. Savelii, O. Mouawad, J. Fatome, B. Kibler, F. Désévédavy, G. Gadret, J. C. Jules, P. Y. Bony, H. Kawashima, W. Gao, T. Kohoutek, T. Suzuki, Y. Ohishi, and F. Smektala, "Mid-infrared 2000-nm bandwidth supercontinuum generation in suspended-core microstructured Sulfide and Tellurite optical fibers," Optics Express 20, (2012). 35. A. Kudlinski, G. Bouwmans, O. Vanvincq, Y. Quiquempois, A. Le Rouge, L. Bigot, G. Mélin, and A. Mussot, "White-light cw-pumped supercontinuum generation in highly GeO 2 -doped-core photonic crystal fibers," Optics Letters 34, (2009). 36. J. C. Travers, R. E. Kennedy, S. V. Popov, J. R. Taylor, H. Sabert, and B. Mangan, "Extended continuous-wave supercontinuum generation in a low-water-loss holey fiber," Optics Letters 30, (2005). 37. O. Mouawad, J. Picot-Clémente, F. Amrani, C. Strutynski, J. Fatome, B. Kibler, F. Désévédavy, G. Gadret, J. C. Jules, D. Deng, Y. Ohishi, and F. Smektala, "Multioctave midinfrared supercontinuum generation in suspended-core chalcogenide fibers," Optics Letters 39, (2014). 38. I. Gris-Sanchez, and J. C. Knight, "Time-dependent degradation of photonic crystal fiber attenuation around OH absorption wavelengths," Journal of Lightwave Technology 30, (2012). 39. S. A. Dekker, A. C. Judge, R. Pant, I. Gris-Sánchez, J. C. Knight, C. M. de Sterke, and B. J. Eggleton, "Highly-efficient, octave spanning soliton self-frequency shift using a specialized photonic crystal fiber with low OH loss," Optics Express 19, (2011). 40. I. Gris-Sánchez, B. J. Mangan, and J. C. Knight, "Reducing spectral attenuation in smallcore photonic crystal fibers," Optical Materials Express 1, (2011). 41. V. Q. Nguyen, J. S. Sanghera, P. Pureza, F. H. Kung, and I. D. Aggarwal, "Fabrication of arsenic selenide optical fiber with low hydrogen impurities," Journal of the American Ceramic Society 85, (2002). 55
78 Part 1 : Optical Nonlinearities, Vitreous Materials: a General Overview Chapter 2: Glass materials for infrared supercontinuum generation: state of the art-references 42. V. Q. Nguyen, J. S. Sanghera, B. Cole, P. Pureza, F. H. Kung, and I. D. Aggarwal, "Fabrication of arsenic sulfide optical fiber with low hydrogen impurities," Journal of the American Ceramic Society 85, (2002). 43. P. Joshia, B. Richardsa, and A. Jhaa, "Reduction of OH ions in tellurite glasses using chlorine and oxygen gases," Journal of Materials Research 28, (2013). 44. D. Szebesta, S. T. Davey, J. R. Williams, and M. W. Moore, "OH absorption in the low loss window of ZBLAN (P) glass fibre," Journal of Non-Crystalline Solids 161, (1993). 45. J. A. Harrington, Infrared fibers and their applications (SPIE press Bellingham, 2004). 46. Y. Nishida, T. Kanamori, T. Sakamoto, Y. Ohishi, and S. Sudo, "Development of PbF 2 - GaF 3 -InF 3 -ZnF 2 -YF 3 -LaF 3 glass for use as a 1.3 µm Pr 3+ -doped fiber amplifier host," Journal of Non-Crystalline Solids 221, (1997). 47. M. Saad, "Fluoride glass fiber: state of the art," Proceeding SPIE 7316, 73160N-73160N (2009). 48. T. Kanamori, Y. Nishida, Y. Ohishi, T. Sakamoto, and S. Sudo, "Fluoride glass fiber," in Google Patents-US Patent 5,774,620 (1998). 49. S. Mitachi, Y. Terunuma, Y. Ohishi, and S. Takahashi, "Reduction of impurities in fluoride glass fibers," Journal of Lightwave Technology 2, (1984). 50. A. M. Mailhota, A. Elyamania, and R. E. Rimana, "Reactive atmosphere synthesis of solgel heavy metal fluoride glasses," Journal of Materials Research 7, (1992). 51. J. Bei, T. M. Monro, A. Hemming, and H. Ebendorff-Heidepriem, "Reduction of scattering loss in fluoroindate glass fibers," Optical Materials Express 3, (2013). 52. G. E. Snopatin, V. S. Shiryaev, V. G. Plotnichenko, E. M. Dianov, and M. F. Churbanov, "High-purity chalcogenide glasses for fiber optics," Inorganic Materials 45, (2009). 53. G. Е. Snopatin, М. F. Churbanov, A. A. Pushkin, V. V. Gerasimenko, Е. М. Dianov, and V. G. Plotnichenko, "High purity arsenic-sulfide glasses and fibers with minimum attenuation of 12 db/km," Optoelectronics and Advanced Materials 3, (2009). 54. E. M. Dianov, V. G. Plotnichenko, Y. N. Pyrkov, I. V. Smol'nikov, S. A. Koleskin, G. G. Devyatykh, M. F. Churbanov, G. E. Snopatin, I. V. Skripachev, and R. M. Shaposhnikov, "Single-mode As-S glass fibers," Inorganic Materials 39, (2003). 55. M. F. Churbanov, V. S. Shiryaev, I. V. Skripachev, G. E. Snopatin, V. G. Pimenov, S. V. Smetanin, R. M. Shaposhnikov, I. E. Fadin, Y. N. Pyrkov, and V. G. Plotnichenko, "High-purity As 2 S 1.5 Se 1.5 glass optical fibers," Inorganic Materials 38, (2002). 56
79 Part 1 : Optical Nonlinearities, Vitreous Materials: a General Overview Chapter 2: Glass materials for infrared supercontinuum generation: state of the art-references 56. V. S. Shiryaev, C. Boussard-Plédel, P. Houizot, T. Jouan, J. L. Adam, and J. Lucas, "Single-mode infrared fibers based on TeAsSe glass system," Materials Science and Engineering: B 127, (2006). 57. J. S. Sanghera, V. Q. Nguyen, P. C. Pureza, F. H. Kung, R. Miklos, and I. D. Aggarwal, "Fabrication of low-loss IR-transmitting Ge 30 As 10 Se 30 Te 30 glass fibers," Journal of Lightwave Technology 12, (1994). 58. V. S. Shiryaev, M. F. Churbanov, E. M. Dianov, V. G. Plotnichenko, J.-L. Adam, and J. Lucas, "Recent propgress in preparation of chalcogenide As-Se-Te glasses with low impurity content," Journal of Optoelectronics and Advanced Materials 7, (2005). 59. G. G. Devyatykh, E. M. Dianov, V. G. Plotnichenko, A. A. Pushkin, Y. N. Pyrkov, I. V. Skripachev, G. E. Snopatin, M. F. Churbanov, and V. S. Shiryaev, "Low-loss infrared arsenic-chalcogenide glass optical fibers," SPIE Proceedings on Advances in Fiber Optics 4083, 229 (2000). 60. V. S. Shiryaev, J. L. Adam, X. H. Zhang, C. Boussard-Plédel, J. Lucas, and M. F. Churbanov, "Infrared fibers based on Te-As-Se glass system with low optical losses," Journal of Non-Crystalline Solids 336, (2004). 61. M. F. Churbanov, G. E. Snopatin, V. S. Shiryaev, V. G. Plotnichenko, and E. M. Dianov, "Recent advances in preparation of high-purity glasses based on arsenic chalcogenides for fiber optics," Journal of Non-Crystalline Solids 357, (2011). 62. G. A. Thomas, B. I. Shraiman, P. F. Glodis, and M. J. Stephen, "Towards the clarity limit in optical fibre," Nature 404, (2000). 63. K. Itoh, H. Yanagita, H. Tawarayama, K. Yamanaka, E. Ishikawa, K. Okada, H. Aoki, Y. Matsumoto, A. Shirakawa, Y. Matsuoka, and H. Toratani, "Pr 3+ doped InF3/GaF3 based fluoride glass fibers and Ga-Na-S glass fibers for light amplification around 1.3 µm," Journal of Non-Crystalline Solids , 1-5 (1999). 64. H. Nasu, O. Matsushita, K. Kamiya, H. Kobayashi, and K. i. Kubodera, "Third harmonic generation from Li 2 O-TiO 2 -TeO 2 glasses," Journal of Non-Crystalline Solids 124, (1990). 65. I. Fanderlik, Optical Properties of Glass, Glass Science and Technology (Elsevier, Amsterdam, 1983). 66. S.-H. Kim, and T. Yoko, "Nonlinear optical properties of TeO 2 -based glasses: MOx-TeO 2 (M = Sc, Ti, V, Nb, Mo, Ta, and W) binary glasses," Journal of the American Ceramic Society 78, (1995). 57
80 Part 1 : Optical Nonlinearities, Vitreous Materials: a General Overview Chapter 2: Glass materials for infrared supercontinuum generation: state of the art-references 67. U. Hoppe, E. Yousef, C. Russel, J. Neuefeind, and A. C. Hannon, "Structure of zinc and niobium tellurite glasses by neutron and x-ray diffraction," Journal of Physics : Condensed Matter 16, (2004). 68. F. E. P. d. Santos, F. C. Fávero, A. S. L. Gomes, J. Xing, Q. Chen, M. Fokine, and I. C. S. Carvalho, "Evaluation of the third-order nonlinear optical properties of tellurite glasses by thermally managed eclipse Z-scan," Journal of Applied Physics 105, : 1-4 (2009). 69. R. F. Souza, M. A. R. C. Alencara, J. M. Hickmann, R. Kobayashi, and L. R. P. Kassab, "Femtosecond nonlinear optical properties of tellurite glasses," Journal of Applied Physics 89, : 1-3 (2006). 70. S.-H. Kim, "Nonlinear optical properties of TeO 2 -based glasses: Li(Na and K) 2 O TeO 2 binary glasses," Journal of Materials Research 14, (1999). 71. F. Smektala, C. Quemard, L. Leneindre, J. Lucas, A. Barthélémy, and C. De Angelis, "Chalcogenide glasses with large non-linear refractive indices," Journal of Non- Crystalline Solids 239, (1998). 72. S. Cherukulappurath, M. Guignard, C. Marchand, F. Smektala, and G. Boudebs, "Linear and nonlinear optical characterization of tellurium based chalcogenide glasses," Optics Communications 242, (2004). 73. L. Petit, "Amplification optique dans des verres borophosphate de niobium et tellurite dopés aux ions de terres rares présentant un indice optique non linéaire élevé," PhD in Université Sciences et Technologies - Bordeaux I (Univertité de Bordeaux I, France, 2002). 74. M. H. Frosz, P. Falk, and O. Bang, "The role of the second zero-dispersion wavelength in generation of supercontinua and bright-bright soliton-pairs across the zero-dispersion wavelength: erratum," Optics Express 15, (2007). 75. M. H. Frosz, O. Bang, and A. Bjarklev, "Soliton collision and Raman gain regimes in continuous-wave pumped supercontinuum generation," Optics Express 14, (2006). 76. A. Apolonski, B. Povazay, A. Unterhuber, W. Drexler, W. J. Wadsworth, J. C. Knight, and P. S. J. Russell, "Spectral shaping of supercontinuum in a cobweb photonic-crystal fiber with sub-20-fs pulses," Journal of the Optical Society of America B 19, (2002). 77. G. Genty, M. Lehtonen, H. Ludvigsen, and M. Kaivola, "Enhanced bandwidth of supercontinuum generated in microstructured fibers," Optics Express 12, (2004). 58
81 Part 1 : Optical Nonlinearities, Vitreous Materials: a General Overview Chapter 2: Glass materials for infrared supercontinuum generation: state of the art-references 78. M. Liao, W. Gao, T. Cheng, Z. Duan, X. Xue, H. Kawashima, T. Suzuki, and Y. Ohishi, "Ultrabroad supercontinuum generation through filamentation in tellurite glass," Laser Physics Letters 10, (2013). 79. M. Liao, W. Gao, T. Cheng, X. Xue, Z. Duan, D. Deng, H. Kawashima, T. Suzuki, and Y. Ohishi, "Five-Octave-Spanning Supercontinuum Generation in Fluoride Glass," Applied Physics Express 6, (2013). 80. D. D. Hudson, S. A. Dekker, E. C. Mägi, A. C. Judge, S. D. Jackson, E. Li, J. S. Sanghera, L. B. Shaw, I. D. Aggarwal, and B. J. Eggleton, "Octave spanning supercontinuum in an As 2 S 3 taper using ultralow pump pulse energy," Optics Letters 36, (2011). 81. M. Szpulak, and S. Février, "Chalcogenide As 2 S 3 suspended core fiber for Mid-IR wavelength conversion based on degenerate four-wave mixing," IEEE Photonics Technology Letters 21, (2009). 82. Y. Yu, X. Gai, T. Wang, P. Ma, R. Wang, Z. Yang, D.-Y. Choi, S. Madden, and B. Luther-Davies, "Mid-infrared supercontinuum generation in chalcogenides," Optical Materials Express 3, (2013). 83. G. Qin, X. Yan, C. Kito, M. Liao, C. Chaudhari, T. Suzuki, and Y. Ohishi, "Ultrabroadband supercontinuum generation from ultraviolet to 6.28μm in a fluoride fiber," Applied Physics Letters 95, (2009). 84. P. Domachuk, N. A. Wolchover, M. Cronin-Golomb, A. Wang, A. K. George, C. M. B. Cordeiro, J. C. Knight, and F. G. Omenetto, "Over 4000 nm bandwidth of mid-ir supercontinuum generation in sub-centimeter segments of highly nonlinear tellurite PCFs," Optics Express 16, (2008). 85. R. R. Gattass, L. Brandon Shaw, V. Q. Nguyen, P. C. Pureza, I. D. Aggarwal, and J. S. Sanghera, "All-fiber chalcogenide-based mid-infrared supercontinuum source," Optical Fiber Technology 18, (2012). 86. M. R. Lamont, B. Luther-Davies, D.-Y. Choi, S. Madden, and B. J. Eggleton, "Supercontinuum generation in dispersion engineered highly nonlinear (γ = 10/W/m) As 2 S 3 chalcogenide planar waveguide," Optics Express 16, (2008). 87. M. El-Amraoui, J. Fatome, J. C. Jules, B. Kibler, G. Gadret, C. Fortier, F. Smektala, I. Skripatchev, C. F. Polacchini, Y. Messaddeq, J. Troles, L. Brilland, M. Szpulak, and G. Renversez, "Strong infrared spectral broadening in low-loss As-S chalcogenide suspended core microstructured optical fibers," Optics Express 18, (2010). 88. M. El-Amraoui, G. Gadret, J. C. Jules, J. Fatome, C. Fortier, F. Désévédavy, I. Skripatchev, Y. Messaddeq, J. Troles, L. Brilland, W. Gao, T. Suzuki, Y. Ohishi, and F. 59
82 Part 1 : Optical Nonlinearities, Vitreous Materials: a General Overview Chapter 2: Glass materials for infrared supercontinuum generation: state of the art-references Smektala, "Microstructured chalcogenide optical fibers from As 2 S 3 glass: towards new IR broadband sources," Optics Express 18, (2010). 60
83 Part 2 : Mid-Infrared Supercontinuum Generation In As 2 S 3 Microstructured Optical Fibers Introduction Part 2 :Mid-Infrared Supercontinuum Generation In As 2 S 3 Microstructured Optical Fibers 61
84 Part 2 : Mid-Infrared Supercontinuum Generation In As 2 S 3 Microstructured Optical Fibers Introduction I. Introduction Supercontinuum generation (SCG) describes a process, in which, the spectrum of a narrow bandwidth incident pulse undergoes a substantial spectral broadening through the interplay of various nonlinear processes, as it propagates throughout a nonlinear medium. Supercontinuum (SC) generation was first reported in the early 1970s in bulk by Alfano and Shapiro [1]. Six years later, Lin and Stolen [2] reported on the first continuum in glass fiber. Ever since, broadband SC generation in optical fibers is of particular interest because of the optical fibers unique advantages in their pump interactions with the nonlinearities of the fiber materials. Over the past decade, the introduction of special fibers, and in particular photonic crystal fibers have enabled major strides in obtaining a broad continuum, leading to development of compact and efficient broadband sources [3-7]. SC generation in MOFs has found potential applications in such diverse fields as spectroscopy, metrology, telecommunication or biology [8, 9]. Continuum generation has been demonstrated in silica photonic crystal fiber in the visible and near infrared. Broadband sources based on silica photonic crystal fibers operating from visible to near-infrared range have been already commercialized. However, further extension of the SC infrared edge is a challenging task due to the multiphonon absorption of the silica glass network, which limits the transmission window in the infrared. Consequently, supercontinuum spectra have only been able to span to about 2.2 µm [10, 11]. A high power mid-ir SC source operating in the atmospheric transmission windows that lie between 3-5 µm and 8-12 µm, has numerous applications in the field of IR such as biology, sensing, spectroscopy, and other fields. Thus, the recent trend is to provide alternative materials so as to spread further the SC in the mid-infrared (MIR) region. However, to generate SC spectrum in the MIR region, optical fibers of low optical losses in the corresponding wavelength range and suitable nonlinearity are required. For instance, there have been several demonstrations of mid-ir supercontinuum generation using chalcogenide, fluoride, and tellurite-based optical fibers [11-24]. However, the intrinsic multiphonon absorption edge in fluoride and tellurite glasses remains the main limitation of further spanning of the continuum MIR edge [25]. Partial overcoming of the limitations due to 62
85 Part 2 : Mid-Infrared Supercontinuum Generation In As 2 S 3 Microstructured Optical Fibers Introduction multiphonon absorption edge has been demonstrated in tellurite [12-15] and fluoride fibres [26] using short lengths of fibre and high pump power. Chalcogenide glasses (ChGs) stand out as the only family of vitreous materials that are widely transparent across the infrared on both, bulk and fiber forms [27]. Moreover, ChGs exhibit relatively high linear refractive index (n 0 ) giving rises to highest nonlinear refractive index (n 2 ) of glass systems. According to glass composition, it might be 1000 times higher than silica [10, 11]. Although ChG fibers were first demonstrated decades ago, and have since found uses in a wide range of linear and nonlinear infrared applications [28-30], the first guiding ChG PCFs were reported in 2006 [31]. This delay was in large part due to several limitations, in particular their high normal group velocity dispersion (GVD) [11], since their material's zero dispersion wavelength (ZDW) is located far in the MIR, above 5µm [11]. In some applications such as supercontinuum generation, the GVD sign and magnitude play a crucial role, and hence must be precisely controlled [7]. In order to overcome these limitations in ChGs and allow broad spectrum spanning, novel approaches and fiber designs are proposed. Among the various proposed strategies, microstructured fibers [32-34] have shown promising potentials and results. One of the attractive features of microstructured fibers is their greater tolerance in tailoring various fiber properties. The main advantage of microstructured fibers is that they enable GVD engineering in order to compensate the material-gvd [16, 35]. Adopting adequate microstructured pattern allows to adapt the ZDW to suitable pump wavelength and to reduce the effective mode area, enhancing consequently the nonlinear interaction for efficient SCG [11, 16, 36]. In addition, because suspended-core microstructured fiber can be made from a single material, it is possible to eliminate the problems potentially caused by the core-cladding interface of two different glasses. As 2 S 3 -based chalcogenide glass fibers are highly suitable for the purpose aimed from this work. Although other chalcogenide-based system can be used as long as it is highly nonlinear and meets other prerequisites, it has been determined that As 2 S 3 -system is the composition of choice for purposes herein. As 2 S 3 glass has linear refractive index n 0 of 2.44 at 1.55 µm, nonlinear refractive index n times higher than silica, around 594x10-20 m 2 /W [11], material ZDW around 5 µm, and the fibre MIR transmission edge is located at 7.4 µm [11]. 63
86 Part 2 : Mid-Infrared Supercontinuum Generation In As 2 S 3 Microstructured Optical Fibers Introduction However, in order to achieve efficient supercontinuum generation, a number of conditions must be met, as among the others: sufficiently high power density within the waveguide, and low optical losses, typically less than 1 db/m. To harness the intrinsic As 2 S 3 glass and respond the need for efficient SC generation, low loss microstructured glasses fibers are elaborated. Adequate microstructure pattern are adopted to manage the modal dispersion of the fiber device. The MOFs are conceived to shift their corresponding ZDW to the µm range, which correspond to the maximum emission range of the pump source, systematically used for non-linear experiment in this work. This source consists in an optical parametric oscillator (OPO) pumped by a Ti:Sapphire laser, and tunable from 1.7 to 2.55 µm, available with our colleagues from TTI, in Japan. In this part, we present some of the nonlinear optics experiments we have conducted during this PhD period. More specifically, each following article of this part is dedicated to address one particular challenge or present one major improvement we have achieved in developing the mid-ir SC light source in As 2 S 3 MOFs. In Article 1, we describe a mid-ir supercontinuum generation in low loss As 2 S 3 suspendedcore microstructured optical fibers as well as in tellurite fibers. Sulfide ones are to be considered in the framework of this work. The continuum spreads over 2000 nm, from 1.2 µm up to 3.2 µm. The fiber specimen was pumped close to the zero-dispersion wavelength in the femtosecond regime by means of an optical parametric oscillator pumped by a Ti: Sapphire laser. In addition, we report comprehensive numerical simulations to assign the nonlinear effects responsible for the above spectral spanning, as to define the limitations of further MIR expansion of the spectrum long wavelength edge. We presumed aging phenomenon that prevent to fit the experimental results with theoretical ones. In Article 2, we demonstrate an enhanced and flat 3500 nm SC spanning in As 2 S 3 MOF subjected to protection procedures from the presumed aging phenomenon previously described in Article 1. A preventive storage strategy is used to control the surrounding atmosphere at which the chalcogenide MOFs are exposed prior to nonlinear optics (NLO) experiments. The MOF is pumped in the anomalous dispersion regime close to its zerodispersion, using the same pump source and quite similar seed energy (~1nJ/pulse) as in Article 1. As 2 S 3 fibers with comparable geometric design and optical loss level as described in 64
87 Part 2 : Mid-Infrared Supercontinuum Generation In As 2 S 3 Microstructured Optical Fibers Introduction Article 1 are used in the experiments. The SC spectrum extends into the mid-ir from ~0.6 μm to beyond 4.0 μm, which is consistent with the extrinsic SH absorption band located at 4.0 µm. In Article 3, we report a detailed theoretical study of fiber aging impact on the spectrum broadening, especially the position of MidIR SC edge. The later study relies on numerical simulations based on the generalized nonlinear Schrödinger equation. It is confirmed by the obtained good agreement with the experimental results reported in article 1. A general overview on the extinction of the transmission spectrum, the evolution of surface roughness, and the change in chemical composition of microstructured fiber due to aging processes are also briefed in this paper. 65

88 Part 2 : Mid-Infrared Supercontinuum Generation In As 2 S 3 Microstructured Optical Fibers Glass Synthesis, Preform fabrication and Fiber drawing II. Glass Synthesis, Preform fabrication and Fiber drawing As preamble to the articles, the experimental part concerning As 2 S 3 glass preparation and optical fibers drawing used for this study is presented. II.1 Synthesis of bulk. The As 2 S 3 glasses were prepared by the conventional melt-quenching technique inside a vacuum-sealed silica ampoule in order to maintain the composition's stoichiometric since the sulfur exhibit high volatility at the synthesis temperature. In addition, as for all the chalcogenide glasses, syntheses are performed under secondary vacuum in order to avoid the pollution by the water and oxygen naturally present in atmosphere. The experimental system designed in this context is described in Figure 24. It comprises a turbo molecular pumping group providing a high vacuum around 10-6 mbar, liquid nitrogen trap and silica glassware. Prior to each experiment, the inner surface of the glassware is cleaned by sequential washing by hydrofluoric acid and de-ionized water, before being connected to the vacuum system to be well dried at room temperature. The objective of this treatment is to eliminate loosely held SiO 2 particles on the inner tube surface which may cause scattering losses, causing a high attenuation of the transmission in the short wavelength range. The glassware is made from high-purity Silica, (Ilmasil), with OH content below 5 ppm. The nitrogen trap allows to protect the pump by trapping any volatile species coming from the starting products. Arsenic Volatile compounds trap Furnace Vacuum system Sulfur Figure 24: Glass synthesis set-up 66

89 Part 2 : Mid-Infrared Supercontinuum Generation In As 2 S 3 Microstructured Optical Fibers Glass Synthesis, Preform fabrication and Fiber drawing Vacuum pump Arsenic Trap Heater Liquid nitrogen Sulfur Synthesis ampoule Figure 25: Schematic illustration of the synthesis set-up. Inset a photo of the capillary container. The sulfur is introduced into the container comprising a small capillary (Figure 25 and Figure 26) while arsenic is placed in the second ampoule (Figure 24 and Figure 25). High purity elemental arsenic and sulfur (5N) reagents used in these experiments were of analytical grade purity. The quoted purity levels are based on the metallic content only. In this figure, content of oxygen, hydrogen, carbon and surface deposits are not taken into account. Since the purpose of this job is to fabricate a high purity glasses, the starting products are purified by thermal treatment from their respective impurities under a dynamic vacuum (10-6 mbar). After that the necessary vacuum (10-6 mbar) is established, the charges are separately purified by thermal treatment. The purification of arsenic consists in heating ampoule with charge at 290 C for several hours in order to remove volatile inclusions such as moisture, oxides and gases adsorbed by charge materials. Heating temperature correspond to the arsenic oxide sublimation point (T sub =290 C) [37], thereby removing As 2 O 3 and As 2 O 5 from the surface. On the other hand, purification of sulfur consists in heating in a dynamic vacuum to its melting point (T f =120 C). The evaporated sulfur condenses on the walls of the silica glassware locally cooled using a cooler (Figure 26-1), while the most volatile impurities such 67
90 Part 2 : Mid-Infrared Supercontinuum Generation In As 2 S 3 Microstructured Optical Fibers Glass Synthesis, Preform fabrication and Fiber drawing as water are removed by the pumping system. Once all of the sulfur is condensed in the upper part of the glassware, they are melted down to be collected in their original container (Figure 26-2). This corresponds to a cycle of distillation of sulfur. We can then continue to perform multiple distillations in order to remove every time the persistent residual impurities. Figure 26 presents the sequence followed in this job. At the end of this step, the arsenic is transferred into the ampoule containing the sulfur, the set-up is then sealed at the point #1 (Figure 26-2), and fed into a furnace for mixture purification under statistic vacuum (Figure 27). Distillation was performed by heating the upper portion of the tube to 480 C and the lower portion was kept at room temperature. At these temperatures, the As and S were volatilized in the upper portion and condensed in the lower portion over a period between 16 and 24 h. This allows us to isolate carbon and nonvolatile impurities in the upper portion of the tube. Corresponding temperature profile is shown on Figure 28. Dynamic distillation sequence Heater Sulfur Cooler #1 Sulfur evaporation #2 Collection of sulfur melt Figure 26: Sulfur multi-distillation process. 68


91
92 Part 2 : Mid-Infrared Supercontinuum Generation In As 2 S 3 Microstructured Optical Fibers Glass Synthesis, Preform fabrication and Fiber drawing The synthesis process is carried out in special rotating electric furnace. The melt is held at 700 C for several hours, until glass-forming comes to the end. Glass homogenizing is carried out by rotating the furnace about the minor axis. After the last mixing, the furnace is placed vertically, cooled down, and maintained at 525 C for several minutes, it leads to increase glass viscosity and reduce the steam above the melt. At this point, the melt is quenched in water at room temperature to solidify the liquid in the vitreous state. The time-temperature schedule adopted during the synthesis process is presented on Figure 28. Mechanical stress in the amorphous medium makes it mechanically fragile. Thus, thermal treatment at adequate point around (210 C) glass transition temperature is necessary for stress relieving. Corresponding time-temperature regime is shown in Figure 28. II.2 Preform elaboration. The stack and draw technique is the most commonly used to fabricate most of the microstructured optical fibers. It is based on stacking of fiber capillaries and it is systematically used to fabricate silica-based microstructured fibers. However, the use of materials of lower glass transition temperature (Tg) such as heavy metal oxides and polymers enables the use of other techniques such as extrusion and drilling. In the frame of our work, the mechanical drilling technique was used for the preparation of glass preforms with a variety of geometrical patterns in view of MOFs drawing. This technique was previously developed on chalcogenide glasses in our laboratory [16]. It consists to drill holes in the chalcogenide glass rod. The position of the holes as well as the thickness of bridges between two neighboring holes are precisely controlled. This technique has allowed to prepare versatile patterned preforms [16]. Preform design adopted in this work consist in three holes placed in a triangular arrangement around a solid core. For all these preforms, the outer diameter is 16 mm, the diameter of holes is equal to 0.8 mm and their length to about 30 mm. The cross-section images of the elaborated glass preform is presented in Figure

93 Part 2 : Mid-Infrared Supercontinuum Generation In As 2 S 3 Microstructured Optical Fibers Glass Synthesis, Preform fabrication and Fiber drawing Figure 29: Cross section profile of preform design adopted in this work. II.3 Fiber drawing. The drawing of glass fibers is governed by the force of gravity or by a mechanical tension applied on a glass rod vertically suspended, and sufficiently softened to be able to drawing. Hence the need for a heat source to enable the melting and deformation of glass. Figure 30- right represents the various elements from which a drawing tower is composed. The translation system allows a continuous and controlled vertical penetration of the glass preform inside the heating zone. The furnace provides a localized and symmetric heating zone, optimal for drawing process. The inert gas is used to continuously purge the interior of the furnace. It forms a protective curtain avoiding the diffusion of the unsuitable oxidizing atmosphere inside the heating zone. The pressurized inert gas allows to avoid the collapse of the microstructure and to control the holes dimension upon drawing. The diameter and tension measurement devices allow to monitor the fiber diameter and the drawing force. Prior the heating, the furnace is purged for several hours by a flow of nitrogen (or helium), in order to remove traces of moisture present in the chamber and on the preform's surface. This flow is maintained throughout the fiber drawing process. A heating rate of 10 C / min maintained until the softening temperature of the glass (T>Tg), causes the formation of a droplet of glass at the lower end of the glass rod. Under the effect of gravity, the droplet fall downward, shrink in diameter into a fine-diameter filament and gives a glass fiber, subsequently fixed on the winding drum. A schematic illustration of this process is displayed in Figure 30-left. 71

![FRQVXPHG SUHIRUP V YROXPH LV HTXDO WR WKH YROXPH RI WKH GUDZQ ILEHU 7KH GLDPHWHU RI WKH ILEHU LV FRQWUROOHG E\ WZR SDUDPHWHUV x 7KH VSHHG RI SHQHWUDWLRQ RI WKH SUHIRUP LQVLGH WKH KHDWLQJ ]RQH E\](/docs-images/75/72114754/images/94-2.jpg "LQFUHDVLQJ WKH VSHHG RI SHQHWUDWLRQ ZH LQFUHDVH WKH DPRXQW RI PDWHULDO LQVLGH WKH IXUQDFH DQG WKXV WKH GLDPHWHU RI WKH ILEHU DQG YLFH YHUVD x 7KH ZLQGLQJ VSHHG RI WKH GUXP E\ LQFUHDVLQJ WKH VSHHG RI")
94 3DUW 0LG,QIUDUHG 6XSHUFRQWLQXXP *HQHUDWLRQ,Q $V 6 0LFURVWUXFWXUHG 2SWLFDO )LEHUV *ODVV 6\QWKHVLV 3UHIRUP IDEULFDWLRQ DQG )LEHU GUDZLQJ 7KH SDUDPHWHUV RI GUDZLQJ SURFHVV FRUH DQG ILEHU GLDPHWHU GUXP VSHHG DQG SHUIRUP VSHHG ZHUH GHWHUPLQHG EHIRUH WKH H[SHULPHQWDO VWHS E\ PHDQV RI WKH GLPHQVLRQV RI WKH SUHIRUP DQG WKH GHVLUHG ILEHU 'XULQJ GUDZLQJ WKH PDVV FRQVHUYDWLRQ SULQFLSOH LV UHVSHFWHG 7KH FRQVXPHG SUHIRUP V YROXPH LV HTXDO WR WKH YROXPH RI WKH GUDZQ ILEHU 7KH GLDPHWHU RI WKH ILEHU LV FRQWUROOHG E\ WZR SDUDPHWHUV x 7KH VSHHG RI SHQHWUDWLRQ RI WKH SUHIRUP LQVLGH WKH KHDWLQJ ]RQH E\ LQFUHDVLQJ WKH VSHHG RI SHQHWUDWLRQ ZH LQFUHDVH WKH DPRXQW RI PDWHULDO LQVLGH WKH IXUQDFH DQG WKXV WKH GLDPHWHU RI WKH ILEHU DQG YLFH YHUVD x 7KH ZLQGLQJ VSHHG RI WKH GUXP E\ LQFUHDVLQJ WKH VSHHG RI URWDWLRQ RI WKH GUXP ZH GHFUHDVH WKH GLDPHWHU RI WKH ILEHU DQG YLFH YHUVD,QHUW JDV 3UHVVXUL]HG JDV 3UHIRUP $V 6 7UDQVODWLRQ V\VWHP )XUQDFH +HDWLQJ ]RQH 'LDPHWHU PHDVXUHPHQW )LEHU 89 ODPS 7HQVLRQ PHDVXUHPHQW 'URSOHW 'UXP )LJXUH *ODVV URG JHRPHWULFDO HYROXWLRQ GXULQJ GUDZLQJ SURFHVV OHIW DQG GUDZLQJ WRZHU ULJKW

95 Part 2 : Mid-Infrared Supercontinuum Generation In As 2 S 3 Microstructured Optical Fibers Glass Synthesis, Preform fabrication and Fiber drawing Following drawing process of the preform's design adopted in this work, resulting microstructured fiber consists in a triangular lattice of air holes which extend along the fiber. They surround a small central core with triangle geometry attached to robust jacket by three thin struts. Figure 31 shows the general cross section profile of the MOFs drawn from the preforms obtained using the mechanical drilling technique (Figure 29). Figure 31: Geometric profile of the chalcogenide As 2 S 3 suspended-core fiber captured by means of a scanning electron microscope drawn from the preform depicted in Figure
96 Part 2 : Mid-Infrared Supercontinuum Generation In As 2 S 3 Microstructured Optical Fibers Glass Synthesis, Preform fabrication and Fiber drawing III. References 1. R. R. Alfano, and S. L. Shapiro, "Emission in the region 4000 to 7000 Å via four-photon coupling in glass," Physical Review Letters 24, (1970). 2. C. Lin, and R. H. Stolen, "New nanosecond continuum for excited-state spectroscopy," Applied Physics Letters 28, (1976). 3. A. L. Gaeta, "Nonlinear propagation and continuum generation in microstructured optical fibers," Optics Letters 27, (2002). 4. M.-L. V. Tse, P. Horak, F. Poletti, N. G. Broderick, J. H. Price, J. R. Hayes, and D. J. Richardson, "Supercontinuum generation at 1.06 µm in holey fibers with dispersion flattened profiles," Optics Express 14, (2006). 5. B. Eggleton, C. Kerbage, P. Westbrook, R. Windeler, and A. Hale, "Microstructured optical fiber devices," Optics Express 9, (2001). 6. G. Genty, S. Coen, and J. M. Dudley, "Fiber supercontinuum sources (Invited)," Journal of the Optical Society of America B 24, (2007). 7. J. M. Dudley, and J. R. Taylor, Supercontinuum Generation in Optical Fibers (Cambridge University, 2010). 8. D. M. Brown, K. Shi, Z. Liu, and C. R. Philbrick, "Long-path supercontinuum absorption spectroscopy for measurement of atmospheric constituents," Optics Express 16, (2008). 9. L. Zhang, Q. Lin, Y. Yue, Y. Yan, R. G. Beausoleil, and A. E. Willner, "Silicon waveguide with four zero-dispersion wavelengths and its application in on-chip octavespanning supercontinuum generation," Optics Express 20, (2012). 10. R. E. Slusher, G. Lenz, J. Hodelin, J. Sanghera, L. B. Shaw, and I. D. Aggarwal, "Large Raman gain and nonlinear phase shifts in high-purity As 2 Se 3 chalcogenide fibers," Journal of the Optical Society of America B 21, (2004). 11. J. H. V. Price, T. M. Monro, H. Ebendorff-Heidepriem, F. Poletti, P. Horak, V. Finazzi, J. Y. Y. Leong, P. Petropoulos, J. C. Flanagan, G. Brambilla, F. Xian, and D. J. Richardson, "Mid-IR supercontinuum generation from nonsilica microstructured optical fibers," IEEE Journal of Selected Topics in Quantum Electronics 13, (2007). 12. V. V. R. K. Kumar, A. George, J. Knight, and P. Russell, "Tellurite photonic crystal fiber," Optics Express 11, (2003). 13. P. Domachuk, N. A. Wolchover, M. Cronin-Golomb, A. Wang, A. K. George, C. M. B. Cordeiro, J. C. Knight, and F. G. Omenetto, "Over 4000 nm bandwidth of mid-ir supercontinuum generation in sub-centimeter segments of highly nonlinear tellurite PCFs," Optics Express 16, (2008). 74
97 Part 2 : Mid-Infrared Supercontinuum Generation In As 2 S 3 Microstructured Optical Fibers Glass Synthesis, Preform fabrication and Fiber drawing 14. M. Liao, C. Chaudhari, G. Qin, X. Yan, T. Suzuki, and Y. Ohishi, "Tellurite microstructure fibers with small hexagonal core for supercontinuum generation," Optics Express 17, (2009). 15. I. Savelii, J. C. Jules, G. Gadret, B. Kibler, J. Fatome, M. El-Amraoui, N. Manikandan, X. Zheng, F. Désévédavy, J. M. Dudley, J. Troles, L. Brilland, G. Renversez, and F. Smektala, "Suspended core tellurite glass optical fibers for infrared supercontinuum generation," Optical Materials 33, (2011). 16. M. El-Amraoui, G. Gadret, J. C. Jules, J. Fatome, C. Fortier, F. Désévédavy, I. Skripatchev, Y. Messaddeq, J. Troles, L. Brilland, W. Gao, T. Suzuki, Y. Ohishi, and F. Smektala, "Microstructured chalcogenide optical fibers from As 2 S 3 glass: towards new IR broadband sources," Optics Express 18, (2010). 17. N. Granzow, S. P. Stark, M. A. Schmidt, A. S. Tverjanovich, L. Wondraczek, and P. S. J. Russell, "Supercontinuum generation in chalcogenide-silica step-index fibers," Optics Express 19, (2011). 18. D. D. Hudson, S. A. Dekker, E. C. Mägi, A. C. Judge, S. D. Jackson, E. Li, J. S. Sanghera, L. B. Shaw, I. D. Aggarwal, and B. J. Eggleton, "Octave spanning supercontinuum in an As 2 S 3 taper using ultralow pump pulse energy," Optics Letters 36, (2011). 19. M. R. Lamont, B. Luther-Davies, D.-Y. Choi, S. Madden, and B. J. Eggleton, "Supercontinuum generation in dispersion engineered highly nonlinear (γ = 10/W/m) As 2 S 3 chalcogenide planar waveguide," Optics Express 16, (2008). 20. R. Buczynski, H. T. Bookey, D. Pysz, R. Stepien, I. Kujawa, J. E. McCarthy, A. J. Waddie, A.K. Kar, and M.R. Taghizadeh, "Supercontinuum generation up to 2.5μm in photonic crystal fiber made of lead-bismuth-galate glass," Laser Physics. Letters. 7, (2010). 21. G. Qin, X. Yan, C. Kito, M. Liao, C. Chaudhari, T. Suzuki, and Y. Ohishi, "Supercontinuum generation spanning over three octaves from UV to 3.85 µm in a fluoride fiber," Optics Letters 34, (2009). 22. F. G. Omenetto, N. A. Wolchover, M. R. Wehner, M. Ross, A. Efimov, A. J. Taylor, V. V. R. K. Kumar, A. K. George, J. C. Knight, N. Y. Joly, and P. S. J. Russell, "Spectrally smooth supercontinuum from 350 nm to 3 µm in sub-centimeter lengths of soft-glass photonic crystal fibers," Optics Express 14, (2006). 23. C. Xia, M. Kumar, O. P. Kulkarni, M. N. Islam, J. F. L. Terry, M. J. Freeman, M. Poulain, and G. Mazé, "Mid-infrared supercontinuum generation to 4.5 µm in ZBLAN fluoride fibers by nanosecond diode pumping," Optics Letters 31, (2006). 75
98 Part 2 : Mid-Infrared Supercontinuum Generation In As 2 S 3 Microstructured Optical Fibers Glass Synthesis, Preform fabrication and Fiber drawing 24. C. Agger, C. Petersen, S. Dupont, H. Steffensen, J. K. Lyngsø, C. L. Thomsen, J. Thøgersen, S. R. Keiding, and O. Bang, "Supercontinuum generation in ZBLAN fibersdetailed comparison between measurement and simulation," Journal of the Optical Society of America B 29, (2012). 25. R. R. Gattass, L. Brandon Shaw, V. Q. Nguyen, P. C. Pureza, I. D. Aggarwal, and J. S. Sanghera, "All-fiber chalcogenide-based mid-infrared supercontinuum source," Optical Fiber Technology 18, (2012). 26. G. Qin, X. Yan, C. Kito, M. Liao, C. Chaudhari, T. Suzuki, and Y. Ohishi, "Ultrabroadband supercontinuum generation from ultraviolet to 6.28μm in a fluoride fiber," Applied Physics Letters 95, (2009). 27. J. A. Savage, and S. Nielsen, "Chalcogenide glasses transmitting in the infrared between 1 and 20 µm a state of the art review," Infrared Physics 5, (1965). 28. J. S. Sanghera, L. B. Shaw, and I. D. Aggarwal, "Applications of chalcogenide glass optical fibers," Comptes Rendus Chimie 5, (2002). 29. V. Ta'eed, N. J. Baker, L. Fu, K. Finsterbusch, M. R. E. Lamont, D. J. Moss, H. C. Nguyen, B. J. Eggleton, D.-Y. Choi, S. Madden, and B. Luther-Davies, "Ultrafast alloptical chalcogenide glass photonic circuits," Optics Express 15, (2007). 30. T. M. Monro, S. Warren-Smith, E. P. Schartner, A. François, S. Heng, H. Ebendorff- Heidepriem, and S. Afshar V, "Sensing with suspended-core optical fibers," Optical Fiber Technology 16, (2010). 31. L. Brilland, F. Smektala, G. Renversez, T. Chartier, J. Troles, T. Nguyen, N. Traynor, and A. Monteville, "Fabrication of complex structures of Holey Fibers in Chalcogenide glass," Optics Express 14, (2006). 32. D. Mogilevtsev, T. A. Birks, and P. S. J. Russell, "Group-velocity dispersion in photonic crystal fibers," Optics Letters 23, (1998). 33. K. Saitoh, M. Koshiba, T. Hasegawa, and E. Sasaoka, "Chromatic dispersion control in photonic crystal fibers: application to ultra-flattened dispersion," Optics Express 11, (2003). 34. W. J. Wadsworth, A. Ortigosa-Blanch, J. C. Knight, T. A. Birks, T. P. M. Man, and P. S. J. Russell, "Supercontinuum generation in photonic crystal fibers and optical fiber tapers: a novel light source," Journal of the Optical Society of America B 19, (2002). 35. M. Liao, X. Yan, G. Qin, C. Chaudhari, and O. T. S. Yasutake, "Controlling the chromatic dispersion of soft glass highly nonlinear fiber through complex microstructure," Journal of Non-Crystalline Solids 356, (2010). 76
99 Part 2 : Mid-Infrared Supercontinuum Generation In As 2 S 3 Microstructured Optical Fibers Glass Synthesis, Preform fabrication and Fiber drawing 36. C. Chaudhari, T. Suzuki, and Y. Ohishi, "Design of zero chromatic dispersion chalcogenide As 2 S 3 glass nanofibers," Journal of Lightwave Technology 27, (2009). 37. J. Douady, B. Boulanger, E. Fuchs, F. Smektala, and J. Troles, "Symmetry and phasematching properties of third-harmonic generation under the photoelastic effect in Ge-As- Se chalcogenide glasses," Journal of the Optical Society of America B 22, (2005). 77
100 78

101 Part 2 : Mid-Infrared Supercontinuum Generation In As 2 S 3 Microstructured Optical Fibers Article 1 IV. Article 1 79
102 Part 2 : Mid-Infrared Supercontinuum Generation In As 2 S 3 Microstructured Optical Fibers Article 1 Mid-infrared 2000-nm bandwidth supercontinuum generation in suspended-core microstructured Sulfide and Tellurite optical fibers I. Savelli 1,, O. Mouawad 1, J. Fatome 1,*, B. Kibler 1, F. Désévédavy 1, G. Gadret 1, J-C Jules 1, P-Y Bony 1, H. Kawashima 2, W. Gao 2, T. Kohoutek 2, T. Suzuki 2, Y. Ohishi 2, and F. Smektala 1 1 Laboratoire Interdisciplinaire Carnot de Bourgogne (ICB), UMR 6303 CNRS - Université de Bourgogne, 9 Av. Alain Savary, BP47870, Dijon, France 2 Research Center for Advanced Photon Technology, Toyota Technological Institute , Abstract Hisakata, Tempaku, Nagoya , Japan Corresponding author: jfatome@u-bourgogne.fr In this work, we report the experimental observation of supercontinua generation in two kinds of suspended-core microstructured soft-glass optical fibers. Low loss, highly nonlinear, tellurite and As 2 S 3 chalcogenide fibers have been fabricated and pumped close to their zerodispersion wavelength in the femtosecond regime by means of an optical parametric oscillator pumped by a Ti:Sapphire laser. When coupled into the fibers, the femtosecond pulses result in 2000-nm bandwidth supercontinua reaching the Mid-Infrared region and extending from 750 nm to 2.8 µm in tellurite fibers and 1 µm to 3.2 µm in chalcogenide fibers, respectively Optical Society of America OCIS codes: ( ) Fiber optics, infrared; ( ) Photonic crystal fibers; ( ) Nonlinear optics, fibers; ( ) Nonlinear optical materials; ( ) Glass and other amorphous materials; ( ) Fiber design and fabrication; ( ) Fiber characterization. 1. Introduction Because of combined properties of high coherence, large bandwidth, brightness and potential compactness, supercontinuum generation has been a topic of high interest in nonlinear optics. 80
103 Part 2 : Mid-Infrared Supercontinuum Generation In As 2 S 3 Microstructured Optical Fibers Article 1 Indeed, broadband light sources have found many applications in the field of spectroscopy, metrology, telecommunication or biology. To this aim, numerous efforts have been first dedicated to investigate supercontinuum generation in fused silica fibers with record brightness and spectral expansion ranging from ultraviolet (UV) to mid-infrared (MIR) [1-8]. However, since intrinsic transmission window of fused silica makes supercontinuum expansion a challenging task above 2.2 µm [9, 10], the recent trend is thus to provide alternative materials so as to spread further in the MIR region [11-26]. In this context, larger transmission windows and stronger nonlinear materials have been proposed as an alternative to the conventional fused silica such as tellurite [11-14], chalcogenide [15-20], heavy oxides [21, 22] or fluoride glasses [23-26]. Tellurite and chalcogenide glasses have serious advantages because of their wide transmittance window, chemical durability and high nonlinearity. Depending on their composition, infrared transparency can exceed 10 µm while the Kerr nonlinearity can be 500 times stronger than fused silica [27]. These different features make them serious candidates for broad mid-infrared supercontinuum generation. For example, supercontinuum as broad as 4000-nm bandwidth has been generated in a sub-cm long Tellurite microstructured fiber by Domachuk et al. in Ref. [12] thanks to a femtosecond pulse pumping at telecommunication wavelength. Regarding chalcogenide fibers, pumping in the anomalous dispersive regime is a much challenging task since the chromatic dispersion contribution of the material generally induces a zero dispersion wavelength far in the infrared region (typically around 5 µm) and thus far from commercially available femtosecond pulse sources. Consequently, a careful design of the waveguide structure has to be performed so as to shift down the zero dispersion wavelength (ZDW) and thus allowing an anomalous dispersion pumping. To this aim, several strategies have been considered such as waveguide fabrication, tapering, nanowire and microstructured optical fibers, which give rise to efficient spectral broadening and supercontinuum generation [19, 20, 27-30]. In this work, we report the experimental fabrication and characterization of two kinds of soft-glasses, low loss, suspended-core microstructured optical fibers. More precisely, both tellurite and As 2 S 3 chalcogenide suspended-core fibers with nearly 3-µm core diameter have been designed and pumped in their anomalous dispersion regime by means of an optical parametric oscillator delivering 200-fs pulses between 1700 and 2500 nm. When coupled into the fibers, the nj- 81
104 Part 2 : Mid-Infrared Supercontinuum Generation In As 2 S 3 Microstructured Optical Fibers Article 1 level femtosecond pulses result in 2000-nm bandwidth supercontinuum spreading in the midinfrared region until 2.8 µm in Tellurite fiber and 3.2 µm in chalcogenide fiber. 2. Tellurite fiber design The fiber preform is first elaborated from a tellurite 80TeO 2-10ZnO-10Na 2 O glass (mol. %) synthesized by the fusion method under oxidizing atmosphere. High-purity, commercial raw materials are used for the glass fabrication without any additional purification: tellurium (IV) oxide (Alfa Aesar, %), zinc oxide (Alfa Aesar, %) and sodium carbonate (Alfa Aesar, %). The oxide mixture is melted in a platinum crucible at a temperature of C between 1h and 2h. The resulting melt is then poured in a brass mould preheated at 270 C. The annealing of the glass sample is finally completed around its transition temperature (Tg = 285 C) during several hours before being slowly cooled down to room temperature. The resulting glass rod is thus characterized by a typical length of 4.5 cm and a round diameter of 16 mm. The preform elaboration is achieved by means of a mechanical drilling process, which ensures better loss performances than the traditional time-consuming, numerous handy manipulations stack-and-draw technique [16, 31]. The resulting preform consists in a triangular solid core surrounded by three holes of typically 0.8-mm diameter and 30-mm length. In a final stage, the preform is then drawn to fiber under a helium atmosphere. Indeed, from glass classical DSC measurements at a heating rate of 10 C/min between room temperature and 400 C, no exothermic crystallization peak is registered. Thus, the temperature difference between Tg and crystallization temperature is higher than 115 C, making indeed the glass suitable for fiber drawing which is performed around 360 C. The transmittance of the bulk was first measured using a FTIR Fourier Transform InfraRed spectrometer (Perkin Elmer Spectrum One) on a 4-mm thick rod sample for two casting processes, more precisely under room atmosphere conditions and under dry atmosphere in a glove box. Figure 32 shows typical transmittance spectra recorded in the range of nm. 82
105 Part 2 : Mid-Infrared Supercontinuum Generation In As 2 S 3 Microstructured Optical Fibers Article 1 Figure 32: Transmittance of the tellurite bulk as a function of wavelength measured on a 4- mm thick sample. Glass casted under room atmosphere (red solid line), glass casted under dry atmosphere in a glove box (blue solid line). The crucial point here is the residual OH absorption which induces excess of losses. Indeed, the tellurite glasses, as all oxide glasses, are known to suffer from a strong water absorption in the infrared range that decreases the glass transmission [31-33]. In the case of the glass elaborated under air atmosphere (red line in Figure 32), we can clearly observe two main OH bands: strongly bonded OH (strong OH) and weakly bonded OH (weak OH) combined with free OH. This OH pollution is mainly due to reaction between the atmospheric moisture and the glass batch during glass synthesis. The central positions of these bands depend on the degree of OH hydrogen bonding (H-bonding) present in the glass [34]. The strongly bonded OH absorb around 4350 nm, while the combination of weakly H-bonded OH and free OH in the glass provides a huge 1-µm bandwidth absorption band located around 3350 nm, which results in a poor 15% transmission at 3.3 µm and thus preventing any practical application beyond 3 µm. In order to overcome this issue, we have completed the glass fabrication process under a dry atmosphere inside a glove box. Resulting transmission spectrum is then depicted in Figure 32 thanks to the blue solid line. We can notice a high flatness of the transmittance level around 76% until 2.8 µm as well as a significant reduction of the OH absorption band around 3.3 µm, for which transmittance is greatly improved from 15% to 70%. 83
106 Part 2 : Mid-Infrared Supercontinuum Generation In As 2 S 3 Microstructured Optical Fibers Article 1 More precisely, the concentration of OH-groups can be estimated by means of the following equation [35]: N OH N A 1 ln( ) (25) L T where N A is the Avogadro constant, L the sample thickness (cm), T the transmittance, and ε the molar absorption of the free OH groups in the glass. In the calculations we use the molar absorption of the OH groups in silicate glasses (49.1x10 3 cm 2 /mol) [36]. Then the amount of OH-groups can be presented in parts per million (ppm) [37]. After calculations, we found that the glass fabrication under dry atmosphere allows us to reduce the OH-ions concentration by a factor 36: 510 ppm under air atmosphere vs 14 ppm in the glove box. In this latter case the origin of the remaining OH-groups is attributed to the initial pollution of the raw materials. After drawing process, we obtained the fiber profile illustrated in Figure 33 (a) captured by means of a scanning electron microscope (SEM). The resulting tellurite fiber is characterized by a 120-µm outside diameter with a typical suspended-core shape consisting in a triangular 3.4-µm solid core surrounded by three petal-like holes with 1 µm thickness bridges. Because of the critical small size of the microstructured fiber core, a measurement of fiber spectral losses could only be successfully performed on a large core quasi mono-index profile fiber, which is drawn just before the microstructured fiber itself, in the early stage of the drawing process, when the holes of the microstructure are not yet under pressure. It is thus possible to correctly inject the light coming from a Fourier Transformed InfraRed (FTIR) spectrometer in this large core fiber. The cut-back technique is implemented for that purpose. Typically, cut back measurements are performed on 5 meters of fiber, with around 20% accuracy, attributed to variations of the fibre cross section when cutting the fiber. Note additionally that fiber losses were also measured punctually at 1.55 µm for the small-core microstructured fiber itself, at a level of 1.5 db/m, thus corroborating previous results on quasi mono-index one. Spectral fiber losses are nearly flat up to 2.5 µm but increase rapidly beyond 2.7 µm. This flatness was also confirmed experimentally by the resulting supercontinuum spectrum obtained in section 5. It is also important to notice here that, even if we achieved a strong reduction of the residual OH absorption in the bulk glass, the cumulative effect of these linear losses in the fiber remain dramatic for practical application above 2.8 µm. This point 84
 Profile of the tellurite fiber captured by means of a scanning electron microscope.")
107 Part 2 : Mid-Infrared Supercontinuum Generation In As 2 S 3 Microstructured Optical Fibers Article 1 underlines the fact that an order of magnitude improvement is still required regarding the OHgroups concentration, so as to achieve a concentration below 1 ppm. Figure 33: (a) Profile of the tellurite fiber captured by means of a scanning electron microscope. (b) Fiber losses as a function of wavelength measured on a quasi mono-index fiber. Group velocity dispersion of the tellurite fiber has been also measured thanks to the wellknown low coherence interferometric method, which has been proved to be convenient to characterize short segments of optical fibers [27]. Experimental results are compared to numerical simulations of modal properties based on the fiber geometry derived from the SEM analysis (see Figure 34). The good agreement confirms that our fiber exhibits a zerodispersion wavelength (ZDW) close to 1660 nm while the bulk glass is characterized by a ZDW close to 2.2 µm. The suspended core profile has then successfully allowed us to manage with the chromatic dispersion and to shift the ZDW to shorter values more suitable for SC generation. Figure 34: Chromatic dispersion curve of the suspended-core tellurite fiber. Circle: experimental data, solid-line: numerical modeling. 85
108 Part 2 : Mid-Infrared Supercontinuum Generation In As 2 S 3 Microstructured Optical Fibers Article 1 3. As 2 S 3 chalcogenide fiber design For sulfide fibers, first of all, the As 2 S 3 glass is prepared from elemental high-purity 5N starting products: arsenic and sulphur. However, initial sulphur is generally polluted by water and carbon, while the metallic arsenic surface is often polluted by As oxide [38]. Thus, the starting products have to be purified from their respective impurities by thermal treatment under a dynamic vacuum (10-6 mbar). Sulphur and arsenic are thus dried by heating for a few hours at respectively 120 C and 290 C [39]. Arsenic is then mixed with sulphur and the batch is sealed under vacuum in a silica setup. A static distillation is performed which allows the separation of carbon while the mixture is collected in a silica ampoule. Finally, the silica ampoule is sealed under vacuum, placed in a rocking furnace and heated up to 700 C at a slow heating rate (1 2 C min -1 ). The heating treatment allows the fusion and the reaction of the starting products. Obtained liquid batch is refined at high temperature for 10 to 12 hours. The melt is then quenched at room temperature. Resulting solid glass rod is then annealed at its glass transition temperature Tg (Tg 200 C) for 12 hours and slowly cooled down to room temperature. A thick glass rod (7-cm long, 16-mm in diameter) is finally obtained at the end of this stage. As in the previous case of tellurite glass, DSC measurements at a heating rate of 10 C/min between room temperature and 400 C do not exhibit any exothermic crystallization peak so that the glass can be drawn into fiber at a temperature around 270 C, at which no re-crystallization phenomenon takes place. The technique used to elaborate the chalcogenide microstructured optical fiber was the same as the previous tellurite one. The elaboration of the preform was based on a mechanical machining of the rod. Our process presents the originality to be performed entirely mechanically with the help of mechanical tools only and without the need of any ultrasonic assistance. This mechanical drilling process has been largely used in order to prepare a variety of geometric profiles and to control the positions and diameters of the holes, inner surfaces and core surfaces by optimization of the drilling conditions [16, 39, 40]. We designed a preform with three holes of typically 0.8 mm diameter and 30 mm length placed in a triangular arrangement around a solid core. Such a preform was then drawn into fiber in our laboratory under optimized conditions, leading to a 3.2-µm suspended-core fiber with 0.6 µm thickness bridges, which transversal section can be observed in Figure 35(a). More precisely, 86

109 Part 2 : Mid-Infrared Supercontinuum Generation In As 2 S 3 Microstructured Optical Fibers Article 1 the drawing process has been performed in an inert and dry atmosphere, at a temperature of 270 C and at a drawing speed of 5 meters/min. a Losses (db/m) Fiber without pressure Single index fiber (b) 0 1,0 1,5 2,0 2,5 3,0 3,5 4,0 4,5 Wavelength (µm) Figure 35: (a) Profile of the chalcogenide As 2 S 3 suspended-core fiber captured by means of a scanning electron microscope (b) Fiber losses of the quasi mono-index chalcogenide fiber as a function of wavelength (solid-line) and losses of the suspended core fiber measured at fixed wavelengths 1.06 and 1.55 µm (Triangles). As in the previous study on tellurite fibers, linear losses were first characterized on the predrawing mono-index chalcogenide fiber sample by means of the FTIR spectrometer. Experimental data are depicted in Figure 35 (b) in the range of 1 to 4.5 µm (blue solid-line). Experimental measurements show relatively flat spectral losses in the range from 1.5 to 2.5 µm with a minimum below 1 db/m around the pump wavelength at 2.3 µm. The attenuation curve obtained for this glass (Figure 35 (b)) shows that the material losses contribution is quite similar to our previous results in [16] and [39]. We can also see narrow and large extrinsic absorption bands, centered at characteristic wavelengths which corresponds to residual OH and SH pollution of the glass. SH concentration ( 2.5 ppm) can be estimated from the spectrum referring to [41] for which extinction coefficient associated to the SH vibration at 4 µm is 2.5 db/m/ppm. Finally, note that results of Figure 35(b) are well confirmed by loss measurements in the suspended-core fiber at fixed wavelengths (1.06 and 1.55 µm, see Triangles in Figure 35 (b)), using a corresponding fixed wavelength laser source and the cut-back technique. As in the previous study on tellurite fibers described above, group velocity dispersion of the chalcogenide suspended-core fiber has been also characterized using the same interferometric 87
110 Part 2 : Mid-Infrared Supercontinuum Generation In As 2 S 3 Microstructured Optical Fibers Article 1 set-up [27]. Experimental results are depicted in Figure 36 and compared to numerical analysis of the modal properties. We clearly reveal a zero-dispersion wavelength close to 2330 nm, which has to be compared to the ZDW of the bulky sulfide glass located around 5 µm. 0,6 1,2 1,8 2,4 3,0 3,6 Chromatic Dispersion [ps/nm,km] 0 Pump Modeling Measurements Wavelength [nm] Figure 36: Chromatic dispersion curve of the suspended-core chalcogenide fiber. Circle: experimental data, solid-line: numerical modeling. 4. Experimental set-up The experimental set-up depicted in Figure 37 consists in an optical parametric oscillator (OPO) pumped by a Ti:Sapphire laser. The OPO delivers 200-fs pulses at a repetition rate of 80 MHz with an average power close to 450 mw. The idler output, tunable from 1.7 to 2.6 µm was used to pump both tellurite and chalcogenide fibers under test in the anomalous dispersion regime and close to their ZDW in order to efficiently generate supercontinua [6]. Fibers are cleaved by means of a scalpel blade and quality of the interfaces is carefully checked under microscope before mounting the sample onto a 3-axis holder. Pulses are then focused into the fiber under test by means of a 20X microscope objective. At the output of the fiber, resulting supercontinuum is collected by a fluoride ZBLAN fiber and spectrally characterized by means of either two Yokogawa optical spectrum analyzers covering 350 to 1200 nm and 1200 to 2400 nm respectively or a FTIR spectrometer in the range of 2400 to 4000 nm. 88

111

112 Part 2 : Mid-Infrared Supercontinuum Generation In As 2 S 3 Microstructured Optical Fibers Article 1 together with the group index curve obtained numerically for the fundamental mode. We clearly join the points on either edge by straight lines, thus confirming both the concept of group-index matching as well as chromatic dispersion modeling and measurements on the whole span of wavelengths. Moreover, this physical process allowed us to efficiently optimize the experimental supercontinuum generation in the tellurite fiber without any need to continuously monitor the resulting spectrum on the whole wavelength range but just by focusing on the shortest wavelength spreading. Figure 38: (a) Experimental recording of supercontinua generation in a 40-cm long suspended-core Tellurite fiber as a function of pump power. (b) Corresponding numerical simulations. Figure 38 (b) presents the numerical simulation corresponding to these experimental data and obtained through the split-step Fourier-based solving of the generalized nonlinear Schrödinger equation [6] taking into account the full dispersion curve from Figure 34, measured fiber losses as well as self-steepening and analytical model of the Raman gain spectrum [42-44]. The numerical results fit quite well the dynamics observed in the experiments and confirm that the spectral broadening is not mainly limited by the intrinsic linear losses for the optimized power and fiber length used here. However we cannot extend the supercontinuum bandwidth in the mid-infrared region with a longer fiber due to the residual OH absorption which, even if it has been greatly reduced in the fabrication process under dry atmosphere, still prevents some application beyond 3 µm. 90
113 Part 2 : Mid-Infrared Supercontinuum Generation In As 2 S 3 Microstructured Optical Fibers Article 1 Figure 39: Modeled group index curve as a function of wavelength for the suspended-core tellurite fiber (red solid line) as well as experimental short and long wavelength edges of resulting supercontinua as a function of average power (circles) Sulfide fiber supercontinuum Figure 40 (a) illustrates the experimental results obtained from a 45-mm-long segment of our suspended-core chalcogenide fiber. Figure 40 (a) shows the resulting supercontinuum for a pump wavelength of 2300 nm and an injected power of 70 mw (4.6 kw peak power). Here, the output power is ~70% of the input power. The nonlinear index of the material is n 2 ~ 2.8x10⁻¹⁸ m 2 /W at 1550 nm [45], which gives a nonlinear Kerr coefficient = 1175 W -1 /km -1 (the effective mode area is 6.5 µm 2 ). The injected pulse corresponds to a high soliton number N=84 and a pulse energy of 0.9 nj. The chalcogenide fiber is here clearly pumped close to the zero-dispersion wavelength, in the anomalous dispersion regime, and is characterized by a strong and rapid self-phase modulation process followed by soliton fission in the earlier centimeters of fiber. In this case the fission occurs randomly due to the significant role of modulation instability when N >> 20 [6]. Subsequent propagation is then associated with a degradation of the coherence. The resulting supercontinuum extends from 1200 nm to 3200 nm in the -20 db range (excluding the absorption peak at 2.9 µm). Note however that large residual OH absorption bands are clearly visible around 2.9 µm, which implies to work with only short fiber lengths. This point underlines the fact that OH and SH absorption bands characterized on the pre-drawing mono-index fiber and depicted in Figure 35 (b) are undervalued by this measurement method and that the drawing process as well as resulting 91
114 Part 2 : Mid-Infrared Supercontinuum Generation In As 2 S 3 Microstructured Optical Fibers Article 1 OH induced absorption time deterioration of the microstructure dramatically increased these extrinsic absorption losses. Nevertheless, the resulting spectrum also indicates that supercontinuum extension is performed in the early millimeters of the fiber, allowing the solitons to shift out the spectrum above the absorption band. Figure 40 (b) represents the numerical simulations corresponding to these experimental results. Thanks to a careful modeling of transmission losses and Raman gain [46] and using the full dispersion curve from Figure 36, we have obtained a good agreement which confirms our experimental observations. However, in order to better fit the experimental data, particularly the SH and OH absorption bands, extra losses have to be taken into account around 2.9 µm and 4 µm, which confirms the under-evaluation of these absorption bands measured in Figure 35 (b) and an ageing of our non coated fibers under room atmosphere. This point is actually under study. Nevertheless, numerical simulations depicted in Figure 40 (c) and neglecting extra losses of absorption peaks reveal that the dynamic of supercontinuum generation could be extended until 5.5 µm, thus confirming the dramatic limitation imposed by OH- and SH-groups induced extra losses. (a) Exp Spectrum [20 db/div] (b) Sim (c) Wavelength (µm) Figure 40: (a) Experimental recording of supercontinuum generation in a 45-mm long sample of suspended-core chalcogenide fiber for a pump power of 70 mw (b) Corresponding numerical simulations (c) Corresponding numerical simulations without OH group absorption peaks. 92
115 Part 2 : Mid-Infrared Supercontinuum Generation In As 2 S 3 Microstructured Optical Fibers Article 1 6. Conclusion In summary, we report here the experimental generation of supercontinuum in two kinds of suspended-core microstructured soft-glass optical fibers, namely tellurite and sulfide fibers. Thanks to an optical parametric oscillator pumped by a Ti:Sapphire laser and delivering 200- fs pulses between 1700 and 2500 nm, we achieved efficient pumping of both fibers above their respective zero-dispersion wavelength in the anomalous dispersion regime. When coupled into the fibers, the femtosecond pulses result in 2000-nm bandwidth supercontinua reaching the mid-infrared region and extending from 750 nm to 2.8 µm in tellurite fibers and 1 µm to 3.2 µm in sulfide fibers for input pulse energy of ~1 nj, respectively. Acknowledgements We acknowledge the financial support from the French Agence Nationale de la Recherche project ANR CONFIAN, Hubert Curien Sakura Egide program, the CNRS and the Conseil Régional de Bourgogne, Photcom PARI program. 93
116 Part 2 : Mid-Infrared Supercontinuum Generation In As 2 S 3 Microstructured Optical Fibers References-Article 1 7. References 1. T. A. Birks, W. J. Wadsworth, and P. S. J. Russell, "Supercontinuum generation in tapered fibers," Optics Letters 25, (2000). 2. J. K. Ranka, R. S. Windeler, and A. J. Stentz, "Visible continuum generation in air-silica microstructure optical fibers with anomalous dispersion at 800 nm," Optics Letters 25, (2000). 3. A. L. Gaeta, "Nonlinear propagation and continuum generation in microstructured optical fibers," Optics Letters 27, (2002). 4. P. S. J. Russell, "Photonic crystal fibers," Science 299, (2003). 5. J. C. Knight, "Photonic crystal fibres," Nature 424, , (2003). 6. J. M. Dudley, G. Genty, and S. Coen, "Supercontinuum generation in photonic crystal fiber," Reviews of Modern Physics 78, (2006). 7. J. M. Stone, and J. C. Knight, "From zero dispersion to group index matching: How tapering fibers offers the best of both worlds for visible supercontinuum generation," Optical Fiber Technology 18, (2012). 8. T. Sylvestre, A. R. Ragueh, M. W. Lee, B. Stiller, G. Fanjoux, B. Barviau, A. Mussot, and A. Kudlinski, "Black-light continuum generation in a silica-core photonic crystal fiber," Optics Letters 37, (2012). 9. C. Xia, M. Kumar, M.-Y. Cheng, O. P. Kulkarni, M. N. Islam, A. Galvanauskas, F. L. Terry, M. J. Freeman, D. A. Nolan, and W. A. Wood, "Supercontinuum generation in silica fibers by amplified nanosecond laser diode pulses," IEEE Journal of Selected Topics in Quantum Electronics 13, (2007). 10. J. Fatome, B. Kibler, M. El-Amraoui, J. C. Jules, G. Gadret, F. Desevedavy, and F. Smektala, "Mid-infrared extension of supercontinuum in chalcogenide suspended core fibre through soliton gas pumping," Electronics Letters 47, (2011). 11. V. V. R. K. Kumar, A. George, J. Knight, and P. Russell, "Tellurite photonic crystal fiber," Optics Express 11, (2003). 12. P. Domachuk, N. A. Wolchover, M. Cronin-Golomb, A. Wang, A. K. George, C. M. B. Cordeiro, J. C. Knight, and F. G. Omenetto, "Over 4000 nm bandwidth of mid-ir supercontinuum generation in sub-centimeter segments of highly nonlinear tellurite PCFs," Optics Express 16, (2008). 13. M. Liao, C. Chaudhari, G. Qin, X. Yan, T. Suzuki, and Y. Ohishi, "Tellurite microstructure fibers with small hexagonal core for supercontinuum generation," Optics Express 17, (2009). 94
117 Part 2 : Mid-Infrared Supercontinuum Generation In As 2 S 3 Microstructured Optical Fibers References-Article I. Savelii, J. C. Jules, G. Gadret, B. Kibler, J. Fatome, M. El-Amraoui, N. Manikandan, X. Zheng, F. Désévédavy, J. M. Dudley, J. Troles, L. Brilland, G. Renversez, and F. Smektala, "Suspended core tellurite glass optical fibers for infrared supercontinuum generation," Optical Materials 33, (2011). 15. M. Liao, C. Chaudhari, G. Qin, X. Yan, C. Kito, T. Suzuki, Y. Ohishi, M. Matsumoto, and T. Misumi, "Fabrication and characterization of a chalcogenide-tellurite composite microstructure fiber with high nonlinearity," Optics Express 17, (2009). 16. M. El-Amraoui, G. Gadret, J. C. Jules, J. Fatome, C. Fortier, F. Désévédavy, I. Skripatchev, Y. Messaddeq, J. Troles, L. Brilland, W. Gao, T. Suzuki, Y. Ohishi, and F. Smektala, "Microstructured chalcogenide optical fibers from As 2 S 3 glass: towards new IR broadband sources," Optics Express 18, (2010). 17. J. Hu, C. R. Menyuk, L. B. Shaw, J. S. Sanghera, and I. D. Aggarwal, "Computational study of 3-5 µm source created by using supercontinuum generation in As 2 S 3 chalcogenide fibers with a pump at 2 µm," Optics Letters 35, (2010). 18. N. Granzow, S. P. Stark, M. A. Schmidt, A. S. Tverjanovich, L. Wondraczek, and P. S. J. Russell, "Supercontinuum generation in chalcogenide-silica step-index fibers," Optics Express 19, (2011). 19. D. D. Hudson, S. A. Dekker, E. C. Mägi, A. C. Judge, S. D. Jackson, E. Li, J. S. Sanghera, L. B. Shaw, I. D. Aggarwal, and B. J. Eggleton, "Octave spanning supercontinuum in an As 2 S 3 taper using ultralow pump pulse energy," Optics Letters 36, (2011). 20. M. R. Lamont, B. Luther-Davies, D.-Y. Choi, S. Madden, and B. J. Eggleton, "Supercontinuum generation in dispersion engineered highly nonlinear (γ = 10/W/m) As 2 S 3 chalcogenide planar waveguide," Optics Express 16, (2008). 21. J. H. V. Price, T. M. Monro, H. Ebendorff-Heidepriem, F. Poletti, P. Horak, V. Finazzi, J. Y. Y. Leong, P. Petropoulos, J. C. Flanagan, G. Brambilla, F. Xian, and D. J. Richardson, "Mid-IR supercontinuum generation from nonsilica microstructured optical fibers," IEEE Journal of Selected Topics in Quantum Electronics 13, (2007). 22. R. Buczynski, H. T. Bookey, D. Pysz, R. Stepien, I. Kujawa, J. E. McCarthy, A. J. Waddie, A.K. Kar, and M.R. Taghizadeh, "Supercontinuum generation up to 2.5μm in photonic crystal fiber made of lead-bismuth-galate glass," Laser Physics Letters 7, (2010). 23. G. Qin, X. Yan, C. Kito, M. Liao, C. Chaudhari, T. Suzuki, and Y. Ohishi, "Supercontinuum generation spanning over three octaves from UV to 3.85 µm in a fluoride fiber," Optics Letters 34, (2009). 95
118 Part 2 : Mid-Infrared Supercontinuum Generation In As 2 S 3 Microstructured Optical Fibers References-Article F. G. Omenetto, N. A. Wolchover, M. R. Wehner, M. Ross, A. Efimov, A. J. Taylor, V. V. R. K. Kumar, A. K. George, J. C. Knight, N. Y. Joly, and P. S. J. Russell, "Spectrally smooth supercontinuum from 350 nm to 3 µm in sub-centimeter lengths of soft-glass photonic crystal fibers," Optics Express 14, (2006). 25. C. Xia, M. Kumar, O. P. Kulkarni, M. N. Islam, J. F. L. Terry, M. J. Freeman, M. Poulain, and G. Mazé, "Mid-infrared supercontinuum generation to 4.5 µm in ZBLAN fluoride fibers by nanosecond diode pumping," Optics Letters 31, (2006). 26. C. Agger, C. Petersen, S. Dupont, H. Steffensen, J. K. Lyngsø, C. L. Thomsen, J. Thøgersen, S. R. Keiding, and O. Bang, "Supercontinuum generation in ZBLAN fibersdetailed comparison between measurement and simulation," Journal of the Optical Society of America B 29, (2012). 27. J. Fatome, C. Fortier, T. N. Nguyen, T. Chartier, F. Smektala, K. Messaad, B. Kibler, S. Pitois, G. Gadret, C. Finot, J. Troles, F. Desevedavy, P. Houizot, G. Renversez, L. Brilland, and N. Traynor, "Linear and nonlinear characterizations of chalcogenide photonic crystal fibers," Journal of Lightwave Technology 27, (2009). 28. J. Troles, L. Brilland, F. Smektala, P. Houizot, F. Désévédavy, Q. Coulombier, N. Traynor, T. Chartier, T. N. Nguyen, J. L. Adam, and G. Renversez, "Chalcogenide microstructured fibers for infrared systems, elaboration modelization, and characterization," Fiber and Integrated Optics 28, (2009). 29. C. Chaudhari, T. Suzuki, and Y. Ohishi, "Design of zero chromatic dispersion chalcogenide As 2 S 3 glass nanofibers," Journal of Lightwave Technology 27, (2009). 30. G. Tao, S. Shabahang, E.-H. Banaei, J. J. Kaufman, and A. F. Abouraddy, "Multimaterial preform coextrusion for robust chalcogenide optical fibers and tapers," Optics Letters 37, (2012). 31. L. Brilland, J. Troles, P. Houizot, F. Désévédavy, Q. Coulombier, G. Renversez, T. Chartier, T. N. Nguyen, J.-L. Adam, and N. Traynor, "Interfaces impact on the transmission of chalcogenides photonic crystal fibres," Journal of the Ceramic Society of Japan 116, (2008). 32. A. M. Efimov, and V. G. Pogareva, "Water-related IR absorption spectra for some phosphate and silicate glasses," Journal of Non-Crystalline Solids 275, (2000). 33. M. Churbanov, A. N. Moiseev, A. V. Chilyasov, V. V. Dorofeev, I. A. Kraev, M. M. Lipatova, T. V. Kotereva, E. M. Dianov, V. G. Plotnichenko, and E. B. kryukova, "Production of high-purity TeO 2 -ZnO and TeO 2 -WO 3 glasses with reduced content of OH groups," Journal of Optoelectronics and Advanced Materials 9, (2007). 96
119 Part 2 : Mid-Infrared Supercontinuum Generation In As 2 S 3 Microstructured Optical Fibers References-Article X. Feng, S. Tanabe, and T. Hanada, "Hydroxyl groups in erbium-doped germane-tellurite glasses," Journal of Non-Crystalline Solids 281, (2001). 35. J. Massera, A. Haldeman, J. Jackson, C. Rivero-Baleine, L. Petit, and K. Richardson, "Processing of tellurite-based glass with low OH content," Journal of the American Ceramic Society 94, (2011). 36. L. Nemec, and J. Gotz, "Infrared absorption of OH in E glass," Journal of the American Ceramic Society 53, (1970). 37. K. Chida, F. Hanawa, and M. Nakahara, "Fabrication of OH-free multimode fiber by vapor phase axial deposition," IEEE Journal of Selected Topics in Quantum Electronics 18, (1982). 38. J. Douady, B. Boulanger, E. Fuchs, F. Smektala, and J. Troles, "Symmetry and phasematching properties of third-harmonic generation under the photoelastic effect in Ge-As- Se chalcogenide glasses," Journal of the Optical Society of America B 22, (2005). 39. M. El-Amraoui, J. Fatome, J. C. Jules, B. Kibler, G. Gadret, C. Fortier, F. Smektala, I. Skripatchev, C. F. Polacchini, Y. Messaddeq, J. Troles, L. Brilland, M. Szpulak, and G. Renversez, "Strong infrared spectral broadening in low-loss As-S chalcogenide suspended core microstructured optical fibers," Optics Express 18, (2010). 40. X. Feng, A. K. Mairaj, D. W. Hewak, and T. M. Monro, "Nonsilica glasses for holey fibers," Journal of Lightwave Technology 23, 2046 (2005). 41. V. G. Borisevich, V. G. Plotnichenko, I. V. Scripachev, and M.F. Churbanov, "Extinction coefficient of SH groups in vitreous arsenic sulphide," Russian High Purity Substances Journal 4, (1990). 42. A. Lin, A. Zhang, E. J. Bushong, and J. Toulouse, "Solid-core tellurite glass fiber for infrared and nonlinear applications," Optics Express 17, (2009). 43. M. D. O'Donnell, K. Richardson, R. Stolen, C. Rivero, T. Cardinal, M. Couzi, D. Furniss, and A. B. Seddon, "Raman gain of selected tellurite glasses for IR fibre lasers calculated from spontaneous scattering spectra," Optical Materials 30, (2008). 44. X. Yan, G. Qin, M. Liao, T. Suzuki, and Y. Ohishi, "Transient Raman response and soliton self-frequency shift in tellurite microstructured fiber," Journal of Applied Physics 108, (2010). 45. V. Ta'eed, N. J. Baker, L. Fu, K. Finsterbusch, M. R. E. Lamont, D. J. Moss, H. C. Nguyen, B. J. Eggleton, D.-Y. Choi, S. Madden, and B. Luther-Davies, "Ultrafast alloptical chalcogenide glass photonic circuits," Optics Express 15, (2007). 46. R. J. Kobliska, and S. A. Solin, "Temperature dependence of the Raman spectrum and the depolarization spectrum of armophous As 2 S 3," Physical Review B 8, (1973). 97
120 98

121 Part 2: Mid-Infrared Supercontinuum Generation In As 2 S 3 Microstructured Optical Fibers V. Article 2 Article 2 Multi-octave mid-infrared supercontinuum generation in suspended-core chalcogenide fibers O. Mouawad 1, J. Picot-Clémente 1, F. Amrani 1, C. Strutynski 1, J. Fatome 1, B. Kibler 1, F. Désévédavy 1, G. Gadret 1, J-C Jules 1, D. Deng 2, Y. Ohishi 2 and F. Smektala 1,* 1 Laboratoire Interdisciplinaire Carnot de Bourgogne (ICB), UMR 6303 CNRS - Université de Bourgogne, 9 Av. Alain Savary, BP47870, Dijon, France 2 Research Center for Advanced Photon Technology, Toyota Technological Institute , Hisakata, Tempaku, Nagoya , Japan Corresponding author: frederic.smektala@u-bourgogne.fr Abstract As 2 S 3 fiber-based supercontinuum source that covers 3500 nm extending from near visible to the mid-infrared is successfully reported by using a 200-fs pulsed pump with nj-level energy at 2.5 µm. The main features of our fiber-based source are twofold. On the one hand, a low- 99
122 Part 2: Mid-Infrared Supercontinuum Generation In As 2 S 3 Microstructured Optical Fibers Article 2 loss As 2 S 3 microstructured optical fiber has been fabricated with typical attenuation below 2 db/m in the 1-4 µm wavelength range. On the other hand, a 20-mm long microstructured fiber sample is sufficient to enable a spectral broadening spreading from 0.6 to 4.1 µm in a 40 db dynamic range. OCIS codes: ( ) Fiber optics, infrared; ( ) Photonic crystal fibers; ( ) Nonlinear optics, fibers; ( ) Nonlinear optical materials; ( ) Glass and other amorphous materials; ( ) Fiber design and fabrication. 1. Introduction Expanding the wavelength range of supercontinua towards the mid-infrared region is of high technological interest in numerous applications such as spectroscopy, sensing, biology, metrology or defense. However, exceeding the fused silica transparency limits beyond 2 µm remains a challenging task [1]. To this aim, several strategies and alternative materials have been proposed so as to push back the edges of supercontinuum (SC) sources still further in the mid-infrared region. In particular, wider transmission windows and stronger nonlinear materials have been studied as an alternative to fused silica such as tellurite [2, 3], fluoride glasses [4, 5], heavy oxides [6] or chalcogenide glasses [7-15]. Given their remarkable optical and chemical properties, chalcogenide-based materials have been found to be promising candidates. Indeed, depending on their chemical composition, the infrared transparency can exceed 10 µm, whereas the Kerr nonlinearity can be three orders of magnitude higher than standard fused silica [7]. This combination of both properties makes them particularly attractive for broadband mid-infrared SC generation. However, chalcogenide glasses suffer from a large normal group velocity dispersion (GVD) in the infrared, which dramatically reduces the efficiency of SC expansion. Indeed, the zero dispersion wavelength (ZDW) is commonly located far in the mid-infrared and far from standard commercially available laser sources. For instance, the ZDW of sulfide glasses are usually located around 5 µm, which makes them challenging to pump in their anomalous dispersion regime. Therefore, a welldesigned geometry is required to shift down the ZDW to lower wavelengths. To this aim, several scenarios have been considered such as waveguide design [8-10], tapering [11-13] and microstructured optical fibers [2, 14, 15], which give rise to record spectral expansions in the 100
123 Part 2: Mid-Infrared Supercontinuum Generation In As 2 S 3 Microstructured Optical Fibers Article 2 mid-infrared [2, 8-15]. In this paper, we report the generation of a 3500-nm bandwidth SC in a 2-cm long segment of low loss As 2 S 3 suspended core microstructured optical fiber (MOF). Fiber geometry was carefully designed for an efficient pumping close to its ZDW in the anomalous dispersion regime by means of an optical parametric oscillator delivering 200-fs pulses at an operating wavelength of 2.5 µm. To the best of our knowledge, this is the largest SC bandwidth generated in chalcogenide fibers. 2. Glass and fiber elaboration In order to fabricate the MOF, commercially available high purity elemental precursors (S and As of 5N purity) were first used to prepare a glass rod. Nevertheless, their subsequent distillation remains mandatory since the sulphur powder is generally polluted by water and carbon, while the surface of metallic arsenic by oxides. Thus, starting products were subjected to thermal treatment under vacuum inside a silica set-up to get rid of their respective impurities. Sulphur is thus dried by heating for a few hours at 120 C under dynamic vacuum. Simultaneously, the arsenic is heated few hours at the oxide sublimation temperature (290 C) [2]. At a later stage, the mixed batches are enclosed inside silica glassware prior to static distillation. By means of the static distillation process, the batch collected inside the silica synthesis ampoule is exempt of unsuitable carbon. Finally, the synthesis ampoule was sealed and placed inside a three zone melting rocking furnace. The ampoule was then heated up to the reaction temperature (700 C) and maintained at this stage for several hours (12 h). At such high temperature, the melt reagents interact to form the glass. Enforced by high volatility of sulfur, the ampoule was slowly heated to avoid its explosion. Finally, the silica ampoule containing the liquid batch was quenched in water. The obtained sulfide glass was subsequently annealed at the glass transition temperature (Tg= 210 C) for 12 hours. A mechanical drilling technique was adopted to elaborate the glass preforms. Thanks to this original technique, a variety of geometrical designs conceived to achieve well controlled parameters (core size, holes positions, inner surface) were prepared [2, 7]. Here, the preform geometry consists of three holes centered on a central solid core. The length of the fiber preform is 40 mm and the diameter of air holes is 1 mm. Following the drawing process, the fiber microstructure consists in a triangular lattice of air holes which extend along the fiber. They surround a small central core with triangle geometry attached to robust jacket by three 101

124 Part 2: Mid-Infrared Supercontinuum Generation In As 2 S 3 Microstructured Optical Fibers Article 2 thin struts. The corresponding cross-section image of the suspended core MOF is displayed in Figure 41.a. The fiber has an outer diameter of 130 µm and a central solid core of 3.4 µm in diameter, held to the clad through three surrounding holes by means of three thin struts. Due to technical constraints, the spectral losses cannot be directly measured on this resulting small core MOF. However, an estimation of fiber optical losses by means of Fourier Transformed InfraRed (FTIR) spectrometer can be performed on a mono-index large core multimode fiber [2]. Figure 41: (a) Profile of the chalcogenide As 2 S 3 suspended-core fiber captured by means of scanning electronic microscopy (b) Chalcogenide bulk transmission (c) Optical loss of the mono-index large core multimode fiber as a function of wavelength. Loss measured at 1.55 µm for the suspended core MOF (star). Results are depicted in Figure 41 b-c in the range of 0.5 to 5 µm. In particular we compare optical losses obtained from the chalcogenide bulk and the mono-index fiber. Two typical extrinsic absorption bands slightly emerge from the background. The first band is large and centered at 2.77 and 2.89 µm. This phenomenon is due to fundamental vibration modes of OH bonds. A second narrow band attributed to vibration mode of SH bonds is centered at 3.1 µm. The SH concentration level is quite high, above detection limits of our detection set-up (integrating sphere connected to an InSb detector) which explains the noisy aspect of the depicted spectrum and the lack of the SH absorption peak around its fundamental vibration wavelength at 4.0 µm. Taking advantage of the cut-back technique, and using a continuous 102
125 Part 2: Mid-Infrared Supercontinuum Generation In As 2 S 3 Microstructured Optical Fibers Article 2 wave laser source, we confirmed previous loss measurements for the suspended-core fiber at 1.55 µm (star in Figure 41 c). However in our previous work [2], we have suspected a dynamic time variation of the attenuation, especially related with OH absorption, which could be at the origin of limitation of the extension of the supercontinuum further in the infrared region. Thus, in order to confirm the aforementioned hypothesis, as well as to avoid any unsuitable variation of the attenuation of the fiber sample, the microstructured fiber freshly drawn has been permanently preserved under suitable conditions. Chalcogenide fibers were stored under anhydrous Nitrogen atmosphere inside a sealed box. This procedure allows us to control the moisture content of atmosphere at which the glass fibers are exposed and therefore to prevent the suspected aging process of As 2 S 3 fibers. Figure 42: Numerical modeling of the fundamental mode of the suspended-core chalcogenide fiber. Chromatic dispersion curve (black line) and effective mode area (blue curve). Figure 42 reports numerical simulations of modal properties based on the fiber geometry derived from the SEM analysis (see Figure 41.a). Our suspended core fiber exhibits a zero-dispersion wavelength (ZDW) close to 2.4 µm. The core size mainly governs the fiber dispersion properties and it was chosen in such a way that the ZDW fits in the wavelength range of maximal power of the tunable mid-infrared laser source used below. 103
 pumped by a Ti-Sapphire laser. It generates tunable pulses extending from 1.7 up to 3.")
126 Part 2: Mid-Infrared Supercontinuum Generation In As 2 S 3 Microstructured Optical Fibers 3. Experimental set-up Article 2 Figure 43 shows the experimental setup used for supercontinuum generation. It consists of an Optical Parametric Oscillator (OPO) pumped by a Ti-Sapphire laser. It generates tunable pulses extending from 1.7 up to 3.2 µm, with pulse width of 200 fs at a repetition rate of 80 MHz. The 2-cm long sample of chalcogenide fiber is fixed onto a 3 axis holder. Incident beam is focused into the fiber using a mid-infrared aspheric Zinc Selenide (ZnSe) focus lens with a numerical aperture (NA) of 0.25 at 3.75 µm. This set-up allows us to pump the fiber under study on a wide range of wavelengths around its ZDW, so as to ensure an efficient SC generation [16]. Output supercontinuum is collected through a 0.5 m long multimode fluoride (InF 3 ) fiber with high transmission over the µm spectral range. It is then analyzed by means of two Optical Spectrum Analyzers (OSA) covering 350 to 1200 nm and 1200 to 2400 nm, respectively as well as by a FTIR spectrometer in the range of 2.4 to 5 µm. Figure 43: Experimental setup used for supercontinuum generation in the suspended-core chalcogenide fiber. FUT: fiber under-test. 4. Experimental results and discussions A series of in-situ tests that evaluate the measured spectral broadening versus pump wavelength allowed us to select the suitable anomalous regime pump wavelength at 2.5 µm. From Figure 42 we evaluated the group-velocity dispersion β 2 to ps 2.m -1. The incoming average power was measured after the focusing lens, before being injected into the fiber. The maximum peak power available was 12 kw at an average power of 194 mw. Next we measured the coupling coefficient about 40% when using low input powers. Figure 44 shows the output spectra recorded for the tested fiber under 2.5-µm pump wavelength according to injected peak power increasing from 1.25 to 4.86 kw. The nonlinear index of the material is n 2 ~ m 2.W -1 at 1550 nm, which corresponds, from the 6.1-µm 2 effective mode area depicted in Figure 42, to a nonlinear Kerr coefficient 104
127 Spectrum [10 db/div] 0,5 1,0 1,5 2,0 2,5 3,0 3,5 4,0 4,5 5,0 Wavelength (μm)
128 Part 2: Mid-Infrared Supercontinuum Generation In As 2 S 3 Microstructured Optical Fibers Article 2 In our previous work [2], the output spectrum bandwidth was critically correlated to MOF attenuation, especially to OH and SH absorptions, whereas numerical simulations neglecting these dramatic absorption peaks revealed that dynamics of supercontinuum generation could be extended until 5.5 µm. Here, the control of aging combined with a gradual reduction of the length of the fiber sample under-test allows to overcome the issue of OH absorption, but not completely that related to SH absorption. Hence, only 2 cm of fiber was used for this experiment to extend the SC long wavelength edge further to the MIR region. The broad spectrum cuts off in the MIR side at around 4.1 µm. It is primarily due to fiber attenuation, especially SH absorption around 4.0 µm. The signature of OH absorption can be observed using longer fiber segments, it depends at the same time on its concentration, its vibration modes and the degree of OH hydrogen bonding present in the glass. The combination of different vibration modes (stretching and bending) of weekly H-bonded OH and free OH in the glass provide a 500 nm bandwidth absorption band located around 2.76 µm spreading from 2.5 to 2.99 µm. Here, solitons successfully overcome these crucial absorptions and subsequently allow a better expansion of the spectrum in the MIR compared to our previous studies [2] However, the impact of SH absorption at 4.0 µm appears for high input pulse power. Gradual increasing of the pump power allows shifting the spectrum long wavelength edge further in the MIR region. However, note that the high SH absorption prevents here the efficient expansion of the spectral broadening beyond 4.1 µm. 5. Conclusion In conclusion, we report here an As 2 S 3 fiber-based supercontinuum source that covers 3500 nm extending from near visible to the mid-infrared by using a 200-fs pulsed pump with about 1 nj energy at 2.5 µm. In particular, the SC bandwidth extends from the glass bandgap limit at 0.6 µm to the mid-infrared region around 4.1 µm. To our knowledge, this is the largest SC bandwidth generated in chalcogenide fibers. The remaining limitation of SC bandwidth is mainly related to the presence of the SH absorption peak. Additionally, we find that deleterious temporal evolution of the OH species of As 2 S 3 MOF has been limited by the dry atmosphere storage technique, confirming thus the proposed aging hypothesis. A detailed study is in progress in order to discern the aging process and their inherent deleterious phenomena. 106
129 Part 2: Mid-Infrared Supercontinuum Generation In As 2 S 3 Microstructured Optical Fibers Article 2 Acknowledgements We acknowledge the financial support from the JSPS-CNRS Bilateral French-Japanese Program, the Conseil Régional de Bourgogne through the Photcom PARI program, as well as the French DGA. This project has been performed in cooperation with the Labex ACTION program (contract ANR-11-LABX ). 107
130 Part 2: Mid-Infrared Supercontinuum Generation In As 2 S 3 Microstructured Optical Fibers 6. References References - Article 2 1. J. Hu, J. Meyer, K. Richardson, and L. Shah, "Feature issue introduction: mid-ir photonic materials," Optical Materials Express 3, (2013). 2. I. Savelii, O. Mouawad, J. Fatome, B. Kibler, F. Désévédavy, G. Gadret, J. C. Jules, P. Y. Bony, H. Kawashima, W. Gao, T. Kohoutek, T. Suzuki, Y. Ohishi, and F. Smektala, "Mid-infrared 2000-nm bandwidth supercontinuum generation in suspended-core microstructured Sulfide and Tellurite optical fibers," Optics Express 20, (2012). 3. P. Domachuk, N. A. Wolchover, M. Cronin-Golomb, A. Wang, A. K. George, C. M. B. Cordeiro, J. C. Knight, and F. G. Omenetto, "Over 4000 nm bandwidth of mid-ir supercontinuum generation in sub-centimeter segments of highly nonlinear tellurite PCFs," Optics Express 16, (2008). 4. F. Théberge, J.-F. Daigle, D. Vincent, P. Mathieu, J. Fortin, B. E. Schmidt, N. Thiré, and F. Légaré, "Mid-infrared supercontinuum generation in fluoroindate fiber," Optics Letters 38, (2013). 5. G. Qin, X. Yan, C. Kito, M. Liao, C. Chaudhari, T. Suzuki, and Y. Ohishi, "Ultrabroadband supercontinuum generation from ultraviolet to 6.28 μm in a fluoride fiber," Applied Physics Letters 95, (2009). 6. J. H. V. Price, T. M. Monro, H. Ebendorff-Heidepriem, F. Poletti, P. Horak, V. Finazzi, J. Y. Y. Leong, P. Petropoulos, J. C. Flanagan, G. Brambilla, F. Xian, and D. J. Richardson, "Mid-IR supercontinuum generation from nonsilica microstructured optical fibers," IEEE Journal of Selected Topics in Quantum Electronics 13, (2007). 7. J. Fatome, C. Fortier, T. N. Nguyen, T. Chartier, F. Smektala, K. Messaad, B. Kibler, S. Pitois, G. Gadret, C. Finot, J. Troles, F. Desevedavy, P. Houizot, G. Renversez, L. Brilland, and N. Traynor, "Linear and nonlinear characterizations of chalcogenide photonic crystal fibers," Journal of Lightwave Technology 27, (2009). 8. Y. Yu, X. Gai, T. Wang, P. Ma, R. Wang, Z. Yang, D.-Y. Choi, S. Madden, and B. Luther-Davies, "Mid-infrared supercontinuum generation in chalcogenides," Optical Materials Express 3, (2013). 9. M. R. Lamont, B. Luther-Davies, D.-Y. Choi, S. Madden, and B. J. Eggleton, "Supercontinuum generation in dispersion engineered highly nonlinear (γ = 10/W/m) As 2 S 3 chalcogenide planar waveguide," Optics Express 16, (2008). 10. J. McCarthy, H. Bookey, S. Beecher, R. Lamb, I. Elder, and A. K. Kar, "Spectrally tailored mid-infrared super-continuum generation in a buried waveguide spanning
131 Part 2: Mid-Infrared Supercontinuum Generation In As 2 S 3 Microstructured Optical Fibers References - Article 2 nm to 5000 nm for atmospheric transmission," Applied Physics Letters 103, (2013). 11. A. Al-kadry, C. Baker, M. El Amraoui, Y. Messaddeq, and M. Rochette, "Broadband supercontinuum generation in As 2 Se 3 chalcogenide wires by avoiding the two-photon absorption effects," Optics Letters 38, (2013). 12. S. Shabahang, G. Tao, J. J. Kaufman, and A. F. Abouraddy, "Dispersion characterization of chalcogenide bulk glass, composite fibers, and robust nanotapers," Journal of the Optical Society of America B 30, (2013). 13. C. W. Rudy, A. Marandi, K. L. Vodopyanov, and R. L. Byer, "Octave-spanning supercontinuum generation in in situ tapered As 2 S 3 fiber pumped by a thulium-doped fiber laser," Optics Letters 38, (2013). 14. J. Hu, C. R. Menyuk, L. B. Shaw, J. S. Sanghera, and I. D. Aggarwal, "Computational study of 3-5 µm source created by using supercontinuum generation in As 2 S 3 chalcogenide fibers with a pump at 2 µm," Optics Letters 35, (2010). 15. W. Gao, M. El Amraoui, M. Liao, H. Kawashima, Z. Duan, D. Deng, T. Cheng, T. Suzuki, Y. Messaddeq, and Y. Ohishi, "Mid-infrared supercontinuum generation in a suspended-core As 2 S 3 chalcogenide microstructured optical fiber," Optics Express 21, (2013). 16. J. M. Dudley, G. Genty, and S. Coen, "Supercontinuum generation in photonic crystal fiber," Reviews of Modern Physics 78, (2006). 109
132 110

133 Part 2: Mid-Infrared Supercontinuum Generation In As 2 S 3 Microstructured Optical Fibers VI. Article 3 Article 3 111
134 Part 2: Mid-Infrared Supercontinuum Generation In As 2 S 3 Microstructured Optical Fibers Article 3 Impact of optical and structural aging in As 2 S 3 microstructured optical fibers on mid-infrared supercontinuum generation O. Mouawad, F. Amrani, B. Kibler, J. Picot-Clémente, C. Strutynski, J. Fatome, F. Désévédavy, G. Gadret, J-C Jules, O. Heintz, E. Lesniewska, and F. Smektala * Laboratoire Interdisciplinaire Carnot de Bourgogne (ICB), UMR 6303 CNRS - Université de Bourgogne, 9 Av. Alain Savary, BP47870, 21078Dijon, France Abstract Corresponding author: frederic.smektala@u-bourgogne.fr We analyze optical and structural aging in As 2 S 3 microstructured optical fibers (MOFs) that may have an impact on mid-infrared supercontinuum generation. A strong alteration of optical transparency at the fundamental OH absorption peak is measured for high-purity As 2 S 3 MOF stored in atmospheric conditions. The surface evolution and inherent deviation of corresponding chemical composition confirm that the optical and chemical properties of MOFs degrade upon exposure to ambient conditions because of counteractive surface process. This phenomenon substantially reduces the optical quality of the MOFs and therefore restrains the spectral expansion of generated supercontinuum. This aging process is well confirmed by the good matching between previous experimental results and the reported numerical simulations based on the generalized nonlinear Schrödinger equation Optical Society of America OCIS codes: ( ) Fiber optics, infrared; ( ) Photonic crystal fibers; ( ) Fiber design and fabrication; ( ) Fiber characterization; ( ) Spectroscopy, surface. 1. Introduction Among the wide range of functionalities currently realized by photonic devices, providing reliable and stable light source that covers a broad spectral bandwidth is of major importance. Such supercontinuum (SC) sources can be obtained through nonlinear propagation of a pump beam into an optical waveguide by exploiting various nonlinear wavelength conversion 112
135 Part 2: Mid-Infrared Supercontinuum Generation In As 2 S 3 Microstructured Optical Fibers Article 3 processes [1]. For efficient SC generation, one has to use a low loss and highly nonlinear medium pumped with high power density close to its zero dispersion regime. Many applications exist for broadband mid-infrared (MIR) sources operating in the chemical and biological fingerprint regions within the atmospheric transmission windows [2-5]. To this end, MIR SC sources based on chalcogenide fibers and waveguides appear as an attractive solution thanks to their wide transparency, high nonlinearity [6-8], and thanks to the latest achievements of synthesis of low loss As 2 S 3 fibers [6, 9-13]. However, this glass composition suffers from weakness represented by an uncontrolled drift in performance over time. This is mainly due to physical and chemical aging processes [14]. Thus extending efficient MIR SC generation requires a detailed understanding and control of the evolution of optical and chemical properties for such a material [9, 15, 16]. We previously reported on experimental observation of MIR SC generation in low-loss As 2 S 3 suspended-core MOFs [Article 1-9]. The spectral broadening was beyond 2000-nm bandwidth from 1 µm to 3.2 µm. Numerical simulations were performed in order to check the underlying nonlinear processes. When considering the fiber losses which were experimentally measured in a single-index fiber, numerical results predicted a theoretical broadening with the MIR edge until 5.5 µm, whereas that experimentally recorded was located around 3.2 µm. In order to better fit the experimental SC, in particular close to the SH and OH absorption bands, extra losses were taken into account around 2.9 µm and 4 µm. This confirmed the under-evaluation of extrinsic absorption bands experimentally measured, or an aging process of our fibers under room atmosphere. Optical degradation is a natural consequence of the aging process [9, 15, 16]. However, the origin, mechanism and kinetics of chemical as well as optical aging of As 2 S 3 MOFs remain unclear. The objective of this study is to show unequivocally the aging process of an As 2 S 3 based suspended-core MOF in atmospheric conditions and its impact on SC generation. We perform numerical simulations that confirm the dynamic evolution of spectral broadening and its relation to extrinsic losses related to aging process evolving over storage at ambient atmospheric conditions. We identify the chemical and the inherent optical aging behaviors of the sulfide MOF by using a Fourier Transform InfraRed (FTIR) spectrometer. We present a first attempt to follow and prove the evolution occurring on the As 2 S 3 glass surface upon naturally induced aging process in atmospheric conditions by means of Atomic Force Microscopy (AFM). The inherent chemical composition deviation on the 113

136 Part 2: Mid-Infrared Supercontinuum Generation In As 2 S 3 Microstructured Optical Fibers Article 3 surface is also studied thanks to X-ray Photoelectron Spectroscopy (XPS). Such an analysis confirms that the aging process substantially reduces the optical quality of the MOF, thus limiting SC generation further in the MIR. 2. Preparation of glass and fiber samples. Glass used in this work was fabricated by the traditional melt quenching method. The detailed fabrication process of glass and fibers was described earlier [Article 1-9]. The obtained glass rod is 80 mm long with a diameter of 16 mm. It was cut evenly to two samples using a diamond saw. The first one was designated to draw MOFs with well defined parameters responding to experimental need. The corresponding MOF cross-section is shown in Figure 45. The second one was dedicated to preparation of specimens for AFM and XPS experiments. Attenuation (db/m) OH bonds artefact modeling clay S-H bonds Wavelength (µm) Figure 45: Attenuation spectrum of freshly drawn single index fiber (black solid line) and attenuation of the MOF measured at 1.55µm (blue star). Note that the absorption peak around 3.4μm is not related to the transmission of our fiber (i.e. artefact of our experimental setup [Article 1-9]). Inset: Cross-section image of our As 2 S 3 -suspended-small-core MOF captured by means of a scanning electron microscope CO 2 Figure 45 gives the attenuation spectrum of our low-loss As 2 S 3 single-index fiber shortly after being drawn [Article 1-9]. Losses of optical fiber were estimated in free space by means of a FTIR spectrometer and using cut-back technique. Measurements were carried out on 5-mlong fiber segment with 20% of accuracy primarily caused by the quality of fiber cleaves. 114
137 Part 2: Mid-Infrared Supercontinuum Generation In As 2 S 3 Microstructured Optical Fibers Article 3 Similar spectral loss measurements could not be successfully performed on suspended core fiber because of the small core diameter. However, cut-back measurements for the small-core MOF were performed using a continuous laser source emitting at 1.55µm, again readily after drawing, confirming thus the previous results registered on single-index fiber. Note that fundamental OH and SH absorption peaks emerge around 2.9 and 4.0µm respectively. According to the extinction coefficient ε = 5 db/m/ppm (wt.) [17, 18], the OH absolute content is about 0.5ppm (wt.). SH concentration ( 3.2 ppm) can be estimated from the spectrum referring to [19] for which extinction coefficient associated to the SH vibration at 4 μm is 2.5 db/m/ppm. The peak arising at 4.26 µm is due to CO 2 absorption. This absorption does not evolve over time unlike those of OH and SH groups. Consequently, the CO 2 absorption was neglected in this study. Absorption peaks around 3.4 µm are unequivocally assigned to C-H bonds present in the modeling clay systematically used to fix the fiber during cut-back measurements. They are not always eliminated through cut back data treatment because of the possible irreproducibility in the way we fix the fibers. Note that clay is not used during SC generation experiments. The MOF design is such that it allows to tailor its zero-dispersion wavelength (ZDW) as close as possible to the range of maximum emission capability of the pump source near 2.3 µm while keeping a very high nonlinear coefficient as well as an efficient coupling of light into the core. We computed the fundamental mode properties of suspended core MOF based on the cross-section profile (see Figure 35 and [9]for more details). The combined material and waveguide modal dispersions result in a ZDW wavelength located close to 2.3 µm for the 3.2 µm core size. The corresponding effective mode area is about 6.5 µm 2 at the ZDW. Combined with high nonlinear refractive index ~2.8x10⁻¹⁸ m 2 /W at 1.55 µm, the resulting nonlinear Kerr coefficient γ is 1175 W -1.km -1 [9]. 3. SC generation and impact of absorption bands Figure 46 (a) shows the experimental SC spectrum obtained with a 12-days aged 45-mm-long MOF segment pumped by 200-fs pulses at 2.3 µm with 4.6 kw injected power (see Figure 37 and [9] for more details about the setup). The spectral broadening extends from 1.2 to 3.2 µm in the - 20dB range with a dip around 2.9 µm, where the different combinations of strongly and weakly bonded OH groups manifest themselves (Figure 45). Eventual influence of atmospheric absorptions in this wavelength range have been checked by registering the 115
138 Part 2: Mid-Infrared Supercontinuum Generation In As 2 S 3 Microstructured Optical Fibers Article 3 atmospheric spectrum in the conditions of our measurements. The absorptions of atmospheric water remains in the noise of the experimental measurements and are not detectable in the configuration of our set up. Here we provide a detailed analysis based on numerical simulations and chemical analysis to elucidate the strong limitations imposed in the nonlinear dynamics of this SC generation. Numerical results are obtained through the split-step Fourierbased solving of the generalized nonlinear Schrödinger equation [1] taking into account the full dispersion curve from (Figure 36) [9], measured fiber losses as well as self-steepening and analytical model of the Raman gain spectrum [9]. We recall that our pumping condition induces a strong and rapid self-phase modulation process followed by random soliton fission in the earlier centimeters of fiber [1, 9]. The generated SC is then associated to significant fluctuations from pulse to pulse and high degradation of the coherence degree. As a result, averaging over 50 simulations with different input noise imposed on the pulse pump was carried out to obtain spectral smoothing, similarly to our optical spectrum analyzer. Taking only into account the loss level experimentally measured for the single-index fiber (see Figure 45 and Figure 46 (b2)), the simulated SC spectrum does not match with the experimental one, as shown in Figure 46 (b1). Indeed considering measured losses on fibers freshly drawn implies a theoretical spectral broadening up to 5.5 µm, Figure 46 (b1). In order to reach a good agreement, extra losses at 2.9 and 4.0 µm have to be taken into account as previously suggested in (Article 1 [9]). This underlines that a time evolution of deleterious extrinsic absorption bands occurs over time upon exposure to atmosphere. This aging is mainly related to the chalcogenide glass sensitivity to ambient moisture [14-16]. To reveal the impact of OH and SH absorption bands on SC generation, we simulated extra losses at 2.9 and 4 µm by considering a simple Gaussian envelope for each absorption band while keeping background losses at the same level. We increased step by step absorption peaks of the two bands as shown in Figure 46 (c2)-2(e2) until retrieving a good agreement between the simulated SC and the experimental one. The amount of losses added for each step corresponds to approximately 10 times increase of OH and SH contents in ppm. We used the same factor for the two bands. Corresponding simulated SC spectra are shown in Figure 46 (c1)-2(e1). The impact of absorption peaks on SC generation in few centimeters of fiber becomes noticeable when considering extra losses at the level of several db/cm (see Figure 46 (d1)-2(d2)). In particular, one can note the small dip around 2.9 µm in the MIR SC as well as 116
139 Part 2: Mid-Infrared Supercontinuum Generation In As 2 S 3 Microstructured Optical Fibers Article 3 a clear limitation of the SC expansion near 4 µm (in the -20dB bandwidth range). Finally, we have to extend losses up to 25 db/cm for OH-peak and 75 db/cm for the SH-peak so as to better match with our experimental SC spectrum. Such optical losses correspond to OH and SH concentrations near to 500 and 3200 ppm, respectively. We can then notice in Figure 46 (e1) an erosion of the MIR SC upper edge, which is now limited close to 3.35 µm as well as the clear presence of the OH absorption band centered at 2.9 µm. The output energy is about 60% of the input energy in Figure 46 (e1) (without taking into account Fresnel reflections), while being ~80% in Figure 46 (d1), thus corresponding to the range of the experimental measurement from (Article 1) [9]. From these considerations, we highly suppose that an aging process occurs on the surface of the suspended MOF core, leading to an increase of OH and SH absorptions. Figure 46: (a) Experimental SC generated in a 45-mm-long sample of MOF, (b1-e1) Corresponding numerical simulations taking into account different levels of OH and SH absorption bands depicted in (b2-e2), respectively. 117
140 Part 2: Mid-Infrared Supercontinuum Generation In As 2 S 3 Microstructured Optical Fibers 4. Optical and structural aging Article 3 In order to confirm the preceding dynamics, we investigated the effect of atmospheric conditions on our sulfide MOF as a function of exposure time, in particular for hydroxyl species. We used a 3-m-long segment of 10-µm-large-core As 2 S 3 MOF for FTIR analysis. Unlike the previous small core MOF, with such a large core MOF, spectral recording of transmission is possible with our FTIR setup and transmission spectra were systematically recorded over a 46-h period until a significant evolution of the transmission around 2.9 µm was obtained (Figure 47). This study was performed at a temperature varying from 15 to 20 C and relative humidity between 50 and 60%. The fibre sample was mounted onto 3 axis holder in order to optimize coupling and detection of the light signal exclusively transmitted through the core of the MOF. An infrared camera was used to ensure that light was effectively coupled within the core of the MOF only. One can note that the suspended core is embedded in a robust clad which acts as a filter absorbing the unsuitable surrounding radiations potentially inducing photo-oxidation phenomena [20]. Despite that, the probed fiber was preserved in dark throughout the study period. A NICOLET 6700 Fourier Transformed InfraRed (FTIR) spectrometer was used to characterize the transmission spectra. The FTIR is seeded by an external halogen lamp providing higher power within the range of study ( µm) comparing to the standard light sources integrated within the spectrometer. In addition, signal outgoing the probed fibre was detected by means of external In-Sb detector, exhibiting high sensitivity within the range of interest. Our measurements are depicted in Figure 47 and show a naturally induced decrease in transmission and a substantial extinction of the signal around 2.9 µm upon exposure to atmospheric conditions. The deleterious impact of atmospheric moisture on As 2 S 3 MOF occurs in the short time frame over the first hours (Figure 47). Few hours are sufficient to completely attenuate the light signal in this wavelength region. These results prove the critical need for a moisture-free storage immediately after the drawing process and prior to nonlinear experiments. Additionally, a degradation of the transmission occurs (Figure 47), in the short wavelength range. After 46 hours of exposure, this degradation reaches almost 20% below 2.0 µm. Such a phenomenon could be due to surface defects that emerge on the surface of the waveguide [15, 16], thus leading to light scattering. 118
141 Part 2: Mid-Infrared Supercontinuum Generation In As 2 S 3 Microstructured Optical Fibers Normalized Transmission [0,1] 1,0 0,8 0,6 0,4 0,2 T (t0) T (1h) T (4h) T (5h) T (t6h) T (24h) T (27h) T (46h) OH absorption bands 0,0 1,6 1,8 2,0 2,2 2,4 2,6 2,8 3,0 3,2 Wavelength (µm) Article 3 Figure 47: FTIR transmission spectra of large-core As 2 S 3 MOF registered in-situ as a function of exposure time to atmospheric conditions. To confirm this point, we therefore investigated the impact of the atmospheric moisture on surface roughness of As 2 S 3 bulk glass. For that purpose, a glass sample was polished using SiC paper and diamond suspensions. One can precise that there is a difference in initial surface quality between AFM bulk samples and fiber samples, due to the polishing of bulks that might enhance aging through preliminary OH contamination or As 2 O 3 formation. However, the impact of polishing does not interfere substantially in the aging process studied here. Indeed, rectangular fiber samples carefully prepared under dry atmosphere and exposed to similar conditions show, as on bulk samples, a substantial increase of their surface roughness. The specimen was stored under atmospheric conditions similar to those reported for fiber transmission study. Since all the surface of the sample is exposed to the environment, it is thus most prone to any contaminations. The evolution of glass surface at the nanometric scale was observed through AFM analysis (Bruker, Nanoscope 8) under controlled atmosphere in Peak Force mode. Throughout the exposure period, the bulk specimen was kept in a cleanroom dedicated for AFM measurements, in dark away from any surrounding light. As shown in Figure 48, the exposure to the previously defined conditions during 12 days, induces the appearance of random bumps which develop into faceted pyramids with square cross-section. However, the dimensions of these evolving defects substantially increase from 119


142 Part 2: Mid-Infrared Supercontinuum Generation In As 2 S 3 Microstructured Optical Fibers Article 3 ~15 nm on fresh sample to reach ~60 nm after 12 days of exposure to ambient conditions. The similarity of morphology in the present work and previous studies [21, 22] strongly suggests that surface defect are As 2 O 3 crystals. a b Figure 48: Top view of AFM 3D-pictures of the As 2 S 3 bulk glass surface: (a) fresh sample; (b) 12 days of exposure. We have also checked the evolution of the chemical bonds at the bulk sample surface through XPS analysis, by comparison of a fresh glass sample and a sample exposed to atmospheric conditions inside a dark compartment during 7 days. Note that fresh sample is probed immediately after polishing. XPS measurements were carried out by means of PHI Versaprobe 5000 apparatus (AlKa monochromated X-Ray source and 58 ev of pass energy for best resolved core level acquisitions). Peaks arising on XPS survey spectra are assigned to As and As-O core levels using a PHI Handbook for XPS spectra. Such measurements demonstrate a deviation from ideal As 2 S 3 composition as illustrated in Figure 49, with the apparition of As-O bonds when the sample is exposed to ambient atmosphere. This observation is consistent with the AFM ones, and strengthens the hypothesis of As 2 O 3 crystals growing at the glass surface. It demonstrates that the sulfide glass is susceptible to room temperature chemical reaction naturally induced in ambient atmosphere. This reaction process may diffuse in depth leading to local shift of the chemical composition inside the bulk glass [23]. 120
143 Intensity Part 2: Mid-Infrared Supercontinuum Generation In As 2 S 3 Microstructured Optical Fibers 1,0 (a) 0,8 0,6 0,4 0,2 0, Binding energy (ev) Intensity Article 3 Figure 49: XPS spectra of As 3d core level of As 2 S 3 glass: (a) fresh glass; (b) exposed to air 1,0 0,8 0,6 0,4 0,2 during 7 days. Signature of As-O bonds (b) 0, Binding energy (ev) Finally, all of these results suggest an initial reaction of the glass with the atmospheric moisture surrounding the MOF core, which leads to the rapid apparition of absorbing -OH and -SH groups in the glass, with a subsequently evolution towards As 2 O 3 species formation associated with an increase of glass surface roughness. These different phenomena contribute to increase the optical losses of As 2 S 3 MOFs and degrade all their optical properties, including SC generation. However, it might be mitigated by the storage of freshly drawn MOF samples in dry atmosphere. In order to confirm the aforementioned hypothesis, the previous nonlinear experiment was recently reproduced using a sample stored in dry atmosphere [10]. Thus, an improvement of SC generation in the protected sample was indeed achieved by reaching a longer MIR edge around 4 µm without significant OH-induced dip at 2.9 µm as shown in Figure 50. Spectrum (20 db/div) Wavelength (µm) Figure 50:.Experimental supercontinuum registered on 20-mm-long segment of MOF protected from aging factors by storing in dry atmosphere [10]. 121
144 Part 2: Mid-Infrared Supercontinuum Generation In As 2 S 3 Microstructured Optical Fibers Article 3 Finally, all of these results suggest an initial reaction of the glass with the atmospheric moisture surrounding the MOF core, which leads to the rapid apparition of absorbing -OH and -SH groups in the glass, with a subsequently evolution towards As 2 O 3 species formation associated with an increase of glass surface roughness. These different phenomena contribute to increase the optical losses of As 2 S 3 MOFs and degrade all their optical properties, including SC generation. However, it might be mitigated by the storage of freshly drawn MOF samples in dry atmosphere. In order to confirm the aforementioned hypothesis, the previous nonlinear experiment was recently reproduced using a sample stored in dry atmosphere [12]. Thus, an improvement of SC generation in the protected sample was indeed achieved by reaching a longer MIR edge around 4µm without significant OH-induced dip at 2.9 µm. 5. Conclusion Through FTIR, AFM and XPS measurements, we demonstrate the deleterious time evolution of As 2 S 3 MOFs upon exposure of the MOFs core to atmospheric moisture. FTIR experiments confirm that extra losses related with OH bands at 2.9 µm occur in the MOFs. Moreover a deleterious evolution of SH absorption band is likely to occur simultaneously. The exposure of As 2 S 3 glass to atmospheric conditions leads to the development and the growth of pyramidal shapes surface defects, which increase glass surface roughness observed by AFM. These surface structures arise from reaction with the atmosphere and strong suggestion for As 2 O 3 crystals formation is emphasized by XPS results. Substantial amplification of OH absorption bands occurring over the first hours imposes the necessity of specific storage of As 2 S 3 MOFs in dry conditions, immediately after the drawing process. The efficiency of specific storage allowed to overcome the OH limitation and to extend the supercontinuum up to 4 µm. Acknowledgments We acknowledge the financial support from the Conseil Régional de Bourgogne through thephotcom PARI program, as well as the French DGA. This project has been performed incooperation with the Labex ACTION program (contract ANR-11-LABX ). 122
145 Part 2: Mid-Infrared Supercontinuum Generation In As 2 S 3 Microstructured Optical Fibers References - Article 3 6. References 1. J. M. Dudley, and J. R. Taylor, Supercontinuum generation in optical fibers (Cambridge University Press, 2010). 2. T. M. Monro, S. Warren-Smith, E. P. Schartner, A. François, S. Heng, H. Ebendorff- Heidepriem, and S. Afshar V, "Sensing with suspended-core optical fibers," Optical Fiber Technology 16, (2010). 3. V. Ta'eed, N. J. Baker, L. Fu, K. Finsterbusch, M. R. E. Lamont, D. J. Moss, H. C. Nguyen, B. J. Eggleton, D.-Y. Choi, S. Madden, and B. Luther-Davies, "Ultrafast alloptical chalcogenide glass photonic circuits," Optics Express 15, (2007). 4. J. S. Sanghera, L. Brandon Shaw, and I. D. Aggarwal, "Chalcogenide glass-fiber-based mid-ir sources and applications," IEEE Journal of Selected Topics in Quantum Electronics, 15, (2009). 5. A. Cerqueira, "Recent progress and novel applications of photonic crystal fibers," Reports On Progress In Physics 73, (2010). 6. J. H. V. Price, T. M. Monro, H. Ebendorff-Heidepriem, F. Poletti, P. Horak, V. Finazzi, J. Y. Y. Leong, P. Petropoulos, J. C. Flanagan, G. Brambilla, F. Xian, and D. J. Richardson, "Mid-IR Supercontinuum Generation From Nonsilica Microstructured Optical Fibers," IEEE Journal of Selected Topics in Quantum Electronics 13, (2007). 7. M. R. Lamont, B. Luther-Davies, D.-Y. Choi, S. Madden, and B. J. Eggleton, "Supercontinuum generation in dispersion engineered highly nonlinear (γ = 10/W/m) As 2 S 3 chalcogenide planar waveguide," Optics Express 16, (2008). 8. S. D. Le, D. M. Nguyen, M. Thual, L. Bramerie, M. Costa e Silva, K. Lenglé, M. Gay, T. Chartier, L. Brilland, D. Méchin, P. Toupin, and J. Troles, "Efficient four-wave mixing in an ultra-highly nonlinear suspended-core chalcogenide As 38 Se 62 fiber," Optics Express 19, (2011). 9. I. Savelii, O. Mouawad, J. Fatome, B. Kibler, F. Désévédavy, G. Gadret, J. C. Jules, P. Y. Bony, H. Kawashima, W. Gao, T. Kohoutek, T. Suzuki, Y. Ohishi, and F. Smektala, "Mid-infrared 2000-nm bandwidth supercontinuum generation in suspended-core microstructured Sulfide and Tellurite optical fibers," Optics Express 20, (2012). 10. O. Mouawad, J. Picot-Clémente, F. Amrani, C. Strutynski, J. Fatome, B. Kibler, F. Désévédavy, G. Gadret, J. C. Jules, D. Deng, Y. Ohishi, and F. Smektala, "Multioctave midinfrared supercontinuum generation in suspended-core chalcogenide fibers," Optics Letters 39, (2014). 123
146 Part 2: Mid-Infrared Supercontinuum Generation In As 2 S 3 Microstructured Optical Fibers References - Article A. E. Kurganova, G. E. Snopatin, and M. F. Churbanov, "Purification of glass melts in the As-Se system with vacuum distillation," Glass Physics and Chemistry 38, (2012). 12. V. Q. Nguyen, J. S. Sanghera, B. Cole, P. Pureza, F. H. Kung, and I. D. Aggarwal, "Fabrication of arsenic sulfide optical fiber with low hydrogen impurities," Journal of the American Ceramic Society 85, (2002). 13. G. E. Snopatin, V. S. Shiryaev, V. G. Plotnichenko, E. M. Dianov, and M. F. Churbanov, "High-purity chalcogenide glasses for fiber optics," Inorganic Materials 45, (2009). 14. P. Toupin, L. Brilland, D. Mechin, J. Adam, and J. Troles, "Optical aging of chalcogenide microstructured optical fibers," Journal of Lightwave Technology 32, (2014). 15. M. F. Churbanov, V. S. Shiryaev, V. V. Gerasimenko, A. A. Pushkin, I. V. Skripachev, G. E. Snopatin, and V. G. Plotnichenko, "Stability of the optical and mechanical properties of chalcogenide fibers," Inorganic Materials 38, (2002). 16. Y.-F. Niu, J.-P. Guin, A. Abdelouas, T. Rouxel, and J. Troles, "Durability of an As 2 S 3 chalcogenide glass: optical properties and dissolution kinetics," Journal of Non- Crystalline Solids 357, (2011). 17. J. S. Sanghera, and I. D. Aggarwal, "Active and passive chalcogenide glass optical fibers for IR applications: a review," Journal of Non-Crystalline Solids , 6-16 (1999). 18. G. Fonteneau, D. Trégoat, and J. Lucas, "Determination du coefficient d'extinction molaire de OH- dans les verres fluores a base de metaux lourds," Materials Research Bulletin 20, (1985). 19. V. G. Borisevich, V. G. Plotnichenko, I. V. Scripachev, and M.F. Churbanov, "Extinction coefficient of SH groups in vitreous arsenic sulphide," Russian High Purity Substances Journal 4, (1990). 20. D.-Y. Choi, S. Madden, D. Bulla, A. Rode, R. Wang, and B. Luther-Davies, "SU-8 protective layer in photo-resist patterning on As 2 S 3 film," physica status solidi (c) 8, (2011). 21. J. Dikova, N. Starbov, and K. Starbova, "The mechanism of photoinduced transformations in amorphous As 2 S 3 thin films," Journal of Non-Crystalline Solids 167, (1994). 22. J. T. Bloking, S. Krishnaswami, H. Jain, M. Vlcek, and R. P. Vinci, "Photoinduced changes in the surface morphology of As 50 Se 50 chalcogenide glass films," Optical Materials 17, (2001). 124
147 Part 2: Mid-Infrared Supercontinuum Generation In As 2 S 3 Microstructured Optical Fibers References - Article S. H. Messaddeq, V. R. Mastelaro, M. Siu Li, M. Tabackniks, D. Lezal, A. Ramos, and Y. Messaddeq, "The influence of oxygen in the photoexpansion of GaGeS glasses," Applied Surface Science 205, (2003). 125
148 Part 2: Mid-Infrared Supercontinuum Generation In As 2 S 3 Microstructured Optical Fibers Part 2 - Conclusion VII. Conclusion In summary, we successfully demonstrated an experimental supercontinuum spanning over 2000 nm in few centimeters of sulfur-based chalcogenide suspended-core microstructured optical fiber. The later bandwith was increased up to 3500 nm when fibers were subject to preventive protection procedures. Such procedures allow to control the naturally induced drift of optical and chemical properties of the fiber device. The global SC system consists in optical parametric oscillator pumped with Ti-sapphire laser, followed by the low loss, highly nonlinear As 2 S 3 MOFs segments. The seed source generates ultrashort pulses of 200-fs FWHM at 80 MHz repetition rate. Advantageously, it is tunable between 1.7 and 3.2 µm, allowing thus a suitable fiber pumping in the anomalous dispersion regime, highly favorable for efficient SCG. A continuous supercontinuum of 2000 nm bandwidth, extending from ~1.2 µm to ~3.2 µm, with characteristic dip around 2.9 µm, were registered in 4.5 cm segment of As 2 S 3 MOF, pumped in the anomalous dispersion regime, close to its ZDW. The dip is consistent with the extrinsic OH absorption band mostly related to the glass synthesis technique and the aging phenomenon. The supercontinuum bandwidth is successfully increased on protected fibers. Protection of fiber devices is realized by continuous storing of the freshly drawn fiber's specimen under dry atmosphere prior to nonlinear optics experiments. We successfully registered a flat spectrum spreading over 3500 nm, extending from ~0.6 µm to ~4.1 µm, in 2.0 cm segment of As 2 S 3 MOFs. Herein, no dip is interrupting the spectrum flatness. In both cases, As 2 S 3 fibers with comparable geometric design and optical loss level have been used in the experiments. Theoretical simulations and modeling have been carried out to study the SC generation mechanism and investigate the limits of SC long wavelength edge limits of SC in the chalcogenide fibers. The supercontinua generated within the fibers are characterized by a strong and rapid self-phase modulation process followed by soliton fission in the earlier centimeters of the fiber. In this case the soliton fission occurs randomly due to the significant role of modulation instability when N >>
149 Part 2: Mid-Infrared Supercontinuum Generation In As 2 S 3 Microstructured Optical Fibers Part 2 - Conclusion The MIR spectrum wavelength edge is primarily limited by the hydrogenated (OH and SH) extrinsic absorption losses and their time evolution, dramatically decreasing the nonlinear effects efficiency and leading to more and more narrow spectrum. Taking into account the loss level experimentally measured for the freshly drawn fiber, the simulated SC spectrum does not match with that registered on unprotected sample. In order to reach a good agreement, extra losses of 2500 db/m for OH absorptions at 2.9µm and 7500 db/m for SH absorptions at 4.0µm have to be taken into account. Compared to values measured on freshly drawn fiber, the absolute content of OH and SH moieties have increased 1000 times upon aging process. This imposes the necessity of special storage of MOF in suitable conditions, immediately after the drawing process. In addition, exposure of As 2 S 3 glass to atmospheric conditions initiates the development and the growth of pyramidal shapes surface defects and induces structural changes within the glass network. 127
150 128
151 Part 3: Optical, topological and structural aging in As 2 S 3 microstructured optical fibers and impact on mid-infrared supercontinuum spanning Part 3: Optical, Topological and Structural Aging in As 2 S 3 Microstructured Optical Fibers and Impact on Mid-Infrared Supercontinuum Spanning 129
152 Part 3: Optical, Topological and Structural Aging in As 2 S 3 Microstructured Optical Fibers and Impact on Mid-Infrared Supercontinuum Spanning Introduction I. Introduction In the previous part, we demonstrated a crucial degradation of As 2 S 3 MOFs upon exposure to ambient atmosphere. The holey nature of these fibres makes them prone to contamination and to subsequent degradation of their performance, particularly at OH and SH absorptions related wavelengths. The degradation dynamics are associated with glass hydration caused by H 2 O and formation of OH bonds, preventing further extension of the SC long wavelength edge in the mid-ir region. This is extensively presented in part 2-Article 3. In addition, FTIR measurements demonstrate a substantial amplification of OH absorption bands occurring over the first hours of exposure to atmospheric conditions. This coincides with the emergence of pyramidal shape bumps defects which increases the glass surface roughness as shown by AFM. These surface structures are probed by XPS technique. We attribute them to the formation of As 2 O 3 crystals arising from reaction with the ambient atmosphere. The later observations motivated detailed investigations of MOF's time-dependent deterioration related to OH and SH contamination. MOF's surface and structural features evolving over time are also examined. Results of these studies are detailed in the following part. Article 1 reports an extensive study of transmission aging of As 2 S 3 MOFs with regards to exposure-time to ambient atmosphere. A time evolution of transmission spectra are surveyed using FTIR-spectroscopy technique. The most sever deleterious effects occur over the first 24 hours. Absorption bands are detailed and attributed to corresponding vibration modes. Based on Beer-Lambert law using the appropriate extinction coefficient reported in the literature, we estimated the absolute content of hydroxyl species accumulated over time as a result of this aging process. Finally, we demonstrate a proved promising preventive and protection tool. In the light of previous studies discussed in Part1-Article 1, Article 2 presents a study of the hydration interactions between water vapor and the glass network. The later interactions are associated with shrinkage of As-S bonds glassy backbone within the glass matrix and grow of defects on the glass surface. The evolution of the glass network chemical composition is surveyed by FTIR spectroscopy. To respond to experimental requirements, a short length 130
153 Part 3: Optical, Topological and Structural Aging in As 2 S 3 Microstructured Optical Fibers and Impact on Mid-Infrared Supercontinuum Spanning Introduction MOF fiber sample is used in this study. The temporal evolution of the transmission spectra shows a progressive growth of new absorption bands, announcing modifications of the glass structure. The corrosive impact of atmospheric moisture on As 2 S 3 glass is proved. On the other hand, the evolution of the surface roughness is conducted by means of Atomic Force Microscopy (AFM) technique. A specially designed rectangular fiber is used for these experiments. The surface roughness of glass samples is monitored with regards to time exposure to different hygrometric and thermal conditions. 131
154 132

155 Part 3: Optical, Topological and Structural Aging in As 2 S 3 Microstructured Optical Fibers and Impact on Mid-Infrared Supercontinuum Spanning Article 1 II. Article 1: 133
156 Part 3: Optical, Topological and Structural Aging in As 2 S 3 Microstructured Optical Fibers and Impact on Mid-Infrared Supercontinuum Spanning Optical aging behaviour naturally induced on As 2 S 3 microstructured optical fibres Article 1 O. Mouawad, C. Strutynski, J. Picot-Clémente, F. Désévédavy, G. Gadret, J-C Jules and F. Smektala * ICB Laboratoire Interdisciplinaire Carnot de Bourgogne, UMR 6303 CNRS-Université de Bourgogne, 9 Av. Alain Savary, BP 47870, Dijon, France Corresponding author * : frederic.smektala@u-bourgogne.fr Abstract The efficiency and the stability of As 2 S 3 microstructured optical fibres (MOFs) are limited by the shift of their optical properties that occurs over time due to a naturally induced aging process. Such sensitivity becomes more crucial for long optical path. Among the variety of fibre designs, the MOFs are developed for promising photonics applications such as supercontinuum generation for example. In the present work, we carried out an extensive aging study on As 2 S 3 chalcogenide MOFs in ambient atmosphere. The evolution of the fibre transmission spectrum has been studied with regards to exposure time. The analysis of the transmission line profile was performed in terms of different spectral components Gaussian in shape and the infrared absorption bands have been attributed to the corresponding chemical groups' vibration modes or overtones. The time-dependent evolution of fibre attenuation has been studied as well as its longitudinal evolution for a given exposure time. Previous knowledge of extinction coefficient inherent to vibration components allows to predict their corresponding concentration. The content of hydroxyl groups tightly bonded to the glass network of the sulphide MOF core decreases exponentially with distance away from the MOF extremity. The report results show that a deleterious aging effect occurs over the first hours and days of exposure. This has crucial implications for storage and employment techniques and requires holes airproofing technique. OCIS codes: ( ) Fiber optics, infrared; ( ) Optical properties; ( ) Microstructured fibers; ( ) Nonlinear optical materials; ( ) Fiber design and fabrication; ( ) Fiber characterization. 134
157 Part 3: Optical, Topological and Structural Aging in As 2 S 3 Microstructured Optical Fibers and Impact on Mid-Infrared Supercontinuum Spanning Article 1 1. Introduction Chalcogenide glasses of different compositions are progressively developed for their potentials in a widespread variety of applications in the field of optic, spectroscopy [1], telecommunication [2] or biology. The reputation of these materials is attributed to their combined properties of broad transparency window, reasonably low optical losses, nonlinear properties, reasonable chemical and physical durability [3, 4]. The performance of chalcogenide based devices is strongly related to these combined fundamental characteristics. However, the scientific reliability and economic profitability impose a long-term service of the considered device, even if exposure of chalcogenide based devices to the real operation environment will eventually result in changes in the original physical and chemical properties. These changes correspond to an aging process, through chemical and physical processes. Glass chemical aging is defined as a process of chemical interactions between glassy materials and their environment. It refers to chemical and structural modifications over time trough different mechanisms. Thermo-oxidative [5, 6], photo-induced [7, 8] and hydrolytic [9, 10] are the most known chemical degradation mechanisms. These processes become increasingly severe by extending exposure time, as by raising temperature levels, simultaneously as well as separately. Among others, this evolution is characterized by changes in glass transmission spectrum; new absorption bands appear while others are significantly amplified. Such process could eventually be of major benefits for different applications such as chemical sensing. Glass physical aging is a process of structural relaxation [11]. The material evolves toward thermodynamic equilibrium. This is related to the preparation procedure of inorganic glasses [6, 12]. Glasses are defined as liquids which are frozen on time scale of experimental observation. They are considered thermodynamically metastable compared to crystals. Their enthalpy, free volume and entropy levels are higher than those of most stable forms. Thus, a glass matrix is continuously relaxing toward the equilibrium state of crystals over time. During real-time aging, this continual evolution of bulk properties is too slow to be measured and frequently unnoticeable. According to [6, 12] few and up to many years are needed to detect measurable changes in the mechanical properties for example. By heating glass above 135
158 Part 3: Optical, Topological and Structural Aging in As 2 S 3 Microstructured Optical Fibers and Impact on Mid-Infrared Supercontinuum Spanning Article 1 Tg at sufficiently high temperature and quenching of the glass melt, initial material could be recycled. Therefore, physical aging is a thermo-reversible process. Previous studies [6, 12-14] have shown a natural and induced physical as well as chemical aging of chalcogenide glasses. R.Ya. Golovchak and al. [6] showed that AsSe based-glasses exhibit physical aging after several months of storage. These phenomena might be accelerated by exposure to sub-band gap and above-band gap light. Herein, Se-based samples subjected to aging influences, lose their excess of configurational entropy, enthalpy or free volume (gained during melt quenching) to reach a more favourable thermodynamic state. M.F. Churbanov and al. [13] studied the stability of optical and mechanical properties of As-S-Se based chalcogenide glass fibres under different conditions. They underlined an essential preventive function of fibre coating, which allows maintaining the original properties of the fibres. Uncoated fibres have shown a tremendous decrease of mechanical and optical properties after few days of exposure to atmospheric conditions. This collapse becomes more dramatic under hostile conditions such as water [15] and acetone. The observed changes during storage are due to the nucleation and propagation of cracks on the fibre surface, impurity adsorption and other microstructural changes. Toupin and al. [14] have briefly reported an optical aging on As 2 S 3 six holes-design microstructured optical fibre upon exposure to air. The optical aging was associated with a dynamic grow of OH and H 2 O attributed absorption bands. Recently, our group has demonstrated the deleterious time evolution of As 2 S 3 suspended core MOFs upon exposure of the MOF's core to atmospheric moisture and its impact on mid-infrared supercontinuum generation [16]. The kinetic of these changes reported in the literature has been studied on time scale from few hours to several years. It demonstrates that the optical properties are highly sensitive and severely degenerated in a few days. It was reported that 24 h are sufficient to completely quench the transmission of an As 2 S 3 fibre immersed in water [15], whereas after 64 days of immersion in water, an As 2 S 3 bulk sample lost almost 20% of its initial transmission [9]. In the case of fibres, optical losses level remains the most critical parameter. The control of this key criterion is a complicated process. It is based on sequential operations which are not limited to the synthesis technique. It extends to glass machining and device s storage. The recent significant improvements of synthesis strategies allow the fabrication of low loss chalcogenide fibres exhibiting standard or microstructured profile [3, 136
159 Part 3: Optical, Topological and Structural Aging in As 2 S 3 Microstructured Optical Fibers and Impact on Mid-Infrared Supercontinuum Spanning Article ]. Subsequent stages are necessary to preserve the amorphous material s optical loss at its post-synthesis level. Therefore, an aging study is needed, especially in the case of microstructured fibres, to provide an overview of exposure effects. It allows identifying the nature, the sources and the impacts of deterioration factors. Thus, in this work, the chemical aging of sulphide based chalcogenide microstructured optical fibres in ambient atmosphere is accurately assessed. The purpose of the paper is to correlate the detrimental effect of atmospheric moisture with the aging behaviour of sulphide MOFs. We have undertaken a detailed study of components contributing to optical aging using infrared spectroscopy and we report results on real time monitoring of this optical aging in As 2 S 3 MOFs. The transmission spectra were systematically registered until sixteen days of exposure under ambient thermal and hygrometric conditions. An estimation of content of absorbing species was calculated based on their attenuation measurements and their extinction coefficient. Finally, a preventive solution allows reducing aging kinetics and controlling resulting effects. 2. Samples preparation. The highly pure As 2 S 3 ingots were prepared by the conventional melt quenching method under vacuum inside silica ampoule using elemental highly pure starting products. Sulphur and arsenic were loaded into silica glassware and subjected to purification process under vacuum prior to their enclosing in the synthesis ampoule. Synthesis ampoule was loaded into a rocking furnace and heated up to the synthesis temperature for several hours. The final glass rod was obtained after quenching the melt and annealing the glass around the glass transition temperature. The mechanical drilling technique previously developed on chalcogenide glass in our lab permits to prepare the preform which is then drawn into suspended core MOF with specific parameters adapted for ease handling and technical requirements. The detailed used procedures have been already described elsewhere [19, 21, 22]. The fibre has 310 µm outer diameter and 10 µm of core diameter. No external coating is applied. Figure 51 shows a cross section picture of tested fibre captured by means of Scanning Electron Microscopy (SEM). 137

 spectrometer was used to obtain the transmission spectra. Its source is an external halogen lamp emitting in the 0.")
160 Part 3: Optical, Topological and Structural Aging in As 2 S 3 Microstructured Optical Fibers and Impact on Mid-Infrared Supercontinuum Spanning Article 1 Figure 51: Profile of the tested chalcogenide As 2 S 3 suspended-core fibre captured by means of SEM. 3. Experimental measurements. The transmission spectra were recorded for wavelengths from 1.0 µm to 3.9 µm on 2.80 m of suspended core MOF sample. Measurements were carried out over 16 days at temperature ranging from 20 C to 26 C and relative humidity (RH) varying between 50 and 60%. A NICOLET 6700 Fourier Transformed InfraRed (FTIR) spectrometer was used to obtain the transmission spectra. Its source is an external halogen lamp emitting in the µm range, providing higher output power than the optical source initially integrated in the spectrophotometer and allowing performing successfully this study on MOF sample within the range of interest. The MOF was mounted onto 3 axis holder in order to optimize light coupling exclusively in the MOF core. An infrared camera is used at the output end of the fibre to ensure that light is effectively guided in the core of the MOF only. This is important to stultify the possibility of any significant contribution of the fibre clad in the aging process since the fibre is not coated. At the input end a reflective objective is used to avoid chromatic effect. The beam transmitted along the fibre core is focused into an In-Sb detector using an optimal aspheric AMTIR lens. Note that previous in-situ experiments have proved the stability of the measurement system through the experimental period. 138
161 Part 3: Optical, Topological and Structural Aging in As 2 S 3 Microstructured Optical Fibers and Impact on Mid-Infrared Supercontinuum Spanning Article 1 4. Experimental results and discussions Optical aging and speciation of absorbing species in As 2 S 3 MOF. Figure 52 shows the ratio of As 2 S 3 MOF transmission spectra measured over time in conditions as described above. The transmission spectra (T t ) registered at different time are normalized to the initial one (T 0 ) plotted shortly after fibre drawing. Therewith, dramatic degradation of the optical transmission is observed in the whole transparency window over time. Furthermore, for 16 days of exposure, a significant decrease at a rate of 90% (resp. 40%) is registered at 1.0 µm (resp. 2.4 µm) transmission wavelength, whereas for the same 16 days exposure period, 15% average decrease is noted in the region above 3.3 µm. This phenomenon has been correlated to local structural modifications that occur on the surface of the fibre core such as cracks and roughness [9, 23]. In addition to the surface defects, nucleation and growth of nanometre and micrometre-sized particles at the exposed surface may induce additional scattering losses. The impact of these effects is more severe in the short wavelengths range because of the dimensions of concerning defects [10, 24, 25]. The growth and the contribution of these defects were unequivocally demonstrated in our previous study [16]. Normalized Transmission Tt/Tt0 (a.u.) 1,0 0,8 0,6 0,4 0,2 0,0 (a) T(t0) T(3h) T(4h) T(5h) T(6h) T(24h) T(29h) T(46h) 1,2 1,6 2,0 2,4 2,8 3,2 3,6 Wavelength (µm) Normalized Transmission Tt/T t0 (a.u.) 1,0 0,8 0,6 0,4 0,2 (b) 0,0 1,0 1,5 2,0 2,5 3,0 3,5 Wavelength (µm) T(t0) T(46h) T(52h) T(127h) T(192h) T(384h) Figure 52: Transmission spectra registered on As 2 S 3 MOF with amplification of absorption bands for an exposition time of (a) 0 to 46 h (b) 46 to 384 h. The OH extrinsic absorption bands are inherent to chalcogenide glasses as for many other glasses. The combination of different vibration modes (stretching and bending) of weakly H-bonded OH groups and free OH in the glass, provide absorption bands located at well- 139
162 Part 3: Optical, Topological and Structural Aging in As 2 S 3 Microstructured Optical Fibers and Impact on Mid-Infrared Supercontinuum Spanning Article 1 defined wavelengths. Figure 52 shows the set of fundamental as well as combinations of OH and SH absorption peaks evolving in time. Moreover, new time-dependent absorption peaks arise over time. For sake of clarity, the results are selected according to their time evolution (Figure 52 (a) and Figure 52(b)). Figure 52 (a) shows a highly deleterious impact of moisture on fibre over the first 24 h. The transmissions severely decreases at characteristic absorption bands centred on 2.77 µm and 2.84 µm. These characteristic bands can be assigned to the vibration modes of OH bonds in isolated adsorbed H 2 O molecules [26-34]. At these wavelengths, OH absorption reaches 40% (resp. 33%) in less than 6 h and continues to rise until 90% (resp. 85%) after 24 h before reaching the detection limits after 46 h of storage in ambient conditions. These facts reflect a severe water-sorption on the surface of the guiding medium. Consequently, the first aging process corresponds to the adsorption of water molecules on the surface of the core of the MOF, where water molecules are weakly bonded to glass network. The water comes from the ambient atmosphere present in the holes surrounding the core of the MOF. Note that at this stage, no dramatic decrease is registered on transmission window despite the almost 20% of transmission loss below 1.3 µm. Following this early extinction of light signal around 2.8 µm, a gradual broadening of the absorption band occurs upon exposure time to natural atmosphere (Figure 52 (b)). This enlargement progress to the short wavelength side more than the opposite side. It reaches a maximum width of 800 nm centred at 2.8 µm after 384 h. This phenomenon is explained by the participation of the combination of different vibration modes of weakly H-bonded OH and free OH bonds, which are embedded under the overall peak. It is also reported in the literature that SH and OH absorption bands may occur above 3.0 µm [26]. Thus, the shift of the absorption signature towards 3.2 µm is the results of the implication of SH vibration modes at 3.11 µm [33] and vibration modes at 3.18 µm that we assume due to molecular water [9]. The survey of transmission spectra of tested MOF over time verifies thus a dramatic deviation of molecular water absorption band. However, additional vibration components remain embedded under the whole band. In order to discern and to attribute the set of vibration components involved in the aging process, a careful fitting of experimentally plotted spectra was conducted. The whole spectra have been fitted, assuming different peaks specific to 140
163 Part 3: Optical, Topological and Structural Aging in As 2 S 3 Microstructured Optical Fibers and Impact on Mid-Infrared Supercontinuum Spanning Article 1 different vibration modes previously reported for As 2 S 3 glasses [9, 26-37] and summarized in Table 4. Each spectrum was subjected for background correction by subtracting a linear background between the long and short wavelength edges of concerned peaks. Figure 53 shows a typical ratio (T t /T 0 ) of transmission spectrum after 32 h and 103 h respectively. Figure 54 shows the evolution of spectra over time between 4 h and 32 h, where spectra have been subjected to the fitting process with Gaussian components. We arranged different scales related to the spectra for better contrast. In Figure 53 (a) corresponding to 4 h of MOF exposure to ambient atmosphere, the overall spectrum essentially consists in three peaks. The 2.77 µm and 2.84 µm absorptions are caused by the fundamental symmetric stretching vibration bands of OH bonds in molecular-adsorbed H 2 O [37]. The 2.91 µm absorption band is related to OH groups tightly linked to the glass network trough arsenic (Table 4) [33]. Figure 54 (a)-(b) show resolved spectra for respectively 4 h and 6 h of exposure, where the absorption bands are unequivocally identified. In order to keep a good agreement between the experimental spectra and the fitting results for longer exposure times (24h and 32h, Figure 54 (c)-(d)), it was necessary to take into account the peak at 3.0 µm attributed to OH absorption bands in As 2 S 3 glass [31]. The contribution of this absorption peak is clearly seen on Figure 54 (c)-(d). The results of fitting allow estimating the peak height of each Gaussian component and consequently estimating the contribution of each vibration mode in the overall spectrum. With increasing exposure time, new absorption peaks arise and over 24 h of exposure, peaks at 2.54 µm, 2.63 µm, 2.70 µm and 3.0 µm are present (Figure 54 (c)). The 2.63 µm [35, 36], 2.70 µm [35, 36] and 3.0 µm [31] bands are caused by OH vibrations modes (Table 4). The 2.54 µm absorption band is assigned to the combination of vibrations modes of hydrogenous tightly linked with the sulphur atoms of the glass network [32]. The spectrum continues to evolve upon exposure. Eight hours later (Figure 54 (d)), new peaks centred at 3.11 µm and 3.18 µm have appeared. Similar behaviour is registered for 1.92 µm absorption peak simultaneously, which appears after 24 h of exposure and then continues to grow. The 3.11 µm absorption band is assigned to the stretching vibration mode of S-H bond [33], the 141
164 Part 3: Optical, Topological and Structural Aging in As 2 S 3 Microstructured Optical Fibers and Impact on Mid-Infrared Supercontinuum Spanning Article µm peak is related to molecular water absorption [9], whereas the 1.92 µm corresponds to the combination of the fundamental OH symmetric stretching vibration and the vibration due to hydroxyl strongly bonded to arsenic of the glass network (Table 4) [33]. It appears that an active dissociation mechanism occurs at the glass surface. It leads to produce =As-O-H and =As-S-H bonds with their absorption signature at characteristic wavelengths. Table 4: Assignment of absorption bands in As 2 S 3 chalcogenide glass in the µm range in As 2 S 3 glass. [2, 10, 27-37] 1/λ (cm -1 ) λ (µm) Assignment Vibrations of molecular water OH vibrations in As 2 S 3 Vibrations of =As-O-H SH vibrations in As 2 S Vibrations of =As-S-H From all these considerations, the proposed mechanism of chemical aging is the following: in the first hours of As 2 S 3 MOFs exposure to ambient atmosphere, growing water adsorption occurs at the surface of the MOF core, because of the atmospheric steam present in the holes surrounding the fibre core. This adsorption leads progressively to a chemical reaction between adsorbed water and the sulphide glass in which =As-S-As= bridges are broken to form As-OH and H-S-As bonds. 142
165 Part 3: Optical, Topological and Structural Aging in As 2 S 3 Microstructured Optical Fibers and Impact on Mid-Infrared Supercontinuum Spanning Article 1 Normalized Transmission T 32h /T t0 (a.u.) Wavenumber (cm -1 ) ,0 0,8 0,6 0,4 0,2 (a) 0,0 1,0 1,5 2,0 2,5 3,0 3,5 Wavelength (µm) Normalized Transmission T 103h /T t0 (a.u.) Wavenumber (cm -1 ) ,0 0,8 0,6 0,4 0,2 (b) 0,0 1,0 1,5 2,0 2,5 3,0 3,5 Wavelength (µm) Figure 53: Ratio of Near-Infrared spectra after 32 h (a) and 103 h (b) of exposure, showing sloping background and the linear correction adopted for background subtraction. Absorption at 4 hours (a.u.) 0,25 0,20 0,15 0,10 0,05 0,00 Wavenumber (cm -1 ) Cumulative Fit peak Abs (4 h) 2,77 µm 2,84 µm 2,91 µm (a) 2,2 2,4 2,6 2,8 3,0 3,2 Wavelength (µm) Absorption at 6 hours (a.u.) 0,4 0,3 0,2 0,1 0,0 Wavenumber (cm -1 ) (b) Cumulative Fit Peak Abs (6 h) 2,77 µm 2,84 µm 2,91 µm 2,5 2,6 2,7 2,8 2,9 3,0 3,1 3,2 Wavelength (µm) Absorption at 24 hours (a.u.) 1,0 0,8 0,6 0,4 0,2 0,0 Wavenumber (cm -1 ) Cumulative Fit peak Abs (24 h) 1.92 µm 2.54 µm 2.63 µm 2.7 µm 2.77 µm 2.84 µm 2.91 µm 3.0 µm (c) 1,8 2,1 2,4 2,7 3,0 3,3 Wavelength (µm) 1,8 2,1 2,4 2,7 3,0 3,3 Wavelength (µm) Figure 54: Deconvoluted absorption spectra over time scale (a) 4 h, (b) 6 h, (c) 24 h and (d) 32 h respectively. Absorption at 32 hours (a.u.) 1,0 0,8 0,6 0,4 0,2 0,0 Wavenumber (cm -1 ) (d) Cumulative Fit peak Abs (32 h) 1.92 µm 2.54 µm 2.63 µm 2.7 µm 2.77 µm 2.84 µm 2.91 µm 3.0 µm 3.11 µm 3.18 µm 143
166 Part 3: Optical, Topological and Structural Aging in As 2 S 3 Microstructured Optical Fibers and Impact on Mid-Infrared Supercontinuum Spanning Article Time evolution of OH attenuation. Figure 55 illustrates the temporal evolution of additional attenuation due to aging, added to the initial optical loss spectrum of the as-drawn As 2 S 3 suspended core fiber, during storage in ambient atmosphere ranging from 1 h to 384 h, for 2.8 meters of fiber. The attenuation at any time (t) is estimated using the relationship: t db I t 10 log I0 where I t and I 0 are the transmitted intensity at (t) and (t 0 ) respectively. (26) In the long wavelength range, the attenuation is dominated by the absorption of extrinsic impurities. After 6 h of exposure, 2.5 db are added to the initial attenuation at 2.77 µm. This value increases to reach 11dB, 23 h later. Finally, the first 24 h are sufficient to severally attenuate the signal. Attenuation (db) Wavenumber (cm -1 ) h 3h 4h 5h 6h 27h 29h 46h 72h 103h 192h 230h 336h 384h 1,0 1,5 2,0 2,5 3,0 3,5 Wavelength (µm) Figure 55: Additional attenuation for 2.8m of As 2 S 3 MOF as a function of exposure time to ambient conditions. These dynamics continue to develop and reach the detection limits of our detection device after 46 h, thus plotted spectra become noisy and follow evolution of peaks at 2.77 and 2.84 µm becomes impossible. However, the overall peak steadily extends over time due to the emergence of new absorption components as described above. Previous fitting procedure can 144
167 Part 3: Optical, Topological and Structural Aging in As 2 S 3 Microstructured Optical Fibers and Impact on Mid-Infrared Supercontinuum Spanning Article 1 be exclusively performed for resolved peaks. This explains the possible treatment of absorption peaks around 2.8 µm until 29 h, before they become noisy after 46 h of exposure to aging factors. Since 1.92 µm and 1.44 µm absorption peaks remains resolved until the end of the study, they allowed a continuous survey of their evolution. The fitting of experimentally plotted spectrum allows then to estimate the contribution of each vibration under the cumulative absorption peak. Resulting attenuations of each component are listed in Table 5. These dynamics continue to develop and reach the detection limits of our detection device after 46 hours, thus plotted spectra become noisy and follow evolution of peaks at 2.77 and 2.84 µm becomes impossible. However, the overall peak steadily extends over time due to the emergence of new absorption components as described above. Simultaneously to this emergence, the background evolves in the short wavelength side. This is attributable to aging dynamics governed by the scattering losses (see paragraph 5.1) [10, 11, 24]. Table 5: Attenuations for each deconvoluted peak after background corrections, for 2.8 meters of As 2 S 3 MOF. Attenuation (db) T(h) 1.44 µm 1.92 µm 2.54 µm 2.63 µm 2.7 µm 2.77 µm 2.84 µm 2.91 µm 3.0 µm 3.11 µm 3.18 µm
168 Part 3: Optical, Topological and Structural Aging in As 2 S 3 Microstructured Optical Fibers and Impact on Mid-Infrared Supercontinuum Spanning Article 1 Attenuation (db) 12 (a) µm 2.91µm Linear fit xt h xt h Attenuation (db) Time (h) Time (h) Figure 56: Kinetic of peaks height evolution of different OH groups vibration modes (b) 1.92µm Linear fit xt h Distribution of absorbing species along the fibre. The previous analyses indicate that aged As 2 S 3 MOF contains hydroxyl groups from water adsorbed on the MOF core as well as tightly bonded hydroxyl groups coming through chemical reaction between adsorbed water and the sulphide glass. The water comes from atmospheric steam which diffuses from the MOF's extremities in the holes along the core. We therefore investigate the spatial distribution of absorbing species along the fibre. To that purpose, the following experiment was carried out on the MOF exposed to ambient atmosphere during 384 h. Taking advantage of the cut back technique, a series of absorption spectra were registered along the tested fibre at different point from the output edge (Figure 57). Admitting that the diffusion dynamic is similar from both ends, our study has been limited to one half of the concerned fibre. From these spectra we obtain the attenuation α Sn of different sections (S n = L n-1 - L n ) along the MOF from the output to the middle, using the relationship: Sn 10 T n log L n 1 Ln Tn 1 (db/m) (27) L = L 0 L n, L = L n L n+1, L 0 =2.8 m is the initial length of the fibre, L n-1 and L n are the considered length where n varies between 1 and 4, T n-1 and T n correspond to the transmission registered for L n-1 and L n respectively. The attenuation spectra of fibre sections S 1 and S 4 are 146
169 Part 3: Optical, Topological and Structural Aging in As 2 S 3 Microstructured Optical Fibers and Impact on Mid-Infrared Supercontinuum Spanning Article 1 presented Figure 58. One can note that even if the different removed fibers sections are only of several centimeters long, the evolution of the recorded intensities is significant because of the large attenuation effect of OH groups, which makes the cut back technique relevant in this case. Figure 57: Schematic representation of fibre sections considered for studying the longitudinal distribution of absorbing species. Attenuation (db/m) S1 = 7 cm (a) 0 1,5 2,0 2,5 3,0 3,5 Wavelength (µm) Figure 58: Attenuation spectra of sections S 1 and S 4 of the 384 h aged As 2 S 3 MOF, located at different distances from the fibre's output: (a) Attenuation of section S 1, the first 7 cm of the MOF; (b) Attenuation of section S 4 located at ~100 cm from the MOF end. Attenuation (db/m) S4 =48 cm (b) 0 1,5 2,0 2,5 3,0 3,5 Wavelength (µm) The spectra illustrate a non-homogenous repartition of the hydroxyl groups along the aged MOF. By moving deeper in the fibre from an edge, the absorption in the µm region (due to molecular water, Table 4) as well as absorption around 1.92 µm (due to OH groups 147
170 Part 3: Optical, Topological and Structural Aging in As 2 S 3 Microstructured Optical Fibers and Impact on Mid-Infrared Supercontinuum Spanning Article 1 tightly linked to the glass network, (Table 4) decrease. After 384h of exposure to room atmosphere, near the MOF edge in the first 7 centimetres (section S 1 ), the attenuation due to OH groups reaches around 50 db/m at 1.92 µm, whereas it exceeds the 60 db/m threshold in the µm range. It decreases to ~3 db/m (resp. ~6 db/m) at 1.92 µm (resp. in the µm region), near the middle of the MOF, in section S 4 at ~1 m from its edge. In both cases, absorptions in µm region are strong, and the transmitted light signal is weakly detected by the detection device, explaining thus the noisy aspect of the attenuation spectra in this wavelength range. The distance-dependent nature of the hydroxyl-groups attenuation at 1.92 µm is more clearly presented on Figure 59, where the corresponding variation of OH groups' concentration with the position in the MOF is also indicated. The quantitative estimation of the hydroxyl absorbing species is given by Equation 28: OH ppm db m (28) Where (db.m -1.ppm -1 ) is the characteristic extinction coefficient of the corresponding absorption band. A previous knowledge of hydroxyl groups' extinction coefficient of corresponding vibration modes remains mandatory. Numerous research activities were devoted to elucidate the OH absorption and determine its absolute content in silica glasses [38, 39]. Such detailed studies on sulphide glasses were not reported. Thus, in order to estimate the OH content in As 2 S 3 glasses, we use the values of (db.m -1.ppm -1 ) calculated from the molar absorptivity ε (l.mol -1 cm -1 ) of OH groups in silica glasses. According to Stolper and al. [37], the molar absorptivity of OH groups around 1.9 µm calculated in silica glass from absorbance measurements is = 1.8 l.mol -1 cm -1. We assume the same value for in As 2 S 3 glass. The extinction coefficient (cm -1.ppm -1 ), corresponding to an OH concentration of 1 ppm weight in As 2 S 3 glassis then given by: cm. ppm l. mol. cm 10. As S M OH (29) Where ρ As2S3 = g/l is the density of As 2 S 3 glass and M OH =17 g.mol -1 is the OH molar mass. Here = cm -1.ppm -1. For optical fibers, the extinction coefficient is preferably expressed in db.m -1.ppm -1 and directly from attenuation and absorbance definitions: 148
171 Part 3: Optical, Topological and Structural Aging in As 2 S 3 Microstructured Optical Fibers and Impact on Mid-Infrared Supercontinuum Spanning 1 1 db. m. ppm 1000 cm 1. ppm 1 Article 1 (30) Here = (db.m -1.ppm -1 ). This value allows to calculate the OH groups' concentration in the different section S n of the fibers according Equation.28 and reported on Figure 59. Finally, for 384h of exposure, the most deleterious effect of atmospheric moisture occurs, from an end, over the first centimetres of the As 2 S 3 MOFs which contain ~147 ppm of OH tightly bonded to the sulphide glass. The OH concentration then decreases exponentially towards the middle of the fibre to reach a minimum of ~9 ppm at the fibre mid length. Figure 59 (a) illustrates the experimentally measured fiber losses and calculated OH content cumulated over exposure time for one half of the fiber. It is worth to note that throughout the experiment, both ends of the tested fiber were exposed to the same atmospheric conditions (pressure, relative humidity, temperature). In addition, the fiber exhibits constant holes dimensions along its length. Then, we can wisely assume that the diffusion mechanism is the same from both sides and Figure 59 (b) reproduces the similar evolution of losses and OH content for the second half of the fibre. Finally, the distribution of all OH impurities along the fiber exhibits two maxima located at the input and the output ends of the fiber and a minimum in the middle. Attenuation (db/m) 40 Losses at 1,92 µm [OH] (a) Fit of OH content Fit of attenuation Distance from the fiber edge (cm) OH content (ppm) OH content (ppm) 200 Fit of OH content (b) Fit of attenuation Distance from the fiber edge (cm) Figure 59: Attenuation (black) of 1.92 µm absorption band and absolute content (blue) of corresponding OH groups as a function of distance from the fibre edge. Results reported for an As 2 S 3 MOF exposed for 384 hours to room atmosphere Attenuation (db/m) 149
172 Part 3: Optical, Topological and Structural Aging in As 2 S 3 Microstructured Optical Fibers and Impact on Mid-Infrared Supercontinuum Spanning Article 1 One of the main goals of As 2 S 3 MOFs studied here lies in the possibility to achieve an efficient nonlinear interaction as the light signal propagates in the fibre, and especially to enable an important spectral broadening known as supercontinuum generation. These nonlinear optical processes take place within the first centimetres, even the first millimetres of the As 2 S 3 MOFs [21, 40]. To achieve such efficient interactions, low optical losses are then required in this part of the fibre. However, the rapid and important contamination of the edge of these waveguides by OH absorbing groups, that we demonstrate in this work, sharply limits their efficiency and explains for IR SC extension limitation we previously observed [16, 40]. Thus, precautions and protection of the core MOFs, immediately after drawing process are necessary Prevention of aging. Based on the foregoing, a control of the diffusion of atmospheric steam in the holes of the MOF is required in order to limit the aging process. For that purpose we have airproofed the fibre ends by means of a methacrylate-based polymer. The fibre ends were soaked in the liquid polymeric solution, and then let to polymerize in free atmosphere at room temperature. Thereafter, rigorous polishing of the fibre facets allows to get rid of the thin polymer layer formed on the cross section of the fibre and to reach the core of the fibre. Herein, the diffusion of the polymer through the holes is ensured by capillarity. In order to enhance this process, polymer viscosity was adjusted using water-free solvent. Thanks to this technique, the holes of the MOF were sealed while the core of the fibre remains free for MOF's infrared transmission measurements as a function of time to investigate the evolution of absorption peaks related with OH pollution. Figure 60 presents several absorption spectra registered on 50 cm length of an As 2 S 3 MOF exposed until 216 h to room atmosphere. These spectra maintain a remarkable stability and no evolution of OH related absorption bands is noticed. Note that exposure conditions are similar to those reported for the previous aging study. These results indicate that it is possible to protect the MOF core from OH aging. What's more, they confirm that the aging of sulphide MOF is due to atmospheric moisture diffusion in the holes of the fibre. 150
173 Part 3: Optical, Topological and Structural Aging in As 2 S 3 Microstructured Optical Fibers and Impact on Mid-Infrared Supercontinuum Spanning Article 1 2,0 Absorbance 1,5 1,0 0,5 A (t0) A (24 h) A (12 h) A (192 h) A (216 h) 0,0 1,0 1,5 2,0 2,5 3,0 3,5 wavelength (µm) Figure 60: IR transmission spectra of airproofed As 2 S 3 MOF as a function of time exposure to ambient atmosphere. 5. Conclusion We report a detailed IR spectroscopic study of unsuitable process of atmospheric moisture adsorption and reaction onto the core surface of As 2 S 3 chalcogenide microstructured optical fibres, leading to incorporation of absorbing OH groups weakly as well as tightly bonded to the MOFs core, which finally results in important additional losses. A detailed assignment of absorption bands and corresponding vibration modes is presented. The continuous evolution of the concentrations of hydroxyl groups in the MOFs as a function of exposure period is proved at least until 384h of exposure. The observed changes upon exposure period show that the deleterious effect of moisture, which corresponds to diffusion of atmospheric steam in the holes of the MOF, occurs rapidly over the first few hours and is the most important in the early centimetres of the MOF. This early part of the fibre is of major importance for implementation of non-linear optical effects such as supercontinuum generation. In order to protect the MOF core from this aging process a first successful attempt to airproof the MOF is presented herein. Acknowledgments. We acknowledge the financial support from the Conseil Régional de Bourgogne through the Photcom PARI program, as well as from the French DGA. This project has been performed in cooperation with the Labex ACTION program (contract ANR-11-LABX ). 151
174 Part 3: Optical, Topological and Structural Aging in As 2 S 3 Microstructured Optical Fibers 6. References and Impact on Mid-Infrared Supercontinuum Spanning References - Article 1 1. J. Kohl-Landgraf, J.-E. Nimsch, and J. Wachtveitl, "LiF, an underestimated supercontinuum source in femtosecond transient absorption spectroscopy," Optics Express 21, (2013). 2. S. V. Smirnov, J. D. Ania-Castanon, T. J. Ellingham, S. M. Kobtsev, S. Kukarin, and S. K. Turitsyn, "Optical spectral broadening and supercontinuum generation in telecom applications," Optical Fiber Technology 12, (2006). 3. G. E. Snopatin, V. S. Shiryaev, V. G. Plotnichenko, E. M. Dianov, and M. F. Churbanov, "High-purity chalcogenide glasses for fiber optics," Inorganic Materials 45, (2009). 4. J. H. V. Price, T. M. Monro, H. Ebendorff-Heidepriem, F. Poletti, P. Horak, V. Finazzi, J. Y. Y. Leong, P. Petropoulos, J. C. Flanagan, G. Brambilla, F. Xian, and D. J. Richardson, "Mid-IR supercontinuum generation from nonsilica microstructured optical fibers," IEEE Journal of Selected Topics in Quantum Electronics 13, (2007). 5. P. J. Allen, B. R. Johnson, and B. J. Riley, "Photo-oxidation of thermally evaporated As 2 S 3 thin films " Journal of Optoelectronics and Advanced Materials 7, (2005). 6. R. Y. Golovchak, A. Kozdras, and O. I. Shpotyuk, "Physical ageing in glassy As-Se induced by above-bandgap photoexposure," Solid State Communications 145, (2008). 7. J. S. Berkes, S. W. I. Jr., and W. J. Hillegas, "Photodecomposition of amorphous As 2 Se 3 and As 2 S 3," Journal of applied Physics 42, (1971). 8. F. Charpentier, M. Dussauze, M. Cathelinaud, G. Delaizir, E. I. Kamitsos, J. L. Adam, B. Bureau, and V. Nazabal, "Aging process of photosensitive chalcogenide films deposited by electron beam deposition," Journal of Alloys and Compounds 509, (2011). 9. Y.-F. Niu, J.-P. Guin, A. Abdelouas, T. Rouxel, and J. Troles, "Durability of an As 2 S 3 chalcogenide glass: Optical properties and dissolution kinetics," Journal of Non- Crystalline Solids 357, (2011). 10. Y.-F. Niu, J.-P. Guin, T. Rouxel, A. Abdelouas, J. Troles, and F. Smektala, "Aqueous corrosion of the GeSe 4 chalcogenide glass: surface properties and corrosion mechanism," Journal of the American Ceramic Society 92, (2009). 11. M. M. Smedskjaer, Y. Yue, J. Deubener, H. P. Gunnlaugsson, and S. Marup, "Modifying glass surfaces via internal diffusion," Journal of Non-Crystalline Solids 356, (2010). 152
175 Part 3: Optical, Topological and Structural Aging in As 2 S 3 Microstructured Optical Fibers and Impact on Mid-Infrared Supercontinuum Spanning References - Article M. F. Churbanov, V. S. Shiryaev, V. V. Gerasimenko, A. A. Pushkin, I. V. Skripachev, G. E. Snopatin, and V. G. Plotnichenko, "Stability of the optical and mechanical properties of chalcogenide fibers," Inorganic Materials 38, (2002). 13. R. Y. Golovchak, S. A. Kozyukhin, A. Kozdras, O. I. Shpotyuk, and V. M. Novotortsev, "Physical aging of chalcogenide glasses," Inorganic Materials 46, (2009). 14. P. Toupin, L. Brilland, D. Mechin, J. Adam, and J. Troles, "Optical aging of chalcogenide microstructured optical fibers," Journal of Lightwave Technology, 32, (2014). 15. R. J. Curry, S. W. Birtwell, A. K. Mairaj, X. Feng, and D. W. Hewak, "A study of environmental effects on the attenuation of chalcogenide optical fibre," Journal of Non- Crystalline Solids 351, (2005). 16. O. Mouawad, F. Amrani, B. Kibler, J. Picot-Clémente, C. Strutynski, J. Fatome, F. Désévédavy, G. Gadret, J.-C. Jules, O. Heintz, E. Lesniewska, and F. Smektala, "Impact of optical and structural aging in As 2 S 3 microstructured optical fibers on mid-infrared supercontinuum generation," Optics Express 22, (2014). 17. V. Q. Nguyen, J. S. Sanghera, B. Cole, P. Pureza, F. H. Kung, and I. D. Aggarwal, "Fabrication of arsenic sulfide optical fiber with low hydrogen impurities," Journal of the American Ceramic Society 85, (2002). 18. V. Q. Nguyen, J. S. Sanghera, P. Pureza, F. H. Kung, and I. D. Aggarwal, "Fabrication of arsenic selenide optical fiber with low hydrogen impurities," Journal of the American Ceramic Society 85, (2002). 19. M. El-Amraoui, J. Fatome, J. C. Jules, B. Kibler, G. Gadret, C. Fortier, F. Smektala, I. Skripatchev, C. F. Polacchini, Y. Messaddeq, J. Troles, L. Brilland, M. Szpulak, and G. Renversez, "Strong infrared spectral broadening in low-loss As-S chalcogenide suspended core microstructured optical fibers," Optics Express 18, (2010). 20. J. Troles, Q. Coulombier, G. Canat, M. Duhant, W. Renard, P. Toupin, L. Calvez, G. Renversez, F. Smektala, M. El Amraoui, J. L. Adam, T. Chartier, D. Mechin, and L. Brilland, "Low loss microstructured chalcogenide fibers for large non linear effects at 1995 nm," Optics Express 18, (2010). 21. O. Mouawad, J. Picot-Clémente, F. Amrani, C. Strutynski, J. Fatome, B. Kibler, F. Désévédavy, G. Gadret, J. C. Jules, D. Deng, Y. Ohishi, and F. Smektala, "Multioctave midinfrared supercontinuum generation in suspended-core chalcogenide fibers," Optics Letters 39, (2014). 22. M. El-Amraoui, G. Gadret, J. C. Jules, J. Fatome, C. Fortier, F. Désévédavy, I. Skripatchev, Y. Messaddeq, J. Troles, L. Brilland, W. Gao, T. Suzuki, Y. Ohishi, and F. Smektala, "Microstructured chalcogenide optical fibers from As 2 S 3 glass: towards new IR broadband sources," Optics Express 18, (2010). 153
176 Part 3: Optical, Topological and Structural Aging in As 2 S 3 Microstructured Optical Fibers and Impact on Mid-Infrared Supercontinuum Spanning References - Article D. Franta, L. Zajickova, M. Karaskova, O. Jarek, D. Necas, P. Klapetek, and M. Valtr, "Optical characterization of ultrananocrystalline diamond films," Diamond and Related Materials 17, (2008). 24. D. M. Kane, R. J. Chater, D. B. Gore, and D. S. McPhail, "Corrosion at the surface of chalcogenide glass microspheres," Journal of Optics 14, (2012). 25. S. Hendy, "Light scattering in transparent glass ceramics," Applied Physics Letters 81, (2002). 26. V. Kokorina, Glasses for infrared optics (The CRC Press, 1996). 27. A. P. Paiuk, A. V. Stronski, N. V. Vuichyk, A. A. Gubanova, T. A. Krys kov, and P. F. Oleksenko, "Mid-IR impurity absorption in As 2 S 3 chalcogenide glasses doped with transition metals," Semiconductor Physics, Quantum Electronics & Optoelectronics 15, (2012). 28. M. S. Iovu, S. D. Shutov, A. M. Andriesh, E. I. Kamitsos, C. P. E. Varsamis, D. Furniss, A. B. Seddon, and M. Popescu, "Spectroscopic studies of bulk As 2 S 3 glasses and amorphous films doped with Dy, Sm and Mn " Journal of Optoelectronics and Advanced Materials 3, (2001). 29. B. Frumarova, P. Nemec, M. Frumar, and J. Oswald, "Synthesis and properties of Ge-Sb- S: NdCl 3 glasses," Semiconductors 32, (1998). 30. T. Kavetskyy, R. Golovchak, O. Shpotyuk, J. Filipecki, and J. Swiatek, "On the compositional trends in IR impurity absorption of Ge As(Sb) S glasses," Journal of Optoelectronics and Advanced Materials 6, (2004). 31. T. S. Kavetskii, V. D. Pamukchieva, and O. I. Shpotyuk, "Concentration dependence of impurity absorption in chalcogenide glasses of the Ge-Sb-S system," Journal of Applied Spectroscopy 67, (2000). 32. C. T. Moynihan, P. B. Macedo, M. S. Maklad, R. K. Mohr, and R. E. Howard, "Intrinsic and impurity infrared absorption in As 2 Se 3 glass," Journal of Non-Crystalline Solids 17, (1975). 33. T. Kanamori, Y. Terunuma, S. Takahashi, and T. Miyashita, "Transmission loss characteristics of As 40 S 60 and As 38 Ge 5 Se 57 glass unclad fibers," Journal of Non- Crystalline Solids 69, (1985). 34. T. S. Kavetskyy, A. P. Kovalskiy, V. D. Pamukchieva, and O. I. Shpotyuk, "IR impurity absorption in Sb 2 S 3 -GeS 2 (Ge 2 S 3 ) chalcogenide glasses," Infrared Physics & Technology 41, (2000). 154
177 Part 3: Optical, Topological and Structural Aging in As 2 S 3 Microstructured Optical Fibers and Impact on Mid-Infrared Supercontinuum Spanning References - Article G. Navarra, I. Iliopoulos, V. Militello, S. G. Rotolo, and M. Leone, "OH-related infrared absorption bands in oxide glasses," Journal of Non-Crystalline Solids 351, (2005). 36. V. G. Plotnichenko, V. O. Sokolov, and E. M. Dianov, "Hydroxyl groups in high-purity silica glass," Journal of Non-Crystalline Solids 261, (2000). 37. E. Stolper, "Water in silicate glasses: An infrared spectroscopic study," Contributions to Mineralogy and Petrology 81, 1-17 (1982). 38. J. M. Stone, and J. C. Knight, "From zero dispersion to group index matching: How tapering fibers offers the best of both worlds for visible supercontinuum generation," Optical Fiber Technology 18, (2012). 39. O. Humbach, H. Fabian, U. Grzesik, U. Haken, and W. Heitmann, "Analysis of OH absorption bands in synthetic silica," Journal of Non-Crystalline Solids 203, (1996). 40. I. Savelii, O. Mouawad, J. Fatome, B. Kibler, F. Désévédavy, G. Gadret, J. C. Jules, P. Y. Bony, H. Kawashima, W. Gao, T. Kohoutek, T. Suzuki, Y. Ohishi, and F. Smektala, "Mid-infrared 2000-nm bandwidth supercontinuum generation in suspended-core microstructured Sulfide and Tellurite optical fibers," Optics Express 20, (2012). 155
178 Part 3: Optical, Topological and Structural Aging in As 2 S 3 Microstructured Optical Fibers and Impact on Mid-Infrared Supercontinuum Spanning 156
179 Part 3: Optical, Topological and Structural Aging in As 2 S 3 Microstructured Optical Fibers and Impact on Mid-Infrared Supercontinuum Spanning Article 2 III. Article 2 This manuscript is submitted to Optical Materials journal Further Demonstration of Atmospheric Optical Aging and Surface Degradation in As 2 S 3 Optical Fibers. O. Mouawad, P. Vitry, C. Strutynski, J. Picot-Clémente, F. Désévédavy, G. Gadret, J-C Jules, E. Lesniewska, and F. Smektala * ICB, Laboratoire Interdisciplinaire Carnot de Bourgogne, UMR 6303 CNRS-Université de Bourgogne, 9Av. Alain Savary, BP47870, Dijon, France *Corresponding author: frederic.smektala@u-bourgogne.fr Abstract Microstructured optical fibers (MOF) can be seen as next generation fiber of significance in advancing the compact optics because of its excellent compatibility in integrated optics. However, the degradation of their physicochemical properties limits their efficiency and lifetime. Atmospheric moisture is responsible for the degradation of amorphous systems especially chalcogenide glasses. In the light of previously reported studies, in order to clarify the aging process continuously evolving in sulfide microstructured optical fiber over time, a detailed investigation of this phenomenon has been conducted. The time-dependent transmission and glass chemical deterioration have been studied for As 2 S 3 MOF with regard to their exposure to different atmospheric conditions. Results show a substantial impact of atmospheric moisture through an interaction with the glass network. Significant improvement has been registered by storing the fibers under dry atmosphere. Keywords: Microstructured optical fibers, Fiber losses, Chalcogenide glass, Durability, Corrosion behavior. 157
180 Part 3: Optical, Topological and Structural Aging in As 2 S 3 Microstructured Optical Fibers and Impact on Mid-Infrared Supercontinuum Spanning 1. Introduction Article 2 Chalcogenide glass finds widespread applications as both active and passive optical elements in integrated-optics systems and devices. The chalcogenide vitreous system could be successfully doped with rare earth element, providing thus additional more efficient potential functions [1]. Apart from their bulk optic components, chalcogenide glasses have found various applications in different geometric forms, including fiber form, planar waveguides geometry and microspheres, leading to different applications including infrared laser power transmission, imaging and spectroscopy, chemical sensing [2] or supercontinuum generation (SCG) [3-6]. Indeed, for infrared supercontinuum generation, these glasses are highly suitable because they exhibit a wide transmission window extended further in the IR as well as high third-order non-linearity estimated at two to three order of magnitude greater than silica [7, 8]. Thus, thanks to these combined properties chalcogenide glass fibers have gained attentions and lead to striking achievements [3, 7]. Microstructured fiber geometry allowed to overcome and to adapt the opto-geometrical parameters of the fiber, providing a powerful technique for fabrication of special structure and fibers with tight mode confinement, allowing thus an efficient nonlinear interaction, leading for promising results. Detailed studies allowed a better understanding of the interactions between the glass system and the transmitted light beam [9]. However, extending the current spectrum broadening further in infrared (IR) requires a delicate engineering of the glass optical quality. Ultrapure glasses are needed. Over recent years, the synthesis techniques of chalcogenide glasses have been extensively developed. Well adapted purification and synthesis strategies allow to fabricate low loss fibers [7, 10-15]. Furthermore, optimized fabrication strategies to elaborate glass preforms designed to draw microstructured fibers are well developed to avoid any additional losses [16]. According to Aggrawal and al. [17], efficient supercontinuum generation in chalcogenide microstructured fibers requires optical loss low enough to spread the continuum in the mid-ir, typically less than 1 db/m, a threshold which has been reached by several labs [7, 10-15]. Despite the success of the previous techniques, there is still a number of serious issues that limit the fiber efficiency. Chalcogenide glasses suffer from a shift of their properties in time due to the aging process. During aging process, many physicochemical changes occur. The physical aging changes correspond to structural relaxation. They are generally related to the preparation 158
181 Part 3: Optical, Topological and Structural Aging in As 2 S 3 Microstructured Optical Fibers and Impact on Mid-Infrared Supercontinuum Spanning Article 2 technique of the glass, namely melt quenching process. The chemical aging changes correspond to modification of the local composition of the glass system. Such modifications result from a deleterious reactions process between the glass and the surrounding medium [18-24]. Physicochemical aging studies have been carried out by many researchers over the last years. A detailed durability studies performed on bulk samples were reported by Niu and al. [18, 24]. On the other hand, similar investigations were carried out on other geometries. In this context, the photoinduced aging of chalcogenide films was extensively studied [25-27]. Chalcogenide glass fiber has been also investigated on the long and short term. In frame of these investigations, Churbanov and al. [19] has reported studies performed on the long term scale (up to many years), whereas Curry and al. [20] have reported other studies conducted on the short time scale (few hours up to several days) under extreme conditions. Concerning MOFs, Toupin and al. [21] have briefly reported on optical aging behavior of chalcogenide MOFs with six-holes structure. Among the various chalcogenide compositions covered by these studies, all glass systems were prone to OH contamination, whereas the aging rate depended on the glass composition. Recently, our group has demonstrated [23] and studied [22] the tremendous deterioration of optical quality of three-holes As 2 S 3 suspended core MOFs under ambient atmosphere. Investigations of aging and degradation of MOFs have pointed out a glass hydrolysis process [22, 23]. This process denotes that adsorbed water coming from atmospheric steam undergoes chemical reaction with the glass and locally modifies its composition. This conclusion was essentially based on IR studies of OH groups absorption bands evolution and preliminary AFM and XPS studies [23]. However, the simultaneous evolution of SH groups IR absorptions as well as detailed investigations of glass surface modifications resulting from this process were not presented. The present study focuses then on exploring the aging behavior of As 2 S 3 optical fibers in atmosphere by considering previous parameters, in order to further demonstrate the glass surface hydrolysis process undergone by the fibers. 159


182 Part 3: Optical, Topological and Structural Aging in As 2 S 3 Microstructured Optical Fibers and Impact on Mid-Infrared Supercontinuum Spanning 2. Experimental 2.1. Samples fabrication. Article 2 As 2 S 3 glass was synthesized by the conventional melt quenching technique as detailed elsewhere [16]. High purity elemental arsenic and sulfur in stoichiometric quantities were enclosed under vacuum inside a sealed silica ampoule which was then loaded into a rocking furnace and heated at 700 C for several hours. The melt batch was then water-quenched to glassy, followed by a 12 hours annealing around the glass transition temperature (T g =210 C) for stress revealing allowing sample manufacturing. Resulting glass rod is of 16 mm of diameter and 80 mm in length. The cylindrical glass rod was sliced to two preforms using a diamond saw. The first preform was designed to draw large mode area microstructured fiber. The mechanical drilling technique previously developed on chalcogenide glasses [16] in our lab permits to prepare the preform which is then drawn under dry atmosphere into suspended core fibers with specific parameters adapted for handling and technical requirements. The MOF has 250 µm outer diameter and 8.0 µm of core diameter (Figure 61 (a)). The second preform was mechanically polished in order to conceive rectangular fiber presenting planar surfaces adapted for AFM study. The roughness profile induces by this shaping procedure shows surface defects of maximum height around 80 nm. It is about 10 times lower than that induced by the mechanical drilling technique on the surface of the core, previously measured around the µm scale and reported in [28]. The preform was drawn into rectangular geometry fiber of 300 µm (resp. 370 µm) of height (resp. width). (Figure 61 (b)). a b Figure 61: Cross section profiles of the probed (a) large-core microstructured fiber and (b) rectangular fiber. 160
183 Part 3: Optical, Topological and Structural Aging in As 2 S 3 Microstructured Optical Fibers and Impact on Mid-Infrared Supercontinuum Spanning 2.2. Atomic Force Microscopy (AFM) measurements. Article 2 In the present studies, a NanoScope V MultiMode 8 AFM and a FastScan AFM by Bruker in combination with a home-built sample holder, which provides mechanical fixation capabilities, were used. We have employed PeakForce QNM (Quantitative Nanomechanical Property Mapping) mode which allows quantitative nanomechanical mapping of material properties, including modulus and adhesion, while simultaneously imaging sample topography at high resolution using specific cantilever (Bruker ScanAsyst Air of spring constant k~0.4 N/m) in air. For dynamic, we have used FastScan mode associated with miniaturized Olympus AC10 cantilever (spring constant k=0.1 N/m, resonant frequency f~ khz in liquid). Imaging under gases and liquids was performed by means of Si 3 N 4 cantilevers with a cantilever of spring constant of N.m -1. Imaging under gases in oscillating contact mode was carried out by means of silicon cantilevers of spring constant of 1-2 N.m -1 and resonance frequencies of about 75 khz to probe chemical modification. The scan rate was adjusted to 2-10 Hz, and a resolution of 512 x 512 pixels 2 per image was selected. Quantitative evaluation of the image data was performed using Nanoscope off-line analysis software. A controlled atmosphere was achieved by means of a steel tube which ends 2 mm above the sample surface without interfering with the laser beam of the detection system or other sensitive parts of the AFM. Further isolation of the optical head was not necessary in order to use this simple setup as a climate chamber. Defined relative humidity was achieved during measurements by mixing dry nitrogen gas with nitrogen saturated with water by means of flow meters. Measurements under nitrogen were performed at a flow rate of 10 L/h. All measurements were carried out at room temperature (22 C) Transmission measurements. The evolution of the optical transmission of As 2 S 3 MOF was quantitatively studied as a function of exposure time to ambient temperature and relative humidity (RH). In these experiments, measurements were carried out over 48 hours, in dark, at temperature ranging from 20 C to 25 C and relative humidity (RH) varying between 50 and 60%. A NICOLET 6700 Fourier Transformed InfraRed (FTIR) spectrometer was used to obtain the transmission spectra. The source is an external halogen lamp emitting in the µm range, providing 161
184 Part 3: Optical, Topological and Structural Aging in As 2 S 3 Microstructured Optical Fibers and Impact on Mid-Infrared Supercontinuum Spanning Article 2 higher power than the original source integrated in the spectrophotometer, allowing thus to perform this study on MOF samples in the range of interest. The transmission spectra were registered between 1.2 µm to 4.5 µm through a 0.5 m long As 2 S 3 glass MOF presenting a large-core diameter of 8 µm linked to the robust cladding by three thin struts (Figure 61 (a)). This fiber was maintained in a fix position all along the experimental period in such a way the coupled power remains unchanged, whereas collected intensity exclusively depended on the dynamic evolution of optical characteristics of the vitreous core. For light coupling a reflective objective was used to avoid chromatic effects. At the output, the signal transmitted along the fiber core was focused into an In-Sb detector using an optimal aspheric AMTIR lens. An infrared camera was used at the output end of the fibre to ensure that light was effectively guided in the core of the MOF only. This is important to stultify the possibility of any significant contribution of the fibre clad in the aging process since the fibre is not coated. The stability of the incident beam intensity has been previously verified, to assure that it remains unchanged through the experiment. The optical aging, after a time t of exposure to room atmosphere, is given in terms of the relative transmission T t /T t0 defined as the ratio between the transmission at time t and the transmission registered at t 0 immediately after drawing. 3. Results and discussions FTIR spectroscopy. Figure 62 shows the FTIR survey relative transmissions registered immediately after drawing and after well defined periods of exposure to room atmosphere in dark as described above. The depicted spectra show a time deviation in shapes, intensities and positions of characteristic absorption peaks present on the initial transmission spectrum T t0. In parallel, new peaks arise revealing a dynamic evolution of chemical composition upon exposure time. Figure 62 illustrates the principal features which are: (1) strong peaks evolving at 2.77 µm, 2.84 µm and 2.91 µm whose intensities are related to exposure time to ambient atmosphere; (2) a strong enlargement of absorption in the µm which becomes measurable after 5 hours of exposure, and grow rapidly with further exposure to laboratory conditions; (3) an absorption peak around 1.92 µm assigned to OH groups strongly bonded to glass network 162
185 Part 3: Optical, Topological and Structural Aging in As 2 S 3 Microstructured Optical Fibers and Impact on Mid-Infrared Supercontinuum Spanning Article 2 evolving strongly over time. This set of characteristic absorption bands have previously been attributed to different vibration modes of OH groups strongly and weekly bonded to the glass network and a detailed study of OH groups absorption evolution and absolute content was reported in our previous work [22]. 1,0 Relative Transmission (T t /T 0 ) 0,8 0,6 0,4 0,2 1,0 0,9 0,8 0,7 1,8 1,9 2,0 2,1 Wavelength (µm) 3,2 3,4 3,6 3,8 4,0 4,2 1,5 2,0 2,5 3,0 3,5 4,0 4,5 1,0 0,9 0,8 0,7 0,6 Wavelength (µm) Wavelength (µm) 48 h 34 h 10 h 5 h 1 h 0,5 h T (t 0 ) Figure 62: MIR-FTIR survey spectra registered on 0.5 m length of 8 µm core diameter of an As 2 S 3 MOF upon storing in ambient conditions at C and RH 50-60%. Regarding SH groups IR signature, another set of absorption bands located around 2.0, 2.05, 2.54, 3.11, 3.64, 3.69 and 4.03µm appear upon exposure time (Figure 62) [29, 30]. They always maintain the same relative intensity with respect from one to another, but whose absolute intensities increase with exposure to atmospheric conditions. These bands are attributed to S-H vibrations and their combinations with other vibration modes [29, 30]. The absorption band located at 4.03 µm is attributed to the fundamental SH stretching vibration [29]. The peaks around µm correspond to the first overtones of the fundamental SH stretching vibrations [29, 30]. The absorption at 2.54 µm is produced by the first fundamental stretching mode of SH combined to two vibrations of As-S-H, whereas the absorption peak at 3.11 µm is due to the first fundamental stretching mode of SH combined to a unique vibrations of As-S-H [29, 30]. It is also reported in the literature a set of peaks assigned to 163
186 Part 3: Optical, Topological and Structural Aging in As 2 S 3 Microstructured Optical Fibers and Impact on Mid-Infrared Supercontinuum Spanning Article 2 combination of fundamental stretching vibration of SH bonds combined to the fundamental stretching vibrations of the As 2 S 3 glass network which manifest themselves in the µm region [29, 30]. Thus, absorption peaks in the µm region (Figure 62) are due to the aforementioned vibrations. These absorptions bands which grow with exposure to ambient atmosphere come from an interaction between glass and atmospheric steam. As we previously reported [22], the proposed mechanism of chemical aging is the following: in the first hours of As 2 S 3 MOFs exposure to ambient atmosphere, growing water adsorption occurs at the surface of the MOF core. This adsorption leads progressively to a chemical reaction between adsorbed water and the sulphide glass in which =As-S-As= bridges are broken to form As-O-H and H-S-As bonds: =As-S-As= + H 2 O => =As-O-H + H-S-As This mechanism is here confirmed by observation of SH groups IR absorption. On a first step, weakly-bonded OH-attributed absorption bands (at 2.77 and 2.84 µm) gradually increase. Then, after 5 hours, the relative intensity of both As-O-H (1.92 µm) and S-H (4.0 µm) absorption bands start to grow, together with IR signature of As-S-H groups Surface evolution of aged fiber Atomic Force Microscopy (AFM) analysis on fiber samples. Scattering losses are present on FTIR spectra Figure 62 and are function of the incident wavelength. This impact severely occurs in the high frequency range, whereas such tendency is lowered and less significant in the low frequency range. Such phenomenon is due to surface defects arisen on the glass surface [23]. To determine the nature of this surface changes, a detailed study of the evolution of the core surface was needed. However, because of experimental constraints, such detailed study was impossible. Thus, in order to perform AFM measurements on a glass fiber surface, a rectangular fiber was conceived and drawn (Figure 61 b). The freshly drawn samples were stored in dark inside a close compartment at 50 C under well-defined relative humidity (RH) levels along the period of study. For sake of clarity, the samples were numbered according to their RH exposure: RH=35% (SI), RH=65% 164
 and RH=75% (SIII).")


) with a square cross-section.")
 fresh sample; SI after (b) 7 days")
187 Part 3: Optical, Topological and Structural Aging in As 2 S 3 Microstructured Optical Fibers and Impact on Mid-Infrared Supercontinuum Spanning Article 2 (SII) and RH=75% (SIII). The aged specimens were regularly imaged on time scale by AFM technique on large scale (i.e. 25 µm scan range) to identify defects on glass surface. Pictures were taken before and after RH exposure by a digital camera. Figure 63 and Figure 64 show top views of samples at different periods and conditions of exposure. We arranged different scales related to the images for better contrast. Shortly after drawing, several bumps emerge randomly on the fiber surface (Figure 63 (a)). Arisen bumps then developed into faceted pyramids (Figure 63 (b)) with a square cross-section. The dimensions of these defects keep increasing with exposure time and reach a factor 20 after 23 days of exposure. a a b b c c Figure 63: Top view of AFM 3D-pictures of As 2 S 3 fiber surface: (a) fresh sample; SI after (b) 7 days and (c) 23 days of exposure. a b c Figure 64: Top view of AFM 3D-pictures As 2 S 3 fiber surfaceregistered after 23 days of exposure for SI (a), SII (b) and SIII (c) respectively. 165
188 Part 3: Optical, Topological and Structural Aging in As 2 S 3 Microstructured Optical Fibers and Impact on Mid-Infrared Supercontinuum Spanning Article 2 The evolution of the surface morphology was determined following the shape, the height and the fraction of area covered by these defects upon exposure. During the first days (Figure 63 (b)), the bumps maintain a regular pyramidal shape and corresponding heights continue to increase over time. This is the first stage of surface aging. As reported by John Berkes and al. [26], these small bumps growth on the surface of As 2 S 3 samples are attributed to As 2 O 3 crystals evolving upon time. Here, we have unequivocally identified compositionally these As 2 O 3 crystals by electron dispersive spectroscopy (EDS) method. One can note that similar photo-induced defects morphology were reported on As-selenide films exposed to air, whereas for samples treated under vacuum, oxygen and moisture-free atmosphere, no significant changes were detected [27]. Extending the exposure period results in losing the pyramidal shapes, given rise to bigger structures (Figure 63 (c)). The growth process of large particles at the expense of smaller ones because of the decreasing surface energy is known as Ostwald ripening [31] and such behavior has been previously reported by Berkes and al. [26] in the case of As 2 S 3 glass surface modification. This is accompanied by an increase in the sizes of phase regions and a decrease in their number and in the total surface area of the exposed facet. The Ostwald ripening ceases when the growing particles reach a stable state at a given time and given temperature. Figure 64 illustrates the tremendous impact of RH on the topological evolution of the exposed surface. Top views of surface changes of samples SI, SII and SIII respectively, are presented after 23 days of exposure. The number of bumps, their growth kinetic as well as their agglomeration tendency severally increase with RH. After 23 days of exposure to aging conditions, the morphological changes on the surface of SI were exclusively represented by the pyramid bumps and clusters resulting from the Ostwald ripening phenomenon (Figure 64 (a)). However, for SII sample exposed to higher RH, and after the same exposure period, the surface degradation is more pronounced than for SI (Figure 64 (b)) and we note that holes start to appear on the surface of the sample. This dynamic becomes more obvious with further increase of the RH, as shown for sample SIII (Figure 64 (c)). Figure 65 presents the evolution of the heights of defects growing on the surface of exposed samples, as a function of exposure time. Regardless the RH at which the sample is exposed, the heights of defects increases over time. After 2 days of exposure, maximum heights of 166
189 Part 3: Optical, Topological and Structural Aging in As 2 S 3 Microstructured Optical Fibers and Impact on Mid-Infrared Supercontinuum Spanning Article 2 10 nm, 89 nm and 157 nm were registered on SI, SII and SIII, respectively. 5 days later, these values increase and reach 50 nm, 147 nm and 270 nm respectively. After 18 days, the maximum heights rise to 100 nm, 339 nm and 640 nm, respectively. Herein, the impact of the RH is clearly pointed out: sample SIII stored at a RH 10% higher than that of SII, developed holes almost twice deeper than those measured on SII, for the same exposure period. 700 Defects Heights (nm) SI SII SIII Time (days) Figure 65: Heights evolution of defect growing at 50 C, on the surface of samples SI, SII and SIII, as a function of exposure time Prevention of glass fibers aging. The previously discussed data show a deterioration of the glass surface due to the corrosive action of atmospheric moisture. In attempts to block or delay the whole process, an As 2 S 3 fiber sample was stored in anhydrous atmospheric conditions during 6 months. Throughout this period, the sample was stored in dark, at temperature varying between C, inside a glove box where moisture level was maintained less than 0.5 ppm. During the same period, another part of the same fiber was stored in ambient atmospheric conditions. Figure 66 gathers top views of AFM 3D-pictures registered on fresh sample (immediately after being drawn) and on the two previously described samples. This experiment confirms that the morphology changes occurring on the surface of glass fibers are significantly reduced under moisture-free atmosphere. The maximum defects height registered after six month of exposure did not exceed the 50 nm threshold for the samples stored in dry conditions (Figure 167
).")
 fresh sample; (b) 6 months of storage in dry atmosphere at room temperature; (c) 6 months of storage in air")
, leading to locally deteriorate the glass network and giving rise to holes on its surface which continue to sink in depth over time (Section 3.2).")
190 Part 3: Optical, Topological and Structural Aging in As 2 S 3 Microstructured Optical Fibers and Impact on Mid-Infrared Supercontinuum Spanning Article 2 66 (b)), when it reaches 480 µm for the counterpart sample stored in air (Figure 66 (c)).these results provide new evidence on the necessity of water adsorption on the surface of the sulphide glass to lead to a significant chemical aging via the hydrolysis processes discussed above. a b c Figure 66: Top view of AFM 3D-pictures of the surface of As 2 S 3 glass fibers: (a) fresh sample; (b) 6 months of storage in dry atmosphere at room temperature; (c) 6 months of storage in air at room temperature Depth diffusion of impurities. Results previously discussed confirm a hydrolysis reaction taking place on the surface of the glass (Section 3.1), leading to locally deteriorate the glass network and giving rise to holes on its surface which continue to sink in depth over time (Section 3.2). Thus, a question arises about the limits in depth reached by the hydrolysis process, as well as the resulting changes in glass composition. The resulting local drift of the glass composition will induce a local shift of the glass nano-mechanical properties, especially the friction properties [32]. Thus, at the boundary between contaminated and uncontaminated zones, the friction properties change and become inhomogeneous over these two zones. Based on the aforementioned and in order to study the depth diffusion of the aging-induced structural modifications of the glass, we investigated the homogeneity of the friction properties on the cross section of glass fiber samples stored under wet and dry conditions. The qualitative evolution of the friction properties was studied by means of an advanced mode of the AFM technique, known as lateral force microscopy (LFM) with a scanning angle rotated at 90. Figure 67 represents a 168
191 Part 3: Optical, Topological and Structural Aging in As 2 S 3 Microstructured Optical Fibers and Impact on Mid-Infrared Supercontinuum Spanning Article 2 schematic illustration of the investigated zones. Results of the investigations are gathered in Figure 68. Cleaved fiber Aged Fiber sample Zone II Zone I Cross section cleave Figure 67: Illustration of investigated zones on the cross section of the glass fiber. Figure 68 illustrates fracture profile registered on the cross sections of As 2 S 3 fibers upon exposure to ambient (wet) and dry surrounding atmosphere. One rectangular fiber sample has been exposed to room atmosphere during 7 days, at a temperature ranging between 20 and 25 C and a RH around 65%. Another fiber sample has been stored in a glove box for 6 months, in the same temperature range and under dry atmosphere (around 0.5 ppm H 2 O). The views of the fiber exposed to dry atmosphere shows homogeneous friction properties (Figure 68 (a-b)) throughout the investigated area, I and II (Figure 67), whereas that exposed to wet atmosphere displays different distinct surfaces of different friction characteristics (Figure 68 (c-d)). Additionally, for the sample exposed to wet atmosphere, by approaching the center of the specimen (zone II-Figure 67), the sample restores the homogenous friction properties of the original glass material (Figure 68 (d)). In addition, the signature of heterogeneous friction properties appears inside the fiber, down to 30 µm in depth from the surface of the specimen (Figure 68 (d)). In other words, the signature of glass hydrolysis by atmospheric conditions took place inside the fiber, at 30 µm from its surface, after 7 days of aging. Thus, based on the aforementioned, we can wisely conclude that the hydrolysis process, and indirectly the H 2 O molecules diffusion have reached the 30µm depth threshold. 169

192 Part 3: Optical, Topological and Structural Aging in As 2 S 3 Microstructured Optical Fibers and Impact on Mid-Infrared Supercontinuum Spanning Article 2 a b Zone I Zone II c d Zone I Zone II Figure 68: Friction micrographs revealing the fracture feature on the cross section of As 2 S 3 fiber. (a)-(b) Fracture features on fiber exposed to dry atmosphere during 6 months on the surface and the center respectively; (c)-(d) Fracture features on fiber exposed to ambient atmospheric conditions during 7 days on the surface and the center, respectively. The black arrow shows the inward direction from the surface to the center of the fiber. Theoretically, under the external surroundings, the glass structure undergoes a structural rearrangement to reach more stable equilibrium state consistent with the new conditions [33]. Consequently, the mechanical properties originate from the new structural rearrangement under the influence of applied stress will be different from those of the original sample [32]. In this context, water vapor and oxygen was found to be a hostile chemical environments for the chalcogenide glasses [19]. Traces of water in the glass structure may significantly weaken the glass [33]. For As 2 S 3 glass fibers exposed to ambient conditions, physical and structural 170
193 Part 3: Optical, Topological and Structural Aging in As 2 S 3 Microstructured Optical Fibers and Impact on Mid-Infrared Supercontinuum Spanning Article 2 properties of the glass are seriously affected. Studies performed on single-index fiber previously reported by Golovchak and al. [34, 35] and Churbanov and al. [19] have shown an increase of the mechanical losses on uncoated fibers exposed to ambient atmosphere, whereas coated fibers did not show any deviation. These results are consistent with those reported herein, where non deviation of friction signature appeared within the sample stored in dry atmosphere (Figure 68 (a-b)), whereas opposite behavior was registered on sample exposed to wet atmosphere (Figure 68 (c-d)). Thus, heterogeneous friction response and mechanical damping of chalcogenide glasses are particularly due to the hydrolysis process of the glass induced by water adsorbed on its surface. These results indicate that the aforementioned phenomenon is dominated by the moisture vapor Cracks proliferation on the surface of aged fiber. Results mentioned above confirm that atmospheric moisture deteriorate the glass network and diffuse from the surface deeply inside the glass. In addition, according [18, 19], water is known to initiate crack propagation on the glass surface and to decrease the mechanical strength of chalcogenide glasses. However, such phenomena depends on the glass composition, the presence of protective coat, surrounding atmosphere as well as the temperature [18, 19]. Niu and al. [18] reported the growth of cracks on the surface of As 2 S 3 corroded bulk when it is soaked in water. The previously described features are attributed to a corrosive surface reaction taking place between the glass and water, which is considered as an extremely deleterious surrounding medium. Note that the kinetic of the aforementioned reaction depend on the ph of the leach and the experimental temperature. On the other hand, Churbanov and al. [19] attributed the strength collapse of the aged fiber to cracks defects growing on uncoated As-S fibers. Herein, Figure 69 displays the growth of cracks on the surface of the fiber upon exposure to different atmospheric conditions obtained by scanning electron microscopy (SEM Jeol 6500). After 6 months of storage in moisture-free atmosphere, the glass fiber exhibits a surface exempt of cracks (Figure 69 (a)), and maintain a smooth surface as it originally appears immediately after drawing process. However, after 7 days of exposure to atmospheric moisture surrounding, cracks appear on the fiber surface and dig 171


194 Part 3: Optical, Topological and Structural Aging in As 2 S 3 Microstructured Optical Fibers and Impact on Mid-Infrared Supercontinuum Spanning Article 2 deeply over time (Figure 69 (b)). These results are consistent with the hydrolysis process between the glass and the surrounding moisture vapour. a b Figure 69: SEM images of the surface of As 2 S 3 rectangular fibers: (a) preserved in dry atmosphere; (b) conserved 7 days in ambient laboratory atmosphere at 25 C and 65% RH. The black arrows point on the cracks and craters evolving on the fiber surface upon aging. 4. Conclusion IR and AFM fiber studies performed upon exposure to different atmospheric conditions show that As 2 S 3 fibers undergo, under room atmospheric conditions, an optical aging, a degradation of their surface and a gradual alteration of the glass network which evolves in depth. When stored under ambient conditions, the As 2 S 3 glass optical fiber is severely attacked by atmospheric moisture which is the critical factor involved in this aging process. A hydrolysis process takes place associated with shrinkage of As-S glassy backbone. This aging is particularly to be taken into account when using microstructured fibers, for which a small glassy core is surrounded by ambient atmosphere and thus especially subjected to a strong impact of its reaction with atmospheric steam. This strictly implies to use that type of fibers in a dry environment. 172
195 Part 3: Optical, Topological and Structural Aging in As 2 S 3 Microstructured Optical Fibers and Impact on Mid-Infrared Supercontinuum Spanning Acknowledgements. Article 2 We acknowledge the financial support from the Conseil Régional de Bourgogne through the Photcom PARI program, as well as from the French DGA. This project has been performed in cooperation with the Labex ACTION program (contract ANR-11-LABX ). 173
196 Part 3: Optical, Topological and Structural Aging in As 2 S 3 Microstructured Optical Fibers and Impact on Mid-Infrared Supercontinuum Spanning References - Article 2 5. References 1. D. Lezal, "Chalcogenide glasses - survey and progress," Journal of Optoelectronics and Advanced Materials 5, (2003). 2. J. S. Sanghera, and I. D. Aggarwal, "Active and passive chalcogenide glass optical fibers for IR applications: a review," Journal of Non-Crystalline Solids , 6-16 (1999). 3. R. R. Gattass, L. Brandon Shaw, V. Q. Nguyen, P. C. Pureza, I. D. Aggarwal, and J. S. Sanghera, "All-fiber chalcogenide-based mid-infrared supercontinuum source," Optical Fiber Technology 18, (2012). 4. I. Savelii, O. Mouawad, J. Fatome, B. Kibler, F. Désévédavy, G. Gadret, J. C. Jules, P. Y. Bony, H. Kawashima, W. Gao, T. Kohoutek, T. Suzuki, Y. Ohishi, and F. Smektala, "Mid-infrared 2000-nm bandwidth supercontinuum generation in suspended-core microstructured Sulfide and Tellurite optical fibers," Optics Express 20, (2012). 5. W. Gao, M. El Amraoui, M. Liao, H. Kawashima, Z. Duan, D. Deng, T. Cheng, T. Suzuki, Y. Messaddeq, and Y. Ohishi, "Mid-infrared supercontinuum generation in a suspended-core As 2 S 3 chalcogenide microstructured optical fiber," Optics Express 21, (2013). 6. J. Troles, Q. Coulombier, G. Canat, M. Duhant, W. Renard, P. Toupin, L. Calvez, G. Renversez, F. Smektala, M. El Amraoui, J. L. Adam, T. Chartier, D. Mechin, and L. Brilland, "Low loss microstructured chalcogenide fibers for large non linear effects at 1995 nm," Optics Express 18, (2010). 7. O. Mouawad, J. Picot-Clémente, F. Amrani, C. Strutynski, J. Fatome, B. Kibler, F. Désévédavy, G. Gadret, J. C. Jules, D. Deng, Y. Ohishi, and F. Smektala, "Multioctave midinfrared supercontinuum generation in suspended-core chalcogenide fibers," Optics Letters 39, (2014). 8. J. H. V. Price, T. M. Monro, H. Ebendorff-Heidepriem, F. Poletti, P. Horak, V. Finazzi, J. Y. Y. Leong, P. Petropoulos, J. C. Flanagan, G. Brambilla, F. Xian, and D. J. Richardson, "Mid-IR supercontinuum generation from nonsilica microstructured optical fibers," IEEE Journal of Selected Topics in Quantum Electronics 13, (2007). 9. J. M. Dudley, G. Genty, and S. Coen, "Supercontinuum generation in photonic crystal fiber," Reviews of Modern Physics 78, (2006). 10. V. Q. Nguyen, J. S. Sanghera, P. Pureza, F. H. Kung, and I. D. Aggarwal, "Fabrication of arsenic selenide optical fiber with low hydrogen impurities," Journal of the American Ceramic Society 85, (2002). 174
197 Part 3: Optical, Topological and Structural Aging in As 2 S 3 Microstructured Optical Fibers and Impact on Mid-Infrared Supercontinuum Spanning References - Article A. E. Kurganova, G. E. Snopatin, and M. F. Churbanov, "Purification of glass melts in the As-Se system with vacuum distillation," Glass Physics and Chemistry 38, (2012). 12. D. Thompson, S. Danto, J. D. Musgraves, P. Wachtel, B. Giroire, and K. Richardson, "Microwave assisted synthesis of high purity As 2 Se 3 chalcogenide glasses," European Journal of Glass Science and Technology Part B 54, (2013). 13. N. Prasad, D. Furniss, H. L. Rowe, C. A. Miller, D. H. Gregory, and A. B. Seddon, "First time microwave synthesis of As 40 Se 60 chalcogenide glass," Journal of Non-Crystalline Solids 356, (2010). 14. G. E. Snopatin, V. S. Shiryaev, V. G. Plotnichenko, E. M. Dianov, and M. F. Churbanov, "High-purity chalcogenide glasses for fiber optics," Inorganic Materials 45, (2009). 15. S. Danto, D. Thompson, P. Wachtel, J. D. Musgraves, K. Richardson, and B. Giroire, "A comparative study of purification routes for As 2 Se 3 chalcogenide glass," International Journal of Applied Glass Science 4, (2013). 16. M. El-Amraoui, G. Gadret, J. C. Jules, J. Fatome, C. Fortier, F. Désévédavy, I. Skripatchev, Y. Messaddeq, J. Troles, L. Brilland, W. Gao, T. Suzuki, Y. Ohishi, and F. Smektala, "Microstructured chalcogenide optical fibers from As 2 S 3 glass: towards new IR broadband sources," Optics Express 18, (2010). 17. I. D. Aggarwal, F. Kung, J. S. Sanghera, L. B. Shaw, and P. A. Thielen, "IR supercontinuum source," (Google Patents, 2006). 18. Y.-F. Niu, J.-P. Guin, A. Abdelouas, T. Rouxel, and J. Troles, "Durability of an As 2 S 3 chalcogenide glass: Optical properties and dissolution kinetics," Journal of Non- Crystalline Solids 357, (2011). 19. M. F. Churbanov, V. S. Shiryaev, V. V. Gerasimenko, A. A. Pushkin, I. V. Skripachev, G. E. Snopatin, and V. G. Plotnichenko, "Stability of the optical and mechanical properties of chalcogenide fibers," Inorganic Materials 38, (2002). 20. R. J. Curry, S. W. Birtwell, A. K. Mairaj, X. Feng, and D. W. Hewak, "A study of environmental effects on the attenuation of chalcogenide optical fibre," Journal of Non- Crystalline Solids 351, (2005). 21. P. Toupin, L. Brilland, D. Mechin, J. Adam, and J. Troles, "Optical aging of chalcogenide microstructured optical fibers," Journal of Lightwave Technology, 32, (2014). 22. O. Mouawad, C. Strutynski, J. Picot-Clémente, F. Désévédavy, G. Gadret, J. C. Jules, and F. Smektala, "Optical aging behaviour naturally induced on As 2 S 3 microstructured optical fibres," Optical Materials Express 4, (2014). 175
198 Part 3: Optical, Topological and Structural Aging in As 2 S 3 Microstructured Optical Fibers and Impact on Mid-Infrared Supercontinuum Spanning References - Article O. Mouawad, F. Amrani, B. Kibler, J. Picot-Clémente, C. Strutynski, J. Fatome, F. Désévédavy, G. Gadret, J. C. Jules, O. Heintz, E. Lesniewska, and F. Smektala, "Impact of optical and structural aging in As 2 S 3 microstructured optical fibers on mid-infrared supercontinuum generation," Optics Express 22, (2014). 24. Y.-F. Niu, J.-P. Guin, T. Rouxel, A. Abdelouas, J. Troles, and F. Smektala, "Aqueous corrosion of the GeSe 4 chalcogenide glass: surface properties and corrosion mechanism," Journal of the American Ceramic Society 92, (2009). 25. L. Petit, N. Carlie, T. Anderson, J. Choi, M. Richardson, and K. C. Richardson, "Progress on the photoresponse of chalcogenide glasses and films to Near-Infrared femtosecond laser irradiation: a review," IEEE Journal of Selected Topics in Quantum Electronics, 14, (2008). 26. J. S. Berkes, S. W. I. Jr., and W. J. Hillegas, "Photodecomposition of amorphous As 2 Se 3 and As 2 S 3," Journal of applied Physics 42, (1971). 27. S. Krishnaswami, H. Jain, and A. C. Miller, "Effect of oxygen on the photoinduced changes in the electronic structure of As 50 Se 50 glass films," Journal of Optoelectronics and Advcanced Materials 3, (2011). 28. M. El Amraoui, "Fibres Optiques Microstructurées Chalcogénures Fortement Non Linéaires à base de As 2 S 3 : vers de Nouvelles Sources Supercontinuum Infrarouges," PhD in ICB - Université de Bourgogne (Université de Borgogne, Dijon, France ( 2010). 29. T. Kanamori, Y. Terunuma, S. Takahashi, and T. Miyashita, "Transmission loss characteristics of As 40 S 60 and As 38 Ge 5 Se 57 glass unclad fibers," Journal of Non- Crystalline Solids 69, (1985). 30. V. Kokorina, Glasses for infrared optics (The CRC Press, 1996). 31. E. Finot, E. Lesniewska, J. C. Mutin, and J. P. Goudonnet, "Reactivity of gypsum faces according to the relative humidity by scanning force microscopy," Surface Science 384, (1997). 32. A. Erdemir, S. Li, and Y. Jin, "Relation of certain quantum chemical parameters to lubrication behavior of solid oxides," International Journal of Molecular Sciences 6, (2005). 33. W. Zdaniewski, G. Rindone, and D. Day, "The internal friction of glasses," Journal of Materials Science 14, (1979). 34. R. Y. Golovchak, A. Kozdras, and O. I. Shpotyuk, "Physical ageing in glassy As-Se induced by above-bandgap photoexposure," Solid State Communications 145, (2008). 176
199 Part 3: Optical, Topological and Structural Aging in As 2 S 3 Microstructured Optical Fibers and Impact on Mid-Infrared Supercontinuum Spanning References - Article R. Y. Golovchak, S. A. Kozyukhin, A. Kozdras, O. I. Shpotyuk, and V. M. Novotortsev, "Physical aging of chalcogenide glasses," Inorganic Materials 46, (2010). 177
200 Part 3: Optical, Topological and Structural Aging in As 2 S 3 Microstructured Optical Fibers and Impact on Mid-Infrared Supercontinuum Spanning Sum Up IV. SumUp. The overall conclusions resulting from the previous work on As 2 S 3 glasses are gathered in schematic illustration in Figure 70. Figure 70: overall conclusions arising from this work summarized in schematic illustration. 178
201 Part 3: Optical, Topological and Structural Aging in As 2 S 3 Microstructured Optical Fibers and Impact on Mid-Infrared Supercontinuum Spanning Conclusion V. Conclusion In conclusion, great strides have been made in the understanding of the optical aging behavior of the As 2 S 3 glass in fiber shape. We report on the first detailed spectroscopic study on unsuitable aging process of As 2 S 3 chalcogenide microstructured optical fibers after few days of exposure to laboratory atmospheric conditions. The evolution and the impact of moisturesorbed and hydroxyl impurities upon aging process have been studied on microstructured fibers using near-visible and infrared spectroscopy. The observed changes upon exposure period show that most of the deleterious effects of moisture occur over the first few hours.the rapid degradation recalls the dramatic increase of optical absorption in the µm range, as well as at 1.9 µm and 1.44 µm. The growth of these bands results from a substantial reaction undergone between the glass and the adsorbed vapor moisture. This reaction is associated with breakage of As-S bonds glassy backbone within the glass matrix, associated with formation of OH and SH bonds. The regular evolution of the absorption bands of hydroxyl components in glass fibers as a function of exposure period is pointed out. Based on experiments performed to investigate the local degradation in MOF s, it was found that the fibre degradation occurs heterogeneously along the fiber. This degradation decreases exponentially from the fibre ends towards the centre. Based on the changes of the loss levels that have been measured for different sections, depending on the position with respect to the end, the concentration of hydroxyl group is determined. The content estimates were performed on the basis of Beer-Lambert law, using the absorption coefficient of the concerned absorption band. Since there is no well defined absorption coefficient reported on chalcogenide glasses, we used as traditionally the parameters measured on silica glasses, and reported in literature. After 384 hours of exposure, the concentration of OH bonds vibrating at 1.92 µm is estimated to be ~147 ppm near the end of the aged fiber. This value decreases to ~10 ppm at 1.0 m from the end. We also proved the naturally induced topological aging of the glass surface under ambient conditions. Great strides have been made in the understanding of origin of the scattering losses responsible for the transmission degradation at advanced stage. Advanced aging stages have showed an optical extinction of the fiber transmission attributed to surface defects 179
202 Part 3: Optical, Topological and Structural Aging in As 2 S 3 Microstructured Optical Fibers and Impact on Mid-Infrared Supercontinuum Spanning Conclusion evolving over time. The growth of surface defects is due to advanced chemical degradation at room temperature in presence of humidity, leading to formation of surface irregularities. These surface imperfections are essentially associated with small crystals of As 2 O 3 (bumps), holes and cracks. However, these surface features grow in a sequential manner under humid atmosphere. The first step consist in formation of regular pyramidal bumps, assigned as crystals of As 2 O 3, resulting from the oxidation of the glass network. Once these oxides species are formed, they will remain in a mobile state until it will amalgamate itself in a growth sites. Extending the exposure period results in losing the geometric regularity of superficial pyramidal bumps, given rise to new clusters. The process of growth of large particles at the expense of smaller ones because of the diminishing surface energy is known as Ostwald ripening. Later, deep holes dig within the glass volume. It was shown that these surface modifications dynamics might be accelerated by water and temperature. In addition, the glass contamination diffuses in depth inside the glass, and reaches several micrometers from its surface. 180
203 Part 4 : Green Chalcogenide Ge-Based Glass Fibers Exempt of Toxic Arsenic and Antimony Components Part 4: Green Chalcogenide Ge-Based Glass Fibers Exempt of Toxic Arsenic and Antimony Components 181
204 Part 4 : Green Chalcogenide Ge-Based Glass Fibers Exempt of Toxic Arsenic and Antimony Components I. Introduction Introduction Among the various chalcogenide glass systems, the most important results were obtained for glasses based on chalcogenides of arsenic and germanium, including As 2 S 3, As 2 Se 3, GeAsSe. Except the GaLaS system [1, 2] and GeSe system [3, 4], the presence of arsenic and/or antimony seems mandatory, in order to fabricate chalcogenide glasses owing physicochemical properties suitable for fiber drawing. However, at the same time, these elements present the drawback to be highly toxic, and according to European "Registration, Evaluation and Authorisation of Chemicals (REACH)" Reglementation [5], it is suitable to remove them from glass composition. The arsenic- and antimony-free GaLaS glass system suffers from relatively poor thermal stability and consequently difficult to be drawn into crystal free fibers [1]. On the other hand, GeSe glass system exhibits low Tg, is not transparent in the visible and has high material dispersion. For these reasons, our work has focused on germaniumbased sulfide glasses compatible with drawing process. In the first section, we briefly describe the properties of the glass systems explored in this study. We first investigated the sulphur-based Ge-S and Ge-Ga-Ssystems. Because of fiber drawing difficulties, selenium was partially substituted for sulphur in GeSeS glass system. The second section is devoted to detail the optimal operation conditions for producing chalcogenide glasses by means of the melt quenching technique. The last section of the chapter presents the fiber drawing attempts of previously fabricated glasses and discusses the results. II. Glass systems II.1 Ge-S glass system First study aimed to determine the phase diagram of the binary GeS x system was performed by A. V. Novoselova and al. [6, 7]. For this purpose, the authors used the data of differential thermal analysis (DTA) an X-ray diffraction (XRD). Subsequent work studied carefully compositions neighboring to GeS and GeS 2 compounds and lead to refine the GeS phase diagram as shown in Figure 71 [7, 8]. With further research of Kawamoto and Tsuchihashi 182
205 Part 4 : Green Chalcogenide Ge-Based Glass Fibers Exempt of Toxic Arsenic and Antimony Components Glass systems [9], improvements were introduced on the study of forming region for bulk glass. Glass formation with water quenching of the glass melt is possible when "x" in GeS x extends from 56.7 to 60 % atomic sulfur. Air cooling technique appears to be more optimum for glass formation when "x" lies in the % range of atomic sulfur. Forming region for GeS x glass fibers seems to be limited by the crystallization in the Ge-rich region (x < 50%). According to I. Kanamori and al. [10], it ranges between 75 and 85 % atomic sulfur. Shibata and al. [11] succeeded to more extend this range down to 68% since they draw fiber of GeS 2.2 composition. Figure 71: Phase diagram of Ge-S system [6, 7]. Glasscompositions studied in this work are gathered on the Phase diagram. The transmission window of germanium sulfide chalcogenide glass system spreads from 0.5 to 11 µm on bulk sample [11-13]. The thermal behavior of these glasses was investigated by different studies [12, 14, 15]. They showed that the glass transition temperatures T g exhibit arrow shape. It increases concurrently with the increase in the proportion of sulfur and reaches 183
206 Part 4 : Green Chalcogenide Ge-Based Glass Fibers Exempt of Toxic Arsenic and Antimony Components Glass systems a maximum for Ge 0.65 S 0.35 system. Further increase of sulfur reduces T g of the binary compounds. Unlike the evolution of T g, the glass stability regularly increases when the proportion of sulfur in the glass system increases [12]. II.2 Ge-Ga-S glass system The first study of the ternary germanium gallium sulfide glass system was performed in the early 1975 th by Loireau-Lozac'h and al. [16]. Auhors used results of DTA and XRD to construct the phase diagram of the GeS 2 -Ga 2 S 3 system. Later, glass formation, phase separation crystallization and the physical properties of GeGaS glass system have been studied [12]. Sulfide glasses suffer from phase separation upon glass synthesis. This phenomenon clearly interferes in sulfur rich compositions. Crystallization arises in germanium/gallium rich (sulfur poor) compositions. The glass-forming regions of GeGaS system is shown in Figure 72. Figure 72: Glass formation in the Ge-Ga-S ternary system as determined by Abe and al. [11]. The fraction of Ge, Ga and S are expressed in %atm. Circles: glasses formed by slow air cooling; triangles: glass formed by fast iced-water quenching; dark circle: crystallized glasses. Bleu stars represent the glass compositions studied in this work. 184
207 Part 4 : Green Chalcogenide Ge-Based Glass Fibers Exempt of Toxic Arsenic and Antimony Components Glass systems The ternary GeGaS glass system exhibits a transmission window similar to that reported for GeS compounds, it extends from 0.5 to around 12 µm [7, 13, 17] on bulk specimen. Comparing to GeS system, GeGaS shows the same behavior concerning the transition temperature (Tg), and opposite behavior concerning the glass stability [12]. The glass transition temperatures T g in all the series have maxima at the tie line-compounds shown in Figure 72. Above this maxima, T g substantially decreases [12]. II.3 Ge-S-Se glass system The glass forming regime in the ternary GeSSe system was constructed by gathering the work of several investigators [18-20]. The glass forming domain of this ternary system spreads over a wide region depending on the cooling rate of the glass melt. Alekseeva and al. [18, 19] studied the glass formation for low solidification rate, achieved by switching-off the furnace or by cooling in ambient atmosphere. The presence of two separate glass domains was confirmed upon low cooling rate applied for glass weight of 5 g. The phase diagram built by Alekseeva and al. is presented in Figure 73. Figure 73: Glass formation in the Ge-S-Se ternary system as determined by Alekseeva and al. for low cooling rate. Regions I and II represent the forming regions of homogenous glasses. Black dots represent compositions for which glass stratifies. 185
208 Part 4 : Green Chalcogenide Ge-Based Glass Fibers Exempt of Toxic Arsenic and Antimony Components Preparation of chalcogenide glasses Figure 74 shows the glass forming region derived from sharp quenching of GeSSe melt as established by Migolinec and al. [19, 20] for glass weight of g. The high cooling rate quenching was achieved using ice-water or liquid nitrogen. Evidently, faster solidification of melt leads to significantly extend the region of stable glass over four domains (Figure 74). Figure 74: Glass formation in the Ge-S-Se ternary system as determined by Migolinets and al. for high cooling rate [18, 19]. Regions I and III represent the forming region of homogenous glasses. Regions II and IV represent the regions suffering from crystallization and stratification, respectively. Blue stars represent the glass compositions studied in this work. III. Preparation of chalcogenide glasses. III.1 Generalities about glass fabrication The varieties of binary and ternary chalcogenide-based glasses were prepared by the conventional melt-quenching technique inside a vacuum-sealed silica ampoule. Elemental germanium (5N), sulfur (5N) and gallium (3N) reagents used in these experiments were of analytical grade purity. In this study, the first aim was to select optimal glass composition with the maximum stability of the vitreous phases against devitrification upon fiber drawing. Thus, raw materials were not 186
209 Part 4 : Green Chalcogenide Ge-Based Glass Fibers Exempt of Toxic Arsenic and Antimony Components Preparation of chalcogenide glasses subject to purification processes prior to glass preparation. In these experiments, glass batches of 10 g to 50 g were prepared inside sealed silica ampoules. Table 6 : Compositions of Germanium-based mono-chalcogenide (GeS and GeGaS) and dichalcogenide (GeSSe) glasses prepared in frame of this work. D I and T represent the inner diameter and the thickness of the various ampoules used to prepare the glass rods. Glass composition Batch weight (g) Ampoule dimensions D I (mm) T (mm) Optimal quenching GeS x Free air Ge x Ga y S z Compressed air Ge x S y Se z Water Germanium ingot was grinded into powder, since it increases the specific surface and consequently accelerates the glass forming reaction comparing to pieces of large size. Grinding was performed inside an inox mortar in ambient atmosphere. Thereafter, germanium particles were mixed with other elements in different molar ratios which are represented by blue stars and summarized in Figure 71, Figure 72 and Figure 74 (see Annex 4). The charge was then loaded into silica tube (see Table 6 for dimension) and connected to turbo vacuum pump then sealed as for As 2 S 3 synthesis (see Synthesis of bulk.) This allows to prepare a glass rod by solidification of the glass melt through quenching either in air, pressurized air or water (Table 8 & Table 9) according to glass composition and batch weight. After melt quenching, the glass rods were annealed near, but below, their glass transition temperatures for 12 hours and in most cases thermally induced stresses were annealed out III.2 Silica ampoule During the first attempts of GeS x glasses synthesis we encountered numerous ampoule explosions because of the high internal pressure in the ampoule at synthesis temperature due to sulfur vaporization; hence it is necessary to consider its vapor pressure evolution with temperature. Indeed vapor pressure of germanium is negligible compared to sulfur one [21]. In [21] a sulfur vapor pressure of 6.4 bars at 590 C is emphasized. For higher temperature no data are available in the literature. However, the small volume of the ampoule (10-5 m 3 ) 187
210 Part 4 : Green Chalcogenide Ge-Based Glass Fibers Exempt of Toxic Arsenic and Antimony Components Preparation of chalcogenide glasses compared to the amount of sulfur ( 10g) allows to assume that the liquid-vapor equilibrium is reached in the silica ampoule at the synthesis temperature. In that case an estimation of the pressure inside the ampoule is possible by using the Clapeyron relationship (Equation 31), dp dt = L T V where P is the pressure, T the temperature, ΔV is the specific volume and L is the specific latent heat of the considered transition. In the case of vaporization and/or sublimation, the condensed phase volume (liquid and/or solid) is negligible. Thus ΔV is approximated by the gas volume V gas which is estimated from perfect gases law. Finally after integration the following relationship between pressure and temperature is obtained: P eq = P ref L R (31) 1 1 (32) T ref T eq where P ref (bar) and T ref (Kelvin) are the parameters for known conditions, L is the specific heat of vaporization of sulfur (considered fixed at 45 kj.mol -1 ) and R is ideal gas constant (8.314 J.K -1.mol -1 ). T eq (Kelvin) is the synthesis temperature at which we consider equilibrium is reached and P eq (bar) is the corresponding pressure we want to estimate. When taking as reference the standard (P ref = 1 bar) boiling point of sulfur (T ref = 717K) and the synthesis temperature of 950 C (Teq = 1223K) we obtained P eq = 23 bars. In order to overcome the difficulty coming from this high ampoule internal pressure we worked on two aspects: the mechanical properties of the silica ampoule and the thermal synthesis profile. III.2.1 Ampoule dimensions Despite the approximations in previous internal pressure estimation, the numerical result is consistent with experimental observations about ampoule explosions and mechanical resistance of silica tubes. Indeed, according to silica based glasses data sheet [22] the allowable pressure for a glass tube with the dimensions we currently used (16 mm inner diameter and 2 mm thickness) is around 17 bars, explaining thus the occasional ampoule explosions. In accordance with Barlow formula (see Equation 33), increasing the thickness and/or decreasing the diameter improves internal pressure resistance of the ampoule. 188
211
212 Part 4 : Green Chalcogenide Ge-Based Glass Fibers Exempt of Toxic Arsenic and Antimony Components Materials' optical properties In practice, despite the improvement allowed by the lifting of the first stage to a higher level of temperature, the process of the two-stage time-temperature profile remained timeconsuming. Thus, with a view to speed up the process, efficient intermediate stage at 850 C has been added. The intermediate stage allowed to reduce the period at 750 C and 900 C to below 10 h and 15 h, respectively. A typical heating schedule for glass melting is showed in Figure 75. Batches of mono- and di-chalcogenide glasses of weight up to 50g were successfully and repeatedly prepared inside a silica ampoule, typically of 20 cm length, 22 mm outer diameter and 3 mm wall thickness. III.3 Glass-melt quenching. Glass is obtained by cooling the melt in water, air or pressurized air. The quenching technique depends on the glass composition, the batch weight and the wall thickness of the synthesis ampoule. In general, higher cooling rates are needed when the weight of the batch or/and the wall thickness increases. In the experiments, homogenous and solid glass rods of GeS mono-chalcogenide binary system were systematically quenched in free air (Table 6). Prior the quenching, the melt was kept in vertical position and gradually cooled down 50 C below synthesis temperature. This allowed to evacuate bubbles from the melt and leaded to a glass rod exempt of defects. When compressed air replaced the free air cooling strategy, the glass rods were weakened and showed deep cracks which persisted after annealing. These defects became more crucial when the batch was quenched in water. In the last case, it was not possible to obtain a glass rod. Ternary mono-chalcogenide GeGaS system showed greater sensitivity to crystallization upon quenching. Free air quenching seemed to be unconvincing strategy since crystals appeared in the glass rods, whereas water chocked the glass upon quenching resulted in cracked glass as we have previously seen on GeS glass system. Compressed air was the best compromise between the slow and the rapid quenching. For the same purpose as above, quenching was conducted from 50 C below the synthesis temperature (Table 6). 190

213 Part 4 : Green Chalcogenide Ge-Based Glass Fibers Exempt of Toxic Arsenic and Antimony Components Materials' optical properties Di-chalcogenide ternary Ge-S-Se glasses of 50 g were systematically prepared in ampoules of 16 mm of inner diameter and 3 mm of wall thickness. Prior quenching in water, furnace was kept in vertical position and glass melt was cooled down at 0.5 C/min to a temperature 100 C below the synthesis temperature. IV. Materials' optical properties - Transmission window Transmission spectra, for wavelengths from the ultraviolet to the near infrared ( nm range), were measured with a Perkin Elmer Lambda 900 UV/VIS/NIR spectrophotometer. A Bruker IFS 28 Spectrophotometer was used to scan from 1.7µm to 25 µm. GeS 3, Ge 25 Ga 5 S 70, GeSe 4 and Ge 23.8 S 57.1 Se 19.1 glasses samples and their optical transmissions are presented in Figure 76 and Figure 77 respectively. Figure 76: Glass samples used for transmission measurements Figure 77 shows that GeS 3 and Ge 25 Ga 5 S 70 glasses exhibit a long wavelength cut-off located around 11.5 µm due to strong 2-phonon absorption process centered around 13.2 µm, and attributed to Ge-S and Ga-S bonds [25-27]. Substitution of all the sulfur by the heavier selenium element leads to shift the glass long multiphonon edge further in the IR. This is for the case of GeSe 4 glass. As shown in Figure 77, its cut-off wavelength is located around 17 µm. The hybrid mixture of S and Se within Ge 23.8 S 57.1 Se 19.1 glass maintains the same multiphonon edge around 11.5 µm as Se-free compositions. Apart from intrinsic absorptions (band gap and multiphonon), principal sources contributing to the absorption peaks were found to be impurities such as oxides and hydrogenate entities. 191
214 Part 4 : Green Chalcogenide Ge-Based Glass Fibers Exempt of Toxic Arsenic and Antimony Components Materials' optical properties The set of the main absorption peaks interrupting the glass transmission is presented on Figure 77. Peak assignments were based on the published literature on various systems [7, 10, 27-29]. Due to the oxygen-pollution of the glass, strong absorptions attributed to Ge-O and Ga-O bonds arise around 8.0 µm. The later absorptions become more crucial on long path samples such as optical fibers and narrow the operational transmission window around these characteristic vibrations frequencies. Transmitance 1,0 0,8 0,6 0,4 S-H Se-H CS O-H CS 2 Ge-O Ga-O GeS 3 Ge 25 Ga 5 S 70 GeSe 4 Ge 23,8 S 57,1 Se 19,1 Ge-O 0,2 0, Wavelength (µm) Figure 77: Optical transmission of the GeS 3 (6.72 mm), Ge 25 Ga 5 S 70 (5.9 mm), GeSe 4 (5.73 mm) and Ge 25 S 55 Se 20 (7.15 mm) glass systems. V. Thermal properties - Transition and crystallization temperatures The difference between the glass transition (T g ) and crystallization (T x ) temperatures defines empirically the glass stability ( T). This parameter determines the extent of resistance of the glass to crystallization. In this section, we overview the glass transition and crystallization temperatures of chalcogenide glasses previously presented. Glass transition temperature (T g ) and crystallization temperature (T x ) are determined by differential calorimetric analysis (DSC) [7, 29]. 192
215 Part 4 : Green Chalcogenide Ge-Based Glass Fibers Exempt of Toxic Arsenic and Antimony Components Materials' thermal properties These measurements were performed using DSC 2920 Modulated DSC-TA Instruments. Both reference and probed samples were heated simultaneously in aluminum crucible at a rate of 10 C/min from ambient temperature to 400 C, while the difference in energy inputs (heat flow) between the sample and reference is measured. The thermographs are depicted in Figure 78. Heat Flow (W/g) 3,0 2,5 2,0 1,5 1,0 0,5 0,0-0,5-1,0 GeS 3 Ge 24,4 S 65,8 Se 9,8 GeSe 4 Tg=162 C Tg=280 C -1, Temperature ( C) Tg=269 C Exothermal process Endothermal process Figure 78: Differential scanning calorimetry curves for several glasses study. No indication of crystallization (as evidenced by a crystallization peak) can be seen for these measurements. This indicates a good thermal stability of the investigated glasses against crystallization which is consistent with data reported in the literature [7, 12-15, 29]. Consequently, the thermal stability ( T) of GeS 3, Ge 24.4 S 65.8 Se 9.8 and GeSe 4 glasses are expected to exceed 127 C, 120 C and 238 C, respectively. 193
.")
216 Part 4 : Green Chalcogenide Ge-Based Glass Fibers Exempt of Toxic Arsenic and Antimony Components VI. Fiber drawing essays. Fiber drawing Drawing essays carried out in the frame of this work were applied on different glass compositions (Table 7). Preforms used herein exhibit an outer diameter varying between 9 and 16 mm, and a length of 50 mm. Table 7: Fiber drawing ability, crystallization tendency and guidance potentials of different chalcogenide glass compositions. Glass composition Preform diameter (mm) Crystallization upon drawing Fiber drawing Fiber guidance capability Ge-S glasses 9-12 High rate Failure -- Ge-Ga-S glasses 9-12 High rate Failure -- Ge 24.4 S 65.8 Se Low rate Successful Medium Ge 23.8 S 57.1 Se Absent Successful Good Ge 23.2 S 48.8 Se Absent Successful Good Ge 22.7 S 40.9 Se Absent Successful Good GeS and GeGaS glasses were prone to crystallization upon drawing process, regardless the glass composition or the drawing operation conditions. During drawing attempts, the viscosity of the soften glass rods did never decrease enough for the glass to start flowing under the influence of gravity, thus finally leading to the crystallization (Figure 79). Figure 79: GeS 3 sample crystallised during fiber drawing attempt. 194
217 Part 4 : Green Chalcogenide Ge-Based Glass Fibers Exempt of Toxic Arsenic and Antimony Components Fiber drawing The stability of GeS 3 glass materials to crystallization was reported by Churbanov and al. [30]. It was characterized by the rate of nucleation of the crystal phase, and the linear rate of crystal growth, as a function of temperature. Nucleation and growth of GeS 3 crystals are both in a narrow temperature range. These phenomena become more farther apart on GeS 2 based glass explaining their higher stability [7]. Nucleation and crystallization rates of GeS 3 compounds occur at 425 C and 485 C, respectively [7, 30]. The nucleation process within GeS 2 glass takes place in the same temperature range as in GeS 3 system (425 C), growth of crystals appears at higher temperature ( C). Despite the higher thermal stability of GeS 2 -based glasses, corresponding viscosity within the drawing operation temperature (Tx- Tg) remains significantly high [14], thereby preventing the possibility of successful fiber drawing. Ga-containing GeS 3 - and GeS 2 -based glasses with different compositions have also been tested for drawing (see appendix 4). Despite the interesting results reported by Schimmel and al. [17], our work indicate that addition of gallium does not improve enough the ability of GeS-based glasses for fiber drawing. The crystallization behavior and network structure of Ge- and Ga containing chalcogenide glasses have been reported in several studies [31-34]. Structural investigations revealed that gallium acts as a network co-former and introduces changes within the Ge-S network, modifying thus corresponding physicochemical properties [35-37]. Upon adding gallium to GeS x glasses, the weaker Ga S bonds forming at the expense of stronger Ge S ones determine the lowering of Tg which is mainly related to the energy required to break and reform covalent bonds in a random network lattice [31]. High content of Ga induced the growth of Ga-Ga bonds, reducing thus the network connectivity and shifting again Tg to lower temperature levels. Loireau-Lozac'h and al. [16] have studied the crystallization behavior of the (GeS 2 ) x (Ga 2 S 3 ) y glass system. This study confirmed that the kinetics of crystallization depends on the Ga 2 S 3 content in the glass. It significantly increases in high Ga-content compounds. When Ga 2 S 3 does not exceed the 15% threshold within the stoichiometric (GeS 2 ) x (Ga 2 S 3 ) y system, a single crystallization peak arise around 520 C. By increasing the absolute content of Ga 2 S 3, new crystallization peaks arise between 450 and 480 C. Simons [7] 195
218 Part 4 : Green Chalcogenide Ge-Based Glass Fibers Exempt of Toxic Arsenic and Antimony Components Conclusion reported that excess-sulfur content within (GeS 3 ) x (Ga 2 S 3 ) y weakened the glass resistance against devitrification. In light of the unfitness of addition of single Gallium element to improve enough the physicochemical characteristics of the GeS x glass to commensurate with the requirements of fiber drawing, sulfur has been replaced progressively by selenium. Se addition allowed us to successfully draw glass fibers from different compositions as reported in Table 7. This progress can be explained by the average bond strengths present in the glass (E Ge-Se =230 kj/mol, E Ge-S =279 kj/mol [38]), which are higher in the sulfide glasses than in the selenide glass, and the modification of the viscosity-temperature behavior. Attenuation (db/m) OH bonds SH bonds SH &SeH bonds CO 2 bonds 1,5 2,0 2,5 3,0 3,5 4,0 4,5 5,0 Wavelength (µm) Figure 80: Early attenuation spectrum for un-purified Ge 23.8 S 57.1 Se 19.1 fiber. Figure 80 displays an early attenuation spectrum registered on un-purified Ge 23.8 S 57.1 Se 19.1 glass fiber. The experimental data are depicted in the range of 1.5 to 5 µm. Despite that strong absorptions bands appear in the zone at which the OH, SH and SeH manifest themselves, this fiber shows a good guiding potential. These unsuitable absorptions persist since no purifications were carried out for raw materials. At the moment, after the selection of the suitable glass composition in view of fiber drawing, efforts are devoted to fabricate a highly pure GeSSe MOFs for SCG. For this purpose, on the first hand, we are working on optimization of a purification process in order to fabricate highly pure glass fibers. In parallel, 196
219 Part 4 : Green Chalcogenide Ge-Based Glass Fibers Exempt of Toxic Arsenic and Antimony Components Conclusion the optimization of drilling technique used to prepare the glass preform, as well as the MOFs drawing process are in progress. VII. Conclusion Germanium based binary and ternary chalcogenide glasses have been successfully prepared. The synthesis time-temperature regime and the synthesis ampoule dimensions are optimized to allow the preparation of 50 g of glass batch. Both GeS and GeGaS binary systems have a strong tendency for crystallization upon fiber drawing conditions, preventing thus a successful drawing of corresponding glass rods into fibers. The GeSSe ternary glass system exhibits higher thermal stability and better viscosity-temperature behaviour at high temperature, allowing thus to fabricate fibers without crystallization. Experiments are going on with the purpose to reach suitable microstructured fibers from these "green" glasses. 197
220 Part 4 : Green Chalcogenide Ge-Based Glass Fibers Exempt of Toxic Arsenic and Antimony Components References VIII. References 1. Y. D. West, T. Schweizer, D. J. Brady, and D. W. Hewak, "Gallium lanthanum sulphide fibers for infrared transmission," Fiber and integrated optics 19, (2000). 2. H. Takebe, B. J., H. W., and M. K., "Thermal properties of Ga 2 S 3 -based glass and their consideration during fiber drawing," Journal of non-crystalline solids 258, (1999). 3. J. Troles, V. Shiryaev, M. Churbanov, P. Houizot, L. Brilland, F. Desevedavy, F. Charpentier, T. Pain, G. Snopatin, and J. L. Adam, "GeSe 4 glass fibres with low optical losses in the mid-ir," Optical Materials 32, (2009). 4. H. Patrick, S. Frédéric, C. Vincent, T. Johann, and G. Ludovic, "Selenide glass single mode optical fiber for nonlinear optics," Optical Materials 29, (2007) L. C. Hua, A. S. Pashinkin, and A. V. Novoselova, "Research on the system Ge-S," Dokl. Akad. Nauk SSSR 151, 1335 (1963). (in Russian) 7. D. R. Simons, "Germanium Gallium Sulfide Glasses for Pr-doped Fiber Amplifiers at 1.3 µm," PhD in Eindhoven University of Technology (Eindhoven University of Technology, Netherlands, 1995). 8. P. N. Kumta, and S. H. Risbud, "Novel glasses in rare-earth sulphide systems," Ceramic Bulletin 69, (1990). 9. Y. Kawamoto, and S. Tsuchihashi, "Glass-forming regions and structure of glasses in the system ge-s," Journal of the American Ceramic Society 52, (1969). 10. T. Kanamori, Y. Terunuma, S. Takahashi, and T. Miyashita, "Chalcogenide glass fibers for mid-infrared transmission," Journal of Lightwave Technology 2, (1984). 11. S. Shibata, Y. Terunuma, and T. Manabe, "Sulfide glass fibers for infrared transmission," Materials Research Bulletin 16, (1981). 12. K. Abe, H. Takebe, and K. Morinaga, "Preparation and properties of Ge Ga S glasses for laser hosts," Journal of Non-Crystalline Solids 212, (1997). 13. X. F. Wang, X. J. Zhao, Z. W. Wang, H. T. Guo, S. X. Gu, J. G. Yu, C. L. Liu, and Q. H. Gong, "Thermal and optical properties of GeS 2 -based chalcogenide glasses," Materials Science and Engineering: B 110, (2004). 14. J. Malek, and J. Shanelova, "Viscosity of germanium sulfide melts," Journal of Non- Crystalline Solids 243, (1999). 198
221 Part 4 : Green Chalcogenide Ge-Based Glass Fibers Exempt of Toxic Arsenic and Antimony Components References 15. G. Saffarini, "On topological transitions and chemical ordering in network glasses of the Ge-Ga-S system," Solid State Communications 91, (1994). 16. A. M. Loireau-Lozac'h, and M. Guittard, "Système GeS 2 -Ga 2 S 3 diagramme de phases, obtention et propriétés des verres," Annale de chimie 10, 101 (1975). 17. R. C. Schimmel, A. J. Faber, H. d. Waardt, R. G. C. Beerkens, and G. D. Khoe, "Development of germanium gallium sulphide glass fibers for 1.3 µm praseodymiumdoped fiber amplifier," Journal of Non-Crystalline Solids 284, (2001). 18. I. V. Alekseeva, A. A. Obraztsov, Z. U. Borisova, and M. D. Balmakov, "Stekloobrazovanie v sistemah Ge-S-Se," Fiz. i Him. Stekla. 4, (1978). (in Russian) 19. D. I. Bletskan, "Glass formation in binary and ternary chalcogenide systems," Chalcogenide Letters 3, (2006). 20. I. M. Migolinec, and M. Y. Sichka, "Stekloobrazovanie v sistemah Ge-S-Se," Fiz. Him. Stekla 5, (1979). (in Russian) 21. Y. Mehrotra, "Preparation and Properties of Chalcogenide Glasses In As-Ge-S and As- Ge-Se systems," PhD in Georgia Institute of Technology (Georgia Institute of Technology, Georgia, 1976) S. A. Dernbovskii, E. N. Loitsker, and I. Akacl., "Preparation and study of some properties of germanium dichalcogenide single crystals," Izv. Akacl. Nauk SSSR, Neorg. Mater. 1, (1967). (in Russian) 24. D. I. Bletskan, "Material synthesis and growth of the crystals of the type A IV B VI and A IV B 2 VI " Chalcogenide Letters 4, 1-16 (2007). 25. D. S. Ma, P. S. Danielson, and C. T. Moynihan, "Multiphonon absorption in xas 2 S 3 -(1- x)ges 2 glasses," Journal of Non-Crystalline Solids 81, (1986). 26. B. Frumarova, J. Oswald, P. Krecmer, M. Frumar, V. Cerny, and V. Smrcka, "Synthesis and physical properties of the system (GeS 2 ) 80 -x(ga 2 S 3 ) 20 :xpr glasses," Optical Materials 6, (1996). 27. T. Kanamori, Y. Terunuma, S. Takahashi, and T. Miyashita, "Transmission loss characteristics of As 40 S 60 and As 38 Ge 5 Se 57 glass unclad fibers," Journal of Non- Crystalline Solids 69, (1985). 28. V. Kokorina, Glasses for infrared optics (The CRC Press, 1996). 29. R. Schimmel, "Toward more effecient praseodymium doped fiber amplifiers for the O- band," PhD in Technische Universiteit Eindhoven (Technische Universiteit Eindhoven, Netherland, 2006). 199
222 Part 4 : Green Chalcogenide Ge-Based Glass Fibers Exempt of Toxic Arsenic and Antimony Components References 30. M. F. Churbanov, "High-purity chalcogenide glasses as materials for fiber optics," Journal of Non-Crystalline Solids 184, (1995). 31. C. Lin, L. Calvez, H. Tao, M. Allix, A. Moréac, X. Zhang, and X. Zhao, "Evidence of network demixing in GeS 2 -Ga 2 S 3 chalcogenide glasses: A phase transformation study," Journal of Solid State Chemistry 184, (2011). 32. C. Lin, L. Calvez, M. Rozé, H. Tao, X. Zhang, and X. Zhao, "Crystallization behavior of 80GeS 2-20Ga 2 S 3 chalcogenide glass," Applied Physics A 97, (2009). 33. Y. Ledemi, B. Bureau, L. Calvez, M. L. Floch, M. Rozé, C. Lin, X. H. Zhang, M. Allix, G. Matzen, and Y. Messaddeq, "Structural investigations of glass ceramics in the Ga 2 S 3 - GeS 2 -CsCl system," The Journal of Physical Chemistry B 113, (2009). 34. M. Rozé, L. Calvez, Y. Ledemi, M. Allix, G. Matzen, and X.-H. Zhang, "Optical and mechanical properties of glasses and glass ceramics based on the Ge Ga Se system," Journal of the American Ceramic Society 91, (2008). 35. C. Julien, S. Barnier, M. Massot, N. Chbani, X. Cai, A. M. Loireau-Lozac'h, and M. Guittard, "Raman and infrared spectroscopic studies of Ge-Ga-Ag sulphide glasses," Materials Science and Engineering: B 22, (1994). 36. S. Barnier, M. Guittard, M. Palazzi, M. Massot, and C. Julien, "Raman and infrared studies of the structure of gallium sulphide based glasses," Materials Science and Engineering: B 14, (1992). 37. Z. G. Ivanova, "Local ordering studies of semiconducting ((GeS 2 )100-xGax glasses," Journal of Molecular Structure 245, (1991). 38. G. Guery, J. D. Musgraves, C. Labrugere, E. Fargin, T. Cardinal, and K. Richardson, "Evolution of glass properties during a substitution of S by Se in Ge 28 Sb 12 S 60-x Se x glass network," Journal of Non-Crystalline Solids 358, (2012). 200
223 Conclusions and future work GENERAL CONCLUSIONS and FUTURE WORK 201
224 Conclusions and future work The works presented in this thesis have mainly been concerned with developing sulfur-based chalcogenide microstructured optical fibers with the purpose of reaching a sustainable infrared supercontinuum fibered source. The manuscript begins with theoretical background review, in which we focused on the linear and nonlinear optical phenomena, as well as on the properties of nonlinear materials, allowing to understand results of supercontinuum generation presented in later Parts. Part 2 focused on experimental investigations and enhancement of supercontinuum generation in As 2 S 3 suspended-core MOFs. We successfully demonstrated an experimental supercontinuum spanning over 2000 nm in As 2 S 3 suspended-core MOF. During our investigations, we have encountered detrimental physical and optical phenomena, namely aging phenomena. The MOF core undergoes a significant shift of its optical and chemical properties under atmospheric conditions. This process should be taken into account when new As 2 S 3 broadband sources are to be developed. In the light of the aforementioned, the protection of fiber devices is required. Thanks to a preventive protection procedure, we controlled the deleterious naturally induced drift of optical and chemical properties of the fiber device. Consequently, we successfully increased the continuum bandwidth up to 3500 nm on protected fibers. It is worth to note that in both cases, As 2 S 3 MOFs used in these experiments are of the same length scale. They also exhibit the same geometric design and comparable optical loss levels. In addition, these fibers were pumped using the same pump source in similar pumping conditions (pumped in their anomalous dispersion regime, close to their ZWD). Thus, the spectral improvement described on protected sample is mainly attributed to the management of the aging process. In the framework of these experiments, we elucidated the nonlinear mechanisms responsible for the spectral broadening and limitations that prevent the MIR extension of the SC towards long wavelength edge. We showed that the supercontinuum generated within the fibers is characterized by a strong and rapid self-phase modulation process, followed by soliton fission in the earlier centimeters of the fiber. In addition, the spectrum MIR wavelength edge is primarily limited by the hydrogenated (OH and SH) extrinsic absorption losses, and their time evolution, leading to a discrepancy between simulation results and experimental ones. We adjusted this scatter by considering additional losses of hydrogenated 202
225 Conclusions and future work absorptions (OH at 2.9 µm and SH at 4.0 µm). Compared to values measured on freshly drawn fiber, the absolute content of OH and SH moieties in the MOF core have increased 1000 times upon 12 days of exposure to atmospheric conditions. Part 3 focused on studying in details the detrimental aging process occurring within As 2 S 3 microstructured fibers upon exposure to atmospheric conditions, which is responsible of the collapse of the spectrum spanning. We extensively studied the optical, morphological and chemical aging behavior of As 2 S 3 glass fibers. We studied the optical degradation of large core As 2 S 3 -MOF exposed to the atmospheric water vapor using FTIR technique. We showed that the deleterious effects of moisture rapidly occur over the first few hours of exposure and continue to progress over time. This optical aging manifests itself as a strong increase of OH and SH absorption bands. We confirmed that the aging process begins by adsorption of water molecules on the glass surface, especially on the MOF core, and progresses by a substantial decomposition reaction of the glass structure, leading to breakage of glassy backbone of As-S bonds within the glass matrix and formation of As-OH and S-H bonds. Besides that, we showed that the distribution of these bonds along the fiber core is not homogeneous, it decreases exponentially from the fibre ends towards the centre. This confirmed that atmospheric steam diffuses through the MOF holey structure from the fibre ends. This behavior has highly detrimental repercussions on the spectral broadening, since the nonlinear effects from which originates a spectral spanning take place within the first millimeters of the MOF as previously confirmed in part 2. This has implications for the special storage of MOF in suitable conditions, immediately after the drawing process. We succeed to achieve this purpose by airproofing the holes of the MOF. This technique allows a continuous protection of the guiding-core of the MOF during optical experiments. In the framework of these experiments, the naturally induced deterioration of the glass surface under ambient conditions is confirmed. The surface aging is observed as an increase of surface imperfections which are essentially associated with bumps, holes and cracks. However, these surface features evolve sequentially under wet atmosphere. The first step consists of formation of regular pyramidal crystals of As 2 O 3 randomly dispersed on the surface, resulting from the reaction between the glass network and the surrounding ambient steam containing atmosphere. On second step, these crystals amalgamate themselves in growth sites and give rise to new clusters. In a last stage, holes dig within the glass volume. 203
226 Conclusions and future work We experimentally showed that the contamination of the glass diffuses in depth inside the glass from its exposed surface. The set of these phenomena exclusively appears under wet atmosphere. The dynamics of these modifications might be accelerated by increasing the humidity and the temperature of the storage compartment. Part 4 confirms by experimental achievements the ability of optimization of the composition and synthesis of germanium-based Ge-S-Se chalcogenide glasses for successful fiber drawing, unlike Ge-S and Ge-Ga-S compounds. The purpose of these experiments is to develop green non toxic germanium-based chalcogenide glass fibers, free from highly toxic arsenic and antimony elements. We optimized the glass synthesis process, including the timetemperature synthesis profile, the synthesis glassware dimensions, and the melt quenching technique. Finally, as major results, a very broad infrared supercontinuum generation with a very flat spectrum, almost three octave spanning, between around 0.5 µm and 4 µm, has been obtained in an As 2 S 3 MOF. The actual limitations of these MOFs, preventing further extension of the supercontinuum in the infrared, have been understood and explained. Despite that the As-S MOF is highly sensitive to atmospheric conditions, benefit of its potential remains possible, but this imposes the need to protect continuously the MOF s core along the fiber lifetime. By maintaining the advantageous MOF geometry, such purpose is achieved by sealing the holes as proposed in this work. Therefore additional work is still needed to optimize the seeling materials and the seeling technique. Another possible strategy is to develop devices allowing the fiber to operate continuously in a controlled dry atmosphere. In the context of the progressive implementation of REACH reglementation, early green germanium-based arsenic and antimony-free glass fibers have been promissingly developed. Of course, future work should emphasize on the optimization of the glass optical quality, but purification processes already exist for that purpose, and there is no doubt that this target will be reached. Efficient green MOFs will require to engineer and optimized chromatic dispersive properties through adequate transverse profile with regards to their refractive index behavior (pattern, pitch, holes diameter, core size.) The room temperature drilling for preform preparation and the fiber drawing parameters will need to be adjust for these fibers and it will be necessary to characterize the behavior of these green fibers cores under room atmospheric conditions. 204
227 Appendix APPENDIX 205
228 Appendix Appendix 1 : Fourrier Transform Infrared Spectroscopy (FTIR). Appendix 1 : Fourrier Transform Infrared Spectroscopy (FTIR). 1. Theory Infrared spectroscopy (IR) is one of the most important tools to investigate the glass optical quality by probing molecular absorption of species formed within the glass systems in the course of synthesis process. In addition, IR is highly suitable method to study relevant adsorption systems on surfaces in course of adsorption reaction. The principle of infrared spectroscopy is based on the vibrational excitation of molecules by absorption of infrared light[4]. The information of these vibrational spectra is related to the chemical nature of the absorbing species within the glass volume, as well as the chemical nature of adsorbed molecules and also to the substrate and adsorbate-adsorbate interactions. In an infrared absorption experiment, infrared radiation with an intensity I 0 and frequency ν 0 = c λ 0 is passed through a sample and the intensity of the transmitted light I is measured as a function of its frequency. Absorption of light at ΔE = hν 0 = h c λ 0 [5]occurs at frequencies corresponding to the energies of vibrational transitions. The function is described as Beer-Lambert law[5, 6]: I = I 0. exp( εlc) Here, I 0 and I denote the intensities of the incident and transmitted beams, respectively, ε is the molecular absorption coefficient, c and l are the concentration of the sample and the cell length, respectively. In IR spectroscopy, both the percentage transmission (T(%)), and absorbance (A) are usually plotted versus the wave number. The definitions of T and A are T(%) = 100 I I 0 and A = log(i 0 /I) = εlc Atoms of a molecule vibrate with a definite frequencies that depends on the mass of the atoms, the force of the binding and the structure of the molecule[5, 7]. The molecules will absorb incident electromagnetic radiations at characteristic frequencies corresponding to the energy of vibration of molecules, providing that a change in dipole moment occurs with the vibrations. [5, 7, 8] For better understanding of absorption dynamics, the basic principles of infrared spectroscopy shall be explained. 206

229 2. Harmonic and Anharmonic oscillators Appendix Appendix 1 : Fourrier Transform Infrared Spectroscopy (FTIR). Vibrational transitions in a molecule occur between distinct vibrational energy levels[5, 7]. Intramolecular vibrations and intermolecular vibrations are contributing to the spectrum. The simplest possible situation is a vibration between two atoms of a diatomic molecule. F = k(r r 0 ) m 1 m 2 Contraction m 1 m 2 Equilibrium m 1 m2 Expansion r r 0 r Figure 81: Model of oscillating diatomic molecules vibrating around an equilibrium distance "r 0 " The atoms are separated by r inter-nuclear distance which represents the bond length. An attempt to squeeze the atoms more closely together will lead to a rapid increase of the repulsive force between the two atoms. An attempt to pull them apart is resisted by the attractive force. Both displacements require an input of energy which can be described as a function of the distance between the two atoms. Considering two spheres of the masses m 1 and m 2 connected through a spring [7]. The force of compression or expansion is then given by Hook s law[7]: F = k(r r 0 ) 207
230 Appendix Appendix 1 : Fourrier Transform Infrared Spectroscopy (FTIR). k is a constant, r r 0 the distance difference to the equilibrium distance generated by the force (F). The force is directed against the displacement of the atoms and thus has a negative sign. The potential energy of the oscillating system: E = 1 2 K(r r 0) increases symmetrically when the distance between both atoms is decreased or increased compared to the equilibrium distance. The vibration of such a diatomic molecule is characterized by an oscillation frequency that is given by classical mechanics [4]: ν vib = 1 2 k µ Here, µ represents the reduced mass of the considered system, it is given by [4]: µ = m 1 m 2 m 1 + m 2 It clearly seen that the oscillation frequency exclusively depends on the masses of oscillating atoms and on the force constant. Consequently, as the mass of an oscillating atom increases, the frequency of the vibration decreases. In contrast to classical mechanics, vibrational energies of molecules are quantized like all other molecular energies. The allowed vibrational energies are expressed as follow [4]: E ν = ν ν vib where v is called the vibrational quantum number. The equation implies that the lowest vibrational energy (i.e. forν = 0) is E = 1 2 ν. The implication is that a molecule can never have zero vibrational energy; the atoms can never be without a vibrational motion. The quantity E = 1 2 ν is known as the zero-point energy, that depends on the classical oscillation frequency and hence on the strength of the chemical bond and on the masses of atoms that participate in this bond. Further use of the quantum mechanics leads to a simple selection rule for the harmonic oscillator undergoing vibrational changes: Δν = ±1 208
231 Appendix Appendix 1 : Fourrier Transform Infrared Spectroscopy (FTIR). In addition to this selection rule the condition must be fulfilled that vibrational energy changes will only be observed in a spectrum if the vibration energy can interact with adiation,i.e. if the dipole moment of the molecule is changing with the vibration. Thus infrared spectracan be observed only in heteronuclear diatomic molecules, since homonuclear diatomic molecules have no dipole moment. The energy of a transition between two vibrational states is then given by: E ν 1 E ν = ν ν ν ν = ν To have resonance between the vibrating molecule and the exciting radiation, the frequency of the radiation must be identical to the frequency of the vibration. The above resolution presumed that the vibration behavior of the interconnected masses could be described by the harmonic motion. In fact, the bonds connecting the atoms are elastic, but do not exhibit a harmonic vibrations, thus, they do not obey the Hook's law [4]. The oscillations are characterized by maximum stretching amplitude. Above this characteristic stretching amplitude, the bonds can break and the molecule will dissociate. A purely empiric description of such a behavior of diatomic anharmonic oscillators is proposed by P.M. Morse and given as follow [4]: E = D 1 exp a r r 2 0 where D is the dissociation energy and a represents a characteristic constant of particular bond in a specific electronic state. An expression of vibrational energy in terms of harmonic frequency ν and the anharmonicity constant χ is given as follow [4]: E ν = ν ν ν νχ The energy of the anharmonic oscillators is adjusted to that of harmonic one through this equation. Anharmonic behavior induces tow main features comparing to harmonic vibrations. Firstly, the energy between two successive vibrational levels changes as a function of the bond length. For anharmonic oscillators, this energy decreases as the bond length increases (Figure 82 (b)), whereas it maintains a constant value for harmonic oscillators under the same conditions Figure 82 (a)). Secondly, for harmonic oscillators, permitted vibrational changes 209
232
233 Appendix Appendix 1 : Fourrier Transform Infrared Spectroscopy (FTIR). molecule in space is described by three degrees of translational freedom (x, y, z). For the rotational motion of a nonlinear molecule we need additional three degrees of freedom (x, y, z), for a linear molecule just two since the rotation around the bond axis of a linear molecule does not result in a change of the coordinates of the atoms. Therefore, a non-linear molecule must have 3N 3 3 = 3N 6 (for non-linear molecules) and 3N 3 2 = 3N 5 (for linear molecules) degrees of freedom of internal vibration [5]. Depending on the maintenance of the symmetry in the molecule, vibrations are classified as symmetric and asymmetric vibrations. 4. Fourrier Transform Infrared Spectrometer Modern spectrometers especially those used in infrared spectroscopy, today almost always make use of Fourier transform techniques to record the spectrum. The heart of the Fourier transform infrared spectrometer is a Michelson interferometer, a device for analyzing the frequencies present in a composite signal. Fixed mirror Broadband IR source I 0 /2 I 0 /2 Translating mirror Beamsplitter Detector Translation movements Figure 83 : Schematic diagram of the Michelson Interferometer. Figure 83 displays a schematic diagram of the Michelson interferometer[6, 9]. The interferometer consists of a broadband IR source, beamsplitter, fixed mirror, moving mirror and a detector. The collimated incident IR beam I is partially transmitted to the moving mirror and partially reflected to the fixed mirror by the beam splitter. These two IR beams are then reflected back to the beam splitter by the mirrors. The moving mirror modulates each frequency of light with a different modulation frequency. In general, the paths of light returning from the fix mirror and the moving mirror are not in phase. The reflected beams 211
234 Appendix Appendix 1 : Fourrier Transform Infrared Spectroscopy (FTIR). interfere constructively or destructively depending on the wavelength of the light and the optical path difference between the mirrors. The latter is usually referred to as retardation, δ. The resulting beam intensity I(δ), called interferogram. If the path difference δ is zero, constructive interference occurs, leading to a maximum in the interferogram. For all the other δ values a partial or totally destructive interference occurs, resulting in a fast oscillation decrease on both sides of the interferogram maximum [9]. As mentionned above, detected signal oscillates as the two components alternately come into and out of phase as the path difference is changed. If the radiation has the wavenumber υ = υ c = 1 λ = E c, the intensity of the detected signal due to radiation in the range of wavenumbers varies with the difference in path length δ as follow: I δ = 0 I υ (1 + cos 2πυδ)dυ Performing a mathematical Fourier transform on this signal results in a spectrum identical to that from conventional infrared spectroscopy. The variation in intensity as a function of wavenumber I υ is given by: I υ = 4 0 I δ 1 2 I(0) cos 2πυδ dδ This integration is usually performed by a computer that is interfaced to the spectrometer. FTIR spectrometers are strongly advantageous comparing to classical spectrometers. They are cheaper than conventional spectrometers because building of interferometers is easier than the fabrication of a monochromator. In addition, measurement of a single spectrum is faster for the FTIR technique because the information at all frequencies is collected simultaneously. This allows multiple samples to be collected and averaged together resulting in an improvement in sensitivity. Virtually all modern infrared spectrometers are FTIR instruments. 212
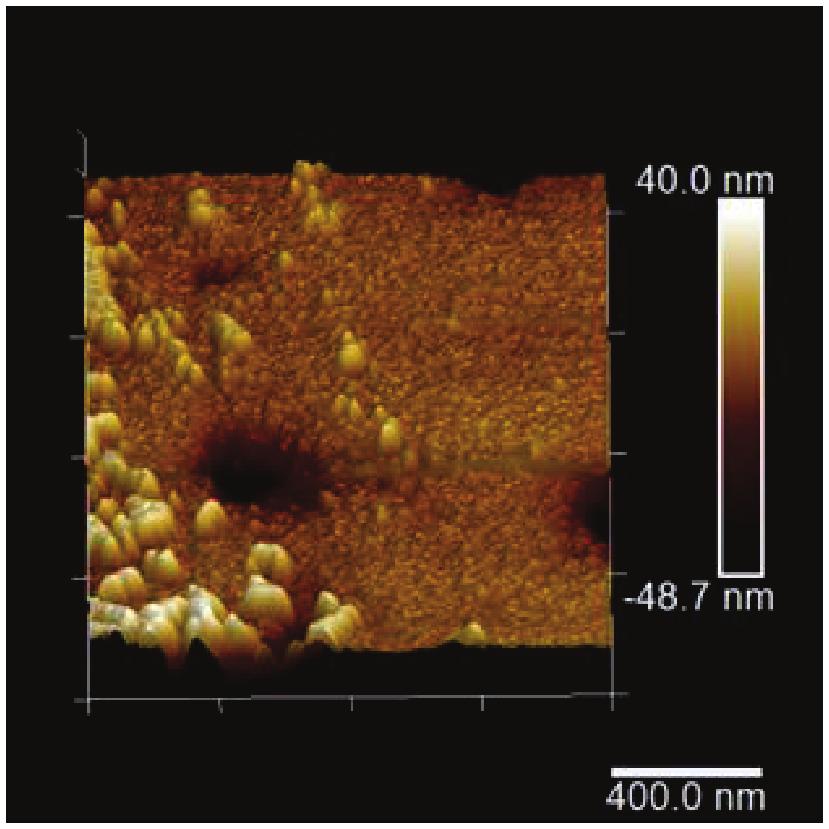
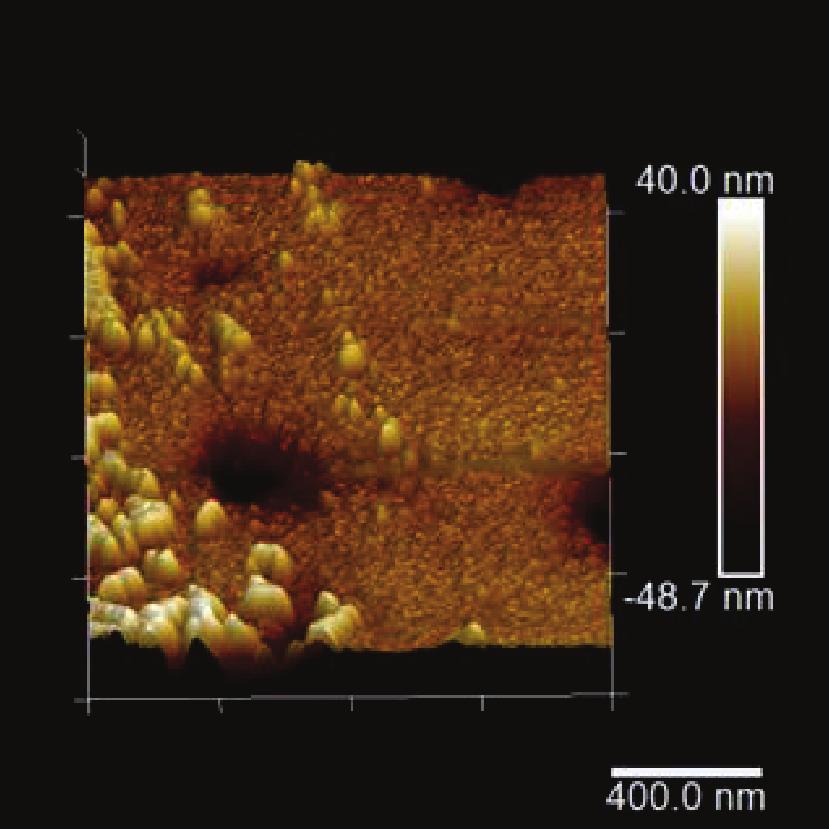
235
Nonlinear effects generation in suspended core chalcogenide fibre
 Nonlinear effects generation in suspended core chalcogenide fibre M. El-Amraoui a, M. Duhant b, F. Desevedavy a, W. Renard b, G. Canat b, G. Gadret a, J.-C. Jules a, J. Fatome a, B. Kibler a, G. Renversez
Optical Fiber Signal Degradation
 Optical Fiber Signal Degradation Effects Pulse Spreading Dispersion (Distortion) Causes the optical pulses to broaden as they travel along a fiber Overlap between neighboring pulses creates errors Resulting
Sources supercontinuum visibles à base de fibres optiques microstructurées
 Sources supercontinuum visibles à base de fibres optiques microstructurées P. Leproux XLIM - Université de Limoges Journées Thématiques CMDO+, Palaiseau, 24-25 nov. 2008 Palaiseau, 25/11/2008 - P. Leproux
International Conference on Information Sciences, Machinery, Materials and Energy (ICISMME 2015)
") International Conference on Information Sciences, Machinery, Materials and Energy (ICISMME 2015) Numerical modelling the ultra-broadband mid-infrared supercontinuum generation in the As2Se3 photonic crystal
International Conference on Information Sciences, Machinery, Materials and Energy (ICISMME 2015) Numerical modelling the ultra-broadband mid-infrared supercontinuum generation in the As2Se3 photonic crystal
Photonic Communications Engineering I
 Photonic Communications Engineering I Module 3 - Attenuation in Optical Fibers Alan E. Willner Professor, Dept. of Electrical Engineering - Systems, University of Southern California and Thrust 1 Lead
Highly Nonlinear Fibers and Their Applications
 1/32 Highly Nonlinear Fibers and Their Applications Govind P. Agrawal Institute of Optics University of Rochester Rochester, NY 14627 c 2007 G. P. Agrawal Introduction Many nonlinear effects inside optical
QUESTION BANK IN PHYSICS
 QUESTION BANK IN PHYSICS LASERS. Name some properties, which make laser light different from ordinary light. () {JUN 5. The output power of a given laser is mw and the emitted wavelength is 630nm. Calculate
Nonlinear Effects in Optical Fiber. Dr. Mohammad Faisal Assistant Professor Dept. of EEE, BUET
 Nonlinear Effects in Optical Fiber Dr. Mohammad Faisal Assistant Professor Dept. of EEE, BUET Fiber Nonlinearities The response of any dielectric material to the light becomes nonlinear for intense electromagnetic
OPTI510R: Photonics. Khanh Kieu College of Optical Sciences, University of Arizona Meinel building R.626
 OPTI510R: Photonics Khanh Kieu College of Optical Sciences, University of Arizona kkieu@optics.arizona.edu Meinel building R.626 Announcements Homework #4 is assigned, due March 25 th Start discussion
Chalcogenide glass Photonic Crystal Fiber with flattened dispersion and high nonlinearity at telecommunication wavelength
 Chalcogenide glass Photonic Crystal Fiber with flattened dispersion and high nonlinearity at telecommunication wavelength S.REVATHI #, ABHIJITH CHANDRAN #, A. AMIR #3, SRINIVASA RAO INBATHINI #4 # School
Propagation losses in optical fibers
 Chapter Dielectric Waveguides and Optical Fibers 1-Fev-017 Propagation losses in optical fibers Charles Kao, Nobel Laureate (009) Courtesy of the Chinese University of Hong Kong S.O. Kasap, Optoelectronics
Fiber-Optics Group Highlights of Micronova Department of Electrical and Communications Engineering Helsinki University of Technology
 Highlights of 2004 Micronova Department of Electrical and Communications Engineering Micronova Seminar 3 December 2004 Group Leader: Hanne Ludvigsen Postdoctoral researcher: Goëry Genty Postgraduate students:
Two octaves mid-infrared supercontinuum generation in As 2 Se 3 microwires
 Two octaves mid-infrared supercontinuum generation in As 2 Se 3 microwires Alaa Al-kadry, 1, Mohammed El Amraoui, 2 Younès Messaddeq, 2 and Martin Rochette 1 1 Department of Electrical and Computer Engineering,
OPTICAL COMMUNICATIONS S
 OPTICAL COMMUNICATIONS S-108.3110 1 Course program 1. Introduction and Optical Fibers 2. Nonlinear Effects in Optical Fibers 3. Fiber-Optic Components I 4. Transmitters and Receivers 5. Fiber-Optic Measurements
Demonstration of ultra-flattened dispersion in photonic crystal fibers
 Demonstration of ultra-flattened dispersion in photonic crystal fibers W.H. Reeves, J.C. Knight, and P.St.J. Russell Optoelectronics Group, School of Physics, University of Bath, Claverton Down, Bath,
PRINCIPLES OF PHYSICAL OPTICS
 PRINCIPLES OF PHYSICAL OPTICS C. A. Bennett University of North Carolina At Asheville WILEY- INTERSCIENCE A JOHN WILEY & SONS, INC., PUBLICATION CONTENTS Preface 1 The Physics of Waves 1 1.1 Introduction
Te-As-Se glass microstructured optical fiber for the middle infrared
 Te-As-Se glass microstructured optical fiber for the middle infrared Frédéric Désévédavy, 1,5 Gilles Renversez, 4 Johann Troles, 1, * Laurent Brilland, 2 Patrick Houizot, 1 Quentin Coulombier, 1 Frédéric
Nonlinear effects and pulse propagation in PCFs
 Nonlinear effects and pulse propagation in PCFs --Examples of nonlinear effects in small glass core photonic crystal fibers --Physics of nonlinear effects in fibers --Theoretical framework --Solitons and
Dielectric Waveguides and Optical Fibers. 高錕 Charles Kao
 Dielectric Waveguides and Optical Fibers 高錕 Charles Kao 1 Planar Dielectric Slab Waveguide Symmetric Planar Slab Waveguide n 1 area : core, n 2 area : cladding a light ray can undergo TIR at the n 1 /n
Chapter 24 Photonics Question 1 Question 2 Question 3 Question 4 Question 5
 Chapter 24 Photonics Data throughout this chapter: e = 1.6 10 19 C; h = 6.63 10 34 Js (or 4.14 10 15 ev s); m e = 9.1 10 31 kg; c = 3.0 10 8 m s 1 Question 1 Visible light has a range of photons with wavelengths
Analysis and Modeling of Microstructured Fiber Using The Analytical Method Based on The Empirical Equation
 Analysis and Modeling of Microstructured Fiber Using The Analytical Method Based on The Empirical Equation DEBBAL Mohammed 1, CHIKH-BLED Mohammed 2 1 University of Tlemcen, Algeria, Department of electrical
The Glass Ceiling: Limits of Silica. PCF: Holey Silica Cladding
 The Glass Ceiling: Limits of Silica Loss: amplifiers every 50 100km limited by Rayleigh scattering (molecular entropy) cannot use exotic wavelengths like 10.µm Breaking the Glass Ceiling: Hollow-core Bandgap
Generation of supercontinuum light in photonic crystal bers
 Generation of supercontinuum light in photonic crystal bers Koji Masuda Nonlinear Optics, Fall 2008 Abstract. I summarize the recent studies on the supercontinuum generation (SC) in photonic crystal fibers
Title. Author(s)Nagasaki, Akira; Saitoh, Kunimasa; Koshiba, Masanori. CitationOptics Express, 19(4): Issue Date Doc URL.
Nagasaki, Akira; Saitoh, Kunimasa; Koshiba, Masanori. CitationOptics Express, 19(4): Issue Date Doc URL.") Title Polarization characteristics of photonic crystal fib Author(s)Nagasaki, Akira; Saitoh, Kunimasa; Koshiba, Masanori CitationOptics Express, 19(4): 3799-3808 Issue Date 2011-02-14 Doc URL http://hdl.handle.net/2115/45257
Title Polarization characteristics of photonic crystal fib Author(s)Nagasaki, Akira; Saitoh, Kunimasa; Koshiba, Masanori CitationOptics Express, 19(4): 3799-3808 Issue Date 2011-02-14 Doc URL http://hdl.handle.net/2115/45257
Lasers and Electro-optics
 Lasers and Electro-optics Second Edition CHRISTOPHER C. DAVIS University of Maryland III ^0 CAMBRIDGE UNIVERSITY PRESS Preface to the Second Edition page xv 1 Electromagnetic waves, light, and lasers 1
Polarization Properties of Photonic Crystal Fibers Considering Thermal and External Stress Effects
 Polarization Properties of Photonic Crystal Fibers Considering Thermal and External Stress Effects Md. Afzal Hossain*, M. Shah Alam** * Department of Computer Science and Engineering Military Institute
Laser Physics OXFORD UNIVERSITY PRESS SIMON HOOKER COLIN WEBB. and. Department of Physics, University of Oxford
 Laser Physics SIMON HOOKER and COLIN WEBB Department of Physics, University of Oxford OXFORD UNIVERSITY PRESS Contents 1 Introduction 1.1 The laser 1.2 Electromagnetic radiation in a closed cavity 1.2.1
Mode-Field Diameter (MFD)
") Mode-Field Diameter (MFD) Important parameter determined from mode-field distribution of fundamental LP 01 mode. Characterized by various models Main consideration: how to approximate the electric field
Mode-Field Diameter (MFD) Important parameter determined from mode-field distribution of fundamental LP 01 mode. Characterized by various models Main consideration: how to approximate the electric field
Empirical formulae for hollow-core antiresonant fibers: dispersion and effective mode area
 Empirical formulae for hollow-core antiresonant fibers: dispersion and effective mode area MD IMRAN HASAN, * NAIL AKHMEDIEV, AND WONKEUN CHANG Optical Sciences Group, Research School of Physics and Engineering,
Copyright 2008 IEEE. Reprinted from IEEE Journal of Selected Topics in Quantum Electronics, 2007; 13 (3):
:") Copyright 2008 IEEE. Reprinted from IEEE Journal of Selected Topics in Quantum Electronics, 2007; 13 (3):738-749 This material is posted here with permission of the IEEE. Such permission of the IEEE does
Copyright 2008 IEEE. Reprinted from IEEE Journal of Selected Topics in Quantum Electronics, 2007; 13 (3):738-749 This material is posted here with permission of the IEEE. Such permission of the IEEE does
Maximizing the Bandwidth from Supercontinuum Generation in Photonic Crystal Chalcogenide Fibers
 Maximizing the Bandwidth from Supercontinuum Generation in Photonic Crystal Chalcogenide Fibers Curtis R. Menyuk based on the PhD dissertation of: Dr. Jonathan Hu now at Princeton University 1 Report Documentation
Nanomaterials and their Optical Applications
 Nanomaterials and their Optical Applications Winter Semester 2012 Lecture 08 rachel.grange@uni-jena.de http://www.iap.uni-jena.de/multiphoton Outline: Photonic crystals 2 1. Photonic crystals vs electronic
Finite Element Method
 Appendix A Finite Element Method A.1 Formulation All the analyses of the PCF properties presented in this book have been performed by using the FEM. The FEM allows the PCF cross-section in the transverse
Nanophysics: Main trends
 Nano-opto-electronics Nanophysics: Main trends Nanomechanics Main issues Light interaction with small structures Molecules Nanoparticles (semiconductor and metallic) Microparticles Photonic crystals Nanoplasmonics
Model Answer (Paper code: AR-7112) M. Sc. (Physics) IV Semester Paper I: Laser Physics and Spectroscopy
 M. Sc. (Physics) IV Semester Paper I: Laser Physics and Spectroscopy") Model Answer (Paper code: AR-7112) M. Sc. (Physics) IV Semester Paper I: Laser Physics and Spectroscopy Section I Q1. Answer (i) (b) (ii) (d) (iii) (c) (iv) (c) (v) (a) (vi) (b) (vii) (b) (viii) (a) (ix)
Model Answer (Paper code: AR-7112) M. Sc. (Physics) IV Semester Paper I: Laser Physics and Spectroscopy Section I Q1. Answer (i) (b) (ii) (d) (iii) (c) (iv) (c) (v) (a) (vi) (b) (vii) (b) (viii) (a) (ix)
Module 3 - Attenuation in Optical Fibers
 Module 3 - Attenuation in Optical Fibers Dr. B.G. Potter Professor, Material Science and Engineering Dept, University of Arizona Dr. B.G.Potter is a Professor of Material Science and Engineering in the
Temperature ( o C)
") Viscosity (Pa sec) Supplementary Information 10 8 10 6 10 4 10 2 150 200 250 300 Temperature ( o C) Supplementary Figure 1 Viscosity of fibre components (PC cladding blue; As 2 Se 5 red; CPE black) as
Viscosity (Pa sec) Supplementary Information 10 8 10 6 10 4 10 2 150 200 250 300 Temperature ( o C) Supplementary Figure 1 Viscosity of fibre components (PC cladding blue; As 2 Se 5 red; CPE black) as
Thermal conversion of solar radiation. c =
 Thermal conversion of solar radiation The conversion of solar radiation into thermal energy happens in nature by absorption in earth surface, planetary ocean and vegetation Solar collectors are utilized
Optical Peregrine soliton generation in standard telecommunications fiber
 Optical Peregrine soliton generation in standard telecommunications fiber Kamal Hammani, Bertrand Kibler, Christophe Finot, Julien Fatome, John M. Dudley, Guy Millot To cite this version: Kamal Hammani,
Lecture 4 Fiber Optical Communication Lecture 4, Slide 1
 ecture 4 Dispersion in single-mode fibers Material dispersion Waveguide dispersion imitations from dispersion Propagation equations Gaussian pulse broadening Bit-rate limitations Fiber losses Fiber Optical
Optical Spectroscopy of Advanced Materials
 Phys 590B Condensed Matter Physics: Experimental Methods Optical Spectroscopy of Advanced Materials Basic optics, nonlinear and ultrafast optics Jigang Wang Department of Physics, Iowa State University
PHOTONIC BANDGAP FIBERS
 UMEÅ UNIVERSITY May 11, 2010 Department of Physics Advanced Materials 7.5 ECTS PHOTONIC BANDGAP FIBERS Daba Dieudonne Diba dabadiba@gmail.com Supervisor: Andreas Sandström Abstract The constant pursuit
Lect. 15: Optical Fiber
 3-dimentioanl dielectric waveguide? planar waveguide circular waveguide optical fiber Optical Fiber: Circular dielectric waveguide made of silica (SiO ) y y n n 1 n Cladding Core r z Fiber axis SiO :Ge
Development of As-Se tapered suspended-core fibers for ultra-broadband mid-ir wavelength conversion
 Development of As-Se tapered suspended-core fibers for ultra-broadband mid-ir wavelength conversion E.A. Anashkina 1,2,*, V.S. Shiryaev 3, M.Y. Koptev 1, B.S. Stepanov 3, S.V. Muravyev 1 1 Institute of
Abstract... I. Acknowledgements... III. Table of Content... V. List of Tables... VIII. List of Figures... IX
 Abstract... I Acknowledgements... III Table of Content... V List of Tables... VIII List of Figures... IX Chapter One IR-VUV Photoionization Spectroscopy 1.1 Introduction... 1 1.2 Vacuum-Ultraviolet-Ionization
Electromagnetic Wave Guidance Mechanisms in Photonic Crystal Fibers
 Electromagnetic Wave Guidance Mechanisms in Photonic Crystal Fibers Tushar Biswas 1, Shyamal K. Bhadra 1 1 Fiber optics and Photonics Division, CSIR-Central Glass and Ceramic Research Institute *196, Raja
37. 3rd order nonlinearities
 37. 3rd order nonlinearities Characterizing 3rd order effects The nonlinear refractive index Self-lensing Self-phase modulation Solitons When the whole idea of χ (n) fails Attosecond pulses! χ () : New
37. 3rd order nonlinearities
 37. 3rd order nonlinearities Characterizing 3rd order effects The nonlinear refractive index Self-lensing Self-phase modulation Solitons When the whole idea of χ (n) fails Attosecond pulses! χ () : New
Nonlinear Optical Effects in Fibers
 Nonlinear Optical Effects in Fibers NLO effects are manifested as attenuation, phase shifts, or wavelength conversion effects, and become stronger with increasing light intensity. The glass materials usually
FIBER OPTICS. Prof. R.K. Shevgaonkar. Department of Electrical Engineering. Indian Institute of Technology, Bombay. Lecture: 07
 FIBER OPTICS Prof. R.K. Shevgaonkar Department of Electrical Engineering Indian Institute of Technology, Bombay Lecture: 07 Analysis of Wave-Model of Light Fiber Optics, Prof. R.K. Shevgaonkar, Dept. of
Optical Fiber Concept
 Optical Fiber Concept Optical fibers are light pipes Communications signals can be transmitted over these hair-thin strands of glass or plastic Concept is a century old But only used commercially for the
Advanced Vitreous State The Physical Properties of Glass
 Advanced Vitreous State The Physical Properties of Glass Active Optical Properties of Glass Lecture 21: Nonlinear Optics in Glass-Applications Denise Krol Department of Applied Science University of California,
Research Article Nonlinear Phenomena of Ultra-Wide-Band Radiation in a Photonic Crystal Fibre
 International Optics Volume 2, Article ID 3748, 6 pages doi:./2/3748 Research Article Nonlinear Phenomena of Ultra-Wide-Band Radiation in a Photonic Crystal Fibre Rim Cherif and Mourad Zghal Cirta Com
Negative curvature fibers
 504 Vol. 9, No. 3 / September 2017 / Advances in Optics and Photonics Review Negative curvature fibers CHENGLI WEI, 1 R. JOSEPH WEIBLEN, 2 CURTIS R. MENYUK, 2 AND JONATHAN HU 1,* 1 Department of Electrical
Performance Limits of Delay Lines Based on "Slow" Light. Robert W. Boyd
 Performance Limits of Delay Lines Based on "Slow" Light Robert W. Boyd Institute of Optics and Department of Physics and Astronomy University of Rochester Representing the DARPA Slow-Light-in-Fibers Team:
Fiber Gratings p. 1 Basic Concepts p. 1 Bragg Diffraction p. 2 Photosensitivity p. 3 Fabrication Techniques p. 4 Single-Beam Internal Technique p.
 Preface p. xiii Fiber Gratings p. 1 Basic Concepts p. 1 Bragg Diffraction p. 2 Photosensitivity p. 3 Fabrication Techniques p. 4 Single-Beam Internal Technique p. 4 Dual-Beam Holographic Technique p. 5
Plasma Formation and Self-focusing in Continuum Generation
 Plasma Formation and Self-focusing in Continuum Generation Paper by Andrew Parkes Advisors: Jennifer Tate, Douglass Schumacher The Ohio State University REU 2003 Supported by NSF I. Abstract This summer
Propagation of Surface Plasmon Polariton in the Single Interface of Gallium Lanthanum Sulfide and Silver
 PHOTONIC SENSORS / Vol., No., : 58 6 Propagation of Surface Plasmon Polariton in the Single Interface of Gallium Lanthanum Sulfide and Silver Rakibul Hasan SAGOR, Md. Ghulam SABER *, and Md. Ruhul AMIN
Introduction to optical waveguide modes
 Chap. Introduction to optical waveguide modes PHILIPPE LALANNE (IOGS nd année) Chapter Introduction to optical waveguide modes The optical waveguide is the fundamental element that interconnects the various
X-Rays From Laser Plasmas
 X-Rays From Laser Plasmas Generation and Applications I. C. E. TURCU CLRC Rutherford Appleton Laboratory, UK and J. B. DANCE JOHN WILEY & SONS Chichester New York Weinheim Brisbane Singapore Toronto Contents
Photonic crystal fiber with a hybrid honeycomb cladding
 Photonic crystal fiber with a hybrid honeycomb cladding Niels Asger Mortensen asger@mailaps.org Martin Dybendal Nielsen COM, Technical University of Denmark, DK-2800 Kongens Lyngby, Denmark Jacob Riis
Measuring Laser Diode Optical Power with an Integrating Sphere
 Measuring Laser Diode Optical Power with an Integrating Sphere Introduction Characterizing radiant sources like laser diodes accurately depends on the ability to measure their optical power output accurately.
Doctor of Philosophy
 FEMTOSECOND TIME-DOMAIN SPECTROSCOPY AND NONLINEAR OPTICAL PROPERTIES OF IRON-PNICTIDE SUPERCONDUCTORS AND NANOSYSTEMS A Thesis Submitted for the degree of Doctor of Philosophy IN THE FACULTY OF SCIENCE
Principle of photonic crystal fibers
 Principle of photonic crystal fibers Jan Sporik 1, Miloslav Filka 1, Vladimír Tejkal 1, Pavel Reichert 1 1 Fakulta elektrotechniky a komunikačních technologií VUT v Brně Email: {xspori1, filka, xtejka,
SUPPLEMENTARY INFORMATION
 SUPPLEMENTARY INFORMATION Supplementary Information I. Schematic representation of the zero- n superlattices Schematic representation of a superlattice with 3 superperiods is shown in Fig. S1. The superlattice
A short tutorial on optical rogue waves
 A short tutorial on optical rogue waves John M Dudley Institut FEMTO-ST CNRS-Université de Franche-Comté Besançon, France Experiments in collaboration with the group of Guy Millot Institut Carnot de Bourgogne
Optics, Optoelectronics and Photonics
 Optics, Optoelectronics and Photonics Engineering Principles and Applications Alan Billings Emeritus Professor, University of Western Australia New York London Toronto Sydney Tokyo Singapore v Contents
Nonlinear effects in optical fibers - v1. Miguel A. Muriel UPM-ETSIT-MUIT-CFOP
 Nonlinear effects in optical fibers - v1 Miguel A. Muriel UPM-ETSIT-MUIT-CFOP Miguel A. Muriel-015/10-1 Nonlinear effects in optical fibers 1) Introduction ) Causes 3) Parameters 4) Fundamental processes
FINITE-DIFFERENCE FREQUENCY-DOMAIN ANALYSIS OF NOVEL PHOTONIC
 FINITE-DIFFERENCE FREQUENCY-DOMAIN ANALYSIS OF NOVEL PHOTONIC WAVEGUIDES Chin-ping Yu (1) and Hung-chun Chang (2) (1) Graduate Institute of Electro-Optical Engineering, National Taiwan University, Taipei,
Supplementary Figure 1 Scheme image of GIXD set-up. The scheme image of slot die
 Supplementary Figure 1 Scheme image of GIXD set-up. The scheme image of slot die printing system combined with grazing incidence X-ray diffraction (GIXD) set-up. 1 Supplementary Figure 2 2D GIXD images
Highly Birefringent Elliptical-Hole Microstructure Fibers With Low Confinement Loss
 JOURNAL OF LIGHTWAVE TECHNOLOGY, VOL. 30, NO. 21, NOVEMBER 1, 2012 3381 Highly Birefringent Elliptical-Hole Microstructure Fibers With Low Confinement Loss Wenbin Liang, Ningliang Liu, Zhihua Li, and Peixiang
Optics in a Fish Tank Demonstrations for the Classroom
 Optics in a Fish Tank Demonstrations for the Classroom Introduction: This series of demonstrations will illustrate a number of optical phenomena. Using different light sources and a tank of water, you
OPTICAL BISTABILITY AND UPCONVERSION PROCESSES IN ERBIUM DOPED MICROSPHERES
 OPTICAL BISTABILITY AND UPCONVERSION PROCESSES IN ERBIUM DOPED MICROSPHERES J. Ward, D. O Shea, B. Shortt, S. Nic Chormaic Dept of Applied Physics and Instrumentation, Cork Institute of Technology,Cork,
TIE-35: Transmittance of optical glass
 PAGE 1/12 0 Introduction Optical glasses are optimized to provide excellent transmittance throughout the total visible range from 400 to 800 nm Usually the transmittance range spreads also into the near
Liquid Crystals IAM-CHOON 1(1100 .,4 WILEY 2007 WILEY-INTERSCIENCE A JOHN WILEY & SONS, INC., PUBLICATION. 'i; Second Edition. n z
 Liquid Crystals Second Edition IAM-CHOON 1(1100.,4 z 'i; BICENTCNNIAL 1 8 0 7 WILEY 2007 DICENTENNIAL n z z r WILEY-INTERSCIENCE A JOHN WILEY & SONS, INC., PUBLICATION Contents Preface xiii Chapter 1.
Supplementary Figure 1 Schematics of an optical pulse in a nonlinear medium. A Gaussian optical pulse propagates along z-axis in a nonlinear medium
 Supplementary Figure 1 Schematics of an optical pulse in a nonlinear medium. A Gaussian optical pulse propagates along z-axis in a nonlinear medium with thickness L. Supplementary Figure Measurement of
Ultra-Slow Light Propagation in Room Temperature Solids. Robert W. Boyd
 Ultra-Slow Light Propagation in Room Temperature Solids Robert W. Boyd The Institute of Optics and Department of Physics and Astronomy University of Rochester, Rochester, NY USA http://www.optics.rochester.edu
Fadei Komarov Alexander Kamyshan
 Fadei Komarov Alexander Kamyshan Institute of Applied Physics Problems, Belarusian State University, Minsk, Belarus KomarovF@bsu.by Tasks and Objects 2 Introduction and motivation Experimental setup designed
Near-Field Nano/Atom Optics and Technology
 M. Ohtsu (Ed.) Near-Field Nano/Atom Optics and Technology With 189 Figures / Springer Preface List of Contributors V VII XIII 1. Introduction 1 1.1 Near-Field Optics and Related Technologies 1 1.2 History
Optical and Photonic Glasses. Lecture 37. Non-Linear Optical Glasses I - Fundamentals. Professor Rui Almeida
 Optical and Photonic Glasses : Non-Linear Optical Glasses I - Fundamentals Professor Rui Almeida International Materials Institute For New Functionality in Glass Lehigh University Non-linear optical glasses
Step index planar waveguide
 N. Dubreuil S. Lebrun Exam without document Pocket calculator permitted Duration of the exam: 2 hours The exam takes the form of a multiple choice test. Annexes are given at the end of the text. **********************************************************************************
Optical and Photonic Glasses. Lecture 30. Femtosecond Laser Irradiation and Acoustooptic. Professor Rui Almeida
 Optical and Photonic Glasses : Femtosecond Laser Irradiation and Acoustooptic Effects Professor Rui Almeida International Materials Institute For New Functionality in Glass Lehigh University Femto second
Preview from Notesale.co.uk Page 1 of 38
 F UNDAMENTALS OF PHOTONICS Module 1.1 Nature and Properties of Light Linda J. Vandergriff Director of Photonics System Engineering Science Applications International Corporation McLean, Virginia Light
Antiresonant reflecting optical waveguide microstructured fibers revisited: a new analysis based on leaky mode coupling
 Antiresonant reflecting optical waveguide microstructured fibers revisited: a new analysis based on leaky mode coupling Gilles Renversez, Philippe Boyer, and Angelo Sagrini Institut Fresnel (UMR CNRS 6133)
MANUFACTURE OF FIBER OPTIC SENSORS TO MEASURE THE PH WATER
 MANUFACTURE OF FIBER OPTIC SENSORS TO MEASURE THE PH WATER Bushra R. Mahdi*, Hadi Dawyich AL-Attabi**, Sadeq Dawood Salman*** * Ministry of Science and Technology, Laser and optoelectronic researcher center,
Vibrational Spectroscopies. C-874 University of Delaware
 Vibrational Spectroscopies C-874 University of Delaware Vibrational Spectroscopies..everything that living things do can be understood in terms of the jigglings and wigglings of atoms.. R. P. Feymann Vibrational
Let us consider a typical Michelson interferometer, where a broadband source is used for illumination (Fig. 1a).
.") 7.1. Low-Coherence Interferometry (LCI) Let us consider a typical Michelson interferometer, where a broadband source is used for illumination (Fig. 1a). The light is split by the beam splitter (BS) and
7.1. Low-Coherence Interferometry (LCI) Let us consider a typical Michelson interferometer, where a broadband source is used for illumination (Fig. 1a). The light is split by the beam splitter (BS) and
LASERS. Dr D. Arun Kumar Assistant Professor Department of Physical Sciences Bannari Amman Institute of Technology Sathyamangalam
 LASERS Dr D. Arun Kumar Assistant Professor Department of Physical Sciences Bannari Amman Institute of Technology Sathyamangalam General Objective To understand the principle, characteristics and types
Chemistry Instrumental Analysis Lecture 2. Chem 4631
 Chemistry 4631 Instrumental Analysis Lecture 2 Electromagnetic Radiation Can be described by means of a classical sinusoidal wave model. Oscillating electric and magnetic field. (Wave model) wavelength,
Lasers. Optical Fibres
 Lasers & Optical Fibres P a g e 2 Contents LASER 1) Coherence 3 2) Interaction of radiation with matter 4 3) Laser fundamentals 5 4) Laser system 5 5) Ruby Laser 6 6) He-Ne Gas Laser 7 7) Semiconductor
FIBER OPTICS. Prof. R.K. Shevgaonkar. Department of Electrical Engineering. Indian Institute of Technology, Bombay. Lecture: 15. Optical Sources-LASER
 FIBER OPTICS Prof. R.K. Shevgaonkar Department of Electrical Engineering Indian Institute of Technology, Bombay Lecture: 15 Optical Sources-LASER Fiber Optics, Prof. R.K. Shevgaonkar, Dept. of Electrical
Saveetha Engineering College, Thandalam, Chennai. Department of Physics. First Semester. Ph6151 Engineering Physics I (NOV/DEC 2014)
") Saveetha Engineering College, Thandalam, Chennai. Department of Physics First Semester Ph6151 Engineering Physics I (NOV/DEC 2014) Part A (Questions and Answers) 1. Distinguish between Crystalline and
Saveetha Engineering College, Thandalam, Chennai. Department of Physics First Semester Ph6151 Engineering Physics I (NOV/DEC 2014) Part A (Questions and Answers) 1. Distinguish between Crystalline and
Physics 20 Work Plan
 Units/Topics Time Frame Major Learning Outcomes Unit Major Resource(s) Assessment methods Unit 2 Wave Motion A. Properties of waves 1. Wave terminology 2. Universal wave equation 3. Principle of Superposition
OPTICAL FIBRES IN ASTRONOMY (OP-006) Course Overview
 Course Overview") OPTICAL FIBRES IN ASTRONOMY (OP-006) Course Overview The course, based on practical experience and containing several examples of real instruments, is focused on the application of optical fibres in Astronomy.
OPTICAL FIBRES IN ASTRONOMY (OP-006) Course Overview The course, based on practical experience and containing several examples of real instruments, is focused on the application of optical fibres in Astronomy.
Nanoscale IR spectroscopy of organic contaminants
 The nanoscale spectroscopy company The world leader in nanoscale IR spectroscopy Nanoscale IR spectroscopy of organic contaminants Application note nanoir uniquely and unambiguously identifies organic
Optics, Light and Lasers
 Dieter Meschede Optics, Light and Lasers The Practical Approach to Modern Aspects of Photonics and Laser Physics Second, Revised and Enlarged Edition BICENTENNIAL.... n 4 '':- t' 1 8 0 7 $W1LEY 2007 tri
University of Bath. Publication date: Document Version Peer reviewed version. Link to publication
 Citation for published version: Knight, J 2011, Photonic crystal and microstructured fibers: Making fibers better by leaving bits out. in 2011 Optical Fiber Communication Conference and Exposition and
Advanced techniques Local probes, SNOM
 Advanced techniques Local probes, SNOM Principle Probe the near field electromagnetic field with a local probe near field probe propagating field evanescent Advanced techniques Local probes, SNOM Principle
Topic 4 &11 Review Waves & Oscillations
 Name: Date: Topic 4 &11 Review Waves & Oscillations 1. A source produces water waves of frequency 10 Hz. The graph shows the variation with horizontal position of the vertical displacement of the surface