D3.js Avancé / Time Visualization
|
|
|
- Marcia Rogers
- 6 years ago
- Views:
Transcription


1 D3.js Avancé / Time Visualization Cours #3 Romain Vuillemot
2 OUTLINE SOLUTION: INTERACTIVE LINE CHART TIME VISUALIZATION ADVANCED D3.JS
3 TIME VISUALIZATION
4 what is time? Passé, présent et futur Unidirectionnel Permet la séquence d événements Permet de mesurer la durée d événements Permet de comparer des mesures aux mêmes instants Exemples de données temporelles (dont la composante principale est le temps) : calendrier, climat, etc.

5 TIME VISUALIZATION

6 TIME VISUALIZATION: TASKS!
7 TIME VISUALIZATION


8 TIME VISUALIZATION
9 TIME VISUALIZATION

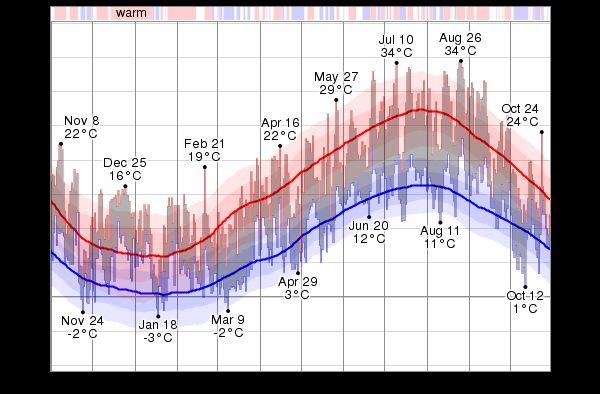
10 Marey Timeline

11 Marey Timeline

12 TIME VISUALIZATION

13 TIME VISUALIZATION
14 TIME VISUALIZATION


15 TIME VISUALIZATION: 3D & CALENDAR MAP

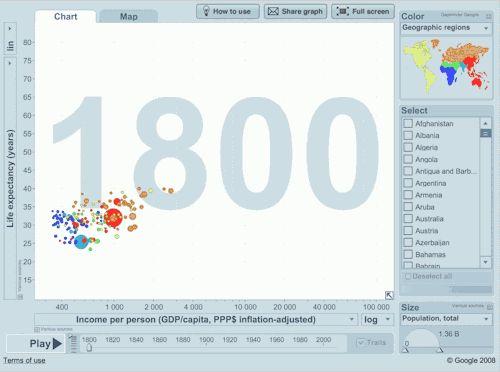
16 TIME VISUALIZATION: ANIMATION

17 TIME VISUALIZATION: CYCLIC

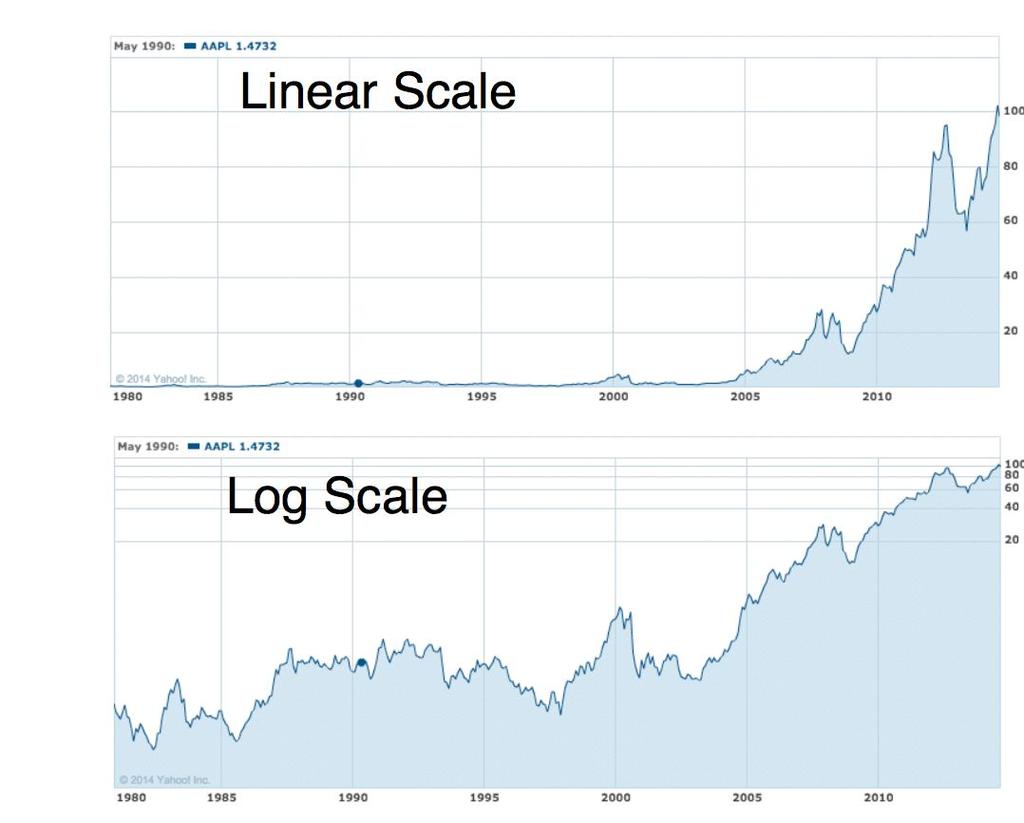
18 TIME VISUALIZATION: SCALE


19 TIME VISUALIZATION: HORIZON GRAPH

20 TIME VISUALIZATION: DERIVED DATA

21 TIME VISUALIZATION: LARGE SCALE

22 TIME VISUALIZATION: SPACE & TIME
23 GEO-MAP: GRID
24 Advanced D3
25 d3.nest var expenses = [{"name":"jim","amount":34,"date":"11/12/2015"}, expensesbyname = [ {"key":"jim","values":[ {"name":"jim","amount":34,"date":"11/12/2015"}, {"name":"carl","amount":120.11,"date":"11/12/2015"}, {"name":"jim","amount":45,"date":"12/01/2015"} {"name":"jim","amount":45,"date":"12/01/2015"}, {"name":"stacy","amount":12.00,"date":"01/04/2016"}, ]}, {"key":"carl","values":[ {"name":"carl","amount":120.11,"date":"11/12/2015"} {"name":"stacy","amount":34.10,"date":"01/04/2016"}, {"name":"stacy","amount":44.80,"date":"01/05/2016"} ]}, {"key":"stacy","values":[ ]; {"name":"stacy","amount":12.00,"date":"01/04/2016"}, {"name":"stacy","amount":34.10,"date":"01/04/2016"}, var expensesbyname = d3.nest().key(function(d) { return d.name; }).entries(expenses); {"name":"stacy","amount":44.80,"date":"01/05/2016"} ]} ];
 { return d.length; })]); var bar = svg.selectall(\".bar\").data(bins).enter().append(\"g\").attr(\"class\", \"bar\").attr(\"transform\", function(d) { return \"translate(\" + x(d.")
26 Histogram var histogram = d3.histogram().value(function(d) { return d.date; }).domain(x.domain()).thresholds(x.ticks(d3.timeweek)); var bins = histogram(data); y.domain([0, d3.max(bins, function(d) { return d.length; })]); var bar = svg.selectall(".bar").data(bins).enter().append("g").attr("class", "bar").attr("transform", function(d) { return "translate(" + x(d.x0) + "," + y(d.length) + ")"; }); bar.append("rect").attr("x", 1).attr("width", function(d) { return x(d.x1) - x(d.x0) - 1; }).attr("height", function(d) { return height - y(d.length); }); bar.append("text").attr("dy", ".75em").attr("y", 6).attr("x", function(d) { return (x(d.x1) - x(d.x0)) / 2; }).attr("text-anchor", "middle").text(function(d) { return formatcount(d.length); });
27 Node-link Graph & Treemap { "nodes": [ {"id": "Myriel", "group": 1}, {"id": "Napoleon", "group": 1}, {"id": "Mlle.Baptistine", "group": 1}, {"id": "Mme.Magloire", "group": 1}, {"id": "CountessdeLo", "group": 1}, {"id": "Mme.Hucheloup", "group": 8} ], "links": [ {"source": "Napoleon", "target": "Myriel", "value": 1}, {"source": "Mlle.Baptistine", "target": "Myriel", "value": 8}, {"source": "Mme.Magloire", "target": "Myriel", "value": 10}, {"source": "Mme.Magloire", "target": "Mlle.Baptistine", "value": 6}, {"source": "CountessdeLo", "target": "Myriel", "value": 1}, {"source": "Geborand", "target": "Myriel", "value": 1} {"source": "Mme.Hucheloup", "target": "Enjolras", "value": 1} ] }
28 Node-link Graph function ticked() { link.attr("x1", function(d).attr("y1", function(d).attr("x2", function(d).attr("y2", function(d) { { { { return return return return d.source.x; }) d.source.y; }) d.target.x; }) d.target.y; }); node.attr("cx", function(d) { return d.x; }).attr("cy", function(d) { return d.y; }); } });
29 Pie Chart var pie = d3.pie().sort(null).value(function(d) { return d.population; }); var path = d3.arc().outerradius(radius - 10).innerRadius(0); var label = d3.arc().outerradius(radius - 40).innerRadius(radius - 40); d3.csv("data.csv", function(d) { d.population = +d.population; return d; }, function(error, data) { if (error) throw error; var arc = g.selectall(".arc").data(pie(data)).enter().append("g").attr("class", "arc"); arc.append("path").attr("d", path).attr("fill", function(d) { return color(d.data.age); });
; // \"M0,-100A100,100,0,0,1,100,0L0,0Z\" var arc = d3.arc().innerradius(0).outerradius(100).startangle(0).endangle(math.")
30 Pie Chart var arc = d3.arc(); arc({ innerradius: 0, outerradius: 100, startangle: 0, endangle: Math.PI / 2 }); // "M0,-100A100,100,0,0,1,100,0L0,0Z" var arc = d3.arc().innerradius(0).outerradius(100).startangle(0).endangle(math.pi / 2);
31 Treemap var treemap = d3.treemap().tile(d3.treemapresquarify).size([width, height]).round(true).paddinginner(1); var root = d3.hierarchy(data).eachbefore(function(d) { d.data.id = (d.parent? d.parent.data.id + "." : "") + d.data.name; }).sum(sumbysize).sort(function(a, b) { return b.height - a.height b.value - a.value; }); treemap(root); var cell = svg.selectall("g").data(root.leaves()).enter().append("g").attr("transform", function(d) { return "translate(" + d.x0 + "," + d.y0 + ")"; }); cell.append("rect").attr("id", function(d) { return d.data.id; }).attr("width", function(d) { return d.x1 - d.x0; }).attr("height", function(d) { return d.y1 - d.y0; }).attr("fill", function(d) { return color(d.parent.data.id); });
32 Treemap var d3hierarchy = require("d3-hierarchy") var treemap = d3hierarchy.treemap().size([10, 10]).padding(10); var stratify = d3hierarchy.stratify().id(function(d) { return d.id; }).parentid(function(d) { return d.parent_id; }); var root = stratify([{"id": "root", "parent_id": ""}, {"id": "child", "parent_id": "root"}]); var tree = treemap(root); tree.leaves() Array (1 item) 0: Node data: Object {id: "child", parent_id:"root"} depth: 1 height: 0 id: "child" parent: Node {children:, data:, depth:0, height: 1, id: "root", } x0: 5 x1: 5 y0: 10 y1: NaN
33 Stacked bar chart var keys = data.columns.slice(1); g.append("g").selectall("g").data(d3.stack().keys(keys)(data)).enter().append("g").attr("fill", function(d) { return z(d.key); }).selectall("rect").data(function(d) { return d; }).enter().append("rect").attr("x", function(d) { return x(d.data.state); }).attr("y", function(d) { return y(d[1]); }).attr("height", function(d) { return y(d[0]) - y(d[1]); }).attr("width", x.bandwidth()); State,Under 5 Years,5 to 13 Years,14 to 17 Years,18 to 24 Years,25 to 44 Years,45 to 64 Years,65 Years and Over AL,310504,552339,259034,450818, , , AK,52083,85640,42153,74257,198724,183159,50277 AZ,515910,828669,362642,601943, , , AR,202070,343207,157204,264160,754420,727124, CA, , , , , , , CO,358280,587154,261701,466194, , , CT,211637,403658,196918,325110,916955,968967,
, layers0 = stack(d3.transpose(d3.range(n).map(function() { return bumps(m, k); }))), layers1 = stack(d3.transpose(d3.range(n).map(function() { return bumps(m, k); }))), layers = layers0.")
34 Streamgraph var n = 20, // number of layers m = 200, // number of samples per layer k = 10; // number of bumps per layer var stack = d3.stack().keys(d3.range(n)).offset(d3.stackoffsetwiggle), layers0 = stack(d3.transpose(d3.range(n).map(function() { return bumps(m, k); }))), layers1 = stack(d3.transpose(d3.range(n).map(function() { return bumps(m, k); }))), layers = layers0.concat(layers1); var area = d3.area().x(function(d, i) { return x(i); }).y0(function(d) { return y(d[0]); }).y1(function(d) { return y(d[1]); }); svg.selectall("path").data(layers0).enter().append("path").attr("d", area).attr("fill", function() { return z(math.random()); });
.size([360, innerradius]); var line = d3.radialline().curve(d3.curvebundle.beta(0.85)).radius(function(d) { return d.y; }).angle(function(d) { return d.x / 180 * Math.PI; }); var svg = d3.")
35 Hierarchical Edge Bundling var link = svg.append("g").selectall(".link"), node = svg.append("g").selectall(".node"); var diameter = 960, radius = diameter / 2, innerradius = radius - 120; var cluster = d3.cluster().size([360, innerradius]); var line = d3.radialline().curve(d3.curvebundle.beta(0.85)).radius(function(d) { return d.y; }).angle(function(d) { return d.x / 180 * Math.PI; }); var svg = d3.select("body").append("svg").attr("width", diameter).attr("height", diameter).append("g").attr("transform", "translate(" + radius + "," + radius + ")"); var root = packagehierarchy(classes).sum(function(d) { return d.size; }); cluster(root); link = link.data(packageimports(root.leaves())).enter().append("path").each(function(d) { d.source = d[0], d.target = d[d.length - 1]; }).attr("class", "link").attr("d", line); node = node.data(root.leaves()).enter().append("text").attr("class", "node").attr("dy", "0.31em").attr("transform", function(d) { return "rotate(" + (d.x - 90) + ")translate(" + (d.y + 8) + ",0)" + (d.x < 180? "" : "rotate(180)"); }).attr("text-anchor", function(d) { return d.x < 180? "start" : "end"; }).text(function(d) { return d.data.key; })
36 Geomap & Shape files var projection = d3.geo.mercator().translate([width / 2, height / 2]).scale((width - 1) / 2 / Math.PI); var path = d3.geo.path().projection(projection); d3.json("/mbostock/raw/ /world-50m.json", function(error, world) { g.append("path").datum({type: "Sphere"}).attr("class", "sphere").attr("d", path); g.append("path").datum(topojson.merge(world, world.objects.countries.geometries)).attr("class", "land").attr("d", path); g.append("path").datum(topojson.mesh(world, world.objects.countries, function(a, b) { return a!== b; })).attr("class", "boundary").attr("d", path); });
37 Geomap & Shape files {"type":"topology","objects":{"countries": {"type":"geometrycollection", "Bbox":[-180, , , ], "geometries":[{"type":"polygon","id":533,"arcs":[[0]]},{"typ e":"polygon","id":4,"arcs":[[1,2,3,4,5,6,7]]},{"type":"multi Polygon","id":24,"arcs":[[[8,9,10,11]],[[12,13,14]]]},{"type ":"Polygon","id":660,"arcs":[[15]]},{"type":"Polygon","id":8,"arcs":[[16,17,18,19,20]]},{"type":"MultiPolygon","id":248, "arcs":[[[21]],[[22]],[[23]]]},{"type":"polygon","id":20,"ar cs":[[24,25]]},{"type":"multipolygon","id":784,"arcs":[[[26] ],[[27]],[[28]],[[29]],[[30,31,32,33,34],[35]]]},{"type":"Mu ltipolygon","id":32,"arcs":[[[36]],[[37,38]],[[39]],[[40,41, 42,43,44,45]]]},{"type":"MultiPolygon","id":51,"arcs":[[[46] ],[[47,48,49,50,51],[52]]]},{"type":"Polygon","id":16,"arcs" :[[53]]},{"type":"MultiPolygon","id":10,"arcs":[[[54]],[[55] ],[[56]],[[57]],[[58]],[[59]],[[60]],[[61]],[[62]],[[63]],[[ 64]],[[65]],[[66]],
38 D3.js how-to Hello World // 3 little circles Introduction à D3.js (Vadim Ogievetsky, co-créateur de D3.js) : Ressources en ligne par Lynn Cherny

")

39 D3.js principe de base (Advanced) Axes! (bar chart) Complex layouts Streamgraph Treemap Transitions (show reel) Geo maps Utilisation avec canvas (bar chart)
40 TP TIME SERIES
41 Stock market line chart d3.text - load text data d3.timeformat - parse dates d3.timescale - x-position encoding d3.scalelinear - y-position encoding d3.schemecategory10, d3.scaleordinal - color encoding d3.extent, d3.min and d3.max compute domains d3.keys - compute column names d3.axis - display axes d3.line - display line shape + legend!
42 Stock market data symbol,date,price MSFT,Jan 2000,39.81 MSFT,Feb 2000,36.35 MSFT,Mar 2000,43.22 MSFT,Apr 2000,28.37 IBM,Jan 2010, IBM,Feb 2010, IBM,Mar 2010, AAPL,Jan 2000,25.94 AAPL,Feb 2000,28.66 AAPL,Mar 2000,33.95
43
CIS 467/602-01: Data Visualization
 IS 467/602-01: Data Visualization etworks Dr. David Koop IS 467, Spring 2015 Assignment 2 http://www.cis.umassd.edu/ ~dkoop/cis467/assignment2.html Scaling width Text elements and selectall Any other questions?
Data Visualization (DSC 530/CIS )
") Data Visualization (DSC 530/CIS 602-01) Tables Dr. David Koop Visualization of Tables Items and attributes For now, attributes are not known to be positions Keys and values - key is an independent attribute
Data Visualization (DSC 530/CIS 602-01) Tables Dr. David Koop Visualization of Tables Items and attributes For now, attributes are not known to be positions Keys and values - key is an independent attribute
Data Visualization (CIS 468)
") Data Visualization (CIS 468) Tables & Maps Dr. David Koop Discriminability What is problematic here? File vtkdatasetreader PythonSource vtkimageclip vtkimagedatageometryfilter vtkimageresample vtkimagereslice
Data Visualization (CIS 468) Tables & Maps Dr. David Koop Discriminability What is problematic here? File vtkdatasetreader PythonSource vtkimageclip vtkimagedatageometryfilter vtkimageresample vtkimagereslice
Tabulation means putting data into tables. A table is a matrix of data in rows and columns, with the rows and the columns having titles.
 1 Tabulation means putting data into tables. A table is a matrix of data in rows and columns, with the rows and the columns having titles. 2 converting the set of numbers into the form of a grouped frequency
How to Make or Plot a Graph or Chart in Excel
 This is a complete video tutorial on How to Make or Plot a Graph or Chart in Excel. To make complex chart like Gantt Chart, you have know the basic principles of making a chart. Though I have used Excel
How many states. Record high temperature
 Record high temperature How many states Class Midpoint Label 94.5 99.5 94.5-99.5 0 97 99.5 104.5 99.5-104.5 2 102 102 104.5 109.5 104.5-109.5 8 107 107 109.5 114.5 109.5-114.5 18 112 112 114.5 119.5 114.5-119.5
An area chart emphasizes the trend of each value over time. An area chart also shows the relationship of parts to a whole.
 Excel 2003 Creating a Chart Introduction Page 1 By the end of this lesson, learners should be able to: Identify the parts of a chart Identify different types of charts Create an Embedded Chart Create a
Map image from the Atlas of Oregon (2nd. Ed.), Copyright 2001 University of Oregon Press
, Copyright 2001 University of Oregon Press") Map Layout and Cartographic Design with ArcGIS Desktop Matthew Baker ESRI Educational Services Redlands, CA Education UC 2008 1 Seminar overview General map design principles Working with map elements
Map Layout and Cartographic Design with ArcGIS Desktop Matthew Baker ESRI Educational Services Redlands, CA Education UC 2008 1 Seminar overview General map design principles Working with map elements
CS444/544: Midterm Review. Carlos Scheidegger
 CS444/544: Midterm Review Carlos Scheidegger D3: DATA-DRIVEN DOCUMENTS The essential idea D3 creates a two-way association between elements of your dataset and entries in the DOM D3 operates on selections
CS 361: Probability & Statistics
 January 24, 2018 CS 361: Probability & Statistics Relationships in data Standard coordinates If we have two quantities of interest in a dataset, we might like to plot their histograms and compare the two
 The Algorithm (DSC): Mark all nodes as unscheduled WHILE there are unscheduled nodes DO In descending order of priority, sort list of free nodes In descending order of priority, sort list of partial free
Lars Schmidt-Thieme, Information Systems and Machine Learning Lab (ISMLL), University of Hildesheim, Germany
, University of Hildesheim, Germany") Syllabus Fri. 21.10. (1) 0. Introduction A. Supervised Learning: Linear Models & Fundamentals Fri. 27.10. (2) A.1 Linear Regression Fri. 3.11. (3) A.2 Linear Classification Fri. 10.11. (4) A.3 Regularization
Syllabus Fri. 21.10. (1) 0. Introduction A. Supervised Learning: Linear Models & Fundamentals Fri. 27.10. (2) A.1 Linear Regression Fri. 3.11. (3) A.2 Linear Classification Fri. 10.11. (4) A.3 Regularization
Graphing Data. Example:
 Graphing Data Bar graphs and line graphs are great for looking at data over time intervals, or showing the rise and fall of a quantity over the passage of time. Example: Auto Sales by Year Year Number
Companion. Jeffrey E. Jones
 MATLAB7 Companion 1O11OO1O1O1OOOO1O1OO1111O1O1OO 1O1O1OO1OO1O11OOO1O111O1O1O1O1 O11O1O1O11O1O1O1O1OO1O11O1O1O1 O1O1O1111O11O1O1OO1O1O1O1OOOOO O1111O1O1O1O1O1O1OO1OO1OO1OOO1 O1O11111O1O1O1O1O Jeffrey E.
Objectives. Assessment. Assessment 5/14/14. Convert quantities from one unit to another using appropriate conversion factors.
 Objectives Convert quantities from one unit to another using appropriate conversion factors. Identify the independent and dependent variables in an experiment. Evaluate and make inferences from data represented
( ) 2 ( kg) ( 9.80 m/s 2
 2 ( kg) ( 9.80 m/s 2") Chapitre 1 Charges et champs électriques [9 au 1 mai] DEVOIR : 1.78, 1.84, 1.56, 1.90, 1.71 1.1. Charge électrique et structure de la matière À lire rapidement. Concepts déjà familiers. 1.. Conducteurs,
Chapitre 1 Charges et champs électriques [9 au 1 mai] DEVOIR : 1.78, 1.84, 1.56, 1.90, 1.71 1.1. Charge électrique et structure de la matière À lire rapidement. Concepts déjà familiers. 1.. Conducteurs,
Descriptive Statistics Methods of organizing and summarizing any data/information.
 Introductory Statistics, 10 th ed. by Neil A. Weiss Chapter 1 The Nature of Statistics 1.1 Statistics Basics There are lies, damn lies, and statistics - Mark Twain Descriptive Statistics Methods of organizing
f(x)= 2x 2 +x f(x)= x 3 f(x)= x 3 +2
= 2x 2 +x f(x)= x 3 f(x)= x 3 +2") Show that the following functions 1. Warm up Functions even and odd 2. Review Problems From Friday 3. Inverse Functions are even, odd or neither using function notation. f(x)= 2x 2 f(x)= 2x 2 +x f(x)=
Show that the following functions 1. Warm up Functions even and odd 2. Review Problems From Friday 3. Inverse Functions are even, odd or neither using function notation. f(x)= 2x 2 f(x)= 2x 2 +x f(x)=
CS 5630/6630 Scientific Visualization. Elementary Plotting Techniques II
 CS 5630/6630 Scientific Visualization Elementary Plotting Techniques II Motivation Given a certain type of data, what plotting technique should I use? What plotting techniques should be avoided? How do
Boyle s Law: A Multivariable Model and Interactive Animated Simulation
 Boyle s Law: A Multivariable Model and Interactive Animated Simulation Using tools available in Excel, we will turn a multivariable model into an interactive animated simulation. Projectile motion, Boyle's
I [Xi t] n ˆFn (t) Binom(n, F (t))
![I [Xi t] n ˆFn (t) Binom(n, F (t))](/thumbs/83/88931328.jpg "I [Xi t] n ˆFn (t) Binom(n, F (t))") Histograms & Densities We have seen in class various pictures of theoretical distribution functions and also some pictures of empirical distribution functions based on data. The definition of this concept
Histograms & Densities We have seen in class various pictures of theoretical distribution functions and also some pictures of empirical distribution functions based on data. The definition of this concept
Visualization. Maneesh Agrawala and Michael Bernstein CS 247
 Visualization Maneesh Agrawala and Michael Bernstein CS 247 Topics Why do we create visualizations? Data and image Estimating magnitude Deconstructions What is Visualization? Definition [www.oed.com] 1.
Lab Activity: The Central Limit Theorem
 Lab Activity: The Central Limit Theorem In this lab activity, you will explore the properties of the Central Limit Theorem. Student Learning Outcomes By the end of this chapter, you should be able to do
Module 2A Turning Multivariable Models into Interactive Animated Simulations
 Module 2A Turning Multivariable Models into Interactive Animated Simulations Using tools available in Excel, we will turn a multivariable model into an interactive animated simulation. Projectile motion,
CMPSCI 105 Final Exam Spring 2016 Professor William T. Verts CMPSCI 105 Final Exam Spring 2016 May 5, 2016 Professor William T. Verts Solution Key
 CMPSCI 105 Final Exam Spring 2016 May 5, 2016 Professor William T. Verts Solution Key Page 1 of 6 GENERAL KNOWLEDGE, SPECIAL TOPICS, & REVIEW 10 Points One point each question. Answer any ten. Answer
Geometry EOC Item Specifications Florida Standards Assessments. Equation Editor. 15 P a g e M a r c h 2 4,
 Equation Editor 15 P a g e M a r c h 2 4, 2 0 1 5 Equation Editor 17 P a g e M a r c h 2 4, 2 0 1 5 GRID Hot Spot 19 P a g e M a r c h 2 4, 2 0 1 5 Equation Editor 21 P a g e M a r c h 2 4, 2 0 1 5 Open
Chapter 7: Statistics Describing Data. Chapter 7: Statistics Describing Data 1 / 27
 Chapter 7: Statistics Describing Data Chapter 7: Statistics Describing Data 1 / 27 Categorical Data Four ways to display categorical data: 1 Frequency and Relative Frequency Table 2 Bar graph (Pareto chart)
Long Term Topic Planner - Year Six Term One Were the Vikings Always Victorious and Vicious Knowledge, Skills and Understanding
 Long Term Topic Planner - Year Six Topic Name Term One Were the Vikings Always Victorious and Vicious History Art I can say where a period of history fits on a timeline? I can place a specific event on
Lecture 8: PGM Inference
 15 September 2014 Intro. to Stats. Machine Learning COMP SCI 4401/7401 Table of Contents I 1 Variable elimination Max-product Sum-product 2 LP Relaxations QP Relaxations 3 Marginal and MAP X1 X2 X3 X4
Geometric Algorithms in GIS
 Geometric Algorithms in GIS GIS Software Dr. M. Gavrilova GIS System What is a GIS system? A system containing spatially referenced data that can be analyzed and converted to new information for a specific
Lesson 9. Exit Ticket Sample Solutions ( )= ( ) The arc length of is (. ) or.. Homework Problem Set Sample Solutions S.79
= ( ) The arc length of is (. ) or.. Homework Problem Set Sample Solutions S.79") Exit Ticket Sample Solutions 1. Find the arc length of. ( )= ()() ( )=. ( ) = The arc length of is (. ) or.. Homework Problem Set Sample Solutions S.79 1. and are points on the circle of radius, and the
Exit Ticket Sample Solutions 1. Find the arc length of. ( )= ()() ( )=. ( ) = The arc length of is (. ) or.. Homework Problem Set Sample Solutions S.79 1. and are points on the circle of radius, and the
2. Graphing Practice. Warm Up
 2. Graphing Practice In this worksheet you will practice graphing and use your graphs to interpret and analyze data. The first three questions are warm-up questions; complete this section before moving
Introduction to ArcMap
 Introduction to ArcMap ArcMap ArcMap is a Map-centric GUI tool used to perform map-based tasks Mapping Create maps by working geographically and interactively Display and present Export or print Publish
Social Studies 201 September 22, 2003 Histograms and Density
 1 Social Studies 201 September 22, 2003 Histograms and Density 1. Introduction From a frequency or percentage distribution table, a statistical analyst can develop a graphical presentation of the distribution.
Treemaps and Choropleth Maps Applied to Regional Hierarchical Statistical Data
 Treemaps and Choropleth Maps Applied to Regional Hierarchical Statistical Data Mikael Jern, Jakob Rogstadius, Tobias Åström NCVA National Center for Visual Analytics, Linkoping University, Sweden mikael.jern@itn.liu.se,
New Elementary Mathematics 2 This test covers material taught in New Elementary Mathematics 2 (http://www.singaporemath.com/)
") New Elementary Mathematics 2 This test covers material taught in New Elementary Mathematics 2 (http://www.singaporemath.com/) Calculators should not be used unless indicated by a C in front of the problem.
New Elementary Mathematics 2 This test covers material taught in New Elementary Mathematics 2 (http://www.singaporemath.com/) Calculators should not be used unless indicated by a C in front of the problem.
n Boolean variables: x 1, x 2,...,x n 2 {true,false} conjunctive normal form:
 Advanced Algorithms k-sat n Boolean variables: x 1, x 2,...,x n 2 {true,false} conjunctive normal form: k-cnf = C 1 ^C 2 ^ ^C m Is φ satisfiable? m clauses: C 1,C 2,...,C m each clause C i = `i1 _ `i2
Lecture 2: The Fast Multipole Method
 CBMS Conference on Fast Direct Solvers Dartmouth College June 23 June 27, 2014 Lecture 2: The Fast Multipole Method Gunnar Martinsson The University of Colorado at Boulder Research support by: Recall:
Some hints for the Radioactive Decay lab
 Some hints for the Radioactive Decay lab Edward Stokan, March 7, 2011 Plotting a histogram using Microsoft Excel The way I make histograms in Excel is to put the bounds of the bin on the top row beside
Geometry in the Complex Plane
 Geometry in the Complex Plane Hongyi Chen UNC Awards Banquet 016 All Geometry is Algebra Many geometry problems can be solved using a purely algebraic approach - by placing the geometric diagram on a coordinate
Intensity Analysis of Spatial Point Patterns Geog 210C Introduction to Spatial Data Analysis
 Intensity Analysis of Spatial Point Patterns Geog 210C Introduction to Spatial Data Analysis Chris Funk Lecture 4 Spatial Point Patterns Definition Set of point locations with recorded events" within study
BIA FRENCH IMMERSION----FIRST GRADE HOMEWORK CALENDAR. WEEK OF March 21 March 25, 2016
 NOM:_ I FRENCH IMMERSION----FIRST GRDE HOMEWORK CLENDR WEEK OF March 21 March 25, 2016 Please sign next to the date to indicate that you have reviewed your child s homework each night. Keep this sheet
Organization of 2D Space
 Organization of 2D Space Linear Frequency is Mapped in 2D Space Linear frequency time series, bar charts, histograms, etc. feature 2possible more sets of information Most data have multi-dimensional and
Minnesota Comprehensive Assessments-Series III
 Name Minnesota Comprehensive Assessments-Series III Mathematics Item Sampler Grade 7 ITEM SAMPLERS ARE NOT SECURE TEST MATERIALS. THIS ITEM SAMPLER TEST BOOK MAY BE COPIED OR DUPLICATED. State of Minnesota
Template-Based Representations. Sargur Srihari
 Template-Based Representations Sargur srihari@cedar.buffalo.edu 1 Topics Variable-based vs Template-based Temporal Models Basic Assumptions Dynamic Bayesian Networks Hidden Markov Models Linear Dynamical
Agenda. Introduction Exercise 1 Map Types. Part 1 ArcGIS Information and Organization Part 2 Purpose, Audience & Constraints.
 Agenda Introduction Exercise 1 Map Types Part 1 ArcGIS Information and Organization Part 2 Purpose, Audience & Constraints Exercise 2 Map Critique Break Part 3 Basic Cartographic Design Principles Part
Advanced Implementations of Tables: Balanced Search Trees and Hashing
 Advanced Implementations of Tables: Balanced Search Trees and Hashing Balanced Search Trees Binary search tree operations such as insert, delete, retrieve, etc. depend on the length of the path to the
A2 HW Imaginary Numbers
 Name: A2 HW Imaginary Numbers Rewrite the following in terms of i and in simplest form: 1) 100 2) 289 3) 15 4) 4 81 5) 5 12 6) -8 72 Rewrite the following as a radical: 7) 12i 8) 20i Solve for x in simplest
Bayesian Networks. instructor: Matteo Pozzi. x 1. x 2. x 3 x 4. x 5. x 6. x 7. x 8. x 9. Lec : Urban Systems Modeling
 12735: Urban Systems Modeling Lec. 09 Bayesian Networks instructor: Matteo Pozzi x 1 x 2 x 3 x 4 x 5 x 6 x 7 x 8 x 9 1 outline example of applications how to shape a problem as a BN complexity of the inference
Analysis and visualization of protein-protein interactions. Olga Vitek Assistant Professor Statistics and Computer Science
 1 Analysis and visualization of protein-protein interactions Olga Vitek Assistant Professor Statistics and Computer Science 2 Outline 1. Protein-protein interactions 2. Using graph structures to study
Physics I Exam 1 Fall 2015 (version A)
") 95.141 Physics I Exam 1 Fall 2015 (version A) Recitation Section Number Last/First Name (PRINT) / Last 3 Digits of Student ID Number: Fill out the above section of this page and print your last name on
95.141 Physics I Exam 1 Fall 2015 (version A) Recitation Section Number Last/First Name (PRINT) / Last 3 Digits of Student ID Number: Fill out the above section of this page and print your last name on
Graph Search Howie Choset
 Graph Search Howie Choset 16-11 Outline Overview of Search Techniques A* Search Graphs Collection of Edges and Nodes (Vertices) A tree Grids Stacks and Queues Stack: First in, Last out (FILO) Queue: First
Uta Bilow, Carsten Bittrich, Constanze Hasterok, Konrad Jende, Michael Kobel, Christian Rudolph, Felix Socher, Julia Woithe
 ATLAS W path Instructions for tutors Version from 2 February 2018 Uta Bilow, Carsten Bittrich, Constanze Hasterok, Konrad Jende, Michael Kobel, Christian Rudolph, Felix Socher, Julia Woithe Technische
Prelab: Complete the prelab section BEFORE class Purpose:
 Lab: Projectile Motion Prelab: Complete the prelab section BEFORE class Purpose: What is the Relationship between and for the situation of a cannon ball shot off a with an angle of from the horizontal.
Discriminative Direction for Kernel Classifiers
 Discriminative Direction for Kernel Classifiers Polina Golland Artificial Intelligence Lab Massachusetts Institute of Technology Cambridge, MA 02139 polina@ai.mit.edu Abstract In many scientific and engineering
MATHEMATICS. 24 July Section 1 10 marks (pages 3-7) Attempt Questions 1 10 Allow about 15 minutes for this section
 Attempt Questions 1 10 Allow about 15 minutes for this section") MATHEMATICS 24 July 2017 General Instructions Reading time 5 minutes Working time 3 hours Write using black pen. NESA approved calculators may be used. Commence each new question in a new booklet. Write
MATHEMATICS 24 July 2017 General Instructions Reading time 5 minutes Working time 3 hours Write using black pen. NESA approved calculators may be used. Commence each new question in a new booklet. Write
Univariate Descriptive Statistics for One Sample
 Department of Psychology and Human Development Vanderbilt University 1 Introduction 2 3 4 5 6 7 8 Introduction Our first step in descriptive statistics is to characterize the data in a single group of
S8.A.2.2 SCIENTIFIC INSTRUMENTS AND MEASUREMENT
 S8.A.2.2 SCIENTIFIC INSTRUMENTS AND MEASUREMENT Getting the idea Scientific instruments allow scientists to make observations and measurements. They allow the scientists to carry out the experiment. They
Sociology 6Z03 Review I
 Sociology 6Z03 Review I John Fox McMaster University Fall 2016 John Fox (McMaster University) Sociology 6Z03 Review I Fall 2016 1 / 19 Outline: Review I Introduction Displaying Distributions Describing
through any three given points if and only if these points are not collinear.
 Discover Parabola Time required 45 minutes Teaching Goals: 1. Students verify that a unique parabola with the equation y = ax + bx+ c, a 0, exists through any three given points if and only if these points
Intensity Analysis of Spatial Point Patterns Geog 210C Introduction to Spatial Data Analysis
 Intensity Analysis of Spatial Point Patterns Geog 210C Introduction to Spatial Data Analysis Chris Funk Lecture 5 Topic Overview 1) Introduction/Unvariate Statistics 2) Bootstrapping/Monte Carlo Simulation/Kernel
WEATHER AND CLIMATE COMPLETING THE WEATHER OBSERVATION PROJECT CAMERON DOUGLAS CRAIG
 WEATHER AND CLIMATE COMPLETING THE WEATHER OBSERVATION PROJECT CAMERON DOUGLAS CRAIG Introduction The Weather Observation Project is an important component of this course that gets you to look at real
Polynomial Degree Leading Coefficient. Sign of Leading Coefficient
 Chapter 1 PRE-TEST REVIEW Polynomial Functions MHF4U Jensen Section 1: 1.1 Power Functions 1) State the degree and the leading coefficient of each polynomial Polynomial Degree Leading Coefficient y = 2x
Roger S. Bivand Edzer J. Pebesma Virgilio Gömez-Rubio. Applied Spatial Data Analysis with R. 4:1 Springer
 Roger S. Bivand Edzer J. Pebesma Virgilio Gömez-Rubio Applied Spatial Data Analysis with R 4:1 Springer Contents Preface VII 1 Hello World: Introducing Spatial Data 1 1.1 Applied Spatial Data Analysis
A Short Course in Basic Statistics
 A Short Course in Basic Statistics Ian Schindler November 5, 2017 Creative commons license share and share alike BY: C 1 Descriptive Statistics 1.1 Presenting statistical data Definition 1 A statistical
Symbolic methods in TC: Decision Trees
 Symbolic methods in TC: Decision Trees ML for NLP Lecturer: Kevin Koidl Assist. Lecturer Alfredo Maldonado https://www.cs.tcd.ie/kevin.koidl/cs0/ kevin.koidl@scss.tcd.ie, maldonaa@tcd.ie 01-017 A symbolic
Principal component analysis (PCA) for clustering gene expression data
 for clustering gene expression data") Principal component analysis (PCA) for clustering gene expression data Ka Yee Yeung Walter L. Ruzzo Bioinformatics, v17 #9 (2001) pp 763-774 1 Outline of talk Background and motivation Design of our empirical
Principal component analysis (PCA) for clustering gene expression data Ka Yee Yeung Walter L. Ruzzo Bioinformatics, v17 #9 (2001) pp 763-774 1 Outline of talk Background and motivation Design of our empirical
Lecture 8: Column Generation
 Lecture 8: Column Generation (3 units) Outline Cutting stock problem Classical IP formulation Set covering formulation Column generation A dual perspective Vehicle routing problem 1 / 33 Cutting stock
Geographic Data Science - Lecture III
 Geographic Data Science - Lecture III (Geo-)Visualization Dani Arribas-Bel Today Visualization What and why History Examples Geovisualization What "A map for everyone" Dangers of geovisualization Visualization
Minnesota Comprehensive Assessments-Series III
 Name Minnesota Comprehensive Assessments-Series III Mathematics Item Sampler Grade 7 ITEM SAMPLERS ARE NOT SECURE TEST MATERIALS. THIS ITEM SAMPLER TEST BOOK MAY BE COPIED OR DUPLICATED. 24 18 Point State
Mathematics Extension 2
 Mathematics Extension 03 HSC ASSESSMENT TASK 3 (TRIAL HSC) General Instructions Reading time 5 minutes Working time 3 hours Write on one side of the paper (with lines) in the booklet provided Write using
Mathematics Grade 7 Transition Alignment Guide (TAG) Tool
 Tool") Transition Alignment Guide (TAG) Tool As districts build their mathematics curriculum for 2013-14, it is important to remember the implementation schedule for new mathematics TEKS. In 2012, the Teas State
Transition Alignment Guide (TAG) Tool As districts build their mathematics curriculum for 2013-14, it is important to remember the implementation schedule for new mathematics TEKS. In 2012, the Teas State
Minnesota Comprehensive Assessments-Series III
 Name Minnesota Comprehensive Assessments-Series III Mathematics Item Sampler Grade 7 ITEM SAMPLERS ARE NOT SECURE TEST MATERIALS. THIS ITEM SAMPLER TEST BOOK MAY BE COPIED OR DUPLICATED. 24 Point State
Sparse Principal Component Analysis via Alternating Maximization and Efficient Parallel Implementations
 Sparse Principal Component Analysis via Alternating Maximization and Efficient Parallel Implementations Martin Takáč The University of Edinburgh Joint work with Peter Richtárik (Edinburgh University) Selin
REVISED GCSE Scheme of Work Mathematics Higher Unit 4. For First Teaching September 2010 For First Examination Summer 2011
 REVISED GCSE Scheme of Work Mathematics Higher Unit 4 For First Teaching September 2010 For First Examination Summer 2011 Version 1: 28 April 10 Version 1: 28 April 10 Unit T4 Version 1: 28 April 10 Unit
6.N.3 Understand the relationship between integers, nonnegative decimals, fractions and percents.
 Crosswalk from 2003 to 2009 Standards - Grade 6 Bolded items are new to the grade level. 2003 Standards 2009 Standards Notes Number and Operation 1.01 Develop number sense for negative 6.N.3 Understand
NAME: DATE: MATHS: Statistics. Maths Statistics
 Maths Statistics It is not necessary to carry out all the activities contained in this unit. Please see Teachers Notes for explanations, additional activities, and tips and suggestions. Theme Statistics
Hideyuki Usui 1,3, M. Nunami 2,3, Y. Yagi 1,3, T. Moritaka 1,3, and JST/CREST multi-scale PIC simulation team
 Hideyuki Usui 1,3, M. Nunami 2,3, Y. Yagi 1,3, T. Moritaka 1,3, and JST/CREST multi-scale PIC simulation team 1 Kobe Univ., Japan, 2 NIFS,Japan, 3 JST/CREST, Outline Multi-scale interaction between weak
Week 8 Cookbook: Review and Reflection
 : Review and Reflection Week 8 Overview 8.1) Review and Reflection 8.2) Making Intelligent Maps: The map sheet as a blank canvas 8.3) Making Intelligent Maps: Base layers and analysis layers 8.4) ArcGIS
TEST 150 points
 Math 130 Spring 008 Name: TEST #1 @ 150 points Write neatly. Show all work. Write all responses on separate paper. Clearly label the exercises. 1. A piecewise-defined function is given. 1- x if x< f (
MTH301 Calculus II Glossary For Final Term Exam Preparation
 MTH301 Calculus II Glossary For Final Term Exam Preparation Glossary Absolute maximum : The output value of the highest point on a graph over a given input interval or over all possible input values. An
Cognitive Systems 300: Probability and Causality (cont.)
") Cognitive Systems 300: Probability and Causality (cont.) David Poole and Peter Danielson University of British Columbia Fall 2013 1 David Poole and Peter Danielson Cognitive Systems 300: Probability and
Cognitive Systems 300: Probability and Causality (cont.) David Poole and Peter Danielson University of British Columbia Fall 2013 1 David Poole and Peter Danielson Cognitive Systems 300: Probability and
Visitor Flows Model for Queensland a new approach
 Visitor Flows Model for Queensland a new approach Jason. van Paassen 1, Mark. Olsen 2 1 Parsons Brinckerhoff Australia Pty Ltd, Brisbane, QLD, Australia 2 Tourism Queensland, Brisbane, QLD, Australia 1
Descriptive Statistics
 Descriptive Statistics CHAPTER OUTLINE 6-1 Numerical Summaries of Data 6- Stem-and-Leaf Diagrams 6-3 Frequency Distributions and Histograms 6-4 Box Plots 6-5 Time Sequence Plots 6-6 Probability Plots Chapter
Semester Final Exam Review
 Semester Final Exam Review Multiple Choice Identify the choice that best completes the statement or answers the question. 1. What is the volume of the right triangular prism shown? 9 yd 21 yd a. b. c.
Mathematics 4306/2H (Specification A)
") Centre Number Surname Candidate Number For Examiner s Use Other Names Candidate Signature Examiner s Initials Time allowed 2 hours General Certificate of Secondary Education Higher Tier June 2010 Mathematics
Centre Number Surname Candidate Number For Examiner s Use Other Names Candidate Signature Examiner s Initials Time allowed 2 hours General Certificate of Secondary Education Higher Tier June 2010 Mathematics
Statistics, continued
 Statistics, continued Visual Displays of Data Since numbers often do not resonate with people, giving visual representations of data is often uses to make the data more meaningful. We will talk about a
Kinematics (2) - Motion in Three Dimensions
 - Motion in Three Dimensions") Kinematics (2) - Motion in Three Dimensions 1. Introduction Kinematics is a branch of mechanics which describes the motion of objects without consideration of the circumstances leading to the motion. 2.
Kinematics (2) - Motion in Three Dimensions 1. Introduction Kinematics is a branch of mechanics which describes the motion of objects without consideration of the circumstances leading to the motion. 2.
Physics 241 Class #10 Outline (9/25/2013) Plotting Handle graphics Numerical derivatives and functions Next time numerical integrals
 Plotting Handle graphics Numerical derivatives and functions Next time numerical integrals") Physics 241 Class #10 Outline (9/25/2013) Plotting Handle graphics Numerical derivatives and functions Next time numerical integrals Announcements HW4 grades are up. HW5a HW5 revised Same problems, now
Physics 241 Class #10 Outline (9/25/2013) Plotting Handle graphics Numerical derivatives and functions Next time numerical integrals Announcements HW4 grades are up. HW5a HW5 revised Same problems, now
Interaction Analysis of Spatial Point Patterns
 Interaction Analysis of Spatial Point Patterns Geog 2C Introduction to Spatial Data Analysis Phaedon C Kyriakidis wwwgeogucsbedu/ phaedon Department of Geography University of California Santa Barbara
Multiple Choice. Chapter 2 Test Bank
 Straightforward Statistics 1st Edition Bowen Test Bank Full Download: https://testbanklive.com/download/straightforward-statistics-1st-edition-bowen-test-bank/ Chapter 2 Test Bank Multiple Choice 1. Data
Creating a Travel Brochure
 DISCOVERING THE WORLD! Creating a Travel Brochure Objective: Create a travel brochure to a well-known city including weather data and places to visit! Resources provided: www.weather.com, internet Your
Figure 1: Conventional labelling of axes for diagram of frequency distribution. Frequency of occurrence. Values of the variable
 1 Social Studies 201 September 20-22, 2004 Histograms See text, section 4.8, pp. 145-159. Introduction From a frequency or percentage distribution table, a statistical analyst can develop a graphical presentation
FOUNDATION MATHS REVISION CHECKLIST (Grades 5 1)
") FOUNDATION MATHS REVISION CHECKLIST 2017+ (s 5 1) Geometry and Measures Arc lengths and sectors 5 Derive triangle results 5 Enlargements and negative SF 5 Loci 5 Pythagoras 5 Similarity and Congruence
FOUNDATION MATHS REVISION CHECKLIST 2017+ (s 5 1) Geometry and Measures Arc lengths and sectors 5 Derive triangle results 5 Enlargements and negative SF 5 Loci 5 Pythagoras 5 Similarity and Congruence
Activities, Fragments and Intents
 Mobile App Development 1 2 Design Principles 3 1 2 Design Principles 3 Manifest file Outline AndroidManifest.xml XML file Contains name of the application and a default package, Sets up the various permissions
E-book Code: REAU0029. For students at risk working at Upper Primary levels. rescue maths. Book 2 Measurement, Chance and data.
 E-book Code: REAU0029 For students at risk working at Upper Primary levels rescue maths Book 2 Measurement, Chance and data By Sandy Tasker Ready-Ed Publications - 2003. Published by Ready-Ed Publications
ECE533 Digital Image Processing. Embedded Zerotree Wavelet Image Codec
 University of Wisconsin Madison Electrical Computer Engineering ECE533 Digital Image Processing Embedded Zerotree Wavelet Image Codec Team members Hongyu Sun Yi Zhang December 12, 2003 Table of Contents
(f ) From the graph, obtain the height of the tube given the mass of the dart is 20 grams and the constant force applied in the tube is 2 newtons.
 From the graph, obtain the height of the tube given the mass of the dart is 20 grams and the constant force applied in the tube is 2 newtons.") 1. Bowling Ball A is dropped from a point halfway up a cliff. A second identical bowling ball, B, is dropped simultaneously from the top of the cliff. Comparing the bowling balls at the instant they reach
1. Bowling Ball A is dropped from a point halfway up a cliff. A second identical bowling ball, B, is dropped simultaneously from the top of the cliff. Comparing the bowling balls at the instant they reach
ICM-Chemist How-To Guide. Version 3.6-1g Last Updated 12/01/2009
 ICM-Chemist How-To Guide Version 3.6-1g Last Updated 12/01/2009 ICM-Chemist HOW TO IMPORT, SKETCH AND EDIT CHEMICALS How to access the ICM Molecular Editor. 1. Click here 2. Start sketching How to sketch
Advanced Algorithms 南京大学 尹一通
 Advanced Algorithms 南京大学 尹一通 Constraint Satisfaction Problem variables: (CSP) X = {x 1, x2,..., xn} each variable ranges over a finite domain Ω an assignment σ ΩX assigns each variable a value in Ω constraints: