Tabulation means putting data into tables. A table is a matrix of data in rows and columns, with the rows and the columns having titles.
|
|
|
- Hortense Byrd
- 5 years ago
- Views:
Transcription
1 1
2 Tabulation means putting data into tables. A table is a matrix of data in rows and columns, with the rows and the columns having titles. 2
3 converting the set of numbers into the form of a grouped frequency table. This involves dividing the range covered by the data into classes and counting the numbers of data values which fall into each class. These numbers are the class frequencies. 3
4 Lower limits? Upper limits? Class boundary? Class length / width? Class Frequency How many classes should be used but it is usual to arrange for at least 5 and not more than 15. If it can be conveniently arranged for all classes to have the same class width 4
5 Range Cummulative Frequency Less than Less than Less than Less than Less than Less than Less than Less than Less than Less than
6 Data in ordered array: 12, 13, 17, 21, 24, 24, 26, 27, 27, 30, 32, 35, 37, 38, 41, 43, 44, 46, 53, 58 Class Frequency Relative Frequency Percentage 10 but under but under but under but under but under Total

7 In country A there were 22,618,462 dwellings. Of these 9,875,380 were owner-occupied, 6,765,097 were council rentals, 3,476,907 were private rentals and the remainder were held under a variety of tenures. In country B there were 1,846,093 in total and the numbers in the above categories were 569,043, 903,528 and 278,901, respectively. Display this information in a table. 7
8 8
9 The table should be given a clear title All columns should be clearly labeled Where appropriate, there should be clear subtotals A total column may be presented; this would usually be the right-hand column A total figure is often advisable at the bottom of each column of figures Tables should not be packed with so much data that reading information is difficult Non-essential information should be eliminated 9

10 Charts often convey the meaning or significance of data more clearly than would a table. Bar charts Histograms Ogives Pie charts 10

11 A method of data presentation in which data are represented by bars of equal width, the height / length of the bar corresponding to the value of the data. Axes must be labeled and there must be a scale to indicate the magnitude of the data. 11

12 Simple Component Compound A chart consisting of one or more bars The actual magnitude of each item is shown The lengths of bars on the chart allow magnitudes to be compared A bar chart that gives a breakdown of each total into its components. A percentage component = does not show total magnitudes two or more separate bars are used to present sub-divisions of data. There is usually no space between the bars for data in the same category 12
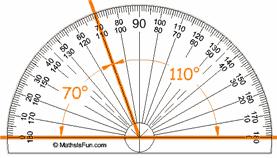
 A complete 'pie' = 360 = 100% 180 = 50% Shading and Colour => distinguishes the")
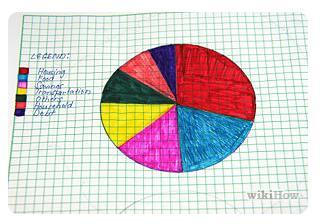
13 A chart which is used to show pictorially the relative size of component elements of a total. (always be based on percentage values) A complete 'pie' = 360 = 100% 180 = 50% Shading and Colour => distinguishes the segments from each other 13


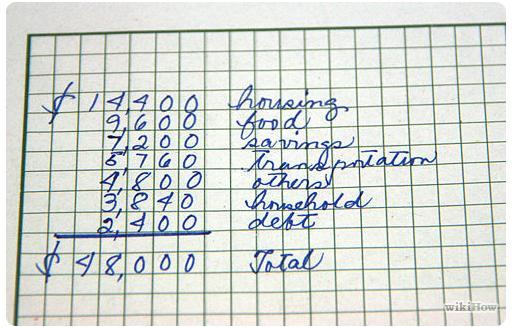
14 Given : Sales of furniture ( 000) Settees 34 Armchairs 27 Dining sets 38 Shelving 18 Others 12 Category Sales Angle, Settees Armchairs Dining sets Shelving Others Total

15 Advantages give a simple pictorial display of the relative sizes of elements of a total show clearly when one element is much bigger than others clearly show differences in the elements of two different totals Disadvantages only show the relative sizes of elements. involve calculating degrees of a circle and drawing sectors accurately can be time consuming unless computer software is used. It is often difficult to compare sector sizes easily. 15


16 16
17 17


18 The logic behind this is that there are 360 degrees total in a circle. If you know that 14,400 is 30 percent of the whole (or 0.30), then you're just trying to figure out what 30% of 360 is. Add up all the degrees you calculate from this step. They should equal 360. If they don't, you've missed something. 18
19 19
20 20
21 21
22 22


23 23
24 24
25 Remember that all good graphs have a title and labels. Add the name of the sections and the percent they represent to the chart. Color each section of the pie chart a different color/pattern to easily visualize the results. Make sure all angles are accurate. 25

26 The area of a bar above a class interval is proportional to the frequency in that class AREA not HEIGHT If there is non-equal size of class interval. Find the frequency density Height of block = class frequency class width 26
 5 10 6 11 15 15 16 17 4 Draw a histogram to represent the above data. 27")
27 The following table shows the ages of 25 children on a school bus: Age Frequency (No. of children) Draw a histogram to represent the above data. 27
28 Age Frequency Lower boundary Upper boundary Frequency density
 0 3 12 4 10 14 11 18 48 Find the class widths and frequency densities.")
29 The ages of children entering a theme park in a 1-hour period are recorded in the table: Age Frequency (No. of children) Find the class widths and frequency densities. Then draw a histogram to represent the data. 29

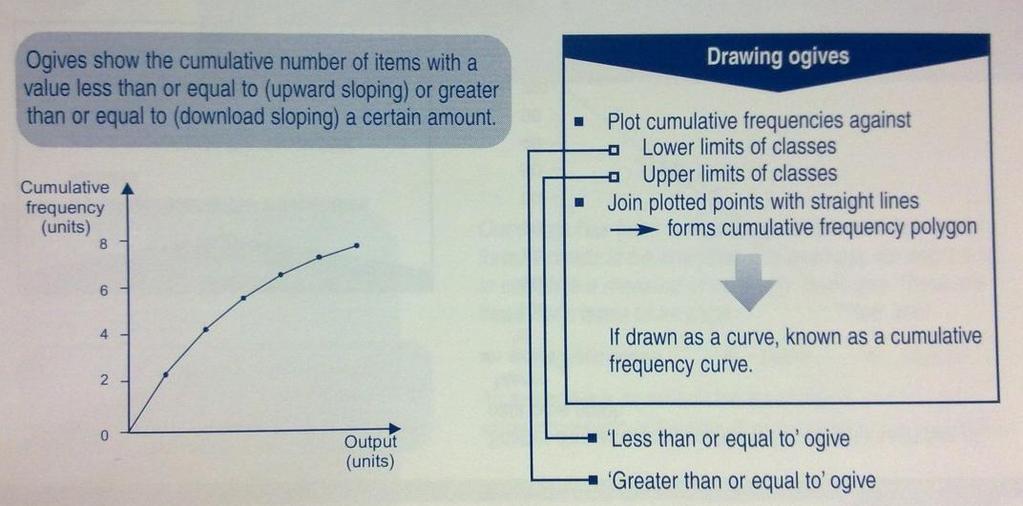
30 Constructed from a cumulative frequency table by plotting the cumulative frequencies against the corresponding class boundaries and joining the resulting points by straight lines. 30
31 31
32 Using the data given below, construct a 'more than' cumulative frequency table and draw the Ogive. 32
33 Marks Lower boundary Upper boundary Cumulative Frequency
34 Cumulative frequency 80 'More than' Ogive Marks 34
35 Q: Draw a 'less than' ogive curve for the following data: Hence, from the ogive, estimate the number of students who has less than 57 marks? 35

36 What is the lower boundary and upper boundary of the classes? Marks Lower boundary Upper boundary Cumulative Frequency
37 Cumulative frequency Marks 37

38 A pictogram is a form of graphical presentation where repetitions of a picture are used to represent frequencies or other values of a feature. 38
39 Type of employment Thousands employed Construction Housing Fire Service Health
Biostatistics Presentation of data DR. AMEER KADHIM HUSSEIN M.B.CH.B.FICMS (COM.)
") Biostatistics Presentation of data DR. AMEER KADHIM HUSSEIN M.B.CH.B.FICMS (COM.) PRESENTATION OF DATA 1. Mathematical presentation (measures of central tendency and measures of dispersion). 2. Tabular
Biostatistics Presentation of data DR. AMEER KADHIM HUSSEIN M.B.CH.B.FICMS (COM.) PRESENTATION OF DATA 1. Mathematical presentation (measures of central tendency and measures of dispersion). 2. Tabular
Graphing Data. Example:
 Graphing Data Bar graphs and line graphs are great for looking at data over time intervals, or showing the rise and fall of a quantity over the passage of time. Example: Auto Sales by Year Year Number
Chapter 7: Statistics Describing Data. Chapter 7: Statistics Describing Data 1 / 27
 Chapter 7: Statistics Describing Data Chapter 7: Statistics Describing Data 1 / 27 Categorical Data Four ways to display categorical data: 1 Frequency and Relative Frequency Table 2 Bar graph (Pareto chart)
Calculating methods. Addition. Multiplication. Th H T U Th H T U = Example
 1 Addition Calculating methods Example 534 + 2678 Place the digits in the correct place value columns with the numbers under each other. Th H T U Begin adding in the units column. 5 3 4 + 12 16 17 8 4+8
QUANTITATIVE DATA. UNIVARIATE DATA data for one variable
 QUANTITATIVE DATA Recall that quantitative (numeric) data values are numbers where data take numerical values for which it is sensible to find averages, such as height, hourly pay, and pulse rates. UNIVARIATE
Statistics 511 Additional Materials
 Graphical Summaries Consider the following data x: 78, 24, 57, 39, 28, 30, 29, 18, 102, 34, 52, 54, 57, 82, 90, 94, 38, 59, 27, 68, 61, 39, 81, 43, 90, 40, 39, 33, 42, 15, 88, 94, 50, 66, 75, 79, 83, 34,31,36,
Destination Math California Intervention
 Destination Math California Intervention correlated to the California Intervention 4 7 s McDougal Littell Riverdeep STANDARDS MAPS for a Mathematics Intervention Program (Grades 4-7) The standards maps
Statistics lecture 3. Bell-Shaped Curves and Other Shapes
 Statistics lecture 3 Bell-Shaped Curves and Other Shapes Goals for lecture 3 Realize many measurements in nature follow a bell-shaped ( normal ) curve Understand and learn to compute a standardized score
Standards of Learning Content Review Notes. Grade 7 Mathematics 3 rd Nine Weeks,
 Standards of Learning Content Review Notes Grade 7 Mathematics 3 rd Nine Weeks, 2016-2017 1 2 Content Review: Standards of Learning in Detail Grade 7 Mathematics: Third Nine Weeks 2016-2017 This resource
Example: What number is the arrow pointing to?
 Number Lines Investigation 1 Inv. 1 To draw a number line, begin by drawing a line. Next, put tick marks on the line, keeping an equal distance between the marks. Then label the tick marks with numbers.
CONTENTS Page Rounding 3 Addition 4 Subtraction 6 Multiplication 7 Division 10 Order of operations (BODMAS)
") CONTENTS Page Rounding 3 Addition 4 Subtraction 6 Multiplication 7 Division 10 Order of operations (BODMAS) 12 Formulae 13 Time 14 Fractions 17 Percentages 19 Ratio and Proportion 23 Information Handling
CONTENTS Page Rounding 3 Addition 4 Subtraction 6 Multiplication 7 Division 10 Order of operations (BODMAS) 12 Formulae 13 Time 14 Fractions 17 Percentages 19 Ratio and Proportion 23 Information Handling
Topic 3: Introduction to Statistics. Algebra 1. Collecting Data. Table of Contents. Categorical or Quantitative? What is the Study of Statistics?!
 Topic 3: Introduction to Statistics Collecting Data We collect data through observation, surveys and experiments. We can collect two different types of data: Categorical Quantitative Algebra 1 Table of
Physical Geography Lab Activity #15
 Physical Geography Lab Activity #15 Due date Name Choropleth Maps COR Objective 1 & 7, SLOs 1 & 3 15.1. Introduction Up until this point we have used maps to find locations on the Earth. While they are
California 5 th Grade Standards / Excel Math Correlation by Lesson Number
 (Activity) L1 L2 L3 Excel Math Objective Recognizing numbers less than a million given in words or place value; recognizing addition and subtraction fact families; subtracting 2 threedigit numbers with
STP 420 INTRODUCTION TO APPLIED STATISTICS NOTES
 INTRODUCTION TO APPLIED STATISTICS NOTES PART - DATA CHAPTER LOOKING AT DATA - DISTRIBUTIONS Individuals objects described by a set of data (people, animals, things) - all the data for one individual make
Give 4 advantages of using ICT in the collection of data. Give. Give 4 disadvantages in the use of ICT in the collection of data
 Give 4 advantages of using ICT in the collection of data can use a handheld GPS to get accurate location information which can be used to show data linked to specific locations within a GIS can collect
Foundations 5 Curriculum Guide
 1. Review: Natural Numbers...3 2. Reading and Writing Natural Numbers...6 3. Lines, Rays, and Line Segments...8 4. Comparing Natural Numbers... 12 5. Rounding Numbers... 15 6. Adding Natural Numbers...
3. Evaluate: (a) ( 8) 144 ( 9) [2] (b) {[(54 39) ( 5) + 7] ( 3) + ( 6)} ( 3 + 1) [2] (c) ( 2) ( 5) 2 ( 3) 3 [2]
![3. Evaluate: (a) ( 8) 144 ( 9) [2] (b) {[(54 39) ( 5) + 7] ( 3) + ( 6)} ( 3 + 1) [2] (c) ( 2) ( 5) 2 ( 3) 3 [2]](/thumbs/86/93197695.jpg "3. Evaluate: (a) ( 8) 144 ( 9) [2] (b) {[(54 39) ( 5) + 7] ( 3) + ( 6)} ( 3 + 1) [2] (c) ( 2) ( 5) 2 ( 3) 3 [2]") New Syllabus Mathematics 1 Discovering Mathematics 1 This test covers material taught in New Syllabus and Discovering Mathematics 1 Texts (http://www.singaporemath.com/) Calculators should not be used
New Syllabus Mathematics 1 Discovering Mathematics 1 This test covers material taught in New Syllabus and Discovering Mathematics 1 Texts (http://www.singaporemath.com/) Calculators should not be used
Some hints for the Radioactive Decay lab
 Some hints for the Radioactive Decay lab Edward Stokan, March 7, 2011 Plotting a histogram using Microsoft Excel The way I make histograms in Excel is to put the bounds of the bin on the top row beside
IDAHO EXTENDED CONTENT STANDARDS MATHEMATICS
 Standard 1: Number and Operation Goal 1.1: Understand and use numbers. K.M.1.1.1A 1.M.1.1.1A Recognize symbolic Indicate recognition of expressions as numbers various # s in environments K.M.1.1.2A Demonstrate
Multiple Choice. Chapter 2 Test Bank
 Straightforward Statistics 1st Edition Bowen Test Bank Full Download: https://testbanklive.com/download/straightforward-statistics-1st-edition-bowen-test-bank/ Chapter 2 Test Bank Multiple Choice 1. Data
ALGEBRAIC PRINCIPLES
 ALGEBRAIC PRINCIPLES Numbers and Operations Standard: 1 Understands and applies concepts of numbers and operations Power 1: Understands numbers, ways of representing numbers, relationships among numbers,
Paper 1 Foundation Revision List
 Paper 1 Foundation Revision List Converting units of length 692 Converting units of mass 695 Order of operations 24 Solving one step equations 178 Operations with negative numbers 39, 40 Term to term rules
Stat 101 Exam 1 Important Formulas and Concepts 1
 1 Chapter 1 1.1 Definitions Stat 101 Exam 1 Important Formulas and Concepts 1 1. Data Any collection of numbers, characters, images, or other items that provide information about something. 2. Categorical/Qualitative
Variables. Lecture 12 Sections Tue, Feb 3, Hampden-Sydney College. Displaying Distributions - Qualitative.
 Lecture 12 Sections 4.3.1-4.3.2 Hampden-Sydney College Tue, Feb 3, 2008 Outline 1 2 3 4 5 Exercise 4.2, p. 219 Determine whether the following variables are qualitative, quantitative discrete, or quantitative
Figure 1: Conventional labelling of axes for diagram of frequency distribution. Frequency of occurrence. Values of the variable
 1 Social Studies 201 September 20-22, 2004 Histograms See text, section 4.8, pp. 145-159. Introduction From a frequency or percentage distribution table, a statistical analyst can develop a graphical presentation
Introduction to Statistics
 Introduction to Statistics Data and Statistics Data consists of information coming from observations, counts, measurements, or responses. Statistics is the science of collecting, organizing, analyzing,
Math 2 Variable Manipulation Part 7 Absolute Value & Inequalities
 Math 2 Variable Manipulation Part 7 Absolute Value & Inequalities 1 MATH 1 REVIEW SOLVING AN ABSOLUTE VALUE EQUATION Absolute value is a measure of distance; how far a number is from zero. In practice,
4 th Grade Hinojosa Math Vocabulary Words
 Topic 1 Word Definition Picture Digit A symbol used to make numerals. These are the digits 0, 1, 2, 3, 4, 5, 6, 7, 8, 9. Place value The value of where the digit is in the number, such as units(ones),
Prep for the CSU ELM
 Prep for the CSU ELM This course covers the topics shown below. Students navigate learning paths based on their level of readiness. Institutional users may customize the scope and sequence to meet curricular
A SHORT INTRODUCTION TO PROBABILITY
 A Lecture for B.Sc. 2 nd Semester, Statistics (General) A SHORT INTRODUCTION TO PROBABILITY By Dr. Ajit Goswami Dept. of Statistics MDKG College, Dibrugarh 19-Apr-18 1 Terminology The possible outcomes
Chapter. Organizing and Summarizing Data. Copyright 2013, 2010 and 2007 Pearson Education, Inc.
 Chapter 2 Organizing and Summarizing Data Section 2.1 Organizing Qualitative Data Objectives 1. Organize Qualitative Data in Tables 2. Construct Bar Graphs 3. Construct Pie Charts When data is collected
Enrichment. Letter Frequency Letter Frequency Letter Frequency a j s b k t c l u d 11 m v e n 17 w f o x g p y h 9 q z i r 20
 2-1 Linguistic Statistics Linguistics is the study of human speech. The activity on this page shows the type of data collection and analysis that might be done by a linguist who is researching the structure
Student Activity: Finding Factors and Prime Factors
 When you have completed this activity, go to Status Check. Pre-Algebra A Unit 2 Student Activity: Finding Factors and Prime Factors Name Date Objective In this activity, you will find the factors and the
Mathematics Std IX and X
 5 Mathematics Std IX and X Introduction Mathematics is the language of all sciences. Mathematics as a subject at the secondary level has great importance in a progressive country like India as it develops
GRADE 6 Projections Masters
 TEKSING TOWARD STAAR MATHEMATICS GRADE 6 Projections Masters Six Weeks 1 Lesson 1 STAAR Category 1 Grade 6 Mathematics TEKS 6.2A/6.2B Understanding Rational Numbers A group of items or numbers is called
This packet is due the first day of school. It will count as a quiz grade.
 ALGEBRA SUMMER WORK Congratulations! You will be studying Algebra when you return to school in September. To make the most efficient use of our class time, you are expected to complete this assignment
Histograms allow a visual interpretation
 Chapter 4: Displaying and Summarizing i Quantitative Data s allow a visual interpretation of quantitative (numerical) data by indicating the number of data points that lie within a range of values, called
CHAPTER SEVEN THE GALLEY METHOD. Galley method 2. Exercises 8
 THE GALLEY METHOD Galley method Exercises 8 THE GALLEY METHOD Although the x dots-and-boxes model provides a conceptually easy framework for understanding the process of long division of polynimials, it
Statistical thinking will one day be as necessary for efficient citizenship as the ability to read and write. H.G. Wells
 Statistical thinking will one day be as necessary for efficient citizenship as the ability to read and write. H.G. Wells 1 Statistics is a science which deals with collection, tabulation, presentation,
The science of learning from data.
 STATISTICS (PART 1) The science of learning from data. Numerical facts Collection of methods for planning experiments, obtaining data and organizing, analyzing, interpreting and drawing the conclusions
GRE Quantitative Reasoning Practice Questions
 GRE Quantitative Reasoning Practice Questions y O x 7. The figure above shows the graph of the function f in the xy-plane. What is the value of f (f( ))? A B C 0 D E Explanation Note that to find f (f(
E9.2 Histograms, Bar Charts, Pictograms, Scatter Diagrams & Frequency Distributions
 E9.2 Histograms, Bar Charts, Pictograms, Scatter Diagrams & Frequency Distributions Question Paper Level IGCSE Subject Maths (0580) Exam Board Cambridge International Examinations (CIE) Level Core Topic
NUMERACY TOOLKIT TOOLKIT NUMERACY
 NUMERACY TOOLKIT TOOLKIT NUMERACY Addition Calculating methods Example 534 + 2678 Place the digits in the correct place value columns with the numbers under each other. Th H T U Begin adding in the units
Visual Displays of Information in Understanding Evolution by Natural Selection
 Name: Date: Visual Displays of Information in Understanding Evolution by Natural Selection The alpine skypilot is a purple perennial wildflower that is native to western North America. It grows in dry
St. Ann s Academy - Mathematics
 St. Ann s Academy - Mathematics Students at St. Ann s Academy will be able to reason abstractly and quantitatively. Students will define, explain, and understand different types of word problems (simple
Mathematics Second Practice Test 2 Level 5-7 Calculator allowed
 Mathematics Second Practice Test 2 Level 5-7 Calculator allowed Please read this page, but do not open your booklet until your teacher tells you to start. Write your name and the name of your school in
Algebra 1 Math Year at a Glance
 Real Operations Equations/Inequalities Relations/Graphing Systems Exponents/Polynomials Quadratics ISTEP+ Radicals Algebra 1 Math Year at a Glance KEY According to the Indiana Department of Education +
2. Graphing Practice. Warm Up
 2. Graphing Practice In this worksheet you will practice graphing and use your graphs to interpret and analyze data. The first three questions are warm-up questions; complete this section before moving
South Carolina Alternate Assessments Performance Level Descriptors. Mathematics. Revised: June 29, 2018
 South Carolina Alternate Assessments Performance Level Descriptors Mathematics Revised: June 29, 2018 Contents Standards Reference Number Abbreviations... 1 Grade 3... 2 Grade 4... 6 Grade 5... 9 Grade
Chapter 4 Statistics
 Chapter 4 Section 4.1The mean, mode, median and Range The idea of an average is extremely useful, because it enables you to compare one set of data with another set by comparing just two values their averages.
CONTENTS. Ladder Title
 MATHS NAME CLASS LEARNING LADDERS CONTENTS Ladder Title EYFS Maths Times Tables Addition Subtraction Multiplication Division Fractions Decimals Percentage and Ratio Problem Solving Properties of Number
6 th Grade Math STAAR Review Booklet
 6 th Grade Math STAAR Review Booklet Reporting Category 1 Numerical Representations and Relationships Student Name: Teacher Name: 1 2 Table of Contents Reporting Category 1 Classify Rational Numbers.4-5
Cell- Each box of information in a chart or table. A cell is named by its column and row
 Lesson 7 Cell- Each box of information in a chart or table. A cell is named by its column and row Steps to read a chart or table: Check the title to find out what type of information is being presented.
STANDARDS OF LEARNING CONTENT REVIEW NOTES. ALGEBRA I Part II 1 st Nine Weeks,
 STANDARDS OF LEARNING CONTENT REVIEW NOTES ALGEBRA I Part II 1 st Nine Weeks, 2016-2017 OVERVIEW Algebra I Content Review Notes are designed by the High School Mathematics Steering Committee as a resource
Granite School District Parent Guides Utah Core State Standards for Mathematics Grades K-6
 Granite School District Parent Guides Grades K-6 GSD Parents Guide for Kindergarten The addresses Standards for Mathematical Practice and Standards for Mathematical Content. The standards stress not only
Prentice Hall Mathematics Course Correlated to Kansas Mathematics Content Standards, Knowledge Base Indicators (Grade 7)
") Kansas Mathematics Content Standards, Knowledge Base Indicators (Grade 7) Standard 1: Number and Computation The student uses numerical and computational concepts and procedures in a variety of situations.
Kansas Mathematics Content Standards, Knowledge Base Indicators (Grade 7) Standard 1: Number and Computation The student uses numerical and computational concepts and procedures in a variety of situations.
Mathematics Kindergarten
 Kindergarten describe and sort and count measureable attributes identify and describe compose and model Shapes and space Representing quantity Whole numbers count sequence cardinality count instant recognition
MIDTERM EXAMINATION (Spring 2011) STA301- Statistics and Probability
 STA301- Statistics and Probability") STA301- Statistics and Probability Solved MCQS From Midterm Papers March 19,2012 MC100401285 Moaaz.pk@gmail.com Mc100401285@gmail.com PSMD01 MIDTERM EXAMINATION (Spring 2011) STA301- Statistics and Probability
STA301- Statistics and Probability Solved MCQS From Midterm Papers March 19,2012 MC100401285 Moaaz.pk@gmail.com Mc100401285@gmail.com PSMD01 MIDTERM EXAMINATION (Spring 2011) STA301- Statistics and Probability
Grade XI Mathematics
 Grade XI Mathematics Exam Preparation Booklet Chapter Wise - Important Questions and Solutions #GrowWithGreen Questions Sets Q1. For two disjoint sets A and B, if n [P ( A B )] = 32 and n [P ( A B )] =
Quantitative Methods Chapter 0: Review of Basic Concepts 0.1 Business Applications (II) 0.2 Business Applications (III)
 0.2 Business Applications (III)") Quantitative Methods Chapter 0: Review of Basic Concepts 0.1 Business Applications (II) 0.1.1 Simple Interest 0.2 Business Applications (III) 0.2.1 Expenses Involved in Buying a Car 0.2.2 Expenses Involved
Quantitative Methods Chapter 0: Review of Basic Concepts 0.1 Business Applications (II) 0.1.1 Simple Interest 0.2 Business Applications (III) 0.2.1 Expenses Involved in Buying a Car 0.2.2 Expenses Involved
8 LEVELS 5 7 PAPER. Paper 2. Year 8 mathematics test. Calculator allowed. First name. Last name. Class. Date YEAR
 Ma YEAR 8 LEVELS 5 7 PAPER 2 Year 8 mathematics test Paper 2 Calculator allowed Please read this page, but do not open your booklet until your teacher tells you to start. Write your details in the spaces
Introduction to Statistics
 Why Statistics? Introduction to Statistics To develop an appreciation for variability and how it effects products and processes. Study methods that can be used to help solve problems, build knowledge and
Integers, Fractions, Decimals and Percentages. Equations and Inequations
 Integers, Fractions, Decimals and Percentages Round a whole number to a specified number of significant figures Round a decimal number to a specified number of decimal places or significant figures Perform
Year 9 Mastery Statements for Assessment 1. Topic Mastery Statements - I can Essential Knowledge - I know
 Year 9 Mastery Statements for Assessment 1 Topic Mastery Statements - I can Essential Knowledge - I know Whole Numbers and Decimals Measures, perimeter area and volume Expressions and formulae Indices
1.1 Linear Equations and Inequalities
 1.1 Linear Equations and Inequalities Linear Equation in 1 Variable Any equation that can be written in the following form: ax + b = 0 a,b R, a 0 and x is a variable Any equation has a solution, sometimes
Chapter 1:Descriptive statistics
 Slide 1.1 Chapter 1:Descriptive statistics Descriptive statistics summarises a mass of information. We may use graphical and/or numerical methods Examples of the former are the bar chart and XY chart,
Errors and Uncertainties in Chemistry Internal Assessment
 Errors and Uncertainties in Chemistry Internal Assessment The treatment of errors and uncertainties is relevant in the internal assessment criteria of: data collection, aspect 1 (collecting and recording
Term Definition Example. 3-D shapes or (3 dimensional) acute angle. addend. algorithm. area of a rectangle. array
 acute angle. addend. algorithm. area of a rectangle. array") Term Definition Example 3-D shapes or (3 dimensional) an object that has height, width, and depth, like any object in the real world. acute angle an angle that is less than 90 addend a number that is added
Term Definition Example 3-D shapes or (3 dimensional) an object that has height, width, and depth, like any object in the real world. acute angle an angle that is less than 90 addend a number that is added
PLC Papers Created For:
 PLC Papers Created For: Daniel Inequalities Inequalities on number lines 1 Grade 4 Objective: Represent the solution of a linear inequality on a number line. Question 1 Draw diagrams to represent these
Chapter 2: Tools for Exploring Univariate Data
 Stats 11 (Fall 2004) Lecture Note Introduction to Statistical Methods for Business and Economics Instructor: Hongquan Xu Chapter 2: Tools for Exploring Univariate Data Section 2.1: Introduction What is
8/4/2009. Describing Data with Graphs
 Describing Data with Graphs 1 A variable is a characteristic that changes or varies over time and/or for different individuals or objects under consideration. Examples: Hair color, white blood cell count,
Latest Syllabus - NMO
 Latest Syllabus - NMO CLASS 1 Numerals and Number Name (2 digit numbers) Addition, Subtraction Knowledge of currency notes. Knowledge of clock. Knowledge of basic units of Length,. Knowledge of basic figures
Essential Academic Skills Subtest III: Mathematics (003)
") Essential Academic Skills Subtest III: Mathematics (003) NES, the NES logo, Pearson, the Pearson logo, and National Evaluation Series are trademarks in the U.S. and/or other countries of Pearson Education,
Essential Academic Skills Subtest III: Mathematics (003) NES, the NES logo, Pearson, the Pearson logo, and National Evaluation Series are trademarks in the U.S. and/or other countries of Pearson Education,
D1-2 Data Presentation 1
 D1-2 Data Presentation 1 tables, picture graphs, bar graphs, dot plots, scatter graphs, line graphs and pie charts Pre-requisites: D1-1 (Introduction to Data) Estimated Time: 3 hours Summary Learn Solve
Chapter 1 Review of Equations and Inequalities
 Chapter 1 Review of Equations and Inequalities Part I Review of Basic Equations Recall that an equation is an expression with an equal sign in the middle. Also recall that, if a question asks you to solve
APS Eighth Grade Math District Benchmark Assessment NM Math Standards Alignment
 EIGHTH GRADE NM STANDARDS Strand: NUMBER AND OPERATIONS Standard: Students will understand numerical concepts and mathematical operations. 5-8 Benchmark N.: Understand numbers, ways of representing numbers,
STAT 200 Chapter 1 Looking at Data - Distributions
 STAT 200 Chapter 1 Looking at Data - Distributions What is Statistics? Statistics is a science that involves the design of studies, data collection, summarizing and analyzing the data, interpreting the
Chapter 2: Looking at Data Relationships (Part 3)
") Chapter 2: Looking at Data Relationships (Part 3) Dr. Nahid Sultana Chapter 2: Looking at Data Relationships 2.1: Scatterplots 2.2: Correlation 2.3: Least-Squares Regression 2.5: Data Analysis for Two-Way
Chapter 2: Looking at Data Relationships (Part 3) Dr. Nahid Sultana Chapter 2: Looking at Data Relationships 2.1: Scatterplots 2.2: Correlation 2.3: Least-Squares Regression 2.5: Data Analysis for Two-Way
CAMBRIDGE IGCSE MATHS EXAMINATION BOARD COVERAGE
 CAMBRIDGE IGCSE MATHS EXAMINATION BOARD COVERAGE TIER TOPIC HEADING SUB HEADING Both Number Integers Ordering numbers Both Number Integers Rounding numbers Both Number Integers Adding and subtracting whole
Chapter 9 Solving Systems of Linear Equations Algebraically
 Name: Chapter 9 Solving Systems of Linear Equations Algebraically 9.1 Solving Systems of Linear Equations by Substitution Outcomes: 1. Interpret algebraic reasoning through the study of relations 9. Solve
Section 6.2: Measures of Variation
 Section 6.2: Measures of Variation Measures of variation (or spread) refers to a set of numerical summaries that describe the degree to which the data are spread out. Why do we need them? Why is using
Chapter 2: Descriptive Analysis and Presentation of Single- Variable Data
 Chapter 2: Descriptive Analysis and Presentation of Single- Variable Data Mean 26.86667 Standard Error 2.816392 Median 25 Mode 20 Standard Deviation 10.90784 Sample Variance 118.981 Kurtosis -0.61717 Skewness
Frequency Measures and Graphical Representation of Data
 Frequency Measures and Graphical Representation of Data 2 In Chap. 1, we highlighted that different variables contain different levels of information. When summarizing or visualizing one or more variable(s),
Frequency and Histograms
 Warm Up Lesson Presentation Lesson Quiz Algebra 1 Create stem-and-leaf plots. Objectives Create frequency tables and histograms. Vocabulary stem-and-leaf plot frequency frequency table histogram cumulative
Notes: Unit 1: Math and Measurement
 Name: Regents Chemistry: Notes: Unit 1: Math and Measurement www.chempride.weebly.com Key Ideas Major Understandings: o Chemistry is the study of matter: Matter takes up space and has mass. (K- 4, 3.1a)
Notes: Unit 1: Math and Measurement
 Name: Regents Chemistry: Notes: Unit 1: Math and Measurement www.chempride.weebly.com Key Ideas Major Understandings: o Chemistry is the study of matter: Matter takes up space and has mass. (K- 4, 3.1a)
CHAPTER 8 INTRODUCTION TO STATISTICAL ANALYSIS
 CHAPTER 8 INTRODUCTION TO STATISTICAL ANALYSIS LEARNING OBJECTIVES: After studying this chapter, a student should understand: notation used in statistics; how to represent variables in a mathematical form
P1 process mark. This mark is generally given for setting up an appropriate process to find a solution in the context of the question.
 GCSE Mathematics (MA) Higher Tier Paper H November 07 student-friendly mark scheme Please note that this mark scheme is not the one used by examiners for making scripts. It is intended more as a guide
1 Probability Distributions
 1 Probability Distributions In the chapter about descriptive statistics sample data were discussed, and tools introduced for describing the samples with numbers as well as with graphs. In this chapter
Algebra Readiness. Curriculum (445 topics additional topics)
") Algebra Readiness This course covers the topics shown below; new topics have been highlighted. Students navigate learning paths based on their level of readiness. Institutional users may customize the
Algebra Readiness This course covers the topics shown below; new topics have been highlighted. Students navigate learning paths based on their level of readiness. Institutional users may customize the
Relationships Between Quantities
 Algebra 1 Relationships Between Quantities Relationships Between Quantities Everyone loves math until there are letters (known as variables) in problems!! Do students complain about reading when they come
AP Final Review II Exploring Data (20% 30%)
") AP Final Review II Exploring Data (20% 30%) Quantitative vs Categorical Variables Quantitative variables are numerical values for which arithmetic operations such as means make sense. It is usually a measure
AP Final Review II Exploring Data (20% 30%) Quantitative vs Categorical Variables Quantitative variables are numerical values for which arithmetic operations such as means make sense. It is usually a measure
Pre Algebra. Curriculum (634 topics)
") Pre Algebra This course covers the topics shown below. Students navigate learning paths based on their level of readiness. Institutional users may customize the scope and sequence to meet curricular needs.
Pre Algebra This course covers the topics shown below. Students navigate learning paths based on their level of readiness. Institutional users may customize the scope and sequence to meet curricular needs.
Math 016 Lessons Wimayra LUY
 Math 016 Lessons Wimayra LUY wluy@ccp.edu MATH 016 Lessons LESSON 1 Natural Numbers The set of natural numbers is given by N = {0, 1, 2, 3, 4...}. Natural numbers are used for two main reasons: 1. counting,
SYNA INTERNATIONAL SCHOOL LEARNING PAPERS CLASS 8 SUBJECT MATHEMATICS
 CLASS 8 Page 1 SYNA INTERNATIONAL SCHOOL LEARNING PAPERS CLASS 8 SUBJECT MATHEMATICS 1 x 1 2 3 4 5 6 7 8 9 10 11 12 13 14 15 16 17 18 19 20 2 x 2 4 6 8 10 12 14 16 18 20 22 24 26 28 30 32 34 36 38 40 3
National 5 Course Notes. Scientific Notation (or Standard Form) This is a different way of writing very large and very small numbers in the form:-
 This is a different way of writing very large and very small numbers in the form:-") National 5 Course Notes Scientific Notation (or Standard Form) This is a different way of writing very large and very small numbers in the form:- a x 10 n where a is between 1 and 10 and n is an integer
National 5 Course Notes Scientific Notation (or Standard Form) This is a different way of writing very large and very small numbers in the form:- a x 10 n where a is between 1 and 10 and n is an integer
Class 11 Maths Chapter 15. Statistics
 1 P a g e Class 11 Maths Chapter 15. Statistics Statistics is the Science of collection, organization, presentation, analysis and interpretation of the numerical data. Useful Terms 1. Limit of the Class
STUDY GUIDE Math 20. To accompany Intermediate Algebra for College Students By Robert Blitzer, Third Edition
 STUDY GUIDE Math 0 To the students: To accompany Intermediate Algebra for College Students By Robert Blitzer, Third Edition When you study Algebra, the material is presented to you in a logical sequence.
Middle School Math Course 2
 Middle School Math Course 2 This course covers the topics shown below. Students navigate learning paths based on their level of readiness. Institutional users may customize the scope and sequence to meet