Organization of 2D Space
|
|
|
- Rodney Preston
- 5 years ago
- Views:
Transcription
1 Organization of 2D Space Linear Frequency is Mapped in 2D Space Linear frequency time series, bar charts, histograms, etc. feature 2possible more sets of information Most data have multi-dimensional and multivariate metadata that can be effectively charted Linear frequency may not fully describe multivariate data but. 1


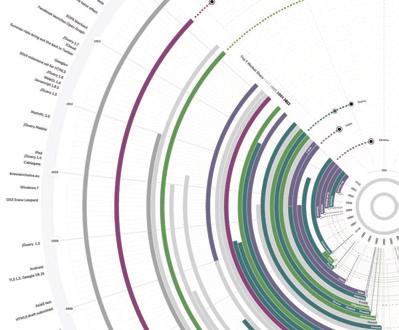
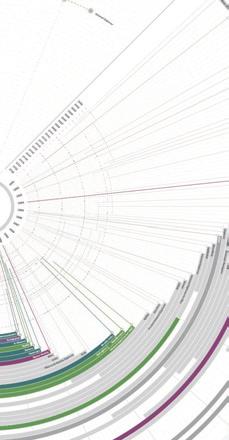
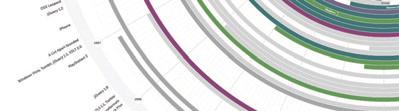
2 All checkouts of "Catcher in the Rye, Anis Haron! Click for Interactive Version Hot Topics , Patrick Rudolph! 2


3 " Statistical " Narrative " Play of the Imagination " Visual Explorations Hot Topics , Patrick Rudolph! Arc Diagram: Bible Studies 3!

4 Histogram-like map with boxplot!" Select Boxplot: Five Number Summary!" Outliers!" Spread with!" Upper quartile!" Median!" Lower quartile 4!
5 SPL has Multi-dimensional Data ItemNumber: // Unique to each specific item BibNumber: // Unique to each bib record Ckodate: Ckotime: 16:55:00 Ckidate: Ckitime: 18:21:00 Collcode: nanf // where its located, what it is, etc. Itemtype: acbk Barcode: // Like ItemNumber Title: Untangling my chopsticks, a culinary sojourn in Kyoto CallNumber: R358U 2003 DeweyClass: Keywords: Cookery Japanese, Japanese tea ceremony, Kyoto Japan Social life and customs, Food habits Japan Kyoto Boxplot: Five Number Summary!" Outliers!" Spread with!" Upper quartile!" Median!" Lower quartile 5!


6 Analysis of check-out items in 2007, Yung-Ting Chuang! Boxplot: Five Number Summary 6

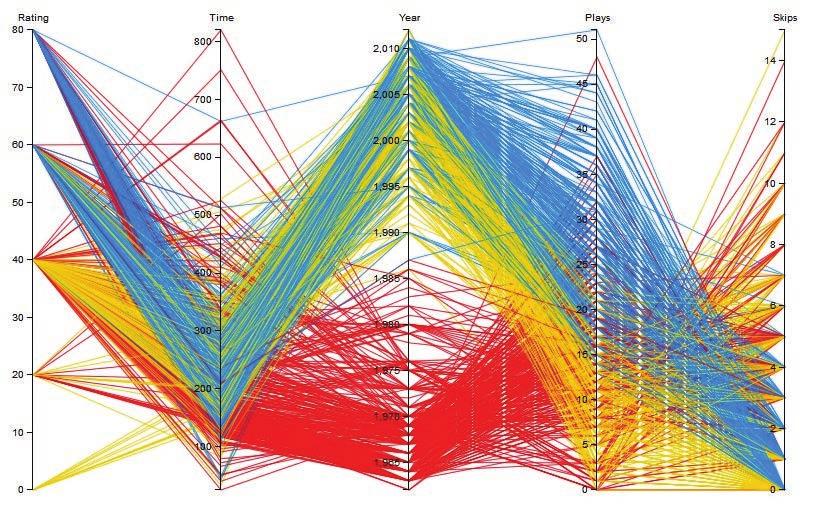
7 Parallel Coordinates: Multi-dimensional Data ogy Parallel Coordinates: Multi-dimensional Data 7!

8 Scatter Plots A diagram using Cartesian coordinates to display values for two variables for a set of data The data is displayed as a collection of points, each having the value of one variable determining the position on the horizontal axis and the value of the other variable determining the position on the vertical axis Easy to identify outliers Scatterplot: Summary of a set of bivariate data Potential association between two variables 8


9 Scatterplot: Summary of a set of bivariate data!" Clustering to show change over time Combine Scatterplot with 2D matrix 9!

10 2S Spatial Maps NY Times Sector Snapshot 10

11 2D Spatial Maps 2D Spatial Maps 11

12 2S Spatial Maps E.J. Marey Bivariate Data Train Schedule (1880s) 12


13 Time Graphs George Legrady! Winter 2006! 25! 13!
14 14!
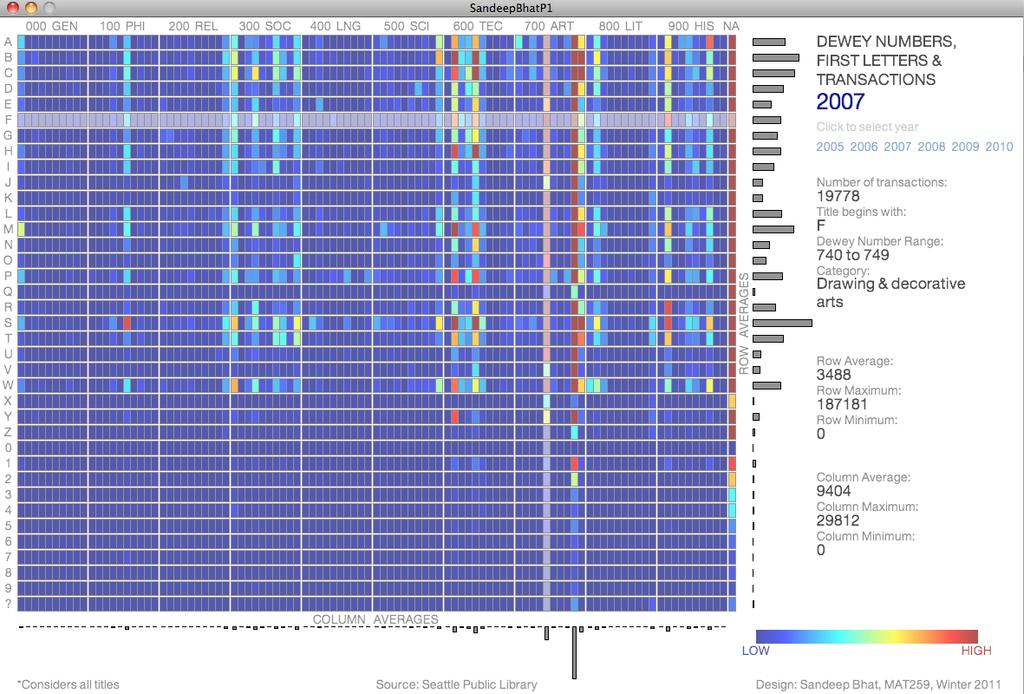
 Ordinal variable equally spaced (Dewey) 15")
15 Mosaic Plots A Graphical Display that visualizes the relationship among two or more categorical variables Categorical: No intrinsic ordering (Itemtypes) Ordinal: Clear ordering: CollCode Interval: Ordinal variable equally spaced (Dewey) Mosaic Plots A Graphical Display that visualizes the relationship among two or more categorical variables Categorical: No intrinsic ordering (Itemtypes) Ordinal: Clear ordering: CollCode Interval: Ordinal variable equally spaced (Dewey) 15


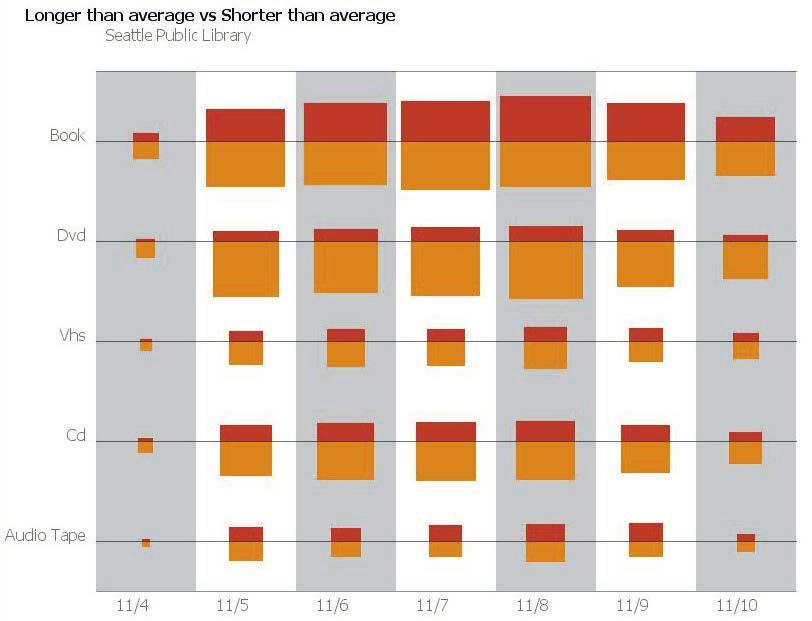
16 Dimensional Mosaic Plot: Spatially conveys 4 variables: xpos,ypos, height, width TreeMap: SmartMoney (Schneiderman/Wattenberg) 16!


17 Kohonen Self-Organizing Map Algorithm Visualizing knowledge domain spatially using Kohonen (Skupin) 17!
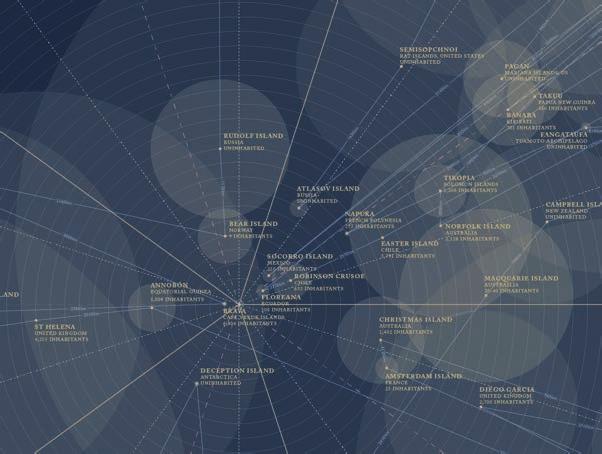
18 InfoGraph: 50 loneliests islands Visual Complexity: Visualizing Networks 18!


19 Visual Network Bertin: Semiology of Graphics!" Cartographer: published 1967!" Theoretical foundation for Information Visualization!" Information Visualization: The visualization of abstract data!" Semiology: the study of signs and how they convey meaning!" What are the basic units by which meaning is created in a visual system? 19!


20 Bertin: Reorderable Matrix!" Data are often presented in a table or chart whose rows and columns are intrinsically unordered, but which are arranged in an order which conceals patterns, rather than reveal them.!" Bio-infomatics use re-ordering to make patterns more visible Labeling Issues 2D Spatial Maps 20!


21 Bertin: Reorderable Matrix US Political History: Alphabetical 2D Spatial Maps 21!

22 US Political History: Most recent results 2D Spatial Maps US Political History: 3 regions 2D Spatial Maps 22!


23 Kosara: US Political History 2D Spatial Maps Bertin: Reorderable Matrix!" Data are often presented in a table or chart whose rows and columns are intrinsically unordered, but which are arranged in an order which conceals patterns, rather than reveal them.!" Bio-infomatics use re-ordering to make patterns more visible 23!


24 US Political History 2D Spatial Maps 24!
Sociology 6Z03 Review I
 Sociology 6Z03 Review I John Fox McMaster University Fall 2016 John Fox (McMaster University) Sociology 6Z03 Review I Fall 2016 1 / 19 Outline: Review I Introduction Displaying Distributions Describing
For instance, we want to know whether freshmen with parents of BA degree are predicted to get higher GPA than those with parents without BA degree.
 DESCRIPTIVE ANALYSIS For instance, we want to know whether freshmen with parents of BA degree are predicted to get higher GPA than those with parents without BA degree. Assume that we have data; what information
P8130: Biostatistical Methods I
 P8130: Biostatistical Methods I Lecture 2: Descriptive Statistics Cody Chiuzan, PhD Department of Biostatistics Mailman School of Public Health (MSPH) Lecture 1: Recap Intro to Biostatistics Types of Data
Transforming Data: Cultural Strategies. Room I-405 Mondays 3:00-5:50pm. academic/courses/11fns/index.
 Transforming Data: Cultural Strategies Room I-405 Mondays 3:00-5:50pm http://www.mat.ucsb.edu/~g.legrady/ academic/courses/11fns/index.html Course Focus Visualizations Give Meaning to Information A lecture,
Visualizing Data: Basic Plot Types
 Visualizing Data: Basic Plot Types Data Science 101 Stanford University, Department of Statistics Agenda Today s lecture focuses on these basic plot types: bar charts histograms boxplots scatter plots
Units. Exploratory Data Analysis. Variables. Student Data
 Units Exploratory Data Analysis Bret Larget Departments of Botany and of Statistics University of Wisconsin Madison Statistics 371 13th September 2005 A unit is an object that can be measured, such as
Descriptive Statistics
 Descriptive Statistics CHAPTER OUTLINE 6-1 Numerical Summaries of Data 6- Stem-and-Leaf Diagrams 6-3 Frequency Distributions and Histograms 6-4 Box Plots 6-5 Time Sequence Plots 6-6 Probability Plots Chapter
Prentice Hall Stats: Modeling the World 2004 (Bock) Correlated to: National Advanced Placement (AP) Statistics Course Outline (Grades 9-12)
 Correlated to: National Advanced Placement (AP) Statistics Course Outline (Grades 9-12)") National Advanced Placement (AP) Statistics Course Outline (Grades 9-12) Following is an outline of the major topics covered by the AP Statistics Examination. The ordering here is intended to define the
National Advanced Placement (AP) Statistics Course Outline (Grades 9-12) Following is an outline of the major topics covered by the AP Statistics Examination. The ordering here is intended to define the
Statistics I Chapter 2: Univariate data analysis
 Statistics I Chapter 2: Univariate data analysis Chapter 2: Univariate data analysis Contents Graphical displays for categorical data (barchart, piechart) Graphical displays for numerical data data (histogram,
Chapter 7: Statistics Describing Data. Chapter 7: Statistics Describing Data 1 / 27
 Chapter 7: Statistics Describing Data Chapter 7: Statistics Describing Data 1 / 27 Categorical Data Four ways to display categorical data: 1 Frequency and Relative Frequency Table 2 Bar graph (Pareto chart)
Statistics I Chapter 2: Univariate data analysis
 Statistics I Chapter 2: Univariate data analysis Chapter 2: Univariate data analysis Contents Graphical displays for categorical data (barchart, piechart) Graphical displays for numerical data data (histogram,
MAT Mathematics in Today's World
 MAT 1000 Mathematics in Today's World Last Time 1. Three keys to summarize a collection of data: shape, center, spread. 2. Can measure spread with the fivenumber summary. 3. The five-number summary can
Contents. 13. Graphs of Trigonometric Functions 2 Example Example
 Contents 13. Graphs of Trigonometric Functions 2 Example 13.19............................... 2 Example 13.22............................... 5 1 Peterson, Technical Mathematics, 3rd edition 2 Example 13.19
1. Exploratory Data Analysis
 1. Exploratory Data Analysis 1.1 Methods of Displaying Data A visual display aids understanding and can highlight features which may be worth exploring more formally. Displays should have impact and be
Geovisualization. Luc Anselin. Copyright 2016 by Luc Anselin, All Rights Reserved
 Geovisualization Luc Anselin http://spatial.uchicago.edu from EDA to ESDA from mapping to geovisualization mapping basics multivariate EDA primer From EDA to ESDA Exploratory Data Analysis (EDA) reaction
Unit Six Information. EOCT Domain & Weight: Algebra Connections to Statistics and Probability - 15%
 GSE Algebra I Unit Six Information EOCT Domain & Weight: Algebra Connections to Statistics and Probability - 15% Curriculum Map: Describing Data Content Descriptors: Concept 1: Summarize, represent, and
Graphing Data. Example:
 Graphing Data Bar graphs and line graphs are great for looking at data over time intervals, or showing the rise and fall of a quantity over the passage of time. Example: Auto Sales by Year Year Number
Chapter 1: Exploring Data
 Chapter 1: Exploring Data Section 1.3 with Numbers The Practice of Statistics, 4 th edition - For AP* STARNES, YATES, MOORE Chapter 1 Exploring Data Introduction: Data Analysis: Making Sense of Data 1.1
Further Mathematics 2018 CORE: Data analysis Chapter 2 Summarising numerical data
 Chapter 2: Summarising numerical data Further Mathematics 2018 CORE: Data analysis Chapter 2 Summarising numerical data Extract from Study Design Key knowledge Types of data: categorical (nominal and ordinal)
1-1. Chapter 1. Sampling and Descriptive Statistics by The McGraw-Hill Companies, Inc. All rights reserved.
 1-1 Chapter 1 Sampling and Descriptive Statistics 1-2 Why Statistics? Deal with uncertainty in repeated scientific measurements Draw conclusions from data Design valid experiments and draw reliable conclusions
Descriptive Univariate Statistics and Bivariate Correlation
 ESC 100 Exploring Engineering Descriptive Univariate Statistics and Bivariate Correlation Instructor: Sudhir Khetan, Ph.D. Wednesday/Friday, October 17/19, 2012 The Central Dogma of Statistics used to
Topic 3: Introduction to Statistics. Algebra 1. Collecting Data. Table of Contents. Categorical or Quantitative? What is the Study of Statistics?!
 Topic 3: Introduction to Statistics Collecting Data We collect data through observation, surveys and experiments. We can collect two different types of data: Categorical Quantitative Algebra 1 Table of
Statistics Toolbox 6. Apply statistical algorithms and probability models
 Statistics Toolbox 6 Apply statistical algorithms and probability models Statistics Toolbox provides engineers, scientists, researchers, financial analysts, and statisticians with a comprehensive set of
Homework Example Chapter 1 Similar to Problem #14
 Chapter 1 Similar to Problem #14 Given a sample of n = 129 observations of shower-flow-rate, do this: a.) Construct a stem-and-leaf display of the data. b.) What is a typical, or representative flow rate?
Course ID May 2017 COURSE OUTLINE. Mathematics 130 Elementary & Intermediate Algebra for Statistics
 Non-Degree Applicable Glendale Community College Course ID 010238 May 2017 Catalog Statement COURSE OUTLINE Mathematics 130 Elementary & Intermediate Algebra for Statistics is a one-semester accelerated
STP 420 INTRODUCTION TO APPLIED STATISTICS NOTES
 INTRODUCTION TO APPLIED STATISTICS NOTES PART - DATA CHAPTER LOOKING AT DATA - DISTRIBUTIONS Individuals objects described by a set of data (people, animals, things) - all the data for one individual make
CHAPTER 2: Describing Distributions with Numbers
 CHAPTER 2: Describing Distributions with Numbers The Basic Practice of Statistics 6 th Edition Moore / Notz / Fligner Lecture PowerPoint Slides Chapter 2 Concepts 2 Measuring Center: Mean and Median Measuring
ALGEBRA I CURRICULUM OUTLINE
 ALGEBRA I CURRICULUM OUTLINE 2013-2014 OVERVIEW: 1. Operations with Real Numbers 2. Equation Solving 3. Word Problems 4. Inequalities 5. Graphs of Functions 6. Linear Functions 7. Scatterplots and Lines
MATH 1150 Chapter 2 Notation and Terminology
 MATH 1150 Chapter 2 Notation and Terminology Categorical Data The following is a dataset for 30 randomly selected adults in the U.S., showing the values of two categorical variables: whether or not the
Last Lecture. Distinguish Populations from Samples. Knowing different Sampling Techniques. Distinguish Parameters from Statistics
 Last Lecture Distinguish Populations from Samples Importance of identifying a population and well chosen sample Knowing different Sampling Techniques Distinguish Parameters from Statistics Knowing different
ECLT 5810 Data Preprocessing. Prof. Wai Lam
 ECLT 5810 Data Preprocessing Prof. Wai Lam Why Data Preprocessing? Data in the real world is imperfect incomplete: lacking attribute values, lacking certain attributes of interest, or containing only aggregate
Sets and Set notation. Algebra 2 Unit 8 Notes
 Sets and Set notation Section 11-2 Probability Experimental Probability experimental probability of an event: Theoretical Probability number of time the event occurs P(event) = number of trials Sample
Fig. F-1-1. Data finder on Gfdnavi. Left panel shows data tree. Right panel shows items in the selected folder. After Otsuka and Yoden (2010).
.") F. Decision support system F-1. Experimental development of a decision support system for prevention and mitigation of meteorological disasters based on ensemble NWP Data 1 F-1-1. Introduction Ensemble
F. Decision support system F-1. Experimental development of a decision support system for prevention and mitigation of meteorological disasters based on ensemble NWP Data 1 F-1-1. Introduction Ensemble
Introduction to Statistical Analysis using IBM SPSS Statistics (v24)
") to Statistical Analysis using IBM SPSS Statistics (v24) to Statistical Analysis Using IBM SPSS Statistics is a two day instructor-led classroom course that provides an application-oriented introduction
to Statistical Analysis using IBM SPSS Statistics (v24) to Statistical Analysis Using IBM SPSS Statistics is a two day instructor-led classroom course that provides an application-oriented introduction
CS 361: Probability & Statistics
 January 24, 2018 CS 361: Probability & Statistics Relationships in data Standard coordinates If we have two quantities of interest in a dataset, we might like to plot their histograms and compare the two
Chapter 1. Looking at Data
 Chapter 1 Looking at Data Types of variables Looking at Data Be sure that each variable really does measure what you want it to. A poor choice of variables can lead to misleading conclusions!! For example,
From Practical Data Analysis with JMP, Second Edition. Full book available for purchase here. About This Book... xiii About The Author...
 From Practical Data Analysis with JMP, Second Edition. Full book available for purchase here. Contents About This Book... xiii About The Author... xxiii Chapter 1 Getting Started: Data Analysis with JMP...
Chapter 2: Tools for Exploring Univariate Data
 Stats 11 (Fall 2004) Lecture Note Introduction to Statistical Methods for Business and Economics Instructor: Hongquan Xu Chapter 2: Tools for Exploring Univariate Data Section 2.1: Introduction What is
Chapter 3. Data Description
 Chapter 3. Data Description Graphical Methods Pie chart It is used to display the percentage of the total number of measurements falling into each of the categories of the variable by partition a circle.
Describing distributions with numbers
 Describing distributions with numbers A large number or numerical methods are available for describing quantitative data sets. Most of these methods measure one of two data characteristics: The central
Instructional Unit Basic Statistics Algebra II #309 Unit Content Objective Performance Indicator Performance Task State Standards Code:
 Algebra II Instructional Unit Basic Statistics -Displaying data with dotplots and The students will be -Use scientific or graphing -Classroom discussion 2.1.11.A stemplots. able to evaluate calculator
Class 11 Maths Chapter 15. Statistics
 1 P a g e Class 11 Maths Chapter 15. Statistics Statistics is the Science of collection, organization, presentation, analysis and interpretation of the numerical data. Useful Terms 1. Limit of the Class
Chapter 2 Class Notes Sample & Population Descriptions Classifying variables
 Chapter 2 Class Notes Sample & Population Descriptions Classifying variables Random Variables (RVs) are discrete quantitative continuous nominal qualitative ordinal Notation and Definitions: a Sample is
8th Grade Math! 4th Quarter Pacing Guide LESSON PLANNING. Delivery Date
 #8 Domain: Functions Standard: CC.8.F.4 Construct a function to model a linear relationship between two quantities. Determine the rate of change and initial value of the function from a description of
BNG 495 Capstone Design. Descriptive Statistics
 BNG 495 Capstone Design Descriptive Statistics Overview The overall goal of this short course in statistics is to provide an introduction to descriptive and inferential statistical methods, with a focus
Vocabulary: Samples and Populations
 Vocabulary: Samples and Populations Concept Different types of data Categorical data results when the question asked in a survey or sample can be answered with a nonnumerical answer. For example if we
STAT 200 Chapter 1 Looking at Data - Distributions
 STAT 200 Chapter 1 Looking at Data - Distributions What is Statistics? Statistics is a science that involves the design of studies, data collection, summarizing and analyzing the data, interpreting the
Tabulation means putting data into tables. A table is a matrix of data in rows and columns, with the rows and the columns having titles.
 1 Tabulation means putting data into tables. A table is a matrix of data in rows and columns, with the rows and the columns having titles. 2 converting the set of numbers into the form of a grouped frequency
Lecture 1: Descriptive Statistics
 Lecture 1: Descriptive Statistics MSU-STT-351-Sum 15 (P. Vellaisamy: MSU-STT-351-Sum 15) Probability & Statistics for Engineers 1 / 56 Contents 1 Introduction 2 Branches of Statistics Descriptive Statistics
Biostatistics Presentation of data DR. AMEER KADHIM HUSSEIN M.B.CH.B.FICMS (COM.)
") Biostatistics Presentation of data DR. AMEER KADHIM HUSSEIN M.B.CH.B.FICMS (COM.) PRESENTATION OF DATA 1. Mathematical presentation (measures of central tendency and measures of dispersion). 2. Tabular
Biostatistics Presentation of data DR. AMEER KADHIM HUSSEIN M.B.CH.B.FICMS (COM.) PRESENTATION OF DATA 1. Mathematical presentation (measures of central tendency and measures of dispersion). 2. Tabular
Glossary for the Triola Statistics Series
 Glossary for the Triola Statistics Series Absolute deviation The measure of variation equal to the sum of the deviations of each value from the mean, divided by the number of values Acceptance sampling
KAAF- GE_Notes GIS APPLICATIONS LECTURE 3
 GIS APPLICATIONS LECTURE 3 SPATIAL AUTOCORRELATION. First law of geography: everything is related to everything else, but near things are more related than distant things Waldo Tobler Check who is sitting
CHAPTER 5: EXPLORING DATA DISTRIBUTIONS. Individuals are the objects described by a set of data. These individuals may be people, animals or things.
 (c) Epstein 2013 Chapter 5: Exploring Data Distributions Page 1 CHAPTER 5: EXPLORING DATA DISTRIBUTIONS 5.1 Creating Histograms Individuals are the objects described by a set of data. These individuals
MS-E2112 Multivariate Statistical Analysis (5cr) Lecture 1: Introduction, Multivariate Location and Scatter
 Lecture 1: Introduction, Multivariate Location and Scatter") MS-E2112 Multivariate Statistical Analysis (5cr) Lecture 1:, Multivariate Location Contents , pauliina.ilmonen(a)aalto.fi Lectures on Mondays 12.15-14.00 (2.1. - 6.2., 20.2. - 27.3.), U147 (U5) Exercises
MS-E2112 Multivariate Statistical Analysis (5cr) Lecture 1:, Multivariate Location Contents , pauliina.ilmonen(a)aalto.fi Lectures on Mondays 12.15-14.00 (2.1. - 6.2., 20.2. - 27.3.), U147 (U5) Exercises
Vocabulary: Data About Us
 Vocabulary: Data About Us Two Types of Data Concept Numerical data: is data about some attribute that must be organized by numerical order to show how the data varies. For example: Number of pets Measure
1.3: Describing Quantitative Data with Numbers
 1.3: Describing Quantitative Data with Numbers Section 1.3 Describing Quantitative Data with Numbers After this section, you should be able to MEASURE center with the mean and median MEASURE spread with
AP Final Review II Exploring Data (20% 30%)
") AP Final Review II Exploring Data (20% 30%) Quantitative vs Categorical Variables Quantitative variables are numerical values for which arithmetic operations such as means make sense. It is usually a measure
AP Final Review II Exploring Data (20% 30%) Quantitative vs Categorical Variables Quantitative variables are numerical values for which arithmetic operations such as means make sense. It is usually a measure
Univariate (one variable) data
 data") Bivariate Data Univariate (one variable) data Involves only a single variable So cannot describe associations or relationships Descriptive Statistics Central tendencies: mean, median, mode Dispersion:
Bivariate Data Univariate (one variable) data Involves only a single variable So cannot describe associations or relationships Descriptive Statistics Central tendencies: mean, median, mode Dispersion:
Describing Data: Two Variables
 STAT 250 Dr. Kari Lock Morgan Describing Data: Two Variables SECTIONS 2.4, 2.5 One quantitative variable (2.4) One quantitative and one categorical (2.4) Two quantitative (2.5) z- score Which is better,
Stat 101 Exam 1 Important Formulas and Concepts 1
 1 Chapter 1 1.1 Definitions Stat 101 Exam 1 Important Formulas and Concepts 1 1. Data Any collection of numbers, characters, images, or other items that provide information about something. 2. Categorical/Qualitative
Module 1. Identify parts of an expression using vocabulary such as term, equation, inequality
 Common Core Standards Major Topic Key Skills Chapters Key Vocabulary Essential Questions Module 1 Pre- Requisites Skills: Students need to know how to add, subtract, multiply and divide. Students need
Statistics lecture 3. Bell-Shaped Curves and Other Shapes
 Statistics lecture 3 Bell-Shaped Curves and Other Shapes Goals for lecture 3 Realize many measurements in nature follow a bell-shaped ( normal ) curve Understand and learn to compute a standardized score
CS 5630/6630 Scientific Visualization. Elementary Plotting Techniques II
 CS 5630/6630 Scientific Visualization Elementary Plotting Techniques II Motivation Given a certain type of data, what plotting technique should I use? What plotting techniques should be avoided? How do
Chapter2 Description of samples and populations. 2.1 Introduction.
 Chapter2 Description of samples and populations. 2.1 Introduction. Statistics=science of analyzing data. Information collected (data) is gathered in terms of variables (characteristics of a subject that
Statistics Add Ins.notebook. November 22, Add ins
 Add ins We have LOADS of things we need to know for the IGCSE that you haven't learnt as part of the Bavarian Curriculum. We are now going to shoehorn in some of those topics and ideas. Nov 12 11:50 Main
REVIEW: Midterm Exam. Spring 2012
 REVIEW: Midterm Exam Spring 2012 Introduction Important Definitions: - Data - Statistics - A Population - A census - A sample Types of Data Parameter (Describing a characteristic of the Population) Statistic
Data Visualization (DSC 530/CIS )
") Data Visualization (DSC 530/CIS 602-01) Tables Dr. David Koop Visualization of Tables Items and attributes For now, attributes are not known to be positions Keys and values - key is an independent attribute
Data Visualization (DSC 530/CIS 602-01) Tables Dr. David Koop Visualization of Tables Items and attributes For now, attributes are not known to be positions Keys and values - key is an independent attribute
MODULE 7 UNIVARIATE EDA - QUANTITATIVE
 MODULE 7 UNIVARIATE EDA - QUANTITATIVE Contents 7.1 Interpreting Shape........................................ 46 7.2 Interpreting Outliers....................................... 47 7.3 Comparing the Median
Measures of. U4 C 1.2 Dot plot and Histogram 2 January 15 16, 2015
 U4 C 1. Dot plot and Histogram January 15 16, 015 U 4 : C 1.1 CCSS. 9 1.S ID.1 Dot Plots and Histograms Objective: We will be able to represent data with plots on the real number line, using: Dot Plots
Elementary Statistics
 Elementary Statistics Q: What is data? Q: What does the data look like? Q: What conclusions can we draw from the data? Q: Where is the middle of the data? Q: Why is the spread of the data important? Q:
Secondary 1 Vocabulary Cards and Word Walls Revised: March 16, 2012
 Secondary 1 Vocabulary Cards and Word Walls Revised: March 16, 2012 Important Notes for Teachers: The vocabulary cards in this file match the Common Core, the math curriculum adopted by the Utah State
Description of Samples and Populations
 Description of Samples and Populations Random Variables Data are generated by some underlying random process or phenomenon. Any datum (data point) represents the outcome of a random variable. We represent
(quantitative or categorical variables) Numerical descriptions of center, variability, position (quantitative variables)
 Numerical descriptions of center, variability, position (quantitative variables)") 3. Descriptive Statistics Describing data with tables and graphs (quantitative or categorical variables) Numerical descriptions of center, variability, position (quantitative variables) Bivariate descriptions
3. Descriptive Statistics Describing data with tables and graphs (quantitative or categorical variables) Numerical descriptions of center, variability, position (quantitative variables) Bivariate descriptions
Prentice Hall Mathematics, Course
 Prentice Hall Mathematics, Course 3 2010 Grade 8 C O R R E L A T E D T O North Carolina s, Mathematics Grade 8 (Adopted 2009) North Carolina s, Mathematics Math 8 (Adopted 2009) North Carolina s Mathematics
Math Section SR MW 1-2:30pm. Bekki George: University of Houston. Sections
 Math 3339 Section 21155 - SR 117 - MW 1-2:30pm Bekki George: bekki@math.uh.edu University of Houston Sections 2.1-2.3 Bekki George (UH) Math 3339 Sections 2.1-2.3 1 / 28 Office Hours: Mondays 11am - 12:30pm,
Glossary. The ISI glossary of statistical terms provides definitions in a number of different languages:
 Glossary The ISI glossary of statistical terms provides definitions in a number of different languages: http://isi.cbs.nl/glossary/index.htm Adjusted r 2 Adjusted R squared measures the proportion of the
Probability Distributions
 Probability Distributions Probability This is not a math class, or an applied math class, or a statistics class; but it is a computer science course! Still, probability, which is a math-y concept underlies
Chapter 5: Exploring Data: Distributions Lesson Plan
 Lesson Plan Exploring Data Displaying Distributions: Histograms Interpreting Histograms Displaying Distributions: Stemplots Describing Center: Mean and Median Describing Variability: The Quartiles The
Announcements. Lecture 1 - Data and Data Summaries. Data. Numerical Data. all variables. continuous discrete. Homework 1 - Out 1/15, due 1/22
 Announcements Announcements Lecture 1 - Data and Data Summaries Statistics 102 Colin Rundel January 13, 2013 Homework 1 - Out 1/15, due 1/22 Lab 1 - Tomorrow RStudio accounts created this evening Try logging
Design of Experiments
 Design of Experiments D R. S H A S H A N K S H E K H A R M S E, I I T K A N P U R F E B 19 TH 2 0 1 6 T E Q I P ( I I T K A N P U R ) Data Analysis 2 Draw Conclusions Ask a Question Analyze data What to
are the objects described by a set of data. They may be people, animals or things.
 ( c ) E p s t e i n, C a r t e r a n d B o l l i n g e r 2016 C h a p t e r 5 : E x p l o r i n g D a t a : D i s t r i b u t i o n s P a g e 1 CHAPTER 5: EXPLORING DATA DISTRIBUTIONS 5.1 Creating Histograms
Lecture Notes 2: Variables and graphics
 Highlights: Lecture Notes 2: Variables and graphics Quantitative vs. qualitative variables Continuous vs. discrete and ordinal vs. nominal variables Frequency distributions Pie charts Bar charts Histograms
M 225 Test 1 B Name SHOW YOUR WORK FOR FULL CREDIT! Problem Max. Points Your Points Total 75
 M 225 Test 1 B Name SHOW YOUR WORK FOR FULL CREDIT! Problem Max. Points Your Points 1-13 13 14 3 15 8 16 4 17 10 18 9 19 7 20 3 21 16 22 2 Total 75 1 Multiple choice questions (1 point each) 1. Look at
GRADE 8. Know that there are numbers that are not rational, and approximate them by rational numbers.
 GRADE 8 Students will: The Number System Know that there are numbers that are not rational, and approximate them by rational numbers. 1. Know that numbers that are not rational are called irrational. Understand
Fundamentals to Biostatistics. Prof. Chandan Chakraborty Associate Professor School of Medical Science & Technology IIT Kharagpur
 Fundamentals to Biostatistics Prof. Chandan Chakraborty Associate Professor School of Medical Science & Technology IIT Kharagpur Statistics collection, analysis, interpretation of data development of new
Social Studies 201 September 22, 2003 Histograms and Density
 1 Social Studies 201 September 22, 2003 Histograms and Density 1. Introduction From a frequency or percentage distribution table, a statistical analyst can develop a graphical presentation of the distribution.
Last time. Numerical summaries for continuous variables. Center: mean and median. Spread: Standard deviation and inter-quartile range
 Lecture 4 Last time Numerical summaries for continuous variables Center: mean and median Spread: Standard deviation and inter-quartile range Exploratory graphics Histogram (revisit modes ) Histograms Histogram
Describing distributions with numbers
 Describing distributions with numbers A large number or numerical methods are available for describing quantitative data sets. Most of these methods measure one of two data characteristics: The central
All the men living in Turkey can be a population. The average height of these men can be a population parameter
 CHAPTER 1: WHY STUDY STATISTICS? Why Study Statistics? Population is a large (or in nite) set of elements that are in the interest of a research question. A parameter is a speci c characteristic of a population
CoDa-dendrogram: A new exploratory tool. 2 Dept. Informàtica i Matemàtica Aplicada, Universitat de Girona, Spain;
 CoDa-dendrogram: A new exploratory tool J.J. Egozcue 1, and V. Pawlowsky-Glahn 2 1 Dept. Matemàtica Aplicada III, Universitat Politècnica de Catalunya, Barcelona, Spain; juan.jose.egozcue@upc.edu 2 Dept.
Review for Exam #1. Chapter 1. The Nature of Data. Definitions. Population. Sample. Quantitative data. Qualitative (attribute) data
 data") Review for Exam #1 1 Chapter 1 Population the complete collection of elements (scores, people, measurements, etc.) to be studied Sample a subcollection of elements drawn from a population 11 The Nature
Review for Exam #1 1 Chapter 1 Population the complete collection of elements (scores, people, measurements, etc.) to be studied Sample a subcollection of elements drawn from a population 11 The Nature
Math 223 Lecture Notes 3/15/04 From The Basic Practice of Statistics, bymoore
 Math 223 Lecture Notes 3/15/04 From The Basic Practice of Statistics, bymoore Chapter 3 continued Describing distributions with numbers Measuring spread of data: Quartiles Definition 1: The interquartile
What is Statistics? Statistics is the science of understanding data and of making decisions in the face of variability and uncertainty.
 What is Statistics? Statistics is the science of understanding data and of making decisions in the face of variability and uncertainty. Statistics is a field of study concerned with the data collection,
MIDTERM EXAMINATION (Spring 2011) STA301- Statistics and Probability
 STA301- Statistics and Probability") STA301- Statistics and Probability Solved MCQS From Midterm Papers March 19,2012 MC100401285 Moaaz.pk@gmail.com Mc100401285@gmail.com PSMD01 MIDTERM EXAMINATION (Spring 2011) STA301- Statistics and Probability
STA301- Statistics and Probability Solved MCQS From Midterm Papers March 19,2012 MC100401285 Moaaz.pk@gmail.com Mc100401285@gmail.com PSMD01 MIDTERM EXAMINATION (Spring 2011) STA301- Statistics and Probability
Middle School Math 3 Grade 8
 Unit Activity Correlations to Common Core State Standards Middle School Math 3 Grade 8 Table of Contents The Number System 1 Expressions and Equations 1 Functions 3 Geometry 4 Statistics and Probability
Data Analytics for Social Science Data inspection and visualisation
 Data Analytics for Social Science Data inspection and visualisation Johan A. Elkink School of Politics & International Relations University College Dublin 31 January 2017 Data analysis process R at the
Outline. Introduction to SpaceStat and ESTDA. ESTDA & SpaceStat. Learning Objectives. Space-Time Intelligence System. Space-Time Intelligence System
 Outline I Data Preparation Introduction to SpaceStat and ESTDA II Introduction to ESTDA and SpaceStat III Introduction to time-dynamic regression ESTDA ESTDA & SpaceStat Learning Objectives Activities
YEAR 9 SCHEME OF WORK - EXTENSION
 YEAR 9 SCHEME OF WORK - EXTENSION Autumn Term 1 Powers and roots Spring Term 1 Multiplicative reasoning Summer Term 1 Graphical solutions Quadratics Non-linear graphs Trigonometry Half Term: Assessment
Chapter 3. Measuring data
 Chapter 3 Measuring data 1 Measuring data versus presenting data We present data to help us draw meaning from it But pictures of data are subjective They re also not susceptible to rigorous inference Measuring
Lecture 1 : Basic Statistical Measures
 Lecture 1 : Basic Statistical Measures Jonathan Marchini October 11, 2004 In this lecture we will learn about different types of data encountered in practice different ways of plotting data to explore