The Nordic Capacity Calculation Methodology (CCM) project. CCM Stakeholder Forum Stockholm 8 February
|
|
|
- Helena Norton
- 6 years ago
- Views:
Transcription
1 The Nordic Capacity Calculation Methodology (CCM) project CCM Stakeholder Forum Stockholm 8 February
2 Agenda 1. Coffee ( ) 2. Welcome, objective and agenda ( ), Trond Jensen (Statnett) 3. NordREG presentation ( ), Johan Roupe (EI) 4. Nordic CCM project and timeline ( ), Trond Jensen (Statnett) 5. Coffee ( ) 6. Nordic FB and CNTC methodologies ( ), Nils Flaten Ræder (Statnett) and Heini Ruohosenmaa (Fingrid) 7. Market results ( ), Mårten Bergman (Svk) 8. First round of questions and answers ( ) 9. Lunch ( ) 10. Market information platform and market information tool ( ), Mårten Bergman (Svk) 11. CCM proposal process ( ), Ulrik Møller (Edk) 12. Coffee break ( ) 13. Second round of questions and answers ( )
3 Agenda 1. Coffee ( ) 2. Welcome, objective and agenda ( ), Trond Jensen (Statnett) 3. NordREG presentation ( ), Johan Roupe (EI) 4. Nordic CCM project and timeline ( ), Trond Jensen (Statnett) 5. Coffee ( ) 6. Nordic FB and CNTC methodologies ( ), Nils Flaten Ræder (Statnett) and Heini Ruohosenmaa (Fingrid) 7. Market results ( ), Mårten Bergman (Svk) 8. First round of questions and answers ( ) 9. Lunch ( ) 10. Market information platform and market information tool ( ), Mårten Bergman (Svk) 11. CCM proposal process ( ), Ulrik Møller (Edk) 12. Coffee break ( ) 13. Second round of questions and answers ( )
4 Main deliveries of the Nordic CCM project A CCM for the Day Ahead (DA) and Intraday (ID) ID market in accordance to Guideline on Capacity Allocation and Congestion Management (CACM) The methodology is to be used by the industrialized Capacity Calculation (CC) tool to be developed by the Regional Security Centre (RSC) Either a Flow Based or a Coordinated Net Transfer Capacity (CNTC) methodology Prototype Capacity Calculation tool(s) to test the methodology on real market data Market simulations and parallel runs Management of the National Regulatory Agencies (NRA) CCM proposal process Consultation document (Supporting document) Stakeholder consultation NRA proposal for CCM (Legal document) Support the RSC with "Domain expertise" in the tooling phase Capacity Calculation (CC) experts Specify domain requirements for the RSCs CC tool
5 Organizational structure Regional Group Nordic (RGN) Steering committee One member from each TSO Convener: Søren Dupond Kristensen Market Steering Group (MSG) Convener team Project Manager: Trond Jensen Operational Reference Group Convener: Jan Hystad IT-Support Convener: Martin Julander Work Group 1 CCM Methodology FB & CNTC Convener: Nils Ræder Work Group 2 CCM Methodology CNTC Convener: Heini Ruohosenmaa Work Group 3 Welfare Economics Convener: Mårten Bergman Work Group 4 CCM Proposal Convener: Ulrik Møller
6 Agenda 1. Coffee ( ) 2. Welcome, objective and agenda ( ), Trond Jensen (Statnett) 3. NordREG presentation ( ), Johan Roupe (EI) 4. Nordic CCM project and timeline ( ), Trond Jensen (Statnett) 5. Coffee ( ) 6. Nordic FB and CNTC methodologies ( ), Nils Flaten Ræder (Statnett) and Heini Ruohosenmaa (Fingrid) 7. Market results ( ), Mårten Bergman (Svk) 8. First round of questions and answers ( ) 9. Lunch ( ) 10. Market information platform and market information tool ( ), Mårten Bergman (Svk) 11. CCM proposal process ( ), Ulrik Møller (Edk) 12. Coffee break ( ) 13. Second round of questions and answers ( )
7 Agenda 1. Coffee ( ) 2. Welcome, objective and agenda ( ), Trond Jensen (Statnett) 3. NordREG presentation ( ), Johan Roupe (EI) 4. Nordic CCM project and timeline ( ), Trond Jensen (Statnett) 5. Coffee ( ) 6. Nordic FB and CNTC methodologies ( ), Nils Flaten Ræder (Statnett) and Heini Ruohosenmaa (Fingrid) 7. Market results ( ), Mårten Bergman (Svk) 8. First round of questions and answers ( ) 9. Lunch ( ) 10. Market information platform and market information tool ( ), Mårten Bergman (Svk) 11. CCM proposal process ( ), Ulrik Møller (Edk) 12. Coffee break ( ) 13. Second round of questions and answers ( )


8 A brief history of the Nordic CCM project Today 18 Sept. CCM proposal 2010/ Internal TSO phase External communication Stakeholder Forums Stakeholder Group News letters Info platform FB experiments FB Capacity Calculation and market simulations CNTC Calculation and simulations SN Flow Based Project Nordic Flow Based Project Nordic CCM Project Asses the FB concept Asses literature & practice Develop ideas Prefeasibility study Project development Model studies Market assessments Work shops Feasibility study Methodology and technical requirements for a Nordic FB Prototype development FB capacity calculation and market simulation experiments Stakeholder communication Pre-implementation phase Capacity calculation and market simulations Welfare analyses Infrastructure development (IT platforms) Stakeholder processes CCM proposal process CNTC development DA DA and ID
9 High Level Status WP Convener Status Project Management team Trond Jensen Stakeholder and NRA communication (Stakeholder Group, Forums and information platform, News Letters) IT infrastructure (Secure FTP, CCM server) Link to other projects (Common Grid Model Project, Regional Security Centre project) Work Group 1 Nils Ræder FB and CNTC methodologies are developed FB and CNTC prototype tools are developed (CNTC not fully adjusted yet) Intraday CNTC Methodology is being developed FB capacity calculation and market simulation is ongoing CNTC capacity calculation and market simulation is ongoing Work Group 2 Work Group 3 Work Group 4 Heini Ruohosenmaa Mårten Bergman Ulrik Møller Alternative CNTC methodology and prototype tools is in development DA market welfare analyses FB vs NTC is ongoing DA market welfare analyses FB vs CNTC is ongoing CCM proposal Currently working on a supporting document Planning for the internal TSO consultation Preparing for the market consultation Legal proposal document to be done later in the process
10 Related Activities CCM Project High-Level CCM Project Roadmap Sept 18: Submission of CCM proposal to NRAs March 18: NRA Decision Q3: Nordic DA CCM operationalized Q1-Q2: Go-live DA CCM Q4: Go-live ID CCM Today Oct 16 Sept 17 CCM proposal Develop operational procedures Q1/18 Q3/19 Jan 16 Dec 17 Cap calc & Market sim. Public parallel runs Q1/18 Q4/19 Q3/18 Q3/20 Develop operational tools and go-live Intraday 2016 Dec 17 CGM D-2 Q1/17 Q4/17 Each TSO develops CNE process RSC develops industrialized DA tool Q1 18 Q4 18 CGM ID Q1 19 Q4 20 RSC develops industrialized ID tool
11 Agenda 1. Coffee ( ) 2. Welcome, objective and agenda ( ), Trond Jensen (Statnett) 3. NordREG presentation ( ), Johan Roupe (EI) 4. Nordic CCM project and timeline ( ), Trond Jensen (Statnett) 5. Coffee ( ) 6. Nordic FB and CNTC methodologies ( ), Nils Flaten Ræder (Statnett) and Heini Ruohosenmaa (Fingrid) 7. Market results ( ), Mårten Bergman (Svk) 8. First round of questions and answers ( ) 9. Lunch ( ) 10. Market information platform and market information tool ( ), Mårten Bergman (Svk) 11. CCM proposal process ( ), Ulrik Møller (Edk) 12. Coffee break ( ) 13. Second round of questions and answers ( )
12 Agenda 1. Coffee ( ) 2. Welcome, objective and agenda ( ), Trond Jensen (Statnett) 3. NordREG presentation ( ), Johan Roupe (EI) 4. Nordic CCM project and timeline ( ), Trond Jensen (Statnett) 5. Coffee ( ) 6. Nordic FB and CNTC methodologies ( ), Nils Flaten Ræder (Statnett) and Heini Ruohosenmaa (Fingrid) 7. Market results ( ), Mårten Bergman (Svk) 8. First round of questions and answers ( ) 9. Lunch ( ) 10. Market information platform and market information tool ( ), Mårten Bergman (Svk) 11. CCM proposal process ( ), Ulrik Møller (Edk) 12. Coffee break ( ) 13. Second round of questions and answers ( )

13 Why capacity restrictions? The electrical grid has a limited capacity for transporting power Try transferring too much power, and the system is at risk of collapse Capacity restrictions are necessary to ensure stable electricity supply with high quality Capacity restrictions are only one of the tools employed by the TSOs to ensure operational security

14 Capacity calculation? Only essential information is preserved, the amount and complexity of information is greatly reduced A detailed model of the electricity system, with forecasted system state and information on transmission constraints Capacity calculation process Simplified transmission constraints that can be used by the electricity market
15 Scope of the Capacity Calculation Methodology Scope of CCM The CCM covers capacities for both the dayahead and intraday market The market capacities can be formulated as either flow-based parameters (FB) or coordinated net transmission capacities (CNTC) Simplification of grid model Calculation of available capacity Reliability margins Generator shift keys FB CNTC OR To power exchanges for price calculations Both FB and CNTC must respect the same underlying grid constraints, much of the calculation can be common to both approaches The calculation process will consider updated forecasts until the last possible moment Common grid model (CGM) of the electricity system with forecasted system state Grid constraints Available remedial actions Input from the TSOs
 and rules for changing these characteristics during the capacity calculation process The CGM is built up of the TSOs' Individual Grid Models: 'individual grid model means a data set")
16 The Common Grid Model Defined in CACM: common grid model means a Union-wide data set agreed between various TSOs describing the main characteristic of the power system (generation, loads and grid topology) and rules for changing these characteristics during the capacity calculation process The CGM is built up of the TSOs' Individual Grid Models: 'individual grid model means a data set describing power system characteristics (generation, load and grid topology) and related rules to change these characteristics during capacity calculation, prepared by the responsible TSOs, to be merged with other individual grid model components in order to create the common grid model
17 Simplifications made in the capacity calculation Nodes aggregated into bidding zones Almost all load and generation have a unique impact on the flows in the transmission system The difference in impact is not considered by the market coupling All market parties in the same area are considered to have equal impacts Each node have weigh according to the generation shift keys (GSK) Linearization of interdependencies in the modelled electricity system There are complex relationships between the net position of the bidding zones, and the loading of a transmission constraint A more simplified approximation is found This linearization is required by the price calculation algorithms Loading of a transmission constraint A B C The bidding zone contain numerous nodes Export position of a bidding zone
18 Flow-based or Coordinated net transmission capacity The TSOs will provide either FB or CNTC to each of the dayahead and intraday markets Both FB and CNTC are sets of linear transmission constraints provided by the TSOs to the day-ahead and intraday markets Both FB and CNTC are based on the same input data The requirements that all relevant transmission constraints shall be respected is the same Both require the model of the electricity system to be simplified Mathematically speaking the difference between the approaches is small FB considers all bidding zones to be interconnected, and provides the market with information on transit flows CNTC treats all bidding zone borders as independent conduits for commercial exchange
19 Transit flows Contract paths vs physical paths 0.1 % Power exchange between two bidding zones will follow all available paths in the grid 20 % 12 % 0.1 % Much of the power will pass through other bidding zones these are transit flows 8 % 12 % The presence of transit flows means that a trade between two bidding zones will impact all transmission constraints in the region 0 % 0.7 % 0.7 % 0.7 % 24 % 56 % 24 % 24 % The maximum commercial exchange that can be allowed between two bidding zones is therefore dependent on all other commercial exchanges in the region
 67 % 33 % C Flow-based Transmission constraint Available margin Impact from A Impact from B Impact from C A -> B 1000 MW 33 % - 33 % 0 Load B -> C 1000 MW")
20 Example market capacities Coordinated net transmission capacities Generation A Simple system with three bidding zones B Border A -> B B -> C A -> C Max exchange 750 MW 750 MW 750 MW These are the power transfer distribution factors (PTDF) 67 % 33 % C Flow-based Transmission constraint Available margin Impact from A Impact from B Impact from C A -> B 1000 MW 33 % - 33 % 0 Load B -> C 1000 MW 33 % 67 % 0 A -> C 1000 MW 67 % 33 % 0
21 impact on scheduled flow DK1-DE DK1-SE3 DK1-NO2 DK1-DK2 DK2-DE DK2-SE4 FIN-EE FIN-SE3 FIN-NO4 FIN-SE1 NO1-NO2 NO1-NO3 NO1-NO5 NO1-SE3 NO2-NL NO2-NO5 NO3-NO4 NO3-NO5 NO3-SE2 NO4-SE1 NO4-SE2 SE1-SE2 SE2-SE3 SE3-SE4 SE4-DE SE4-LT SE4-PL The PTDF describe the interdependency between border flows Commercial exchange between areas DK1-DE DK1-SE DK1-NO DK1-DK DK2-DE DK2-SE FIN-EE FIN-SE FIN-NO FIN-SE NO1-NO NO1-NO NO1-NO NO1-SE NO2-NL NO2-NO NO3-NO NO3-NO NO3-SE NO4-SE NO4-SE SE1-SE SE2-SE SE3-SE SE4-DE SE4-LT SE4-PL The table show how a commercial exchange between two areas production in one and consumption in the other create flows on the bidding zone borders The checkered area shows that the Norwegian and Swedish grids are highly interconnected Any trades that would change the net positions in these areas create transit flows on multiple borders There is not a one-to-one relationship between commercial exchange and power flow
22 impact on scheduled flow impact on scheduled flow DK1-DE DK1-SE3 DK1-NO2 DK1-DK2 DK2-DE DK2-SE4 FIN-EE FIN-SE3 FIN-NO4 FIN-SE1 NO1-NO2 NO1-NO3 NO1-NO5 NO1-SE3 NO2-NL NO2-NO5 NO3-NO4 NO3-NO5 NO3-SE2 NO4-SE1 NO4-SE2 SE1-SE2 SE2-SE3 SE3-SE4 SE4-DE SE4-LT SE4-PL DK1-DE DK1-SE3 DK1-NO2 DK1-DK2 DK2-DE DK2-SE4 FIN-EE FIN-SE3 FIN-NO4 FIN-SE1 NO1-NO2 NO1-NO3 NO1-NO5 NO1-SE3 NO2-NL NO2-NO5 NO3-NO4 NO3-NO5 NO3-SE2 NO4-SE1 NO4-SE2 SE1-SE2 SE2-SE3 SE3-SE4 SE4-DE SE4-LT SE4-PL The interdependencies between the bidding zone borders are not considered in CNTC Commercial exchange between areas Commercial exchange between areas DK1-DE DK1-SE DK1-NO Flow-based DK1-DK DK2-DE DK2-SE FIN-EE FIN-SE FIN-NO FIN-SE NO1-NO NO1-NO NO1-NO NO1-SE NO2-NL NO2-NO NO3-NO NO3-NO NO3-SE NO4-SE NO4-SE SE1-SE SE2-SE SE3-SE SE4-DE SE4-LT SE4-PL DK1-DE DK1-SE DK1-NO CNTC DK1-DK DK2-DE DK2-SE FIN-EE FIN-SE FIN-NO FIN-SE NO1-NO NO1-NO NO1-NO NO1-SE NO2-NL NO2-NO NO3-NO NO3-NO NO3-SE NO4-SE NO4-SE SE1-SE SE2-SE SE3-SE SE4-DE SE4-LT SE4-PL
23 More or less capacity with FB compared to CNTC? The aim of the capacity calculation is to provide capacities that create the best possible dispatch All loads covered Minimizing production costs Avoiding risks to operational security Forecasted system state Export position of area A Export position of area B FB is a more flexible approach compared to CNTC The "solution space" for FB can form almost any shape The "solution space" for CNTC is limited by the requirement that all bidding zone borders are considered independently Black line: real limit of system security
24 More or less capacity with FB compared to CNTC? The aim of the capacity calculation is to provide capacities that create the best possible dispatch All loads covered Minimizing production costs Avoiding risks to operational security Forecasted system state Export position of area A FB Export position of area B FB is a more flexible approach compared to CNTC The "solution space" for FB can form almost any shape The "solution space" for CNTC is limited by the requirement that all bidding zone borders are considered independently Black line: real limit of system security
25 More or less capacity with FB compared to CNTC? The aim of the capacity calculation is to provide capacities that create the best possible dispatch All loads covered Minimizing production costs Avoiding risks to operational security Forecasted system state Export position of area A FB CNTC Export position of area B FB is a more flexible approach compared to CNTC The "solution space" for FB can form almost any shape The "solution space" for CNTC is limited by the requirement that all bidding zone borders are considered independently Black line: real limit of system security
26 Are internal grid constraints limiting cross-border trade? Few grid constraints are at the geographic border The location of grid constraints determined by the total system state: grid topology, loads and generation We don't want to change the bidding zone configuration hour-by-hour Constraints inside bidding areas mainly affected by cross-border trade FB doesn't "move" the congestions at all, the PTDFs provide accurate information on how each area impact the constraints CNTC makes a choice on which cross-border trades can be allocated the capacity of the constraint, constraint still mainly affected by cross border trade Grid constraints not highly affected by cross border trade not included in capacity calculation Constraints instead handled by costly remedial actions (Non-costly remedial actions already included in the capacity calculation)
27 Can we have FB day-ahead and CNTC intraday? The planned continuous intraday market cannot use FB initially There will be a new capacity calculation for the intraday market Based on an updated common grid model Not only the "remainder" from the day-ahead market as today Result of the day-ahead market Export position of area A FB The concern is that there will be limited capacity available for intraday FB is a more flexible approach The FB net positions from day-ahead may put the system in a "corner" where it's there's limited options to create secure CNTCs This is due to more capacity being made available for the day-ahead market Reasons/options that mitigate this risk: Reduced uncertainty at the intraday stage TSOs can expand the CNTC space where it's unlikely to be used will free up initial capacity without significant impact on operational security CNTC can be continuously recalculated CNTC Export position of area B
28 Reduced uncertainty in the intraday time-frame Reduced uncertainty means there may be more capacity available initially TSOs can expand the CNTC space where it's likely to be used, free up initial capacity CNTC can be continuously recalculated, making new capacity available in the desired direction Export position of area A FB CNTC Export position of area B
29 Discard grid constraints unlikely to be binding in the market outcome Reduced uncertainty means there may be more capacity available initially TSOs can expand the CNTC space where it's likely to be used, free up initial capacity CNTC can be continuously recalculated, making new capacity available in the desired direction Export position of area A FB CNTC Export position of area B
30 Continuous recalculation of CNTC Reduced uncertainty means there may be more capacity available initially TSOs can expand the CNTC space where it's likely to be used, free up initial capacity CNTC can be continuously recalculated, making new capacity available in the desired direction Export position of area A FB CNTC Export position of area B
31 Impact on price forecasts and bids No impact on bid format Bids still specified by volume and price per area in all markets More hour-to-hour variation in available capacity Both FB and CNTC will better reflect the constantly varying state of the power system compared to current NTC FB will provide information on available capacity in a new format PTDF and RAM contain much more information than NTC/CNTC May impact the tools and methods used for predicting future prices FB will provide more, but smaller price differences Prices not caused by congested borders, instead caused by congested grid constraints All areas receive a price relative to the area's specific impact on the grid constraints Coordinated net transmission capacity A -> B B -> C A -> C Flow-based Max exchange 750 MW 750 MW 750 MW Available margin Area A Area B Area C A -> B % - 33 % 0 B -> C % 67 % 0 A -> C % 33 % 0

32 Prototype capacity calculation and market simulations The Nordic CCM project have developed a set of prototype tools for coordinated capacity calculation We are currently calculating flow-based parameters, and doing market simulations CNTC market simulations just starting, but the CNTC method needs refinements on the rules for efficiently sharing capacity on the borders Data quality remains an issue Mostly related to the prototype common grid model which is created specifically for this use Quality will improve as soon as the real common grid model is in place Market simulations are conducted using the same algorithm and bid lists used for the day-ahead market
33 Calculation of maximum exchanges on bidding zone borders Aim to automate TTC calculations Calculations based on basic AC load flow and dynamic simulations Method and tool to calculate maximum exchanges has been developed and tested using SE1-FI border as an example Tool calculates maximum technical capacities for import and export directions individually bidding zone border by border taking into account following items GSKs Contingencies Operational security limits The same calculation approach can be used to calculate F max values in the FB approach, and cross-zonal capacities in the CNTC
34 Capacity calculation tool Input data CGM GSKs Contingencies and other rules Operational security limits (thermal limits, voltage limits, frequency and damping limits) Load flow analysis Dynamic stability analysis Maximum cross-zonal capacity
35 Other steps in CNTC calculation process adjusting maximum power exchange using remedial actions applying rules for avoiding undue discrimination between internal and cross-zonal exchanges applying rules for efficiently sharing power flow capabilities of different CNEs among different bidding zone borders taking into account reliability margin and previously allocated crosszonal capacity cross-zonal capacities to be given to the market
36 Agenda 1. Coffee ( ) 2. Welcome, objective and agenda ( ), Trond Jensen (Statnett) 3. NordREG presentation ( ), Johan Roupe (EI) 4. Nordic CCM project and timeline ( ), Trond Jensen (Statnett) 5. Coffee ( ) 6. Nordic FB and CNTC methodologies ( ), Nils Flaten Ræder (Statnett) and Heini Ruohosenmaa (Fingrid) 7. Market results ( ), Mårten Bergman (Svk) 8. First round of questions and answers ( ) 9. Lunch ( ) 10. Market information platform and market information tool ( ), Mårten Bergman (Svk) 11. CCM proposal process ( ), Ulrik Møller (Edk) 12. Coffee break ( ) 13. Second round of questions and answers ( )
37 Disclaimers Prototype tools/process Prototype tools have been used for the simulations Flow Reliability Margins (FRM) are not included Some known difficulties with the Danish CNE definitions in the first half of 2016 Although operators are consulted in the review stage, they are not personally involved in the FB capacity calculation process yet Some of the hours (~6 %) in the FB results lacks FB parameters these hours are replaced with NTC values Prototype Common grid model The grid models used are not yet the target models. Indeed those are in the process of being implemented. The quality of the grid models is the best we can have at this moment in time; they do not allow for dynamic analysis and detailed voltage/reactive power analysis though. Merging software for creating the CGM from the IGMs evolves over time. Improvements made for the later weeks have not been applied for the earlier ones Market simulations The market simulations are done in the European Power Exchanges Simulation Facility by using historical order books Limited to the Central Northern European market Critical Network Element (CNE) selection (review and possible removal of non-significantly impacted CNEs) has not been implemented at this stage yet
38 Objective function of the Price coupling Euphemia Same price coupling algorithm in both FB and NTC MAX Welfare = Consumer surplus Producer surplus Congestion revenue Example of an exchange from a low price area to a high price area Subject to constraints
![SEW per Stakeholder [MEUR] Total [keur] SEW per Stakeholder [MEUR] Total [keur] Welfare economic results for Weeks 2-5, 7-8, 14-17, 41-46 80 60 40 20 0-20 -40-60 Nordic socio-economic welfare, FB](/docs-images/71/65564142/images/39-0.jpg "compared to NTC Nordic 7,000 5,000 3,000 1,000-1,000-3,000-5,000 On an annualized basis the welfare in FB is 12 M larger than in NTC -80-7,000 Congestion rent Producer surplus Consumer surplus Total")
39 SEW per Stakeholder [MEUR] Total [keur] SEW per Stakeholder [MEUR] Total [keur] Welfare economic results for Weeks 2-5, 7-8, 14-17, Nordic socio-economic welfare, FB compared to NTC Nordic 7,000 5,000 3,000 1,000-1,000-3,000-5,000 On an annualized basis the welfare in FB is 12 M larger than in NTC -80-7,000 Congestion rent Producer surplus Consumer surplus Total Nordic socio-economic welfare per week, FB compared to NTC ,200 1, ,000-1,200 Congestion rent Producer surplus Consumer surplus Total
40 Average prices in all Nordic bidding zones 1,0 0,5 0,0-0,5-1,0-1,5 40 0,8 Difference FB-NTC 0,1 Nordic DK1 DK2 FIN NO1 NO2 NO3 NO4 NO5 SE1 SE2 SE3 SE4-0,4-0,5-0,4-0,4-0,3-0,5-0,7-0,9-0,9-1,2 Average prices in the bidding zones 0, NTC FB Nordic DK1 DK2 FIN NO1 NO2 NO3 NO4 NO5 SE1 SE2 SE3 SE4
41 Nordic net position per week 2-5, 7-8, 14-17, and average Net Position, [GWh/week] NTC FB Average Nordic net position (GWh) NTC FB
42 Economic gain VS grid overloads The figure shows how the hourly FB results compare to the NTC market outcome The horizontal axis show the impact on expected grid overloads The vertical axis show the socio-economic impact The TSO choice of which CNEs to include in the market coupling will determine the balance between better grid security, and improved economic outcome Results in this quadrant have both worse economic results and larger grid overloads in FB than in NTC Results in this quadrant have both better economic results and lower grid overloads in FB than in NTC


43 FB vs CNTC vs NTC: single hour from week 42 FB CNTC NTC
44 FB vs CNTC vs NTC: single hour from week 42 CNTC 17 FB 20 Welfare compared to NTC (k )
45 Agenda 1. Coffee ( ) 2. Welcome, objective and agenda ( ), Trond Jensen (Statnett) 3. NordREG presentation ( ), Johan Roupe (EI) 4. Nordic CCM project and timeline ( ), Trond Jensen (Statnett) 5. Coffee ( ) 6. Nordic FB and CNTC methodologies ( ), Nils Flaten Ræder (Statnett) and Heini Ruohosenmaa (Fingrid) 7. Market results ( ), Mårten Bergman (Svk) 8. First round of questions and answers ( ) 9. Lunch ( ) 10. Market information platform and market information tool ( ), Mårten Bergman (Svk) 11. CCM proposal process ( ), Ulrik Møller (Edk) 12. Coffee break ( ) 13. Second round of questions and answers ( )
46 Agenda 1. Coffee ( ) 2. Welcome, objective and agenda ( ), Trond Jensen (Statnett) 3. NordREG presentation ( ), Johan Roupe (EI) 4. Nordic CCM project and timeline ( ), Trond Jensen (Statnett) 5. Coffee ( ) 6. Nordic FB and CNTC methodologies ( ), Nils Flaten Ræder (Statnett) and Heini Ruohosenmaa (Fingrid) 7. Market results ( ), Mårten Bergman (Svk) 8. First round of questions and answers ( ) 9. Lunch ( ) 10. Market information platform and market information tool ( ), Mårten Bergman (Svk) 11. CCM proposal process ( ), Ulrik Møller (Edk) 12. Coffee break ( ) 13. Second round of questions and answers ( )
47 Agenda 1. Coffee ( ) 2. Welcome, objective and agenda ( ), Trond Jensen (Statnett) 3. NordREG presentation ( ), Johan Roupe (EI) 4. Nordic CCM project and timeline ( ), Trond Jensen (Statnett) 5. Coffee ( ) 6. Nordic FB and CNTC methodologies ( ), Nils Flaten Ræder (Statnett) and Heini Ruohosenmaa (Fingrid) 7. Market results ( ), Mårten Bergman (Svk) 8. First round of questions and answers ( ) 9. Lunch ( ) 10. Market information platform and market information tool ( ), Mårten Bergman (Svk) 11. CCM proposal process ( ), Ulrik Møller (Edk) 12. Coffee break ( ) 13. Second round of questions and answers ( )
48 Agenda 1. Coffee ( ) 2. Welcome, objective and agenda ( ), Trond Jensen (Statnett) 3. NordREG presentation ( ), Johan Roupe (EI) 4. Nordic CCM project and timeline ( ), Trond Jensen (Statnett) 5. Coffee ( ) 6. Nordic FB and CNTC methodologies ( ), Nils Flaten Ræder (Statnett) and Heini Ruohosenmaa (Fingrid) 7. Market results ( ), Mårten Bergman (Svk) 8. First round of questions and answers ( ) 9. Lunch ( ) 10. Market information platform and market information tool ( ), Mårten Bergman (Svk) 11. CCM proposal process ( ), Ulrik Møller (Edk) 12. Coffee break ( ) 13. Second round of questions and answers ( )

49 Interfaces External Stakeholders Stakeholder Group Group with nominated members from industry and NRAs Detailed discussions and exchanges Stakeholder Forum Open for all stakeholders Broader information forums Stakeholder Newsletter 1 issued in issues/year from 2017 Stakeholder Information Platform Web platform for information exchange Open for all stakeholders Interactive discussion forum
50 Information Platform Stakeholder Information Platform Web platform for information exchange Open for all stakeholders Interactive discussion forum To gain access: Send mail to: Subject: User registration NCCM SH info platform Content: Name, & Telephone
51 The Nordic Capacity Calculation Methodology (CCM) project Stakeholder Information Tool CCM Stakeholder Forum Stockholm 8 February 2017
52 Stakeholder Tool Tool for examining the effect on flows/possible net positions from PTDFs CNEs are fully anonymized randomized numbering This is a first draft comments/suggestions are welcome
53 Stakeholder tool
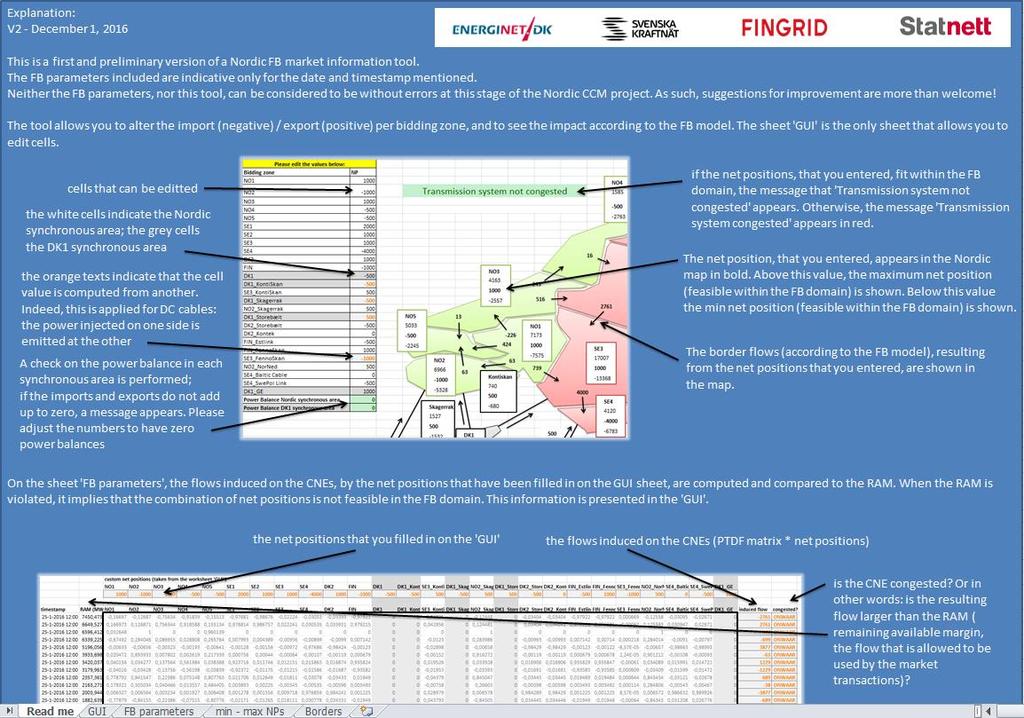
54 GUI - Test feasible net positions cells that can be editted the white cells indicate the Nordic synchronous area; the grey cells the DK1 synchronous area the orange texts indicate that the cell value is computed from another. Indeed, this is applied for DC cables: the power injected on one side is emitted at the other A check on the power balance in each synchronous area is performed;

55 GUI - Test feasible net positions If the net positions, that you entered, fit within the FB domain, the message that 'Transmission system not congested' appears. Otherwise, the message 'Transmission system congested' appears in red. The net position, that you entered, appears in the Nordic map in bold. Above this value, the maximum net position (feasible within the FB domain) is shown. Below this value the min net position (feasible within the FB domain) is shown. The border flows (according to the FB model), resulting from the net positions that you entered, are shown in the map.

")


56 FB parameters the net positions that you filled in on the 'GUI' the flows induced on the CNEs (PTDF matrix * net positions) the PTDF factors of the CNEs is the CNE congested? Or in other words: is the resulting flow larger than the RAM ( remaining available margin, the flow that is allowed to be used by the market transactions)?
57 Min/Max Net Positions & Border Flows The tool includes information on Min/Max Net Position per bidding zone Not simultaneously feasible The border flows (according to the FB model), resulting from the net positions that you entered, are computed. Those values are presented in the 'GUI'
58 Agenda 1. Coffee ( ) 2. Welcome, objective and agenda ( ), Trond Jensen (Statnett) 3. NordREG presentation ( ), Johan Roupe (EI) 4. Nordic CCM project and timeline ( ), Trond Jensen (Statnett) 5. Coffee ( ) 6. Nordic FB and CNTC methodologies ( ), Nils Flaten Ræder (Statnett) and Heini Ruohosenmaa (Fingrid) 7. Market results ( ), Mårten Bergman (Svk) 8. First round of questions and answers ( ) 9. Lunch ( ) 10. Market information platform and market information tool ( ), Mårten Bergman (Svk) 11. CCM proposal process ( ), Ulrik Møller (Edk) 12. Coffee break ( ) 13. Second round of questions and answers ( )
59 Timeline for the NRA proposal Stakeholder Forum Feb 8 Workshop (Stakeholder Forum) Apr 19 Stakeholder Forum Sep 7 Submission of final CCM proposal to NRAs Sep 18 Sep Nov 2017 Mar May Jul Sep 2017 Today Sep 1 - Feb 21 Develop supporting document Feb 22 - Mar 28 Apr 3 - May 15 Apr 3 - Jun 30 Internal TSO consultation and approval of proposed CCM Public consultation Jul 3 - Aug 18 Jul 1 - Aug 15 Develop the legal CCM proposal (legally-binding document) Aug 21 - Sep 18 Internal TSO consultation Holiday period Finalization of the CCM proposal
60 Content of the supporting document and the CCM proposal Art 21 Legal document: The proposal for a CCM shall (at least) include Supporting document: Proposed methodology and impact assessment Art 21.1.A Methodologies for the calculation of input to the CC Methodologies for: i. Determine Reliability Margins ii. Determine Operational Security Limits ii. Determine Contingencies ii. Determine Allocation Constraints iii. Determine GSK iv. Determine Remedial Actions to be used Art 21.1.B Description of the applied CCM A Mathematical description of the i. Applied CCM with different inputs v. FB: The calculation of PTDFs and RAMs Rules for: ii. Avoiding undue discrimination iii. Previously allocated Cross Zonal capacity iv. Applying Remedial Actions to adjust flow on CNEs vi. CNTC: Calculating Cross Zonal capacity and efficiently sharing CNE cap on Bidding Zone Borders vii. Efficiently sharing CNE cap on different CCRs when relevant 21.1.A Methodologies for the calculation of input to the CC 21.1.B Description of the applied CCM Art 21.1.C Methodology for validation of Cross Zonal capacity Art 21.2 Frequency for updating ID capacity Art 21.3 Fall-back procedure Art 9.9 Proposed timeline for implementation Description of the alternative CCM Comparison FB/CNTC/NTC Impacts on other markets Bidding zone delimitation Non-intuitive flows Art 21.1.C Methodology for validation of Cross Zonal capacity Art 9.9 Description of the expected impact on the objective Congestion Income Distribution (if FB) Art 21.2 Frequency for updating ID capacity Art 21.3 Fall-back procedure Transparency Art 9.9. Proposed timeline for implementation Art 9.9 Description of the expected impact on the objective Long-term investment decisions
61 Agenda 1. Coffee ( ) 2. Welcome, objective and agenda ( ), Trond Jensen (Statnett) 3. NordREG presentation ( ), Johan Roupe (EI) 4. Nordic CCM project and timeline ( ), Trond Jensen (Statnett) 5. Coffee ( ) 6. Nordic FB and CNTC methodologies ( ), Nils Flaten Ræder (Statnett) and Heini Ruohosenmaa (Fingrid) 7. Market results ( ), Mårten Bergman (Svk) 8. First round of questions and answers ( ) 9. Lunch ( ) 10. Market information platform and market information tool ( ), Mårten Bergman (Svk) 11. CCM proposal process ( ), Ulrik Møller (Edk) 12. Coffee break ( ) 13. Second round of questions and answers ( )
62 Agenda 1. Coffee ( ) 2. Welcome, objective and agenda ( ), Trond Jensen (Statnett) 3. NordREG presentation ( ), Johan Roupe (EI) 4. Nordic CCM project and timeline ( ), Trond Jensen (Statnett) 5. Coffee ( ) 6. Nordic FB and CNTC methodologies ( ), Nils Flaten Ræder (Statnett) and Heini Ruohosenmaa (Fingrid) 7. Market results ( ), Mårten Bergman (Svk) 8. First round of questions and answers ( ) 9. Lunch ( ) 10. Market information platform and market information tool ( ), Mårten Bergman (Svk) 11. CCM proposal process ( ), Ulrik Møller (Edk) 12. Coffee break ( ) 13. Second round of questions and answers ( )

63 FB vs NTC: single hour from week 41 The Nordic welfare is 3k better in FB than in NTC The total market welfare is 7k better in FB than in NTC For the week as a whole Nordic gain is 600k, and the market wide gain is 1M
The Nordic Capacity Calculation Methodology (CCM) project Stakeholder Forum. Arlanda Stockholm Airport 11 December 2018
 project Stakeholder Forum. Arlanda Stockholm Airport 11 December 2018") The Nordic Capacity Calculation Methodology (CCM) project Stakeholder Forum Arlanda Skycity @ Stockholm Airport 11 December 2018 Table of Contents 1 2 3 4 5 6 7 8 Status update of the CCM project, DA/ID
The Nordic Capacity Calculation Methodology (CCM) project Stakeholder Forum Arlanda Skycity @ Stockholm Airport 11 December 2018 Table of Contents 1 2 3 4 5 6 7 8 Status update of the CCM project, DA/ID
Status of the CWE Flow Based Market Coupling Project
 Commissie voor de Regulering van de Elektriciteit en het Gas Commission pour la Régulation de l Electricité et du Gaz Status of the CWE Flow Based Market Coupling Project Joint NordREG / Nordic TSO workshop
Flow- based Market Coupling: Implementa9on of the CWE FB Project. Andrew Claxton APX Co- Chair, CWE Steering Commi5ee
 Flow- based Market Coupling: Implementa9on of the CWE FB Project Andrew Claxton APX Co- Chair, CWE Steering Commi5ee 1 Themes! Introduction to Flow-based idea! Update on progress: the Parallel Run! Key
EBS IT Meeting July 2016
 EBS IT Meeting 18 19 July 2016 Conference Call Details Conference call: UK Numbers Tel: 0808 238 9819 or Tel: 0207 950 1251 Participant code: 4834 7876... Join online meeting https://meet.nationalgrid.com/antonio.delcastillozas/hq507d31
Chapter 5. Transmission networks and electricity markets
 Chapter 5. Transmission networks and electricity markets 1 Introduction In most of the regions of the world: assumptions that electrical energy can be traded as if all generators were connected to the
CAISO Participating Intermittent Resource Program for Wind Generation
 CAISO Participating Intermittent Resource Program for Wind Generation Jim Blatchford CAISO Account Manager Agenda CAISO Market Concepts Wind Availability in California How State Supports Intermittent Resources
SOLAR POWER FORECASTING BASED ON NUMERICAL WEATHER PREDICTION, SATELLITE DATA, AND POWER MEASUREMENTS
 BASED ON NUMERICAL WEATHER PREDICTION, SATELLITE DATA, AND POWER MEASUREMENTS Detlev Heinemann, Elke Lorenz Energy Meteorology Group, Institute of Physics, Oldenburg University Workshop on Forecasting,
EUROPEAN EXPERIENCE: Large-scale cross-country forecasting with the help of Ensemble Forecasts
 WEPROG Weather & wind Energy PROGnoses EUROPEAN EXPERIENCE: Large-scale cross-country forecasting with the help of Ensemble Forecasts Session 6: Integrating forecasting into market operation, the EMS and
GRIPs. Overview Andrea Ćirlićová Business Area Manager, System Development
 GRIPs Overview 2013 Andrea Ćirlićová Business Area Manager, System Development 6 th TYNDP Workshop, Brussels -- 15 November 2012 GRIPs GRIPs are the regional interlink between Union-wide TYNDP and national
Derogation Criteria for the Requirements for Generators Network Code
 Derogation Criteria for the Requirements for Generators Network Code Decision Paper Reference: CER/17/084 Date Published: 13/04/2017 Closing Date: 0 Executive Summary Commission Regulation (EU) 2016/631
2018 Project Prioritization and Budgeting Process
 2018 Prioritization and Budgeting Process Brian Hurysz Manager, Market Products Budget and Priorities Working Group August 18, 2017, Krey Corporate Center Agenda 2018 Prioritization Process Prioritization
2018 Annual Review of Availability Assessment Hours
 2018 Annual Review of Availability Assessment Hours Amber Motley Manager, Short Term Forecasting Clyde Loutan Principal, Renewable Energy Integration Karl Meeusen Senior Advisor, Infrastructure & Regulatory
Public data underlying the figures of Annual Report on the Results of Monitoring the Internal Electricity and Natural Gas Markets in 2015
 Public data underlying the figures of Annual Report on the Results of Monitoring the Internal Electricity and Natural Gas Markets in 2015 Electricity Wholesale Market Volume January 2017 Legal notice This
Winter Season Resource Adequacy Analysis Status Report
 Winter Season Resource Adequacy Analysis Status Report Tom Falin Director Resource Adequacy Planning Markets & Reliability Committee October 26, 2017 Winter Risk Winter Season Resource Adequacy and Capacity
wind power forecasts
 wind power forecasts the user friendly forecast studio about aiolos users Aiolos is Vitec s market-leading tool for effective management for all of your forecasts. With Aiolos it is possible to predict
Short-Term Demand Forecasting Methodology for Scheduling and Dispatch
 Short-Term Demand Forecasting Methodology for Scheduling and Dispatch V1.0 March 2018 Table of Contents 1 Introduction... 3 2 Historical Jurisdictional Demand Data... 3 3 EMS Demand Forecast... 4 3.1 Manual
GAMINGRE 8/1/ of 7
 FYE 09/30/92 JULY 92 0.00 254,550.00 0.00 0 0 0 0 0 0 0 0 0 254,550.00 0.00 0.00 0.00 0.00 254,550.00 AUG 10,616,710.31 5,299.95 845,656.83 84,565.68 61,084.86 23,480.82 339,734.73 135,893.89 67,946.95
1 Descriptions of Function
 Wide-Area Wind Generation Forecasting 1 Descriptions of Function All prior work (intellectual property of the company or individual) or proprietary (non-publicly available) work should be so noted. 1.1
Demand Estimation Sub-Committee. Seasonal Normal Review - Updated. 17 th December 2014
 Demand Estimation Sub-Committee Seasonal Normal Review - Updated 17 th December 2014 1 2 Introduction Seasonal Normal is the gas industry benchmark of what constitutes "typical" weather conditions, and
Malawi Education Sector Improvement Project (MESIP) (P154185)
 (P154185)") Public Disclosure Authorized AFRICA Malawi Education Global Practice Recipient Executed Activities Investment Project Financing FY 2017 Seq No: 5 ARCHIVED on 13-Nov-2018 ISR34470 Implementing Agencies:
Public Disclosure Authorized AFRICA Malawi Education Global Practice Recipient Executed Activities Investment Project Financing FY 2017 Seq No: 5 ARCHIVED on 13-Nov-2018 ISR34470 Implementing Agencies:
Wind power and management of the electric system. EWEA Wind Power Forecasting 2015 Leuven, BELGIUM - 02/10/2015
 Wind power and management of the electric system EWEA Wind Power Forecasting 2015 Leuven, BELGIUM - 02/10/2015 HOW WIND ENERGY IS TAKEN INTO ACCOUNT WHEN MANAGING ELECTRICITY TRANSMISSION SYSTEM IN FRANCE?
Outage Coordination and Business Practices
 Outage Coordination and Business Practices 1 2007 Objectives What drove the need for developing a planning/coordination process. Why outage planning/coordination is crucial and important. Determining what
Integrated Electricity Demand and Price Forecasting
 Integrated Electricity Demand and Price Forecasting Create and Evaluate Forecasting Models The many interrelated factors which influence demand for electricity cannot be directly modeled by closed-form
Weekly Operational Constraints Update
 Weekly Operational Constraints Update Applicable from 19 November 2018 to 25 November 2018 (Week 47) 16 November 2018 Disclaimer EirGrid plc, the Transmission System Operator (TSO) for Ireland, and SONI
peak half-hourly New South Wales
 Forecasting long-term peak half-hourly electricity demand for New South Wales Dr Shu Fan B.S., M.S., Ph.D. Professor Rob J Hyndman B.Sc. (Hons), Ph.D., A.Stat. Business & Economic Forecasting Unit Report
Transmission capacity allocation in zonal electricity markets
 Transmission capacity allocation in zonal electricity markets Anthony Papavasiliou (UC Louvain) Collaborators: Ignacio Aravena (LLNL), Yves Smeers (UC Louvain) Workshop on Flexible Operation and Advanced
The DC Optimal Power Flow
 1 / 20 The DC Optimal Power Flow Quantitative Energy Economics Anthony Papavasiliou The DC Optimal Power Flow 2 / 20 1 The OPF Using PTDFs 2 The OPF Using Reactance 3 / 20 Transmission Constraints Lines
SMART GRID FORECASTING
 SMART GRID FORECASTING AND FINANCIAL ANALYTICS Itron Forecasting Brown Bag December 11, 2012 PLEASE REMEMBER» Phones are Muted: In order to help this session run smoothly, your phones are muted.» Full
NSP Electric - Minnesota Annual Report Peak Demand and Annual Electric Consumption Forecast
 Page 1 of 5 7610.0320 - Forecast Methodology NSP Electric - Minnesota Annual Report Peak Demand and Annual Electric Consumption Forecast OVERALL METHODOLOGICAL FRAMEWORK Xcel Energy prepared its forecast
2017 Settlement Calendar for ASX Cash Market Products ASX SETTLEMENT
 2017 Settlement Calendar for ASX Cash Market Products ASX SETTLEMENT Settlement Calendar for ASX Cash Market Products 1 ASX Settlement Pty Limited (ASX Settlement) operates a trade date plus two Business
2019 Settlement Calendar for ASX Cash Market Products. ASX Settlement
 2019 Settlement Calendar for ASX Cash Market Products ASX Settlement Settlement Calendar for ASX Cash Market Products 1 ASX Settlement Pty Limited (ASX Settlement) operates a trade date plus two Business
FORECASTING OF WIND GENERATION The wind power of tomorrow on your screen today!
 FORECASTING OF WIND GENERATION The wind power of tomorrow on your screen today! Pierre Pinson 1, Gregor Giebel 2 and Henrik Madsen 1 1 Technical University of Denmark, Denmark Dpt. of Informatics and Mathematical
Power situation Sweden, english text
 , english text Estimated inflow in Sweden (not spill corrected) 1%, median and 9% probability 196-216 TWh/week 7 6 5 4 3 Past 6 weeks Prior period 1 resp 9% probability, 196-216 2 1 Apr Jun Aug Oct Dec
Bringing Renewables to the Grid. John Dumas Director Wholesale Market Operations ERCOT
 Bringing Renewables to the Grid John Dumas Director Wholesale Market Operations ERCOT 2011 Summer Seminar August 2, 2011 Quick Overview of ERCOT The ERCOT Market covers ~85% of Texas overall power usage
Energy System Modelling Summer Semester 2018, Lecture 7
 Energy System Modelling Summer Semester 2018, Lecture 7 Dr. Tom Brown, tom.brown@kit.edu, https://nworbmot.org/ Karlsruhe Institute of Technology (KIT), Institute for Automation and Applied Informatics
Statement of indicative wholesale water charges and charges scheme
 Statement of indicative wholesale water charges and charges scheme 2019-2020 South Staffs Water and Cambridge Water Indicative Wholesale Charges Scheme Since April 2017, eligible business customers have
Introduction to Forecasting
 Introduction to Forecasting Introduction to Forecasting Predicting the future Not an exact science but instead consists of a set of statistical tools and techniques that are supported by human judgment
Multivariate Regression Model Results
 Updated: August, 0 Page of Multivariate Regression Model Results 4 5 6 7 8 This exhibit provides the results of the load model forecast discussed in Schedule. Included is the forecast of short term system
In Centre, Online Classroom Live and Online Classroom Programme Prices
 In Centre, and Online Classroom Programme Prices In Centre Online Classroom Foundation Certificate Bookkeeping Transactions 430 325 300 Bookkeeping Controls 320 245 225 Elements of Costing 320 245 225
Terms of Reference for the Comparative Environmental Review (CER) of. Options for the Mactaquac Project, Mactaquac, New Brunswick
 of. Options for the Mactaquac Project, Mactaquac, New Brunswick") Terms of Reference for the Comparative Environmental Review (CER) of Options for the Mactaquac Project, Mactaquac, New Brunswick Preamble The New Brunswick Power Corporation ( NB Power ) operates the Mactaquac
Terms of Reference for the Comparative Environmental Review (CER) of Options for the Mactaquac Project, Mactaquac, New Brunswick Preamble The New Brunswick Power Corporation ( NB Power ) operates the Mactaquac
Published by ASX Settlement Pty Limited A.B.N Settlement Calendar for ASX Cash Market Products
 Published by Pty Limited A.B.N. 49 008 504 532 2012 Calendar for Cash Market Products Calendar for Cash Market Products¹ Pty Limited ( ) operates a trade date plus three Business (T+3) settlement discipline
Implementation Status & Results Africa RCIP3 - Regional Communications Infrastructure Program - Phase 3 (P111432)
") Public Disclosure Authorized Public Disclosure Authorized The World Bank Implementation Status & Results Africa RCIP3 - Regional Communications Infrastructure Program - Phase 3 (P111432) Operation Name:
Public Disclosure Authorized Public Disclosure Authorized The World Bank Implementation Status & Results Africa RCIP3 - Regional Communications Infrastructure Program - Phase 3 (P111432) Operation Name:
FINAL REPORT EVALUATION REVIEW OF TVA'S LOAD FORECAST RISK
 Memorandum from the Office of the Inspector General Robert Irvin, WT 9C-K FINAL REPORT EVALUATION 2012-14507 REVIEW OF TVA'S LOAD FORECAST RISK As part of a series of reviews to evaluate the Tennessee
SYSTEM BRIEF DAILY SUMMARY
 SYSTEM BRIEF DAILY SUMMARY * ANNUAL MaxTemp NEL (MWH) Hr Ending Hr Ending LOAD (PEAK HOURS 7:00 AM TO 10:00 PM MON-SAT) ENERGY (MWH) INCREMENTAL COST DAY DATE Civic TOTAL MAXIMUM @Max MINIMUM @Min FACTOR
peak half-hourly Tasmania
 Forecasting long-term peak half-hourly electricity demand for Tasmania Dr Shu Fan B.S., M.S., Ph.D. Professor Rob J Hyndman B.Sc. (Hons), Ph.D., A.Stat. Business & Economic Forecasting Unit Report for
STATISTICAL FORECASTING and SEASONALITY (M. E. Ippolito; )
") STATISTICAL FORECASTING and SEASONALITY (M. E. Ippolito; 10-6-13) PART I OVERVIEW The following discussion expands upon exponential smoothing and seasonality as presented in Chapter 11, Forecasting, in
STATISTICAL FORECASTING and SEASONALITY (M. E. Ippolito; 10-6-13) PART I OVERVIEW The following discussion expands upon exponential smoothing and seasonality as presented in Chapter 11, Forecasting, in
= observed volume on day l for bin j = base volume in jth bin, and = residual error, assumed independent with mean zero.
 QB research September 4, 06 Page -Minute Bin Volume Forecast Model Overview In response to strong client demand, Quantitative Brokers (QB) has developed a new algorithm called Closer that specifically
IMPROVING THE ACCURACY OF RUNWAY ALLOCATION IN AIRCRAFT NOISE PREDICTION
 IMPROVING THE ACCURACY OF RUNWAY ALLOCATION IN AIRCRAFT NOISE PREDICTION David G. Southgate and Jonathan P. Firth Aviation Operations, Dept of Transport and Regional Services (DOTARS), Canberra, Australia
Infrastructure for Spatial Information in Europe (INSPIRE)
") Infrastructure for Spatial Information in Europe (INSPIRE) 2011 GISCO Working Party 8-9.3.2012 INSPIRE is about improving access to spatial information: the environment doesn t stop at borders EU Geoportal
Infrastructure for Spatial Information in Europe (INSPIRE) 2011 GISCO Working Party 8-9.3.2012 INSPIRE is about improving access to spatial information: the environment doesn t stop at borders EU Geoportal
A Model for a Zonal Operating Reserve Demand Curve
 A Model for a Zonal Operating Reserve Demand Curve Yen-Yu Lee Electrical and Computer Engineering University of Texas at Austin March 5, Outline What is operating reserves? Why do we need elastic reserves
Corn Basis Information By Tennessee Crop Reporting District
 UT EXTENSION THE UNIVERSITY OF TENNESSEE INSTITUTE OF AGRICULTURE AE 05-13 Corn Basis Information By Tennessee Crop Reporting District 1994-2003 Delton C. Gerloff, Professor The University of Tennessee
Wind Rules and Forecasting Project Update Market Issues Working Group 12/14/2007
 Wind Rules and Forecasting Project Update Market Issues Working Group 12/14/2007 Background Over the past 3 MIWG meetings, NYISO has discussed a methodology for forecasting wind generation in the NYCA
Tutorial 2: Modelling Transmission
 Tutorial 2: Modelling Transmission In our previous example the load and generation were at the same bus. In this tutorial we will see how to model the transmission of power from one bus to another. The
Virginia Basis Tables for Corn, Soybeans, and Wheat
 VIRGINIA POL VTECHNIC INSTn U 11~. UNIVERSITY LIBRARIES Agricultural and Applied Economics Virginia Basis Tables for Corn, Soybeans, and Wheat David E. Kenyon* Introduction Futures prices determined at
Joint procurement of natural gas for grid operation
 Joint procurement of natural gas for grid operation Slide www.aggm.at 1 Joint procurement of natural gas for grid operation AGGM 19. November 2014 1. General information 2. Procurement Slide 2 Joint procurement
March 5, British Columbia Utilities Commission 6 th Floor, 900 Howe Street Vancouver, BC V6Z 2N3
 Tom A. Loski Chief Regulatory Officer March 5, 2010 British Columbia Utilities Commission 6 th Floor, 900 Howe Street Vancouver, BC V6Z 2N3 16705 Fraser Highway Surrey, B.C. V4N 0E8 Tel: (604) 592-7464
Maritime Spatial Planning: Transboundary Cooperation in the Celtic Seas Looking Ahead
 Maritime Spatial Planning: Transboundary Cooperation in the Celtic Seas Looking Ahead Looking ahead MSP in the context of the European Maritime and Fisheries Fund (EMFF) and beyond SIMCelt Final Conference
The Copernicus Climate Change (C3) service: State of play
 service: State of play") Enterprise and Industry The Copernicus Climate Change (C3) service: State of play B. Pinty (a) & J-N. Thépaut (b) (a) Copernicus G.2 unit (b) ECMWF CCI October2014 Legal frame & MS consultations Publica6on
Enterprise and Industry The Copernicus Climate Change (C3) service: State of play B. Pinty (a) & J-N. Thépaut (b) (a) Copernicus G.2 unit (b) ECMWF CCI October2014 Legal frame & MS consultations Publica6on
Baltic regional gas market study Final Report. 8 th April 2016
 Baltic regional gas market study Final Report 8 th April 2016 Table of contents Executive summary Introduction Regional model development Approach to market design development Market design requirements
A Merchant Mechanism for Electricity Transmission Expansion
 A Merchant Mechanism for Electricity Transmission Expansion Tarjei Kristiansen, Norwegian University of Science and Technology. Tarjei.Kristiansen@elkraft.ntnu.no Juan Rosellon, Harvard University/CIDE.
SHORT TERM LOAD FORECASTING
 Indian Institute of Technology Kanpur (IITK) and Indian Energy Exchange (IEX) are delighted to announce Training Program on "Power Procurement Strategy and Power Exchanges" 28-30 July, 2014 SHORT TERM
International Workshop on Wind Energy Development Cairo, Egypt. ERCOT Wind Experience
 International Workshop on Wind Energy Development Cairo, Egypt ERCOT Wind Experience March 22, 21 Joel Mickey Direcr of Grid Operations Electric Reliability Council of Texas jmickey@ercot.com ERCOT 2 2
P278 Treatment of Transmission Losses for Interconnector Users
 Stage 03: Attachment A: for What stage is this document in the process? Treatment of Transmission Losses for Interconnector Users Contents 1 Workgroup s Detailed Analysis 2 2 Calculation of TLMO + and
Presented By Quarterly Public Meeting February 22, 2012
 West Valley Phase 1 Studies Update Presented By Quarterly Public Meeting February 22, 2012 Agenda Status of Erosion PAS Status of Climate Change Workshop Status of ISP Looking Ahead Near - Term Timeline
elgian energ imports are managed using forecasting software to increase overall network e 칁 cienc.
 Elia linemen install Ampacimon real time sensors that will communicate with the dynamic thermal ratings software to control energy import levels over this transmission line. OV RH AD TRAN MI ION D namic
Colorado PUC E-Filings System
 Attachment A.1 RES Summary Colorado PUC E-Filings System Total RECs Acquired Non-Distributed Generation Distributed Generation Retail Distributed Generation Carry Forward Previous Carry Forward Total Carry
Aviation Weather. Segment Three - Concept of Operations and Requirements. Federal Aviation Administration
 Aviation Weather Segment Three - Concept of Operations and Requirements Presented to: Panel: Friends/Partners in Aviation Weather Vision Forum Richard Heuwinkel, Kevin Johnston, Leo Prusak, and Joe Sherry
Software Tools: Congestion Management
 Software Tools: Congestion Management Tom Qi Zhang, PhD CompuSharp Inc. (408) 910-3698 Email: zhangqi@ieee.org October 16, 2004 IEEE PES-SF Workshop on Congestion Management Contents Congestion Management
The World Bank Haiti Business Development and Investment Project (P123974)
") Public Disclosure Authorized LATIN AMERICA AND CARIBBEAN Haiti Trade & Competitiveness Global Practice IBRD/IDA Specific Investment Loan FY 2013 Seq No: 9 ARCHIVED on 29-Dec-2016 ISR26542 Implementing
Public Disclosure Authorized LATIN AMERICA AND CARIBBEAN Haiti Trade & Competitiveness Global Practice IBRD/IDA Specific Investment Loan FY 2013 Seq No: 9 ARCHIVED on 29-Dec-2016 ISR26542 Implementing
Wind Power Capacity Assessment
 Wind Power Capacity Assessment Mary Johannis, BPA, representing Northwest Resource Adequacy Forum Northwest Wind Integration Forum Technical Working Group October 29,2009 March 2007 NW Wind Integration
CIMA Professional 2018
 CIMA Professional 2018 Interactive Timetable Version 16.25 Information last updated 06/08/18 Please note: Information and dates in this timetable are subject to change. A better way of learning that s
ACCA Interactive Timetable
 ACCA Interactive Timetable 2018 Professional Version 7.1 Information last updated 15th May 2018 Please note: Information and dates in this timetable are subject to change. A better way of learning that
Application of Monte Carlo Simulation to Multi-Area Reliability Calculations. The NARP Model
 Application of Monte Carlo Simulation to Multi-Area Reliability Calculations The NARP Model Any power system reliability model using Monte Carlo simulation consists of at least the following steps: 1.
Public Disclosure Copy
 Public Disclosure Authorized AFRICA Africa Trade & Competitiveness Global Practice IBRD/IDA Investment Project Financing FY 2016 Seq No: 5 ARCHIVED on 22-Dec-2017 ISR30985 Public Disclosure Authorized
CIMA Professional
 CIMA Professional 201819 Birmingham Interactive Timetable Version 3.1 Information last updated 12/10/18 Please note: Information and dates in this timetable are subject to change. A better way of learning
CIMA Professional
 CIMA Professional 201819 Manchester Interactive Timetable Version 3.1 Information last updated 12/10/18 Please note: Information and dates in this timetable are subject to change. A better way of learning
FIAR & Enterprise Risk Management (ERM)
") FIAR & Enterprise Risk Management (ERM) Update Brief to the SCESC October 24, 2017 1 BLUF -> Integration of FIAR Remediation Requirement: OSD Mgmt/Tracking Material Weaknesses (MW) Identified in Component
FIAR & Enterprise Risk Management (ERM) Update Brief to the SCESC October 24, 2017 1 BLUF -> Integration of FIAR Remediation Requirement: OSD Mgmt/Tracking Material Weaknesses (MW) Identified in Component
CIMA Dates and Prices Online Classroom Live September August 2016
 CIMA Dates and Prices Online Classroom Live September 2015 - August 2016 This document provides detail of the programmes that are being offered for the Objective Tests and Integrated Case Study Exams from
This introduction is intended for compliance officers at Protection Seller and Broker-Advisor firms
 weatherxchange - a platform which facilitates index-based weather risk transfer This introduction is intended for compliance officers at Protection Seller and Broker-Advisor firms Introduction Launched
Public Disclosure Copy
 Public Disclosure Authorized SOUTH ASIA Nepal Agriculture Global Practice IBRD/IDA Investment Project Financing FY 2008 Seq No: 23 ARCHIVED on 26-Jul-2018 ISR33099 Implementing Agencies: Poverty Alleviation
CIMA Professional 2018
 CIMA Professional 2018 Newcastle Interactive Timetable Version 10.20 Information last updated 12/06/18 Please note: Information and dates in this timetable are subject to change. A better way of learning
Sluggish Economy Puts Pinch on Manufacturing Technology Orders
 Updated Release: June 13, 2016 Contact: Penny Brown, AMT, 703-827-5275 pbrown@amtonline.org Sluggish Economy Puts Pinch on Manufacturing Technology Orders Manufacturing technology orders for were down
The World Bank Haiti Business Development and Investment Project (P123974)
") Public Disclosure Authorized LATIN AMERICA AND CARIBBEAN Haiti Trade & Competitiveness Global Practice IBRD/IDA Specific Investment Loan FY 2013 Seq No: 10 ARCHIVED on 06-Jul-2017 ISR27112 Implementing
Public Disclosure Authorized LATIN AMERICA AND CARIBBEAN Haiti Trade & Competitiveness Global Practice IBRD/IDA Specific Investment Loan FY 2013 Seq No: 10 ARCHIVED on 06-Jul-2017 ISR27112 Implementing
Colorado PUC E-Filings System
 Colorado PUC E-Filings System Attachment A.1 RES Summary Total Acquired Non-Distributed Generation Distributed Generation Retail Distributed Generation Carry Forward Previous Carry Forward Total Carry
Monthly Trading Report Trading Date: Dec Monthly Trading Report December 2017
 Trading Date: Dec 7 Monthly Trading Report December 7 Trading Date: Dec 7 Figure : December 7 (% change over previous month) % Major Market Indicators 5 4 Figure : Summary of Trading Data USEP () Daily
SYSTEM BRIEF DAILY SUMMARY
 SYSTEM BRIEF DAILY SUMMARY * ANNUAL MaxTemp NEL (MWH) Hr Ending Hr Ending LOAD (PEAK HOURS 7:00 AM TO 10:00 PM MON-SAT) ENERGY (MWH) INCREMENTAL COST DAY DATE Civic TOTAL MAXIMUM @Max MINIMUM @Min FACTOR
Folsom Dam Water Control Manual Update Joint Federal Project, Folsom Dam
 Folsom Dam Water Control Manual Update Joint Federal Project, Folsom Dam Public Workshop May 28, 2015 Library Galleria 828 I Street, Sacramento, CA US Army Corps of Engineers BUILDING STRONG WELCOME &
Conclusions and further thoughts on changes within ESTEP as preparation for the broader discussion within ESTEP
 European Steel Technology Platform Avenue de Cortenbergh, 172 B-1000 Brussels Belgium T +32 (2) 738 79 47 F+32 (2) 738 79 56 klaus.peters@estep.eu http://cordis.europa.eu/estep/ Klaus Peters, SG ESTEP
Report with data for system behaviour at storm passage with original (uncoordinated) and coordinated control Deliverable nº: 12.2.
 and coordinated control Deliverable nº: 12.2.") Report with data for system behaviour at storm passage with original (uncoordinated) and coordinated control Deliverable nº: 12.2 EC-GA nº 249812 Project full title: Transmission system operation with
Report with data for system behaviour at storm passage with original (uncoordinated) and coordinated control Deliverable nº: 12.2 EC-GA nº 249812 Project full title: Transmission system operation with
Euro-indicators Working Group
 Euro-indicators Working Group Luxembourg, 9 th & 10 th June 2011 Item 9.4 of the Agenda New developments in EuroMIND estimates Rosa Ruggeri Cannata Doc 309/11 What is EuroMIND? EuroMIND is a Monthly INDicator
Alberto Troccoli, Head of Weather and Energy Research Unit, CSIRO, Australia ICCS 2013 Jamaica, 5 December 2013 (remotely, unfortunately)
") 013 Alberto Troccoli, Head of Weather and Energy Research Unit, CSIRO, Australia ICCS 013 Jamaica, 5 December 013 (remotely, unfortunately) Historical and projected changes in World primary energy demand
013 Alberto Troccoli, Head of Weather and Energy Research Unit, CSIRO, Australia ICCS 013 Jamaica, 5 December 013 (remotely, unfortunately) Historical and projected changes in World primary energy demand
The World Bank India: Bihar Integrated Social Protection Strengthening Project (P118826)
") Public Disclosure Authorized SOUTH ASIA India Social Protection & Labor Global Practice IBRD/IDA Investment Project Financing FY 2014 Seq No: 5 ARCHIVED on 13-May-2016 ISR23158 Implementing Agencies: Rural
Public Disclosure Authorized SOUTH ASIA India Social Protection & Labor Global Practice IBRD/IDA Investment Project Financing FY 2014 Seq No: 5 ARCHIVED on 13-May-2016 ISR23158 Implementing Agencies: Rural
Welcome Survey getting to know you Collect & log Supplies received Classroom Rules Curriculum overview. 1 : Aug 810. (3 days) 2nd: Aug (5 days)
 2nd: Aug (5 days)") 1st Quarter (41Days) st 1 : Aug 810 (3 days) 2nd: Aug 13-17 Reporting Categories (TEKS SEs) Skill Create and write a postcard about your favorite community activity Review 2nd Grade Vocabulary Chapter
1st Quarter (41Days) st 1 : Aug 810 (3 days) 2nd: Aug 13-17 Reporting Categories (TEKS SEs) Skill Create and write a postcard about your favorite community activity Review 2nd Grade Vocabulary Chapter
Forecasting without Fear
 Forecasting without Fear How to keep the business informed and keep your cool NY SPIN December 15, 2015 Drivers, Challenges why you have to forecast, and why it s not easy what you forecast Refinement
Economic and Social Council
 United Nations Economic and Social Council Distr.: General 18 July 2016 Original: English Committee of Experts on Global Geospatial Information Management Sixth session New York, 3-5 August 2016 Item 2
Monthly Trading Report July 2018
 Monthly Trading Report July 218 Figure 1: July 218 (% change over previous month) % Major Market Indicators 2 2 4 USEP Forecasted Demand CCGT/Cogen/Trigen Supply ST Supply Figure 2: Summary of Trading
Renewables and the Smart Grid. Trip Doggett President & CEO Electric Reliability Council of Texas
 Renewables and the Smart Grid Trip Doggett President & CEO Electric Reliability Council of Texas North American Interconnected Grids The ERCOT Region is one of 3 North American grid interconnections. The
Management of the GB System Overnight
 Management of the GB System Overnight Place your chosen image here. The four corners must just cover the arrow tips. For covers, the three pictures should be the same size and in a straight line. Sam Matthews
MONTE CARLO SIMULATION RISK ANALYSIS AND ITS APPLICATION IN MODELLING THE INCLEMENT WEATHER FOR PROGRAMMING CIVIL ENGINEERING PROJECTS
 MONTE CARLO SIMULATION RISK ANALYSIS AND ITS APPLICATION IN MODELLING THE INCLEMENT WEATHER FOR PROGRAMMING CIVIL ENGINEERING PROJECTS Pedram Daneshmand Associate Director Blue Visions Management (bluevisions)
ACCA Interactive Timetable & Fees
 ACCA Interactive Timetable & Fees 2018/19 Professional Version 2.1 Information last updated uary 2019 Please note: Information and dates in this timetable are subject to change. A better way of learning